Abstract
Development is the eternal theme of the times. However, the transformation of the development mode is imminent, and we should abandon the extensive economic development mode and turn to the efficient development of an intensive mode. The high-tech industry will be the decisive force in future industrial development. The agglomeration of the industry will help form economies of scale, thereby improving the effective allocation of resources and promoting productivity. The increase in green economy efficiency is a key factor in achieving green development and an important indicator of achieving the coordinated development of economic development and environmental protection. Therefore, in this study, we try to improve the efficiency of the green economy through industrial agglomeration to achieve green development. In order to solve this problem, we took the Yangtze River Economic Belt as the research object, used Super Slacks-based Measure (SBM) data envelopment analysis (DEA) and general algebraic modeling system (GAMS) to study the green economy efficiency, and then used the system generalized moment method (SGMM) to study the impact of high-tech industry agglomeration on green economy efficiency. According to the empirical test, we found that (1) the green economy efficiency of the Yangtze River Economic Belt shows a volatile upward trend, (2) the green economy efficiency of the Yangtze River Economic Belt differs with time and by region, (3) the agglomeration of the high-tech industry has a lagging effect on the improvement of green economy efficiency, and (4) the regression coefficients of economic development and foreign direct investment are positive and those of environmental regulation and urbanization are negative. Finally, in this paper, we provide corresponding policy recommendations to promote the agglomeration of high-tech industries, thereby improving the efficiency of the green economy.
1. Introduction
The development of the global social economy progressed with the deepening of the industrial revolution. The three industrial revolutions markedly changed the shape of social and economic development and people’s living conditions. In the wave of the third industrial revolution, the high-tech industry became the pillar industry of the national economy and a transformative force for economic and social development. Smart cities, mobile payments, high-speed railways, the low-carbon economy, and green development are now synonymous with social and economic development in the new era [1]. The Outline for the Development of the Yangtze River Economic Belt was officially issued in September 2016, proposing the innovation drive to promote industrial transformation, as well as the upgrading and construction of green ecological corridors, as the two key tasks for the development of the Yangtze River Economic Belt in China [2]. High-tech industries improve resource and energy use through technological innovation. They are lightly polluting industries with environmentally friendly and resource-saving features [3]. Moderate industrial agglomeration could lead the region to undergo intensive and large-scale development, which is necessary for green development. Therefore, the accumulation of high-tech industries has an inherent impact on the efficiency of the green economy. Innovation-driven industry transformation and upgrading must vigorously develop high-tech industries and reduce energy consumption through the development of high-tech industries, thus establishing an intensive, green, and low-carbon ecological corridor. Based on the above analysis, in this study, we examined the impact of the high-tech industry development model, mainly industrial agglomeration, on the efficiency of the green economy.
High-tech industry refers to the industrial cluster that produces high-tech products with modern cutting-edge technology. In January 2019, the actual use of foreign capital in China’s high-tech industry increased by 40.9% on an annual basis. The actual use of foreign capital in the technology service industry was 15.77 billion Chinese yuan (CNY), representing an annual increase of 113.4% [4]. In 2018, the added value of high-tech manufacturing increased by 11.7%, accounting for 13.9% of the added value of industrial enterprises above a designated size, industrial investment increased by 14.9% over the previous year; technological transformation investment increased by 12.8%, and smart television (TV) production reached 113.76 million units, an increase of 17.7%. Computer, communications, and other electronic equipment manufacturing grew by 13.1%, and the value added of information transmission, software, and information technology services increased by 30.7% [5]. According to data from the General Administration of Customs of China, the export of high-tech products increased by 10.6% in 2017, and the growth rate was 18% faster than that of 2016 [6]. In terms of new energy vehicles, China’s new energy vehicle production in 2011 was 8000 units, but increased to 794,000 units in 2017 [7,8] (Figure 1). The data show that the high-tech industry has a fast development speed and great development potential, and will become the main driving force for future economic development and upgrading. High-tech industries will change the existing industry formats, such as reducing the demand for natural resources by increasing resource utilization, reducing environmental damage through circular economy, and reducing the consumption of fossil energy by using clean energy, to improve the development efficiency of green economy.
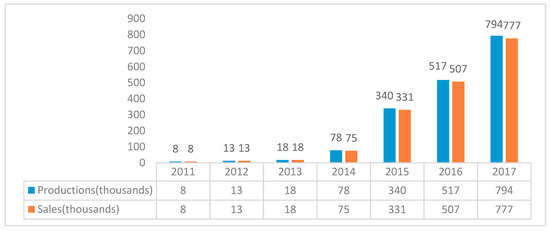
Figure 1.
China’s new energy vehicle production and sales.
The green economy is defined as an economy that aims to reduce environmental risks and ecological scarcities, and to achieve sustainable development without degrading the environment. It is closely related to ecological economics, but has a more politically applied focus [9,10]. It mainly includes the environmental protection, new energy, and clean production industries. Green economic efficiency is an important indicator of green development; it not only evaluates the use of factors in the production process from the perspective of traditional economic efficiency, but also considers economic growth, resource conservation, and ecological environment improvement [11]. According to the Climate Bonds Initiative, China’s green bonds issued in 2015 were seven billion CNY, and, in 2016, this figure grew to 161 billion CNY, surpassing Europe to rank second in the world [12]. According to the calculation of the People’s Bank of China, China’s green economy needs to invest about 3% of the gross domestic product (GDP) per year during the 13th Five-Year Plan period, with an annual average of over 2000 billion CNY. Among all green investments, government investment accounts for about 10% to 15%, and social capital accounts for about 85% to 90% [13] (Figure 2). Green development is not an option, but the only way for all human beings to share a decent life on this planet. Green development refers to promoting economic growth and development while ensuring that natural resources continue to provide the resources and environmental services on which humans depend. To achieve this, green growth must drive investment and innovation to support sustainable development and create new economic opportunities. These investments and innovations will be achieved mainly through the development of high-tech industries.
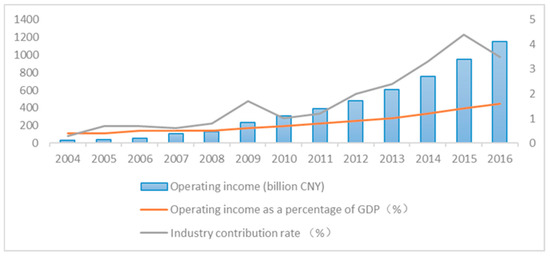
Figure 2.
China’s environmental protection industry development.
The Yangtze River Economic Belt covers 11 provinces and cities in Shanghai, Jiangsu, Zhejiang, Anhui, Jiangxi, Hubei, Hunan, Chongqing, Sichuan, Yunnan, and Guizhou. In 2017, the economic aggregate accounted for 43% of the national total, and the total financial resources accounted for 44% [14,15,16]. The high-tech industry in the Yangtze River Economic Belt developed rapidly. In 2016, the total profit and tax reached 630.4 billion CNY, indicating a 9.12% annual increase. There were 15,437 high-tech enterprises in in the Yangtze River Economic Belt, representing a 5.98% annual increase. The total profit was 47.14 billion CNY, signaling an annual increase of 22.23%, with 79,194 items in 2016, indicating an annual increase of 13.17%. The export delivery value was 2549.8 billion CNY, displaying an annual increase of 5.59%, and the fixed assets investment was 119.2 billion CNY, an annual increase of 17.69% (Figure 3) [17,18,19]. Promoting the development of the Yangtze River Economic Belt will help to produce gold benefits in the golden waterways. It is conducive to tapping the huge consumption potential contained in the hinterland of the Yangtze River, promoting the expansion of economic growth space from the coast to the inland, and narrowing the regional development gap in China. It is conducive to breaking the administrative division and market barriers, promoting the orderly and free flow of economic factors, improving resource allocation efficiency and market integration. In addition, it is conducive to optimizing the industrial structure and urbanization layout along the Yangtze River, building a new corridor for the two-way opening of the land and sea, and fostering new advantages in international economic cooperation and competition.
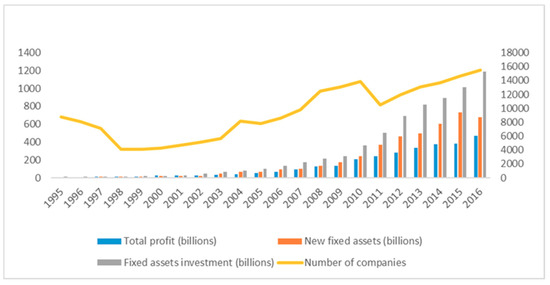
Figure 3.
Development of high-tech industries in the Yangtze River Economic Belt.
The remainder of this article is structured as follows: Section 2 provides a literature review, Section 3 outlines the model construction and variable selection, Section 4 discusses the impact of high-tech industrial agglomeration on the efficiency of green economy, and Section 5 provides our conclusions and recommendations.
2. Literature Review
In terms of the definition of high-tech industries, the Organization for Economic Co-operation and Development (OECD) uses the strength of research and development (R&D) to define and divide high-tech industries to enable international comparison [20]. Richard [21] thought that high-tech industries are industries that invest heavily in research and development, whereby technology advances rapidly. Merchant [22] stated that high-tech industries are industries with high R&D intensity. Alsleben [23] reported that economies of scale contribute to the formation of industrial agglomeration. As output increases, the average cost of production decreases. Tsvetkova et al. [24] stated that high-tech industries are based on high and new technology, engaged in the research, development, production, and technical services of one or more high-tech industries and their products. They are often difficult to develop, but once developed successfully, they have greater economic and social benefits than normal.
How can the concentration of high-tech industries be measured? The measurement method of the industrial agglomeration degree is continuously being developed and improved, mainly including the concentration rate, location entropy, Herfindahl index, and Elilsion and Glaeser (EG) index. Jiao et al. [25] used concentration as an auxiliary indicator for the analysis of the degree of manufacturing agglomeration and the concentration of China’s high-tech industries. Lyons and Luker [26] used the Herfindahl index to calculate Texas’s industrial spatial structure. Henderson [27] used the Herfindahl index to measure industrial diversification, and Duranton and Puga [28] used the reciprocal of the Herfindahl index as a measure of urban economic diversification. Rosenthal [29] applied the EG index to measure the spatial agglomeration of four-digit manufacturing in the United States. Barrios et al. [30] used the EG index in a study of the agglomeration changes in manufacturing in Ireland and Portugal from 1985 to 1998. Fan and Hu [31] applied the EG index to empirically study the trend in China’s manufacturing agglomeration and found that the degree of agglomeration is strongly related to the nature of the industry. Yang [32] used the EG index to measure the level of China’s high-tech industry agglomeration, supplemented by regression analysis, and stated that the spatial agglomeration of high-tech industries is highly positively correlated with industrial economic growth. The deep determinants of agglomeration are technological advancement and technological innovation.
What impact does industrial agglomeration have on green development? Cieslik and Ghodsi [33] believed that the agglomeration of high-tech industries promotes a competitive advantage in the green economy. Many enterprises are concentrated in a certain area, so that the division of labor between enterprises is highly specialized. Through division of labor and cooperation, production and transaction costs can be reduced, thereby improving production efficiency and enhancing competitive advantage. Zhang et al. [34] believed that the agglomeration of high-tech industries can enhance the innovative effects of green industries. The high-tech industry is an intellectually intensive industry with a strong innovation, and the green industry acquired the ability of technological innovation and continuous innovation through the accumulation of knowledge generated by agglomeration, thereby promoting the improvement of green economy benefits. Xie et al. [35] measured the impact of industrial agglomeration on the efficiency of green economy, mainly including economic and environmental aspects. From an economic point of view, industrial agglomeration may promote and be detrimental to economic growth. From an environmental point of view, industrial agglomeration may increase and reduce environmental pollution. It indicates that green development is more efficient if higher GDP output and less environmental pollution are obtained in the case of a fixed amount of energy consumption.
Based on a summary of the existing research, the high-tech industry invests more in research and development than traditional industries, and the wages paid to scientists and engineers are relatively high. Different from traditional industries, there are four characteristics of the high tech industries: (1) the development of high-tech industries lies in the rapid flow and integration of various resources; (2) the key elements of high-tech industries are intellectual resources rather than fixed assets; (3) the competitiveness of high-tech industries lies in technological innovation; (4) the ecological environment for high-tech industries is industrial cluster. In terms of research methods, scholars mainly studied the impact of high-tech industrial agglomeration on the efficiency of green economy through the location entropy, Herfindahl index, and EG index. Location entropy emerged as a simple and widely used indicator. A higher industrial location entropy means a comparative advantage in scale. The Herfindahl index is mostly used to study industry concentration and market structure. The EG index facilitates cross-industry, cross-country, and cross-time comparisons. When applied to comparative analysis, the index is not affected by the size of the industry and the accuracy of the geographic data. In addition, industrial agglomeration will have different effects on the efficiency of the green economy due to differences in regions and time.
3. Model Construction and Variable Selection
3.1. Model Construction
Drawing on Miller and Upadhyay’s [36] research, we moderately expanded and adopted the following production function form:
where i represents the region, t represents the year, Y represents the gross domestic product, whereas K, L, and E represent the amount of material capital input, labor input, and energy resource input, respectively, and Ait(·) is Hicks’ neutral technological progress. It refers to technical progress where, with any given factor proportions, the average and marginal products of all factors increase in the same proportion [37]. Based on Equation (1), the impact of high-tech industrial agglomeration (hia) on the efficiency of the green economy is introduced. Assuming that the Hicks efficiency term component in Equation (1) is multivariate, we get the following equation:
Substituting Equation (2) into Equation (1) and dividing it on both sides of the equation, the equation for green economy efficiency (GEE) is obtained as follows:
Equation (3) indicates that the green economy efficiency is determined by K, L, and E, and is affected by hia. Taking the natural logarithm of both sides of Equation (3), the green economic efficiency equation can be obtained as follows:
The first-order lag term GEEit−1 of the green economic efficiency is introduced into the model as an explanatory variable to analyze its inertial action and dynamic change. To test whether a crowding effect exists, based on Equation (4), the squared term after the logarithm of the industrial agglomeration value is introduced into the model as follows:
where GEEit represents the green economy efficiency, GEEit−1 represents the lag of the green economy efficiency, hiait represents high-tech industry agglomeration, Xit is a control variable, and α, β0, β1, β2, and γj are corresponding estimates, whereas υi and τt represent individual fixed effects and time fixed effects, respectively, and μit is a random interference term.
3.2. Examined Variables
3.2.1. Core Explanatory Variables
The degree of industrial agglomeration can be measured by the location entropy, Herfindahl index, and EG index. In comparison, location entropy can eliminate the scale difference between regions and more realistically reflect the spatial distribution of high-tech industries. Therefore, the location entropy is used to measure the level of industrial agglomeration as follows:
where eir indicates the number of employed people in the r region.
3.2.2. Control Variables
Environmental Regulation Strength (ER)
Studies showed that environmental regulation has a significant positive effect on the environmental efficiency [38], and the intensity of environmental regulation can be measured by the proportion of pollution control costs to the total industrial output. We used industrial pollution control to calculate the amount of investment divided by the total industrial output value to measure the intensity of environmental regulation.
Economic Development Level (EL)
Economic development provides the basis for R&D funding, environmental governance investment, and technological innovation. The GDP per capita is selected to measure the level of economic development. The year 2008 is the base year, and the actual value after conversion of the per capita GDP index is expressed. The data were obtained from the statistical yearbooks of various provinces and regions.
Foreign Direct Investment Level (FDI)
The FDI inflow may produce technology spillover effects, or may generate pollution transfer, forming a “pollution paradise”. The foreign investment level is obtained by calculating the FDI and GDP after the annual exchange rate conversion calculation. The data were obtained from the statistical yearbooks of various provinces and regions.
Urbanization Level (URB)
The city has technical advantages and scale effects in improving resource utilization and pollution control levels, and it is conducive to the improvement of green economy efficiency from the overall level. The urbanization level of each province is measured by the proportion of urban population to the total population at the end of the year. These indicators are shown in Table 1.

Table 1.
Indicators and data sources for industrial agglomeration calculations. GDP—gross domestic product; FDI—foreign direct investment level.
3.3. Evaluation Method
Common methods used for measuring economic efficiency include stochastic frontier analysis (SFA), the Solow residual method, and data envelopment analysis (DEA). SFA and the Solow residual method require strong assumptions about the random error term, which may lead to deviations in the estimated value. The DEA of the non-parametric estimation can avoid this situation.
The DEA method was proposed by Charnes [39] in 1978 to determine the relatively efficient production frontier by linear programming and statistical data, and to evaluate the multi-input by comparing the degree of deviation of the decision-making unit from the frontier surface. The method obtains the operating efficiency of each decision unit produced. DEA has the advantage of not having to set a specific function form in advance, and the weight is determined by the endogenous model. We used the Super-SBM DEA model created by Tone [40] to introduce the slack variable into the objective function, which solves the problem of effective sorting. In the Super-SBM DEA model, the decision unit set is I, and, for each decision unit i ∈ I, Yin is the n-th (n = 1, 2, 3, …, t) output of the i-th decision unit, Xim is the m-th (m = 1, 2, 3, …, s) input of the i-th decision-making unit, and λi is the weight of the i-th decision-making unit. The production set P\(X0, Y0) is replaced by a linear combination of all decision units (X, Y) except (X0, Y).
The efficiency value is defined as follows:
According to Equation (6), the improved efficiency value is defined as follows:
where , X > 0, and Y > 0.
Therefore, the Super-SMB DEA model is represented by the following linear form:
where , and .
The general algebraic modeling system (GAMS), developed by Meeraus and Brooke, is a high-level language interface (Figure 4) [41]. It was originally used to assist World Bank experts conduct a quantitative analysis of economic policy issues. Over time, GAMS evolved from solving linear programming problems only to solving linear programming problems and nonlinear programming problems. The GAMS model is composed of seven modules, including models, data, variables, initial values, equations, algorithms, and results.
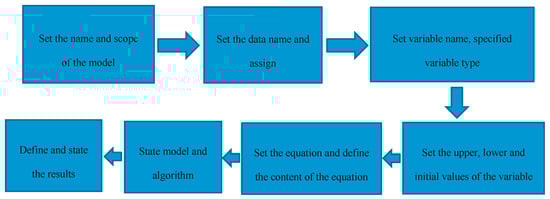
Figure 4.
The general algebraic modeling system (GAMS) schematic.
3.4. Indicators and Data
The input factors employed for measuring the green economy efficiency are physical capital, human capital, and resource energy, and the expected output is the regional GDP (Table 2) [42]. The undesired output indicators consist of industrial waste, industrial waste emissions, and industrial solid waste emissions. The physical capital input is measured by the capital stock, calculated by the perpetual inventory method, and the depreciation rate is 5% [43]. The fixed asset input indicators required for the calculation are replaced by the total amount of fixed assets, and the data were obtained from the China Statistical Yearbook [44]. Human capital investment is replaced by the number of employed people at the end of the year. The data were obtained from the statistical yearbooks of various provinces and regions. The energy input is measured by the total energy consumption after conversion to standard coal. The data were obtained from the China Energy Statistical Yearbook [45]. The GDP of the region is based on 2008 and is expressed by the actual value of the consumer price index of each locality. The data were obtained from the statistical yearbooks of various provinces and regions. The data of undesired output indicators were derived from the China Environmental Statistics Yearbook [17].
Table 2.
Indicators and data sources for green economic efficiency measurement. CNY—Chinese yuan.
4. Empirical Analysis
4.1. Yangtze River Economic Belt Green Economy Efficiency
GAMS is advanced modeling software used for mathematical planning and optimization. It can flexibly and efficiently build various types of models and support various mathematical models and solving methods [46]. GAMS is used to express complex models in a concise and popular computer language. It can easily, clearly, and safely model and express algebraic relationships [47]. The language is described independently of the algorithm. Users only need to input collections, data, variables, and equations, and they can directly obtain solutions using the built-in GAMS. Based on this, we use GAMS 22.4 to calculate the green development efficiency of the Yangtze River Economic Belt under the variable scale return assumption. We take Guangdong as a comparison object, but it does not belong to the Yangtze River Economic Belt area; thus, the data are removed from Table 3.
Table 3.
Green economy efficiency value of the Yangtze River Economic Belt in 2008–2017.
From the perspective of the Yangtze River Economic Belt as a whole, the green economy efficiency of the Yangtze River Economic Belt was volatile, rising from 0.732 in 2008 to 0.849 in 2017. In the years after 2008, the green economy efficiency declined, and only in 2013 did it return to the 2008 level. The main reason for this is that the global financial crisis in 2008 led to large fluctuations in the economy [48]. China issued four trillion CNY in response to this crisis. In the economic stimulus plan, most of these funds entered the field of infrastructure construction, and the primary risk faced by large-scale infrastructure construction was environmental pollution and waste of resources, which led to a continuous decline in the efficiency of the green economy. After 2012, the impact of the economic stimulus plan gradually subsided. The Chinese government proposed to vigorously promote the construction of ecological civilization, pay more attention to environmental protection and green development, and propose green development requirements for building a beautiful and sustainable China. Since then, the green development efficiency index of the Yangtze River Economic Belt continuously improved, as did the green economy efficiency.
From the perspective of the Yangtze River Economic Belt, the green development efficiency of the downstream areas of the Yangtze River Economic Belt was relatively high, followed by the midstream and upstream areas. Table 3 shows that the top three regions of the Yangtze River Economic Belt were in the downstream areas. The green economy efficiency in the midstream areas slightly fluctuated, and the green economy efficiency in the upstream areas was generally lagging. The downstream areas of the Yangtze River Economic Belt include Shanghai, Jiangsu, and Zhejiang. The region has superior geographical conditions and a high level of economic development. It was always the center of China’s economic development and has a high degree of development. The people are highly educated, have a strong sense of environmental protection, and social development is not limited to GDP. The concept of green development is deeply rooted in the hearts of the people. The midstream areas of the Yangtze River are mostly lakes and hills, except for Hubei, which was always a province with more developed agriculture. Industrial development is not prominent in the process of economic development; thus, environmental pollution is relatively low. However, due to the historical factors of the major agricultural provinces, the level of economic development is low and transformation was difficult; thus, the efficiency of green economy was relatively lower than that of downstream areas. The ecological environment in the upstream areas of the Yangtze River Economic Belt is fragile and the pressure on environmental protection is high. Historically, planting and animal husbandry were the main industries. More recently, with the development of tourism, the pace of regional economic development accelerated. However, due to the weak industrial base and unsuitability for large-scale development, the green economy is less efficient.
Judging from the provinces and cities of the Yangtze River Economic Belt, Jiangsu, Shanghai, and Zhejiang were the top three most efficient green economies in the Yangtze River Economic Belt. The region is located at the mouth of the Yangtze River and is central to the Chinese economy. It has a high level of economic development and a high degree of openness. The economic development model basically transitioned from extensive to intensive and has a stronger awareness of environmental protection and pollution control. Therefore, the efficiency of the green economy is at the forefront in the Yangtze River Economic Belt. The green economy efficiency value of Anhui and Hunan in 2008 was 0.71 and rose to 0.80 in 2017. The green economy efficiency value increased steadily but the increase rate was small, mainly because Anhui and Hunan are located in central China where the level of foreign trade is low [18]. The development of high-tech industries relatively lags behind. The development and upgrading of industries are still in the exploratory stage, and more emphasis is placed on economic development in the balance between economic development and environmental protection. Therefore, the development efficiency of the green economy is still relatively low compared with coastal areas such as Jiangsu. Jiangxi’s green development efficiency rose from 0.736 in 2008 to 0.772 in 2017, but its ranking in the Yangtze River Economic Belt dropped from fourth to eighth, indicating that Jiangxi lagged behind other provinces in the development of the green economy. The reason for this is that, although the development concept in Jiangxi’s transformed from an “industrial strong province” to “strong tourism province”, the influence of the “industrial strong province” policy remains. Jiangxi’s economic development rate ranked in the top five in the country in recent years, but the speed of this economic development is based on infrastructure construction and land finance, and the economic development mode is yet to be transformed. As the central economic center, Hubei was always the industrial center of the central region. The development of Hubei’s economy is mainly due to the development of heavy industry. Most of these heavy industries belong to state-owned enterprises. The reform of the system and mechanism is difficult, and the high energy consumption per unit lacks the vitality of enterprises. Therefore, when the concept of green development is implemented, the energy will be insufficient, and the development will lag behind. The green economy efficiency values of Chongqing and Sichuan fluctuated less, ranking first in the provinces and cities of the Yangtze River Economic Belt, but Sichuan’s green economy efficiency value of 0.74 was significantly higher than Chongqing’s 0.54, mainly due to Sichuan gradually becoming the center of southwestern China, and the development of high-tech industries and tourism advanced considerably [49]. The high-tech industries represented by new materials and new energy vehicles developed rapidly. Yunnan is located along the southwestern border. The economic development always relied on tourism. The ecological environment is good but still fragile. It is not suitable for large-scale economic development. Therefore, the value of the green development efficiency lagged. In 2008, Guizhou’s green development efficiency value was 0.645, ranking eighth in the Yangtze River Economic Belt. By 2017, the green development efficiency value rose to 0.813, ranking fourth in the Yangtze River Economic Belt, strongly related to Guizhou’s vigorous development of the big data industry in recent years [50]. Guizhou has superior climatic conditions, a stable geological structure, far away from seismic belts, low disaster risk, and 52% forest coverage. This led to the establishment of seven of the top 10 internet companies in the world. Apple, Microsoft, Alibaba, Huawei, and other internet leaders are rooted in Guizhou. The data show that, from 2013 to 2017, the average annual compound growth rate of Guizhou’s big data companies was 71% [51]. This promoted the rapid development of Guizhou’s green economy efficiency.
4.2. Impact of High-Tech Industrial Agglomeration on the Efficiency of the Green Economy
4.2.1. Model Consistency Test
To solve the problem of the endogeneity of panel data caused by dynamic research and the relative efficiency, we used the system generalized moment method (SGMM) for regression analysis. To examine the consistency of the model, we used Bond’s method [52] to test whether the model was reasonable. Table 4 compares the estimated quantities of the ordinary least squares (OLS) and fixed-effect models. The results show that the lag coefficients of the explanatory variables in the fixed-effect model, OLS, and SGMM were 0.627, 0.926, and 0.641, respectively, which were all significant at the 1% level. The sigma coefficient of the SGMM interpreted variable was between the fixed-effect model and the OLS model, indicating that the model was set properly.
Table 4.
Regression results. OLS—ordinary least squares; SGMM—system generalized moment method; FE—fixed effect; GEE—green economy efficiency; HIA—high-tech industrial agglomeration; ER—environmental regulation strength; EL—economic development level; FDI—foreign direct investment level; URB—urbanization level; Cons—constant.
4.2.2. Empirical Analysis of High-Tech Industry Agglomeration on Green Economy Efficiency
To avoid the collinearity problem as much as possible, we adopted the stepwise regression method, and then introduced the relevant variables into five groups for regression. The regression results and explanatory variables are shown in Table 5. From the estimation results in Table 5, the choice of instrumental variables was found to be reasonable. Significant first-order sequence correlations existed in the five regression equations, with no second-order sequence correlation. The Sargan test accepted the null hypothesis at the 10% significance level, indicating that the instrumental variables set by the model were valid. The green economy efficiency lag coefficients under the five regression models estimated in Table 5 were 0.976, 0.973, 0.688, 0.758, and 0.641, respectively, significant at the 1% level. A significant lag effect existed on the efficiency of the green economy. It was necessary to consider the dynamic panel model to study the efficiency of China’s green economy.
Table 5.
The results of the dynamic panel system generalized moment method (SGMM).
Table 5 shows that the green efficiency lags in the five regressions were all significant at the 1% level. This shows that a significant hysteresis effect on the efficiency of green development existed. Therefore, it was appropriate to use the dynamic panel model to analyze the green economy efficiency of the Yangtze River Economic Belt. When the control variable was added, the coefficient value of the green efficiency lag term decreased. The coefficient values of the five groups of regression results were 0.9768, 0.9731, 0.6889, 0.7588, and 0.6413, respectively, indicating that the green development efficiency of the Yangtze River Economic Belt was convergent. The green development efficiency of the Yangtze River Economic Belt showed a gradual slowing. However, this is not necessarily a negative result. Severe environmental pollution not only has environmental costs, but also affects social welfare. This requires an increase in environmental protection. The economic growth rate may slow in the short term, but the overall welfare of the society is grows. In terms of the core explanatory variables, the five regression results were all significant at the 1% level. However, the hia coefficients in the regression results of the first, second, and third groups were significantly negative, and the coefficient values were −0.0145, −0.0197, and −0.0724, respectively. With the addition of control variables, the hia coefficients in the fourth and fifth regression results were significantly positive, with coefficient values of 0.0045 and 0.0350, respectively. This shows that the increase in the concentration of high-tech industries led to an increase in the efficiency of green development. In other words, the accumulation of high-tech industries in the Yangtze River Economic Belt contributed to the green development of these areas. In the square term of the agglomeration of high-tech industries, the coefficients in the five groups of regressions were significant, and the coefficient values were 0.0225, 0.0258, −0.0088, 0.0506, and 0.0489, respectively. This indicates that a U-shaped relationship existed between high-tech industry agglomeration and the green economy efficiency. Based on the fifth set of regression results, the lowest point of the U-shaped curve and the level of high-tech industrial agglomeration in each region were further analyzed. By 2017, all regions of the Yangtze River Economic Belt were on the right side of the lowest point of the U-shaped curve. This further illustrates that high-tech industry agglomeration had a significant role in promoting green economy efficiency. This shows that the various regions in the Yangtze River Economic Belt promoted the transformation of the industrial structure and vigorously promoted the establishment of high-tech industrial parks, such that no crowding occurred in the gathering of high-tech industries.
Comparing the results of the first group and fifth group, we found that, after the four control variables of environmental regulation intensity, economic development level, opening degree, and urbanization level were added, the high-tech industry agglomeration degree and its squared coefficient also changed. This indicates that these four control variables had a certain constraining effect on the impact of high-tech industrial agglomeration and the green economy efficiency. The specific analysis is given below.
The coefficients of the environmental regulation variables (lnER) in the five groups of regressions were significantly negative. In other words, environmental regulation had a negative impact on the development of the green economy. This shows that, with the strengthening of environmental regulation, the efficiency of the green economy did not correspondingly improve but declined to a certain extent. Two reasons can be provided to explain this finding. Firstly, a certain lag period exists in the environmental regulation effect. The expected effect of strengthening the governance in the short term cannot be realized immediately. The positive impact on the efficiency of the green economy is yet to be revealed. Secondly, local governments choose to strengthen environmental regulations when the regional ecological environment is being negatively impacted which will slow economic development. When the local economy is lagging, local governments choose to loosen environmental regulations to benefit local economic growth. This will lead to a slowly improving or even declining green development efficiency. In terms of the economic development level (lnEL), the coefficient was positive, indicating that economic development had a certain promotion effect on the improvement of the green economy efficiency, but the result was not statistically significant. Similarly, in terms of the urbanization variable (lnURB), the impact on the green economy efficiency was not significant, and the coefficient was −0.2145. This shows that the level of urbanization had a restraining effect on the improvement of the green economy efficiency. Although improvement of the urbanization level can improve people’s quality of life, improve urban ecology, and enhance public awareness of environmental protection, urban construction and urban life also considerably damage the ecological environment. Therefore, improving the level of urbanization does not necessarily improve the efficiency of the green economy. Finally, for the foreign investment level variable (lnFDI), the coefficient values were 0.0384 and 0.0598, which were significantly positive. This shows that the increase in foreign investment had a significant role in promoting the efficiency of the green economy. According to the pollution paradise hypothesis, most of the regions with higher economic development levels are low-pollution, low-energy, and high-tech industries, and some of the inflows of funds, knowledge, and advanced technologies effectively reduced the pollution emissions and energy consumption of high-tech enterprises. Consumption significantly enhances the ability of high-tech companies to innovate in relation to creating a green economy. Therefore, as the degree of openness to the outside world increases, the efficiency of the green economy also rises.
5. Conclusions and Recommendations
Through the measurement of the green economy efficiency of the Yangtze River Economic Belt in China and the impact of high-tech industrial agglomeration on the efficiency of the green economy, we found that the green economy efficiency of the Yangtze River Economic Belt is increasing, rising from 0.732 in 2008 to 0.849 in 2017, mainly due to the rapid socio-economic development of the Yangtze River Economic Belt and the people’s emphasis on environmental protection. Secondly, the green economy efficiency of the Yangtze River Economic Belt differs with time and by region. The green economy in the downstream areas of the Yangtze River Economic Belt is highly efficient and development is stable. Jiangsu, Shanghai, and Zhejiang were the top three areas, with green economy efficiency values between 0.792 and 0.973. The green economy efficiency in the midstream areas was lower than in the downstream areas, but higher than in the upstream areas. In the region, the green economy efficiency value was between 0.603 and 0.802. The green economy in the upstream areas was less efficient, but individual provinces developed at a faster rate in recent years. The green economy efficiency value was between 0.478 and 0.813, related to the region’s vigorous promotion of high-tech industry development and industrial restructuring. Thirdly, the green economy efficiency of the Yangtze River Economic Belt lagged, and the lagging term was significant at the 1% level. The coefficient values of the regression term of the regression result were 0.9768, 0.9731, 0.6889, 0.7588, and 0.6413, indicating that the green economy efficiency exhibited convergence. Lastly, in the regression results of the SGMM control variables, the regression coefficients of economic development and foreign direct investment were positive, which indicates that these variables had a positive effect on the improvement of the green economy efficiency. The regression coefficients of environmental regulation and urbanization were negative, which indicates that they had a restraining effect on the increase in the green economy efficiency.
Green development is an important component of China’s five development concepts. Improving the efficiency of the green economy is the fundamental requirement for green development. As a strategic industry for economic development, high-tech industries have many advantages in increasing energy efficiency, promoting economic restructuring, and motivating green development. Industry 4.0 [53] and Made in China 2025 [8] represent China’s commitment to the development of low-level industries to high-tech industries. The competition between countries in the future will mainly be reflected in high-tech industry competition, and the degree of development of high-tech industries depends on the proportion of high-level talents. Studies showed that people with higher levels of education have higher environmental requirements and more awareness about environmental protection. Therefore, the development of high-tech industries not only promotes economic development but also forms a strong attraction for high-level talent, thereby promoting the development of a green economy. Based on this, to promote the development of and create agglomeration effects in high-tech industries, thereby improving the efficiency of the green economy, we propose the following policy recommendations:
- (1)
- High-tech industries should be vigorously developed, and the innovation capability of the agglomerated areas should be improved. The most important feature of the high-tech industry is that it is technology-intensive. The input of R&D capital can enhance the innovation ability of the enterprise, and improve the innovation ability of the aggregate as a whole. Innovation-driven development should be achieved, thereby promoting the development of high-tech industrial clusters and promoting the efficiency of green development.
- (2)
- The quality of economic development should be considered, and the concept of green development should be advocated. In China’s past economic development, rich natural resources and labor resources played a pivotal role, but with the diminishing marginal returns of factor inputs and the depletion of natural resources, coupled with the aging population, the economic development rate decreased. Therefore, transforming the economic development mode, eliminating backward industries, supporting the development of high-tech industries, and practicing the concept of green development are particularly important.
- (3)
- Foreign capital should be actively introduced, and its exposure to the outside world should be expanded. The active and effective use of foreign capital is a great opening. China’s attraction of foreign investment will shift from quantity to quality, with even more emphasis on the new stage of quality. Simultaneously, China’s policy of attracting foreign investment shifted away from relying mainly on preferential policies to focusing on matching international rules, creating fairer competition, and a transparent and open investment environment, generating a fair and transparent predictable investment policy environment for foreign investors and more opportunities to share the development dividends in the Chinese market.
- (4)
- Environmental protection and raising awareness of environmental protection should be prioritized. We must establish binding targets for energy conservation and emission reduction, implement major environmental protection construction projects, promote low-carbon technologies, and develop a circular economy. We should vigorously develop green technology, promote the development of key industries on the basis of green environmental protection, build a technical support system that saves resources and energy, and fundamentally solve a series of practical problems, such as economic development, ecological environmental protection, and social progress.
- (5)
- The scale of megacities should be strictly controlled, and the urban household registration system should be reformed. Efforts should be made to coordinate the development of industrialization, urbanization, and agricultural modernization, to strictly control the population size of megacities, and to promote the coordinated development of cities and small towns. The government must reasonably guide the agricultural population to move to cities and towns in a structured manner, orderly relax the restrictions on the settlement of medium-sized cities, and strengthen the financial security of basic public services.
To study the impact of high-tech industries on the efficiency of the green economy, we introduced Super SBM-DEA to measure the efficiency of the green economy and used SGMM to study the impact of high-tech industries on the green economy efficiency. Unlike previous research methods, the high-quality development of the industry was a more critical factor. In future research, we will consider the impact of other industries, such as the financial industry, on the efficiency of green economy. It is also possible to consider the combined effects of multiple related industries on green development. So far, no scholars studied the combined effects of multiple industries on green development. This study hopes to contribute to building a clean, sustainable, and environmentally friendly society.
Author Contributions
W.C. conceptualized and designed the research and methodology; Y.L. collected and compiled all of the data and literature; X.H. finished the calculation and analyzed the results; X.L. put forward the policies; Y.S. revised the manuscript and approved the manuscript; Y.S. is responsible for future questions from readers as the corresponding author.
Funding
This paper was supported by the Chinese Academy of Social Sciences Foundation Project (2015YZD6), the National Nature Science Foundation Project (71263037), the Jiangxi Province Graduate Innovation Fund Project (YC2017-B005), and the Jiangxi Young Marxist Theory Research Innovation Project (18QM26). The authors are grateful for the support of the National Nature Science Foundation, National Social Science Foundation, University of North Carolina at Chapel Hill, and Nanchang University. The contents of this paper are solely the responsibility of the authors and do not represent the official views of the aforementioned institutes and funding agencies.
Conflicts of Interest
The authors declare no conflicts of interest.
References
- Kalinic, Z.; Marinkovic, V.; Molinillo, S.; Liebana-Cabanillas, F. A multi-analytical approach to peer-to-peer mobile payment acceptance prediction. J. Retail. Consum. Serv. 2019, 49, 143–153. [Google Scholar] [CrossRef]
- National Development and Reform Commission. Available online: http://www.ndrc.gov.cn/fzgggz/dqjj/qygh/201610/t20161011_822279.html (accessed on 24 February 2019).
- Boston, J. A good life on a finite earth: The political economy of green growth. Gov. Int. J. Policy Adm. Inst. 2019, 32, 581–582. [Google Scholar]
- Ding, S. A novel discrete grey multivariable model and its application in forecasting the output value of China’s high-tech industries. Comput. Ind. Eng. 2019, 127, 749–760. [Google Scholar] [CrossRef]
- Zhang, B.; Luo, Y.; Chiu, Y.H. Efficiency evaluation of China’s high-tech industry with a multi-activity network data envelopment analysis approach. Socio-Econ. Plan. Sci. 2019, 66, 2–9. [Google Scholar] [CrossRef]
- Central People’s Government. Available online: http://www.gov.cn/xinwen/2018-01/12/content_5255987.htm#1 (accessed on 12 May 2019).
- Wu, J.L.; Yang, Z.J.; Hu, X.B.; Wang, H.Q.; Huang, J. Exploring Driving Forces of Sustainable Development of China’s New Energy Vehicle Industry: An Analysis from the Perspective of an Innovation Ecosystem. Sustainability 2018, 10, 4827. [Google Scholar] [CrossRef]
- Yeung, G. ‘Made in China 2025’: The development of a new energy vehicle industry in China. Area Dev. Policy 2019, 4, 39–59. [Google Scholar] [CrossRef]
- Wikipedia. Available online: https://en.wikipedia.org/wiki/Green_economy (accessed on 21 July 2019).
- United Nations Environment Programme (UNEP). Available online: https://en.wikipedia.org/wiki/United_Nations_Environment_Programme (accessed on 9 March 2019).
- Kahle, L.R.; Gurel-Atay, E. (Eds.) Communicating Sustainability for the Green Economy; M.E. Sharpe: New York, NY, USA, 2014; ISBN 978-0-7656-3680-5. [Google Scholar]
- Tolliver, C.; Keeley, A.R.; Managi, S. Green bonds for the Paris agreement and sustainable development goals. Environ. Res. Lett. 2019, 14, 064009. [Google Scholar] [CrossRef]
- Elvira, N.; George, L.; Ioan, H.; Mădălina, P. China’s Green Financial System: Implications for Its Economic Growth. In Finance and Performance of Firms in Science, Education, and Practice; Tomas Bata University in Zlín: Zlín, Czech Republic, 2017; pp. 814–827. [Google Scholar]
- Li, L.; Liu, Y. Industrial Green Spatial Pattern Evolution of Yangtze River Economic Belt in China. Chin. Geogr. Sci. 2017, 27, 660–672. [Google Scholar] [CrossRef]
- China’s Environmental Protection Industry Development Report. Available online: http://www.caepi.org.cn/epasp/website/webgl/webglController/view?xh=154832132962503635609 (accessed on 15 July 2019).
- An, M.; Butsic, V.; He, W.J.; Zhang, Z.F.; Qin, T.; Huang, Z.Q.; Yuan, L. Drag Effect of Water Consumption on Urbanization: A Case Study of the Yangtze River Economic Belt from 2000 to 2015. Water 2018, 10, 1115. [Google Scholar] [CrossRef]
- China Environmental Statistics Yearbook. Available online: http://tongji.cnki.net/kns55/navi/YearBook.aspx?id=N2019030257&floor=1 (accessed on 21 May 2019).
- Liu, Y.H.; Huang, X.J.; Chen, W.L. Threshold Effect of High-Tech Industrial Scale on Green Development-Evidence from Yangtze River Economic Belt. Sustainability 2019, 11, 1432. [Google Scholar] [CrossRef]
- Kirk, J.; Belovics, R. The high-tech industry and its workers. J. Employ. Couns. 2007, 44, 50–59. [Google Scholar] [CrossRef]
- Miyazaki, H. An analysis of the relation between R&D and M&A in high-tech industries. Appl. Econ. Lett. 2009, 16, 199–201. [Google Scholar]
- Richard, R.N. National Innovation Systems: A Comparative Analysis; Oxford University Press: Oxford, UK, 1993. [Google Scholar]
- Merchant, J.E. The role of governments in a market economy: Future strategies for the high-tech industry in America. Int. J. Prod. Econ. 1997, 55, 117–132. [Google Scholar] [CrossRef]
- Alsleben, C. The downside of knowledge spillovers: An explanation for the dispersion of high-tech industries. J. Econ. 2005, 84, 217–248. [Google Scholar] [CrossRef]
- Tsvetkova, A.; Thill, J.-C.; Strumsky, D. Metropolitan innovation, firm size, and business survival in a high-tech industry. Small Bus. Econ. 2014, 43, 661–676. [Google Scholar] [CrossRef]
- Jiao, B.Q.; Huang, W.; Xie, Z.; Lo, L. Study on the relationship between high-tech industrial regional agglomeration and R&D efficiency. Agro Food Ind. Hi-Tech 2016, 27, 70–77. [Google Scholar]
- Lyons, D.; Luker, B. Employment in R&D-intensive high-tech industries in Texas. Mon. Labor Rev. 1996, 119, 15–25. [Google Scholar]
- Henderson, V. Externalities and industrial development. J. Urban Econ. 1997, 42, 449–470. [Google Scholar] [CrossRef]
- Duranton, G.; Puga, D. Diversity and specialization in cities: Why, where and when does it matter? Urban Stud. 2000, 37, 533–555. [Google Scholar] [CrossRef]
- Rosenthal, H. Navigating failure: Bankruptcy and commercial society in antebellum America. J. Econ. Hist. 2001, 61, 861–862. [Google Scholar]
- Barrios, S.; Bertinelli, L.; Strobl, E.; Teixeira, A.-C. The dynamics of agglomeration: Evidence from Ireland and Portugal. J. Urban Econ. 2005, 57, 170–188. [Google Scholar] [CrossRef]
- Fan, Q.; Hu, H.H. The Impact of Vertical Specialization on the Agglomeration of China’s Manufacturing Sector: An Empirical Research Based on Province Level Panel Data. Innov. Financ. Econ. 2015, 1, 213–225. [Google Scholar]
- Yang, L. Measuring the Innovation Efficiency in China’s High-Tech Industries: An Empirical Study Based on Panel Data. In Proceedings of the 2018 2nd International Conference on E-Education, E-Business and E-Technology (ICEBT 2018), Beijing, China, 5–7 July 2018; pp. 165–169. [Google Scholar]
- Cieslik, A.; Ghodsi, M. Agglomeration externalities, market structure and employment growth in high-tech industries: Revisiting the evidence. Misc. Geogr. 2015, 19, 76–81. [Google Scholar] [CrossRef]
- Zhang, R.H.; Sun, B.; Liu, M. Do External Technology Sourcing and Industrial Agglomeration Successfully Facilitate an Increase in the Innovation Performance of High-Tech Industries in China? IEEE Access 2019, 7, 15414–15423. [Google Scholar] [CrossRef]
- Xie, B.C.; Duan, N.; Wang, Y.S. Environmental efficiency and abatement cost of China’s industrial sectors based on a three-stage data envelopment analysis. J. Clean. Prod. 2017, 153, 626–636. [Google Scholar] [CrossRef]
- Miller, S.M.; Upadhyay, M.P. The effects of openness, trade orientation, and human capital on total factor productivity. J. Dev. Econ. 2000, 63, 399–423. [Google Scholar] [CrossRef]
- Blackorby, C.; Lovell, C.A.K.; Thursby, M.C. Extended Hicks Neutral Technical Change. Econ. J. 1976, 86, 845–852. [Google Scholar] [CrossRef]
- Zhu, Y.; Wang, Z.; Qiu, S.; Zhu, L. Effects of Environmental Regulations on Technological Innovation Efficiency in China’s Industrial Enterprises: A Spatial Analysis. Sustainability 2019, 11, 2186. [Google Scholar] [CrossRef]
- Charnes, A. Measuring the efficiency of decision-making units. Eur. J. Oper. Res. 1978, 2, 429–444. [Google Scholar] [CrossRef]
- Tone, K. A strange case of the cost and allocative efficiencies in DEA. J. Oper. Res. Soc. 2002, 53, 1225–1231. [Google Scholar] [CrossRef]
- Hosoe, N.; Gasawa, K.; Hashimoto, H. Advanced Uses of GAMS. In Textbook of Computable General Equilibrium Modelling: Programming and Simulations; Springer: Berlin/Heidelberg, Germany, 2010; pp. 204–212. [Google Scholar]
- Li, Z.D. Operation Performance Evaluation and Optimization Based on SUPER-SBM DEA Model in Railway Industry in China. In Proceedings of the 2013 International Conference on Information Science and Cloud Computing Companion (ISCC-C), Guangzhou, China, 7–8 December 2013; pp. 31–36. [Google Scholar]
- Lv, C.C. A Study on Regional Comparison of Productive Efficiency of Service Sector in China Based on SUPER-SBM DEA Model. In Recent Advance in Statistics Application and Related Areas, Proceedings of the 4th International Institute of Statistics & Management Engineering Symposium, Dalian, China, 24–29 July 2011; Pts 1–2. pp. 386–389. [Google Scholar]
- China Statistics Yearbook. Available online: http://www.stats.gov.cn/tjsj/ndsj/ (accessed on 7 July 2019).
- China Energy Statistics Yearbook. Available online: http://tongji.cnki.net/kns55/Navi/YearBook.aspx?id=N2018070147&floor=1 (accessed on 1 July 2019).
- Zaro, F.R.; Alqam, S.J. Solving Dynamic Load Economic Dispatch Using GAMS Optimization Algorithm. In Proceedings of the 2019 IEEE Jordan International Joint Conference on Electrical Engineering and Information Technology (JEEIT), Amman, Jordan, 9–11 April 2019; pp. 866–871. [Google Scholar]
- Pleydell, D.R.J.; Chretien, S. Mixtures of GAMs for habitat suitability analysis with over dispersed presence/absence data. Comput. Stat. Data Anal. 2010, 54, 1405–1418. [Google Scholar] [CrossRef]
- Lee, H.H.; Yi, I.; Park, D. impact of the Global Financial Crisis on the Degree of Financial Integration among East Asian Countries. Glob. Econ. Rev. 2013, 42, 425–459. [Google Scholar] [CrossRef]
- Chen, Y.; Zhang, S.; Huang, D.; Li, B.L.; Liu, J.; Liu, W.; Ma, J.; Wang, F.; Wang, Y.; Wu, S.; et al. The development of China’s Yangtze River Economic Belt: How to make it in a green way? Sci. Bull. 2017, 62, 648–651. [Google Scholar] [CrossRef]
- Yang, L.; Mashkovtsev, R.; Botis, S.; Pan, Y. Multi-spectroscopic study of green quartzite (Guizhou Jade) from the Qinglong antimony deposit, Guizhou Province, China. J. China Univ. Geosci. 2007, 18, 327–329. [Google Scholar]
- Wang, D.; Li, C.G. Study on the Influencing Factors of Big Data Finance Development in Guizhou Province. In Proceedings of the 2017 2nd International Conference on Education Research and Reform, Moscow, Russia, 28–29 June 2017; Volume 19, pp. 26–31. [Google Scholar]
- Bond, S.R. Dynamic panel data models: A guide to micro data methods and practice. Port. Econ. J. 2002, 1, 141–162. [Google Scholar] [CrossRef]
- Braccini, A.M.; Margherita, E.G. Exploring Organizational Sustainability of Industry 4.0 under the Triple Bottom Line: The Case of a Manufacturing Company. Sustainability 2019, 11, 36. [Google Scholar] [CrossRef]
© 2019 by the authors. Licensee MDPI, Basel, Switzerland. This article is an open access article distributed under the terms and conditions of the Creative Commons Attribution (CC BY) license (http://creativecommons.org/licenses/by/4.0/).