Article

Spatial Correlation Network of Format in the Central Districts of a Megacity: The Case of Shanghai

1
Department of Urban and Rural Planning, College of Landscape Architecture, Nanjing Forestry University, Nanjing 210037, China
2
Department of Urban Planning, School of Architecture, Southeast University, Nanjing 210096, China
*
Author to whom correspondence should be addressed.
Sustainability 2019, 11(19), 5191; https://doi.org/10.3390/su11195191
Submission received: 21 July 2019 / Revised: 6 September 2019 / Accepted: 18 September 2019 / Published: 22 September 2019
(This article belongs to the Special Issue Sustainable Business and Development II)

Abstract

:
The format of different industries within a city is an essential part of a megacity’s development and reflects its central districts’ economic characteristics and development trends. This study takes two central districts in the megacity of Shanghai as its research object and explores the inter-spatial relationships among business format, as well as the mutual spatial relationships within the format network, using the quantitative and qualitative methods of case selection and spatial connectivity. Based on the degree of connectivity, the inter-related formats form a format model association network. Two related characteristics of a format type-related network are hierarchy and stability, and two levels are determined according to the importance of each format in the network: core dominant and non-core dominant. By exploring these relationships, the internal spatial correlation structure of format in the city center, and the hierarchy and systematization of each format, is explained. The results simultaneously contribute to the spatial planning of the central district and provide a valuable policy basis for urban planning managers.

1. Introduction

The concept of a city’s “format” originated in Japan in the 1960s. This concept is used to summarize the business forms of, for example, retail and catering services within a city. Kanemura Eitetsu defined the format of a store that is in direct contact with consumers by stating that the format refers specifically to the combination of marketing elements such as products, prices, stores, and sales [1]. As the economy becomes more complex, the concept of format has been introduced into various industries, such as culture and art, entertainment, and business [2]. Therefore, the term “format” is currently used to refer to existing or realized forms of retail and service activities and covers a variety of commercial industries. Format is also a significant factor in the central districts of cities.
The central district has three basic characteristics: high building density, high economic vitality, and high population density. The formats in the central district not only need to meet the large demands of the people in the central district but are also the main material carriers of diversified formats in the central district. The business function of a central urban area is simultaneously a direct reflection of its level of urban economic development and of the function of the urban central districts. Therefore, an understanding of the spatial distribution of the analytical format can significantly promote understanding of the economic, social, and spatial structures of these areas.
Most existing research focuses on the retail format and some studies have stated that in today’s fiercely competitive atmosphere in the retail industry, the retail format has taken different approaches to address these circumstances. Studying these approaches, two trends can be observed.

1.1. The Strategic Change of the Format Itself

This type of research serves mainly to analyze the function and marketing mode of formats, the types of customers, consumer preferences, and behavioral motivation. González-Hernández and Orozco-Gómez utilized the perspective of Mexican shoppers and sorted consumers according to the shopping center attraction dimension, illustrating that the aim is to both retain existing consumers and attract new ones [3]. Luceri et al. studied cross-type shopping behaviors in consumers from the perspective of cost-effectiveness and found that the socio-demographic characteristics of shoppers—age, gender, employment status, and citizenship status—have an impact on the multi-store patronage mode of clothing purchases [4]. Ferreira and Paiva stressed that the innovation ability of the retail industry and its ability to adapt to new market conditions are crucial for enterprise development [5]. Anthony and Isaac showed that the price image of store formats has an impact on consumers’ price expectations and store selection decisions, and that the classification effect of these retailers differs from that of the price image of retailers [6]. Cristina et al. pointed out that the customer base of a mall has five segments. The most attractive segment of the customer base is the “young enthusiasts” segment while the “adverse-reluctant customer” segment is the main challenge [7]. Miao focused on how different store models affect customer satisfaction and loyalty and to what extent. He proposed the initial stage of internationalization and creating a unique store atmosphere to improve customer satisfaction in fashion stores by using a variety of store formats [8].

1.2. Complementary and Collaborative Development of Format Division

Cardinali et al. studied cross-format competition among grocery stores in the Italian retail industry to understand which formats are converging and which maintain their uniqueness [9]. Yang proposed that the booming e-commerce industry and fierce regional competition pose challenges for Hong Kong’s warehousing industry, which needs to be transformed to maintain its competitiveness. A new model was proposed to introduce third-party warehousing equipment suppliers with advanced facilities and technical capabilities [10]. Berman proposed strategies for improving the decline of retail stores that include (1) increasing store sales by utilizing omni-channel synergies between channels and devices, (2) providing interactive and complementary business environments to make stores more attractive, and (3) increasing productivity by introducing smaller store models and reducing the size of existing stores [11]. Meada proposed that for manufacturers to respond quickly to customers’ needs, cooperation and information sharing among different industries (such as planning, design, manufacturing, and maintenance) must be promoted [12]. Noh et al. found that the sales of clothing and cosmetics increased upon the opening of new outlets. The sales of restaurants, and that of fast food restaurants that complement the industry, have also increased. Moreover, pharmacy sales increased due to the collector effect brought by “outlets” [13].
The above studies, however, are mostly based on economic law and consumer perspective, and there are few studies on the analysis of the spatial relationship of formats. Lin and Xu analyzed the formation mechanism of commercial format space in Guangzhou and proposed that commerce and the real estate industry have spatial co-existence. Furthermore, concerning the influence of traffic on commercial format space, they proposed that urban external traffic trunk lines affect the pattern of wholesale space [14]. Yoon studied an urban area and the relationships between neighborhood-level retail clusters to investigate how one cluster influenced the growth of another. It was found that a district-level retail cluster attracts more retail outlets and that it will not only continue to grow but will also promote neighborhood-level retail cluster growth for three to four years [15]. Hu et al. found that the distribution of formats in a downtown area was not balanced and identified and described three different types of spatial relationships that may exist between any two formats. Although the above studies investigate the layout and relationships of the formats in the format space, it does not explore the internal relationship between the formats and the rest of the business or the role of a single business within the space [16].
Considering the above discussion, it is important to first consider that the characteristics of each format determine its role in the city. Second, there are not only potential competitive relationships between the different formats but the division of labor between them is also equally significant. Third, there may be relationships between business formats and a number of other formats, not just among business formats. We therefore ask the questions: considering a city’s central district’s complex format relationships, which format has the strongest ability to combine other formats in space? Moreover, how are formats related to each other within the central district of a city? What we envisage is that there is mutual cooperation between different formats to form a network of relationships between the formats. This study attempts to construct a format-related network based on the internal relationships between the formats and to find the intrinsic characteristics of the formats within the format-related network.
Most existing studies have investigated format from a single perspective—that of the social factors such as economic and consumer behavior—and have ignored the mutual influences between formats. These studies also neglected the inherent relevance of the format itself within the space, and there are few studies on the spatial correlation of formats. Therefore, this study aims to address these issues. First, we apply the definition of a central district formulated by Hu and Yang to define two central districts of Shanghai: the People’s Square and Lujiazui [17]. Second, we organize, cross-check, and spatially locate the format data in the central areas. The next section explains why this research focuses on Shanghai and introduces the research methods. The third section describes the characteristics of the central format district’s association network, while the fourth summarizes the basic laws of the central format district’s spatial association network and provides the main conclusions of this study.

2. Case Selection and Methods
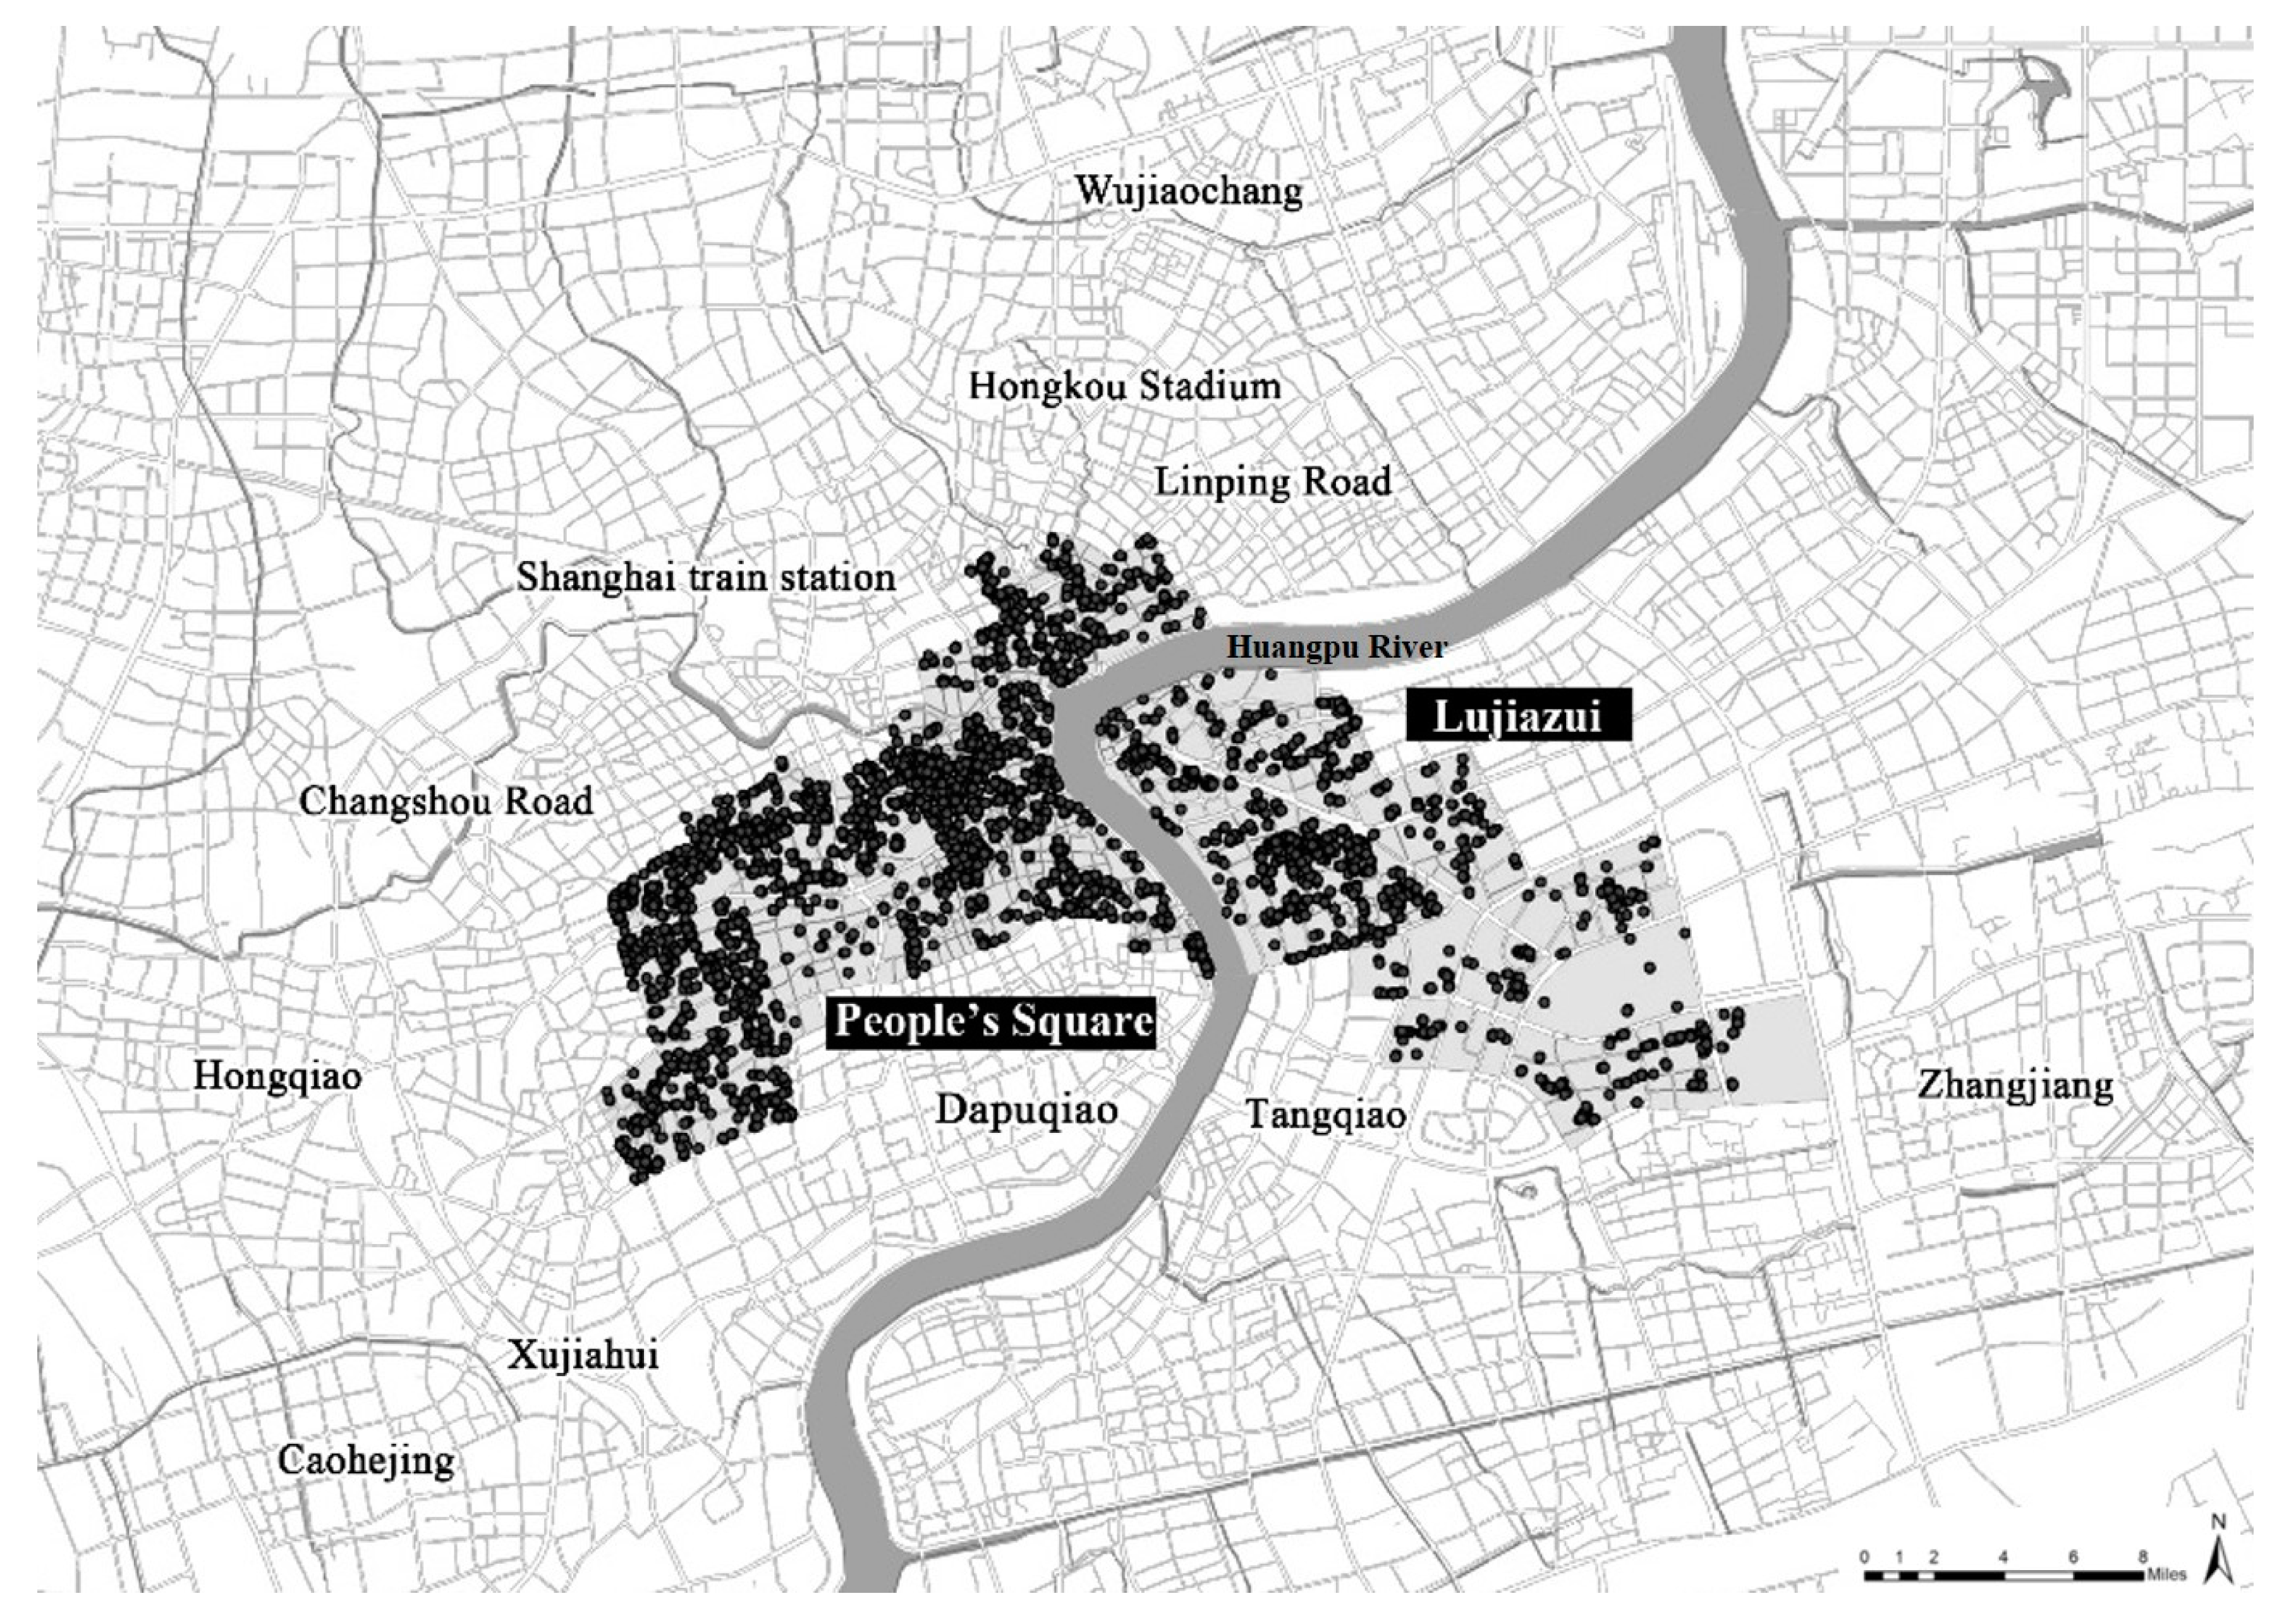
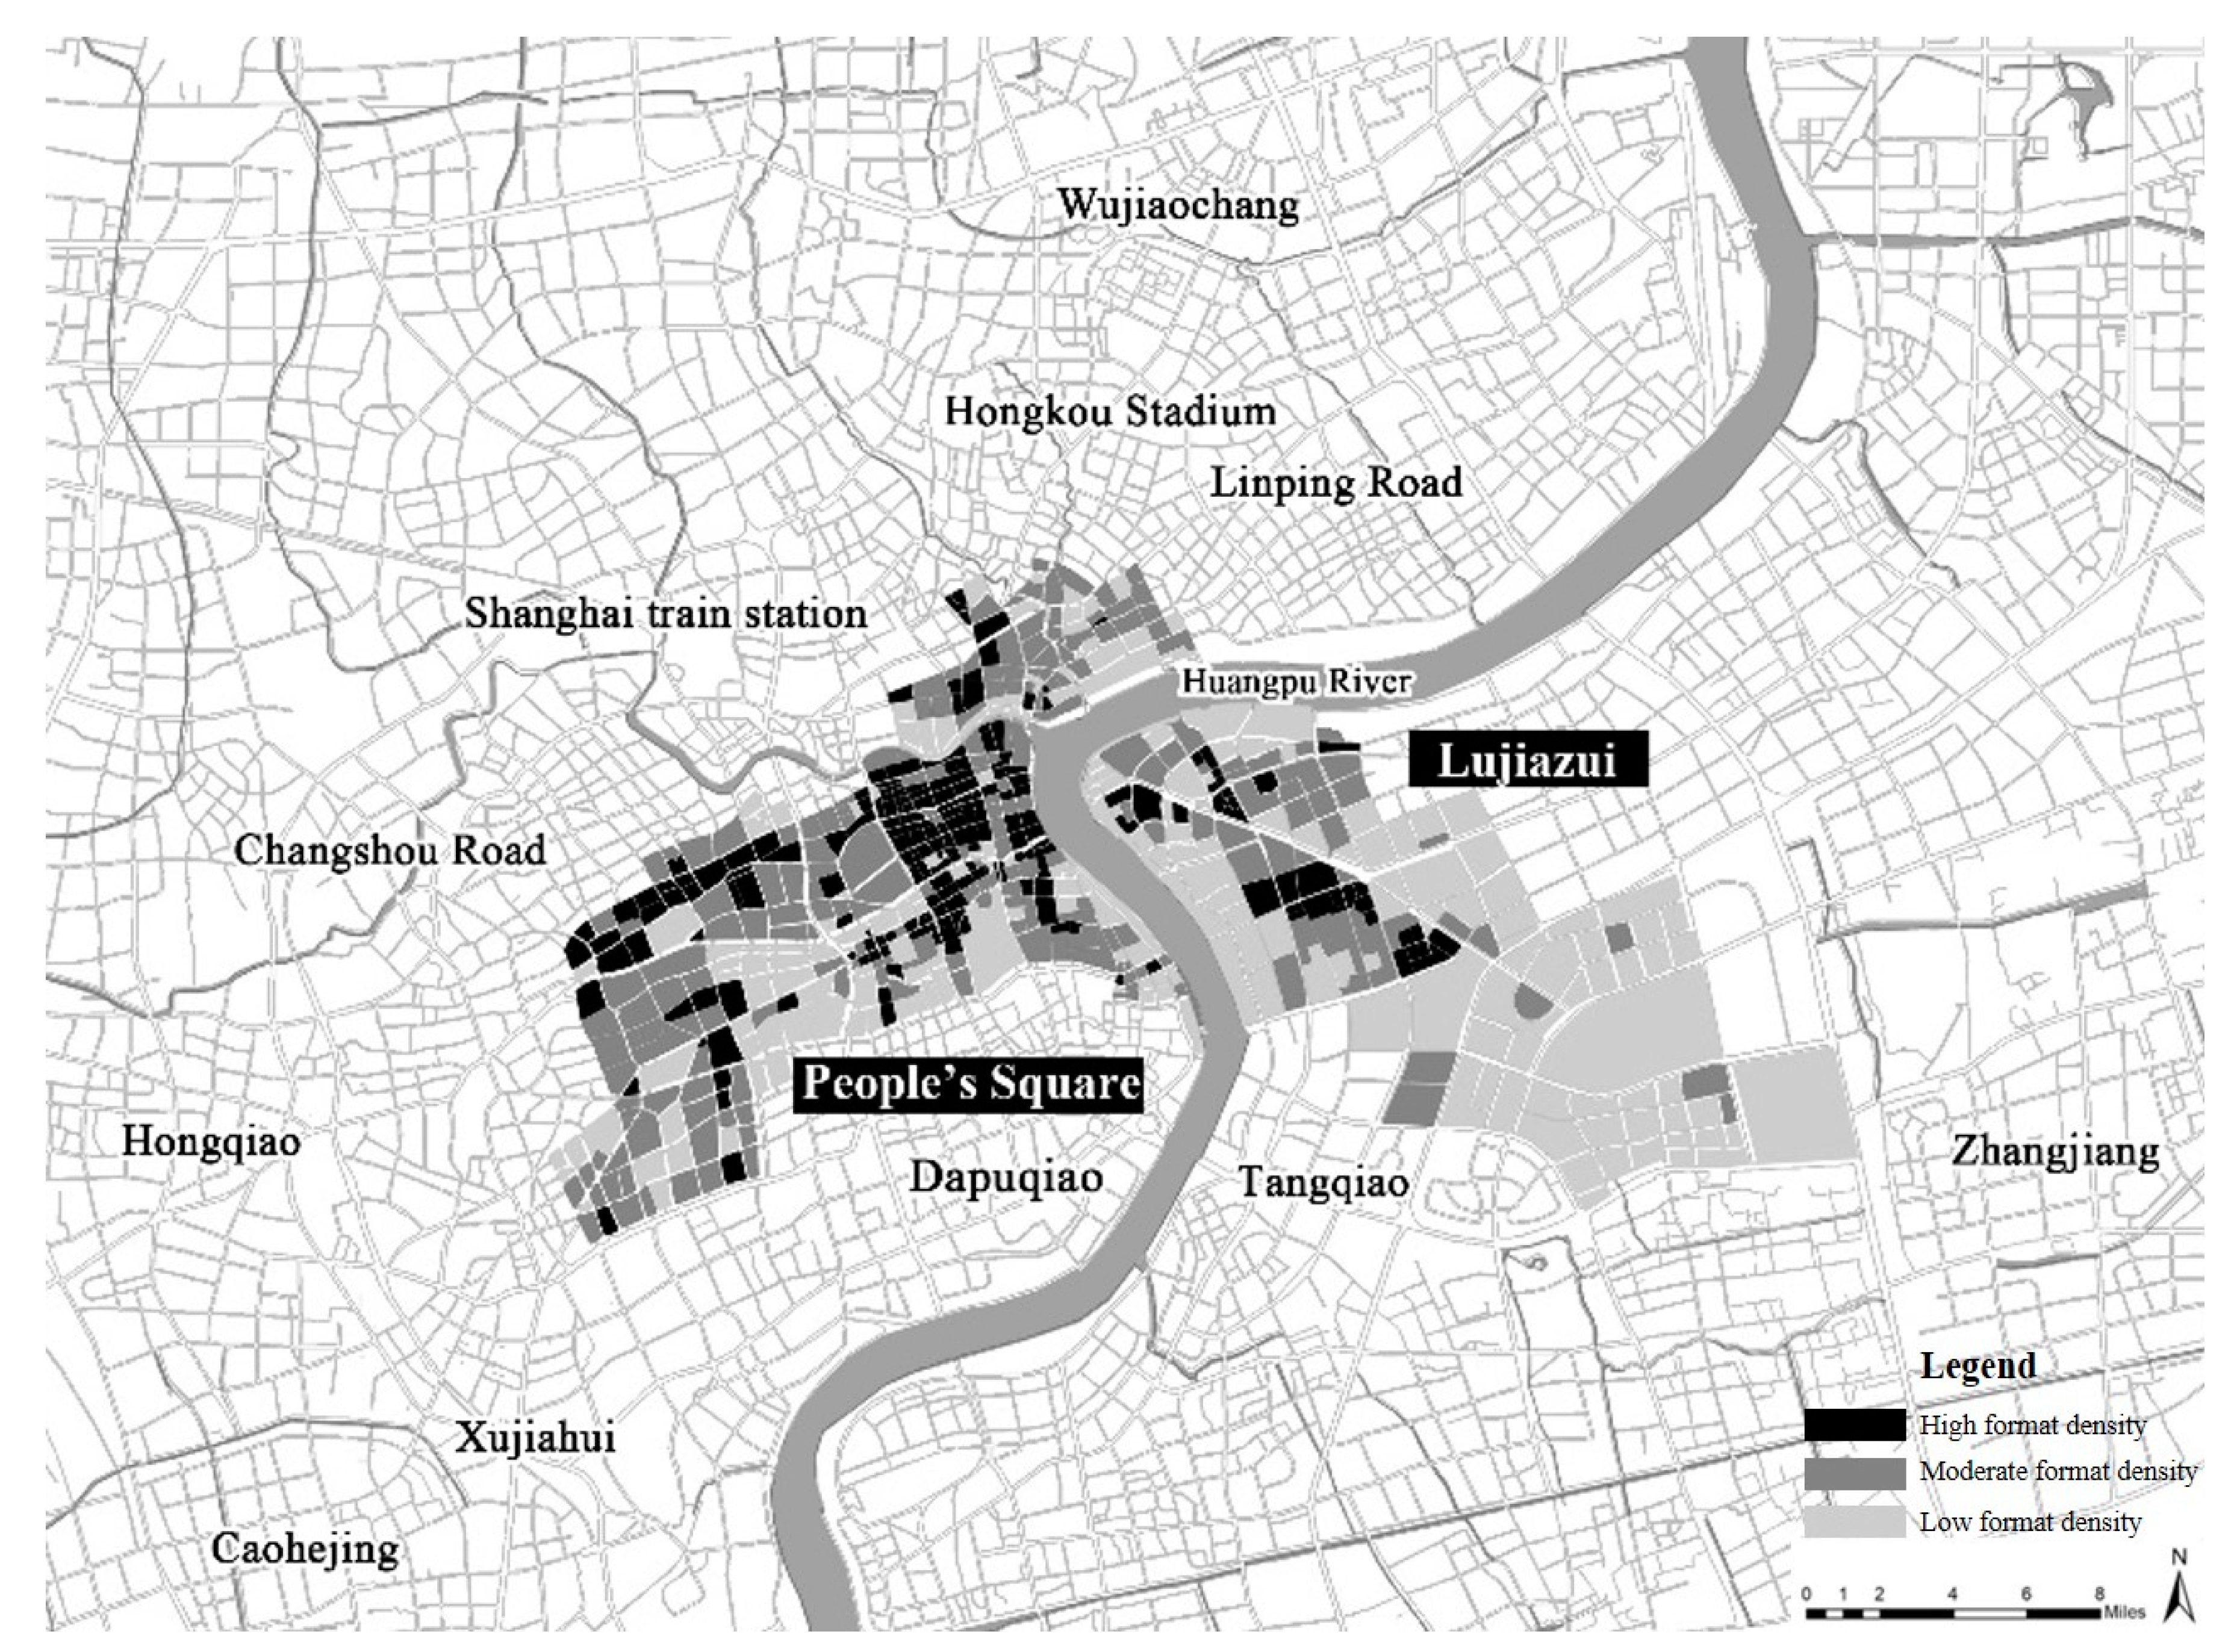
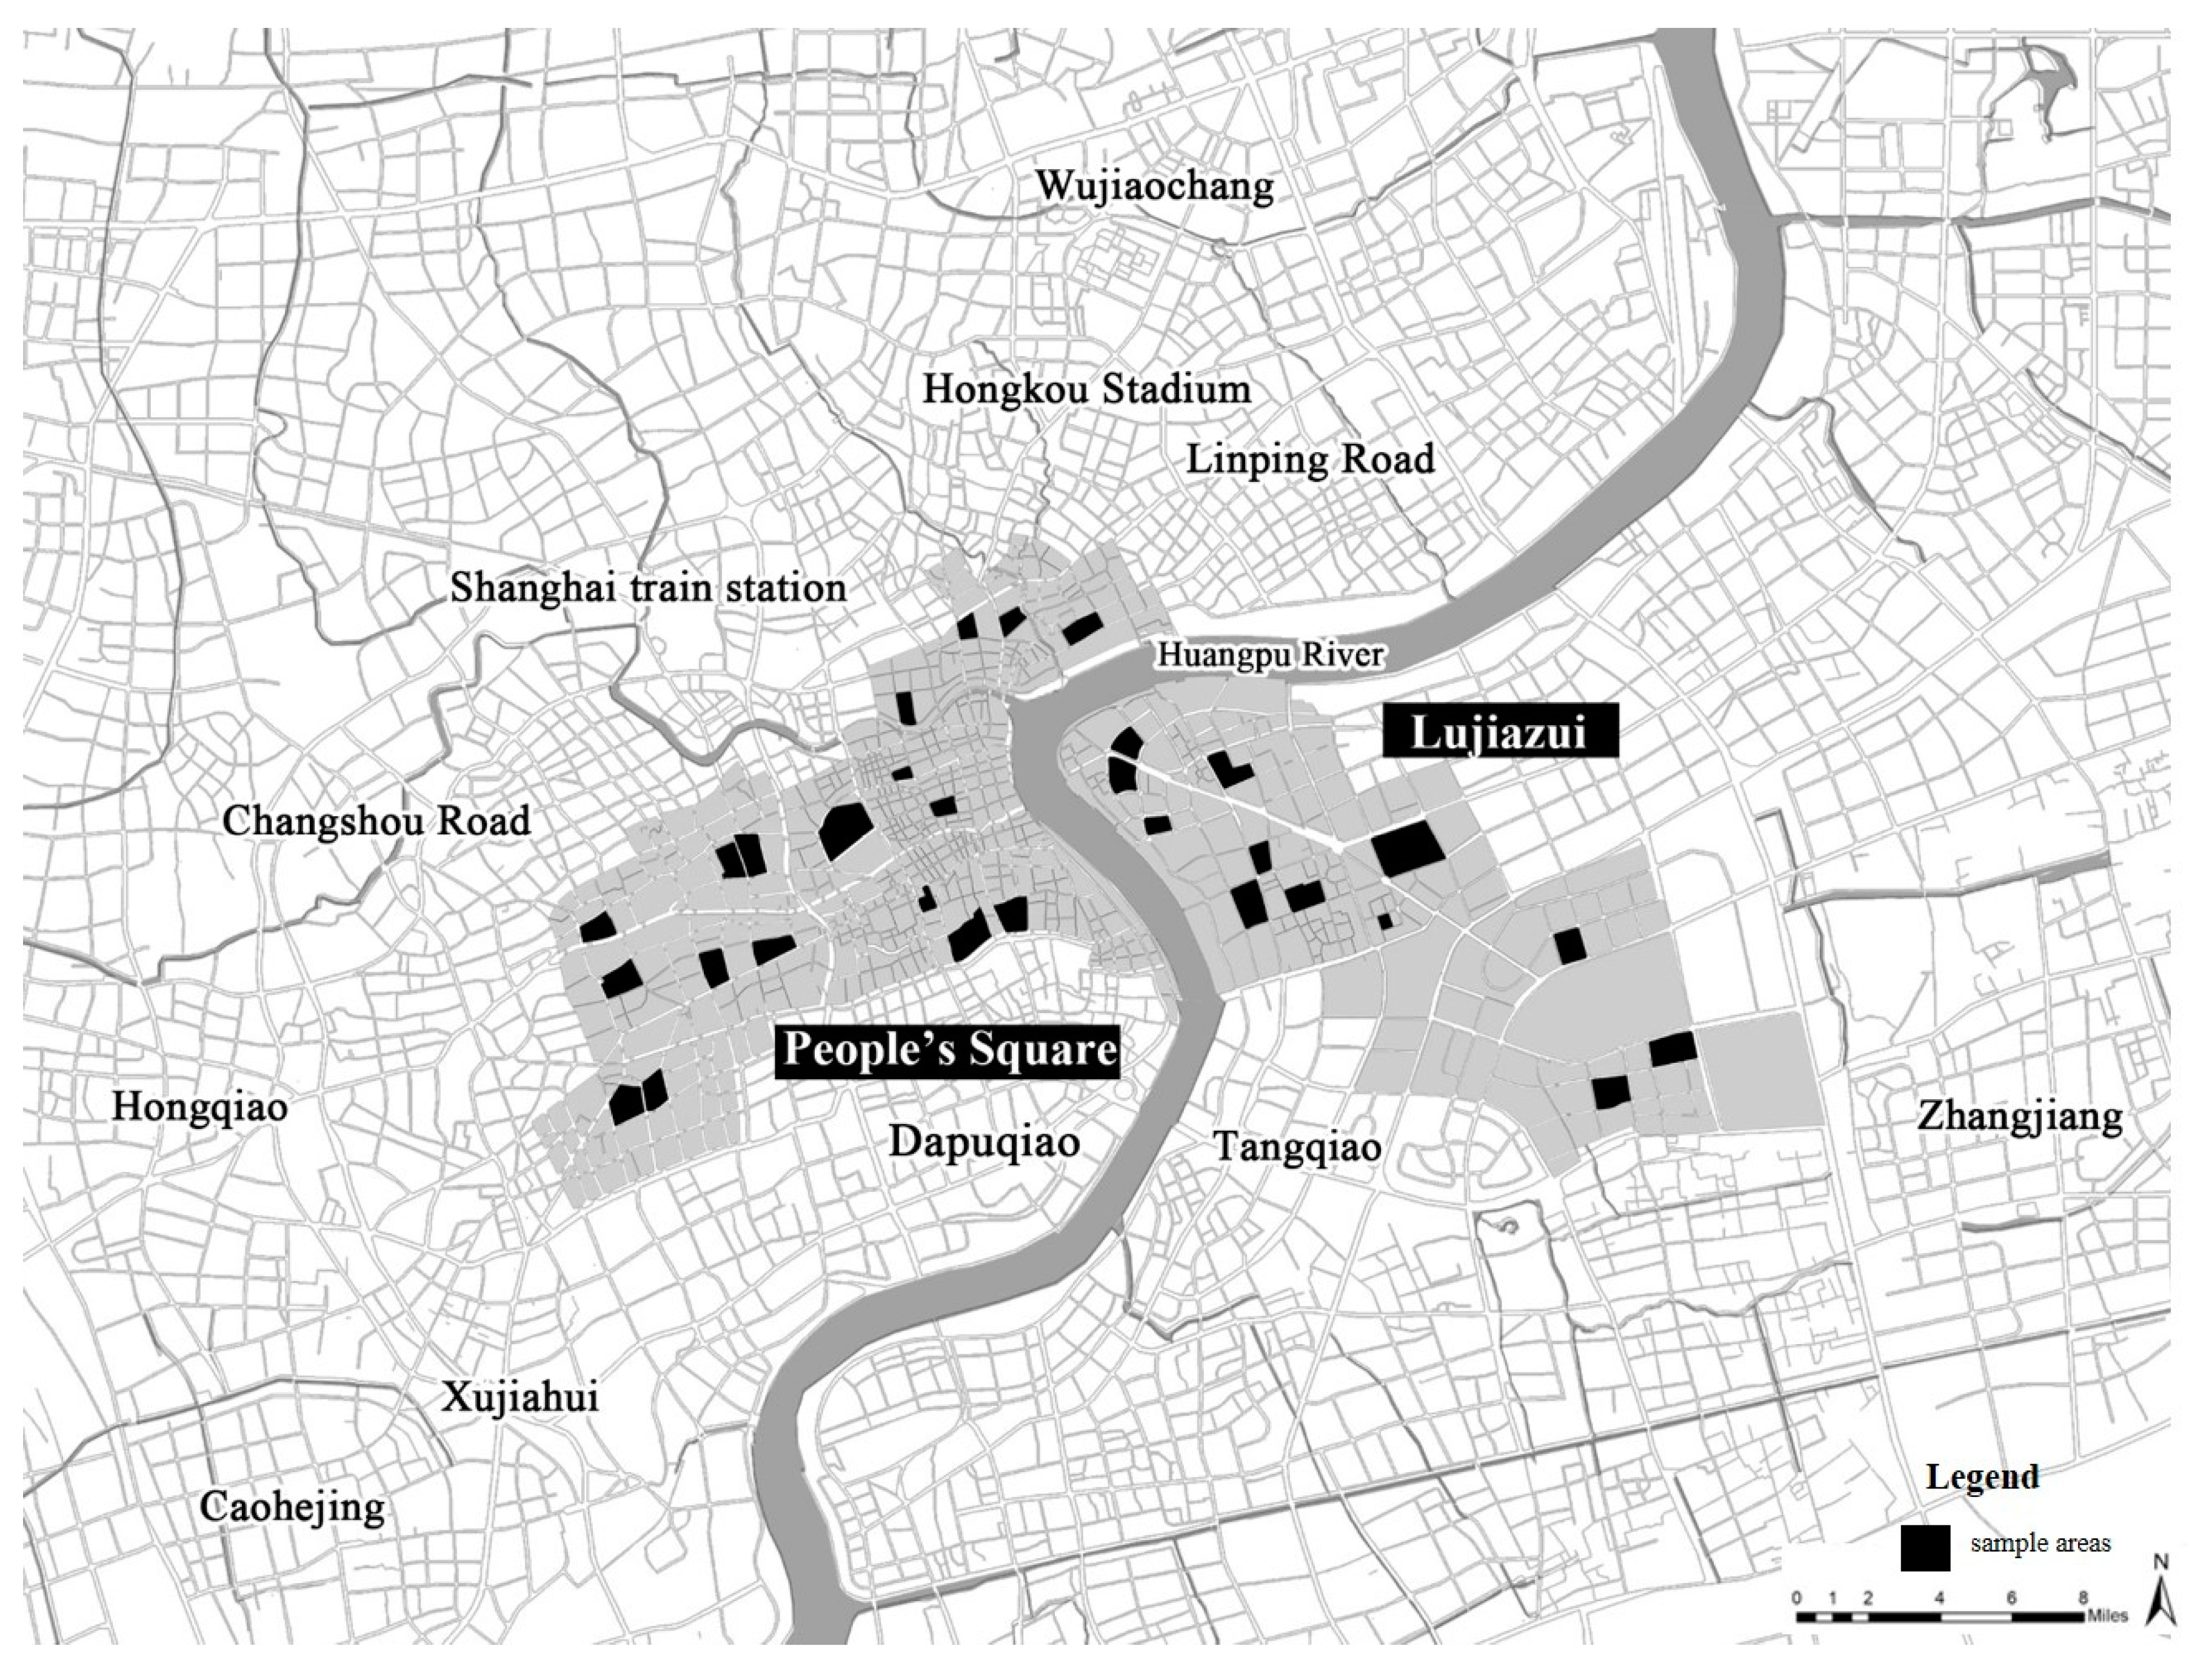
2.1. Case Selection

Shanghai is Asia’s economic, financial, trade, shipping, scientific, and technological innovation center. At the end of 2018, the city had a resident population of 24.2 million people and a gross domestic product (GDP) of approximately 3.27 trillion Yuan [18]. This GDP is the largest in China and the second largest of all Asian cities. Shanghai’s construction scale and land use also makes its city center the most concentrated in China. After analyzing 13 cities and 20 typical central districts, we decided to focus on Shanghai’s People’s square and the Lujiazui district.
First, we refer to the work of Hu and Yang [17] who used the spatial definition method to define two central districts in Shanghai: the People’s Square and Lujiazui Central District. These are the two largest and most well-developed central districts in Shanghai. These two districts are both a mix of the old and the new and have different levels of development, similar to global cities such as Paris (Halles central and La Fang central district) and Singapore (Orchard central and Marina central districts). This combination of the old and new in these districts enables us to comprehensively study the spatial correlation of formats in urban central districts. It will also have a certain reference value for future studies of central districts in other global cities. The People’s square district was founded in 1841 through urban development and was originally based on the traditional business service center format. After nearly 200 years of development, the People’s square’s formats are more complex. Lujiazui, which was founded in 1998, is an emerging central business area. The formats in the Lujiazui central area prioritize business and finance. We found that the two central districts have different proportions of all the different formats. We therefore decided that these two districts are ideal as research objects after careful consideration. We also referred to the China Open Data Index, which is updated in real time every six months by the Lab for Digital & Mobile Governance of Fudan University. In 2018, Shanghai’s open data index was ranked first in China according to their statistical analysis [19]. This means that Shanghai’s open data are the best and most accessible in the country, providing a more accurate and extensive dataset than any other city. This enabled us to study the spatial correlation of formats more comprehensively and infer the composition of other central urban centers based on these findings.

2.2. Data Collection and Classification of Formats

First, we used Python programming language to capture 49,173 format data points from the Baidu Map Open Platform (http://lbsyun.baidu.com/), including names and spatial locations. Next, we visualized the data (including name and location data) in Arcgis and constructed the “Spatial distribution of formats” map (Figure 1).
As the concept of format is gradually introduced into various service industries (in addition to the retail industry), an increasing number of industries and products are involved. Different scholars have presented different interpretations concerning the definition of format within different industries. To facilitate an in-depth study of the formats of the two central regions, all formats were classified and sorted into 15 categories using the service industry data from the Classification of National Economic Industries (GB/T 4754-2002) in China [20]. These include administrative services, entertainment and recreation services, education and scientific research, sports, healthcare, social welfare, traffic services, retail services, market services, catering services, accommodation services, finance and insurance, business, and culture and art, and “other services.”
We provide a statistical summary of the data from the two central districts according to the 15 categories. Next, we created graphs representing the business format data of the two central districts according to the data ratios. These graphs show the number and proportions of the 15 types of business formats in the spatial distribution of the business format composition (Table 1 and Table 2).

2.3. Degree of Format Aggregation

Hu [16] proposed that the degree of format aggregation represents the spatial correlation between the affected core area and the surrounding formats within a range of N meters and is expressed by the number of formats within this range. This suggests that formats, and other formats within the range of N meters, have strong spatial correlations. Therefore,
S B A = B A B     100 %
where S B A denotes the degree of aggregation of format B in the N meter range of format A, B A denotes the number of B formats within the N meter range of A, and B denotes the total number of B formats in the two central districts.
Next, we divided the two main central districts into 30 sample areas, and the steps are as follows: First, we divided the two central districts into 723 blocks with roads as the boundaries. Second, we calculated the format density of a single block and arranged it according to the density. Using a stratified sampling method. The blocks were then divided into three levels: high format density, moderate format density, and low format density (Figure 2).
Finally, considering these three levels, the selected areas should be evenly distributed within the two central districts and all of the 15 types of formats should be included. Based on this, we selected 10 regions with high format density, 10 areas with moderate format density, and 10 areas with low format density, a total of 30 sample areas (Figure 3).
In addition, we conducted face-to-face interviews with the operators of 90 randomly selected institutions from the 15 format types for each district. Each interview addressed the following three aspects:
(1)
Basic attributes of the format institutions, including the store areas and turnover
(2)
Interactions between the interviewees and other format organizations during operating hours, including the purpose, consumer spending, spatial locations, and other information
(3)
Interviewee perspectives: peripheral format organizations at five-meter intervals were first identified. We then interviewed the operators for a comprehensive understanding of the influence of other format organizations on a particular format within each range
The interview results showed that interaction between one format and another happens mostly within a range of ten meters, while interaction between one format and another that is more than twenty meters away is rare. Moreover, by tracking the flow of people and of consumption objects, we found that most of the direct correlation ranges between format points and other format points are within twenty meters. The overall results of the interviews and field surveys showed that the main influence area of individual formats in People’s square is within a twenty-meter range. This indicates that a format has a strong spatial correlation with other types of format within this twenty-meter range. Based on this, for the purposes of this study, N = 20. A total of 210 aggregation degree scores of different formats were obtained through pairwise calculations of 15 format types in the two central areas (Table 3).
The degree of aggregation of these formats represents the dispersed distribution of aggregation fractions for the 210 aggregation degree scores. Figure 4 shows that in all of the aggregation relationships, the distribution of scores is significantly unbalanced, with the scores mainly distributed across a low interval. Approximately half of the aggregation relationship scores are between 3.58% and 29.85%, which means that the relationship scores between business types are mainly concentrated within that range. Only 2% of the format relationships show extremely high scores of over 70%. This indicates that classification based on equivalence may lead to biased results. We therefore calculated a median value of 11.65% to classify the scores. A score higher than the median was considered to be a strong aggregation, while a score lower than the median was considered to be a weak aggregation. Based on our data, we found that there are three types of spatial relationship among formats: a strong two-way correlation, a strong one-way correlation, and a weak two-way correlation. For example, a strong two-way correlation refers to a strong aggregation of two formats (A and B) with each other. A strong one-way correlation means that B and A are strongly correlated, while A and B are weakly correlated. A weak two-way correlation indicates a weak degree of aggregation between A and B, where the levels of interdependence between the two formats are equally low.

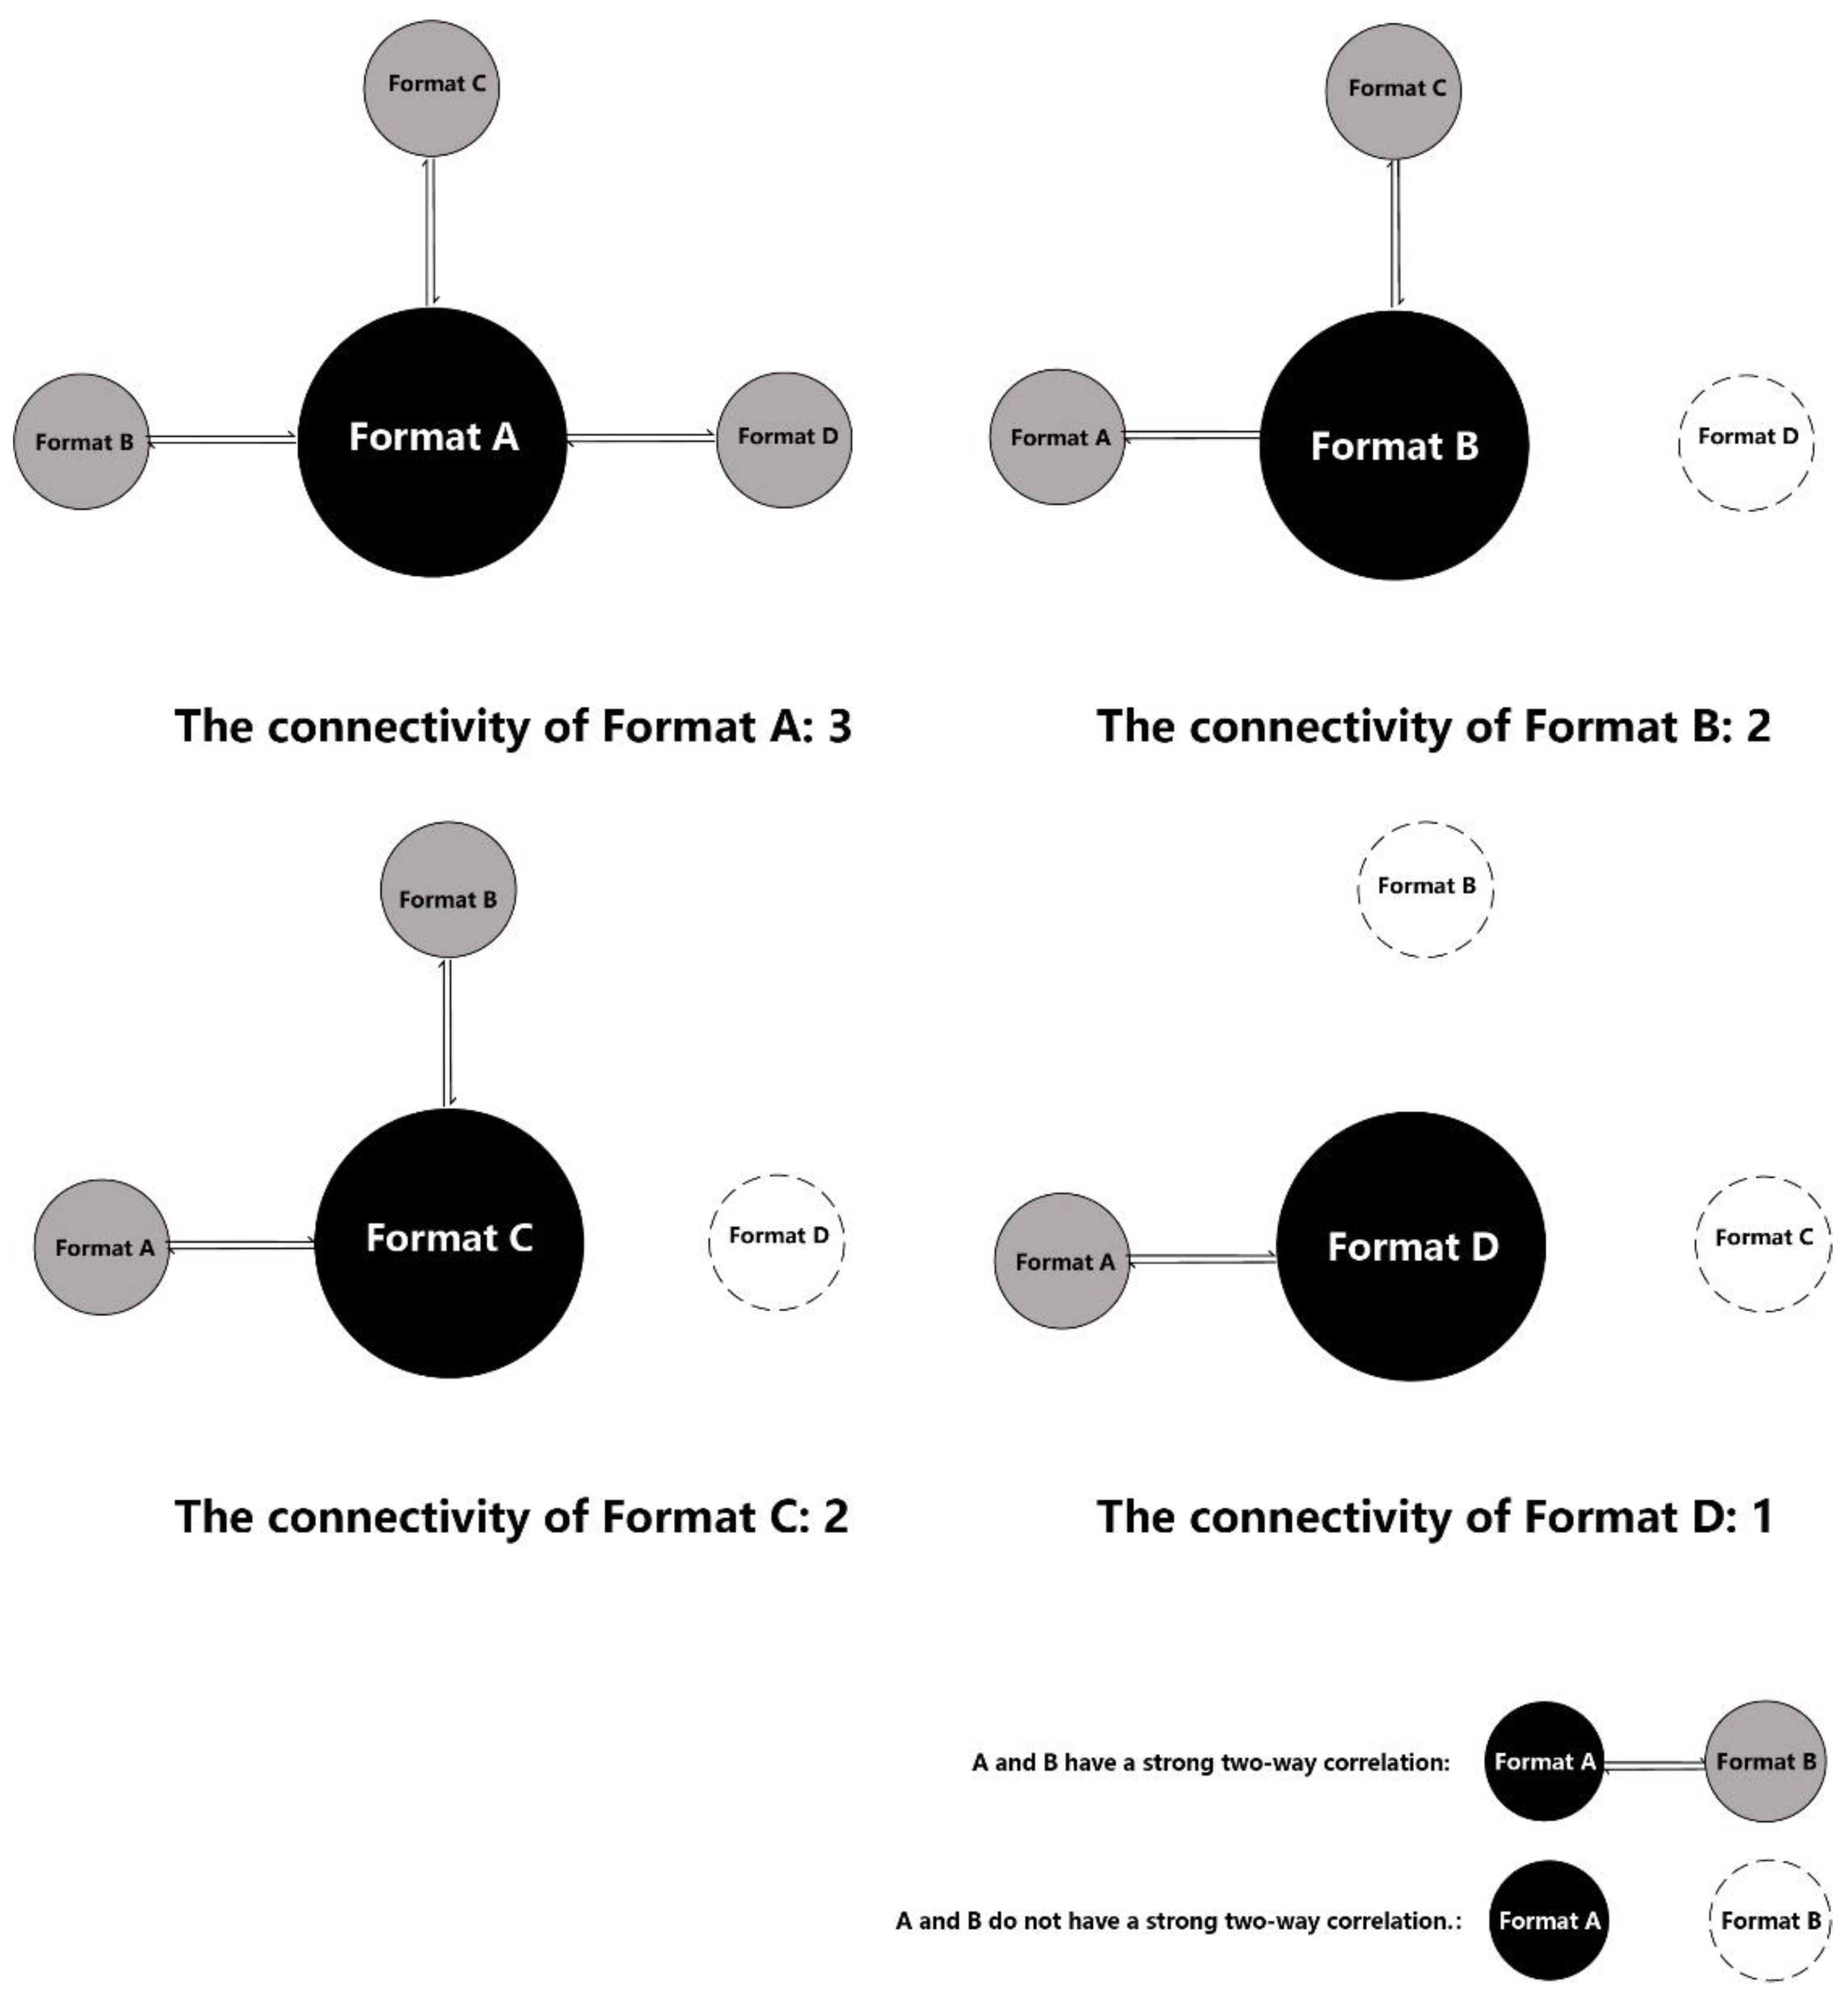
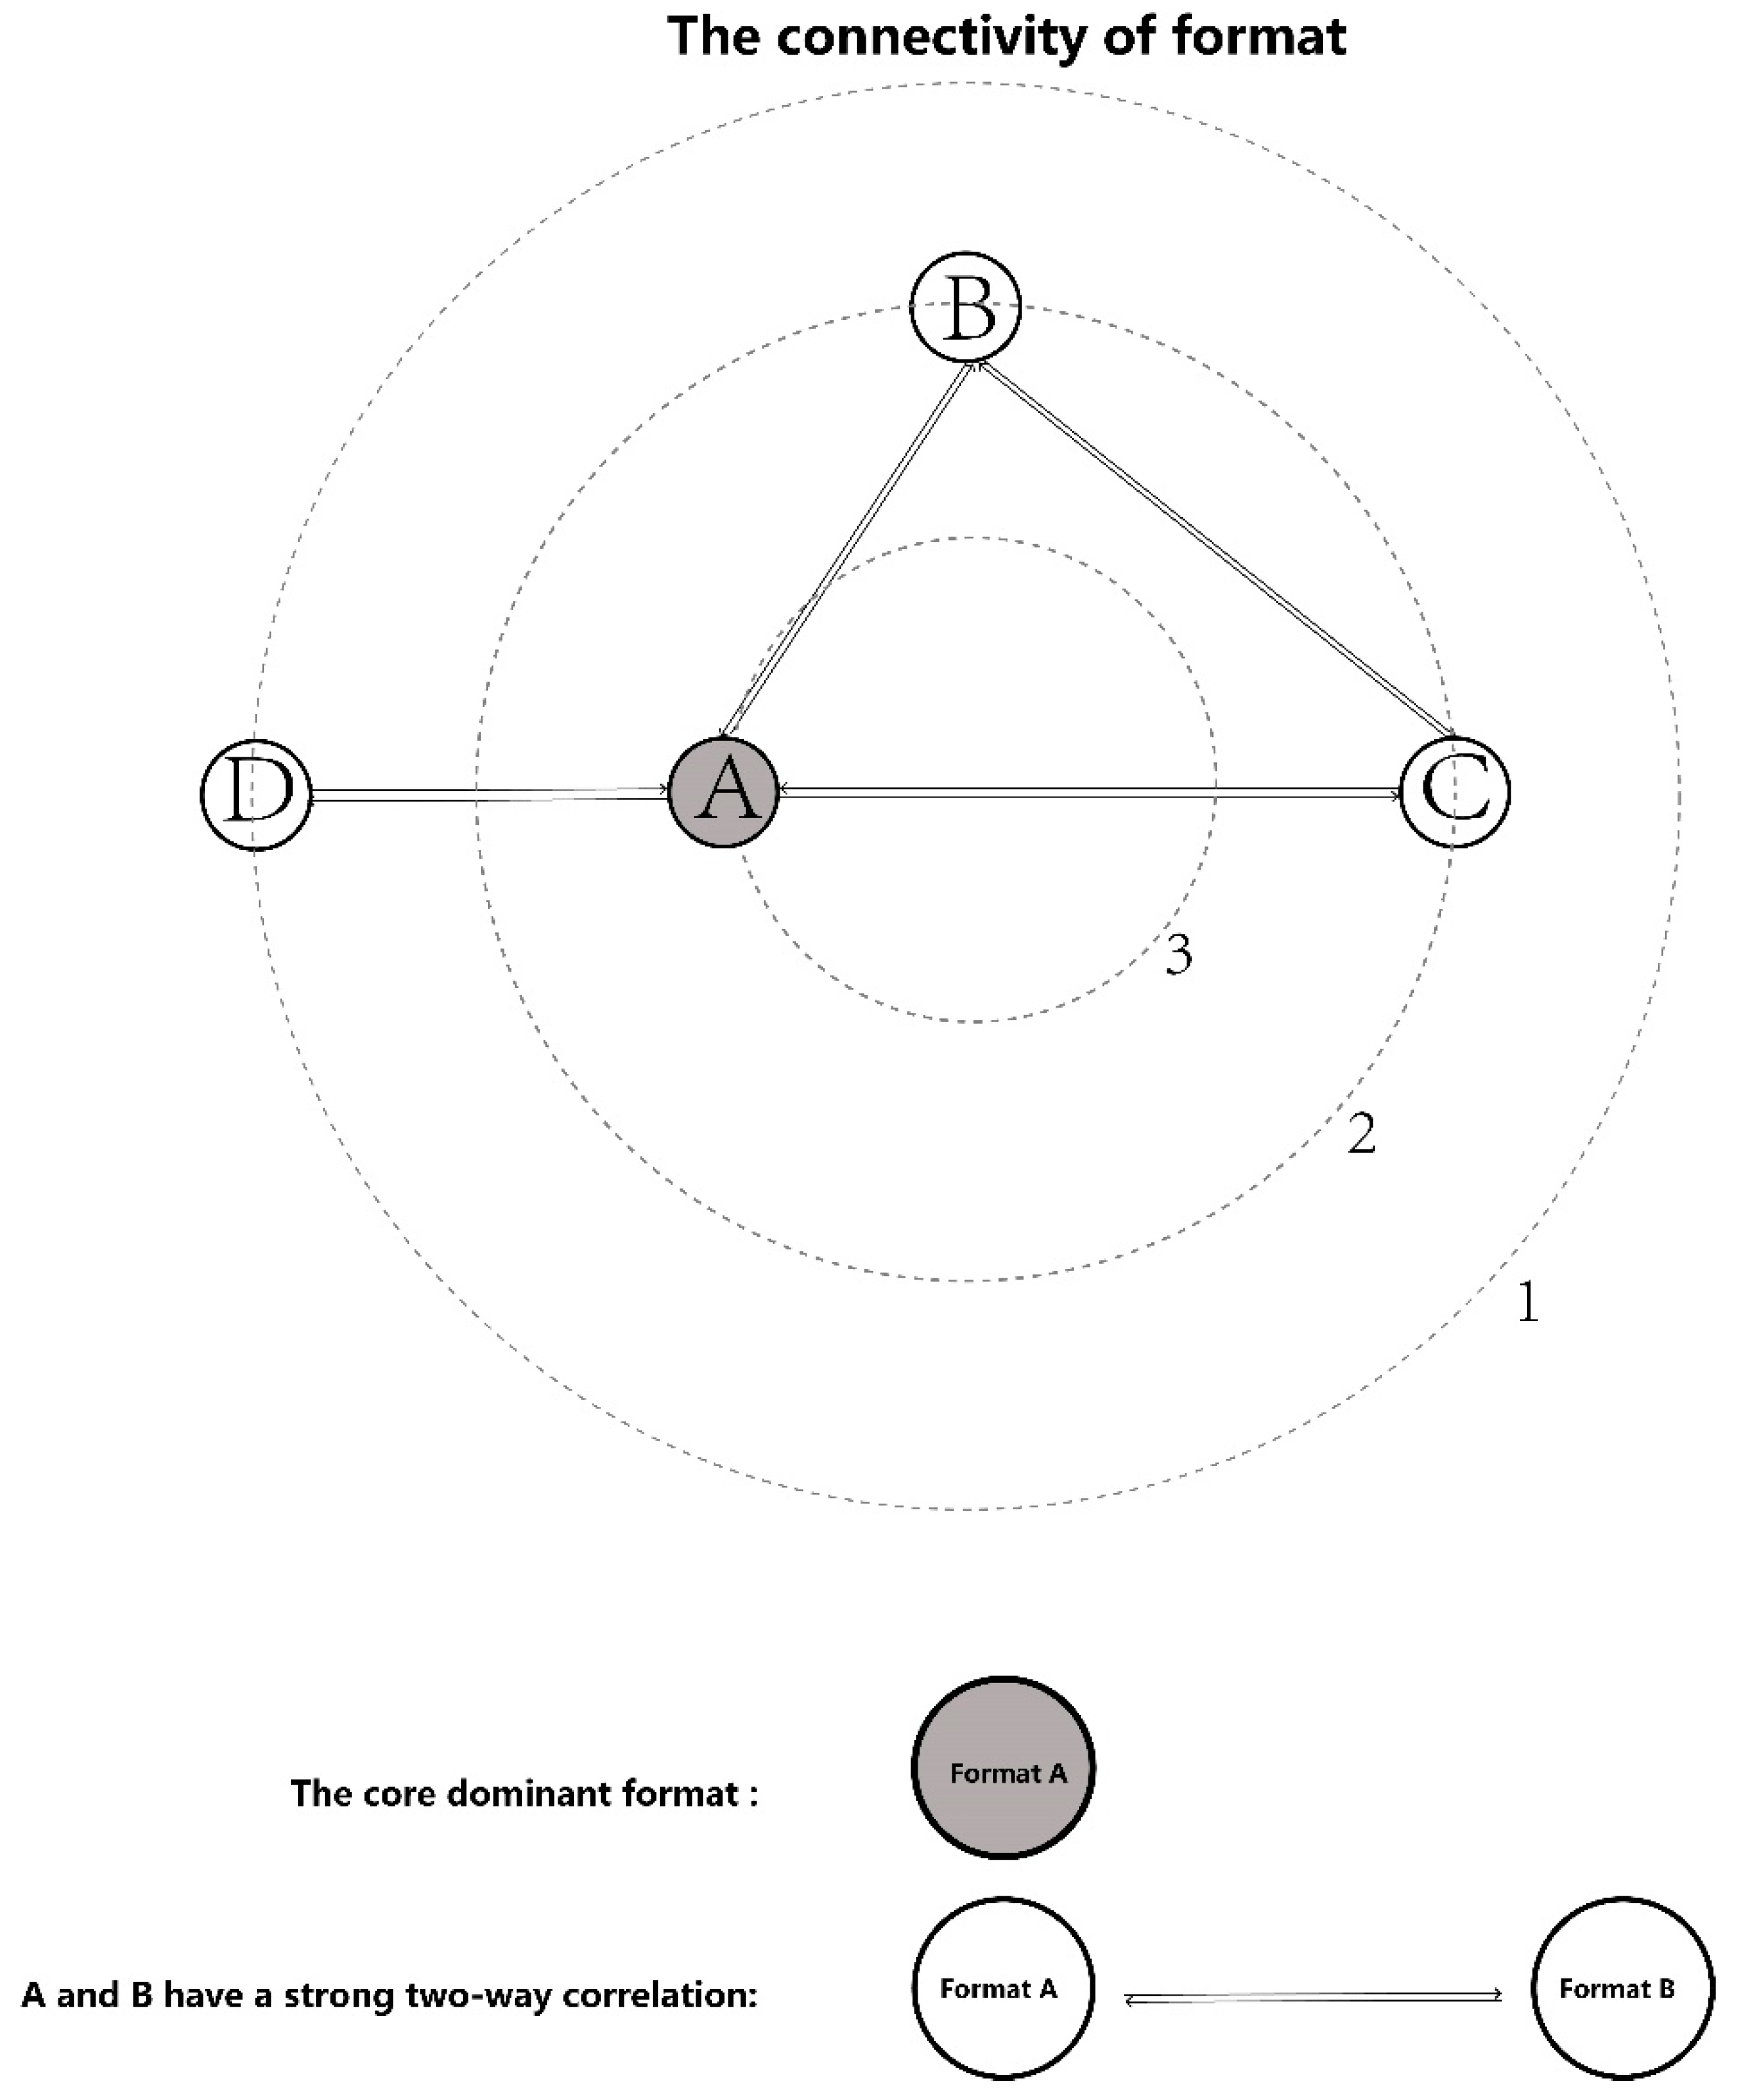
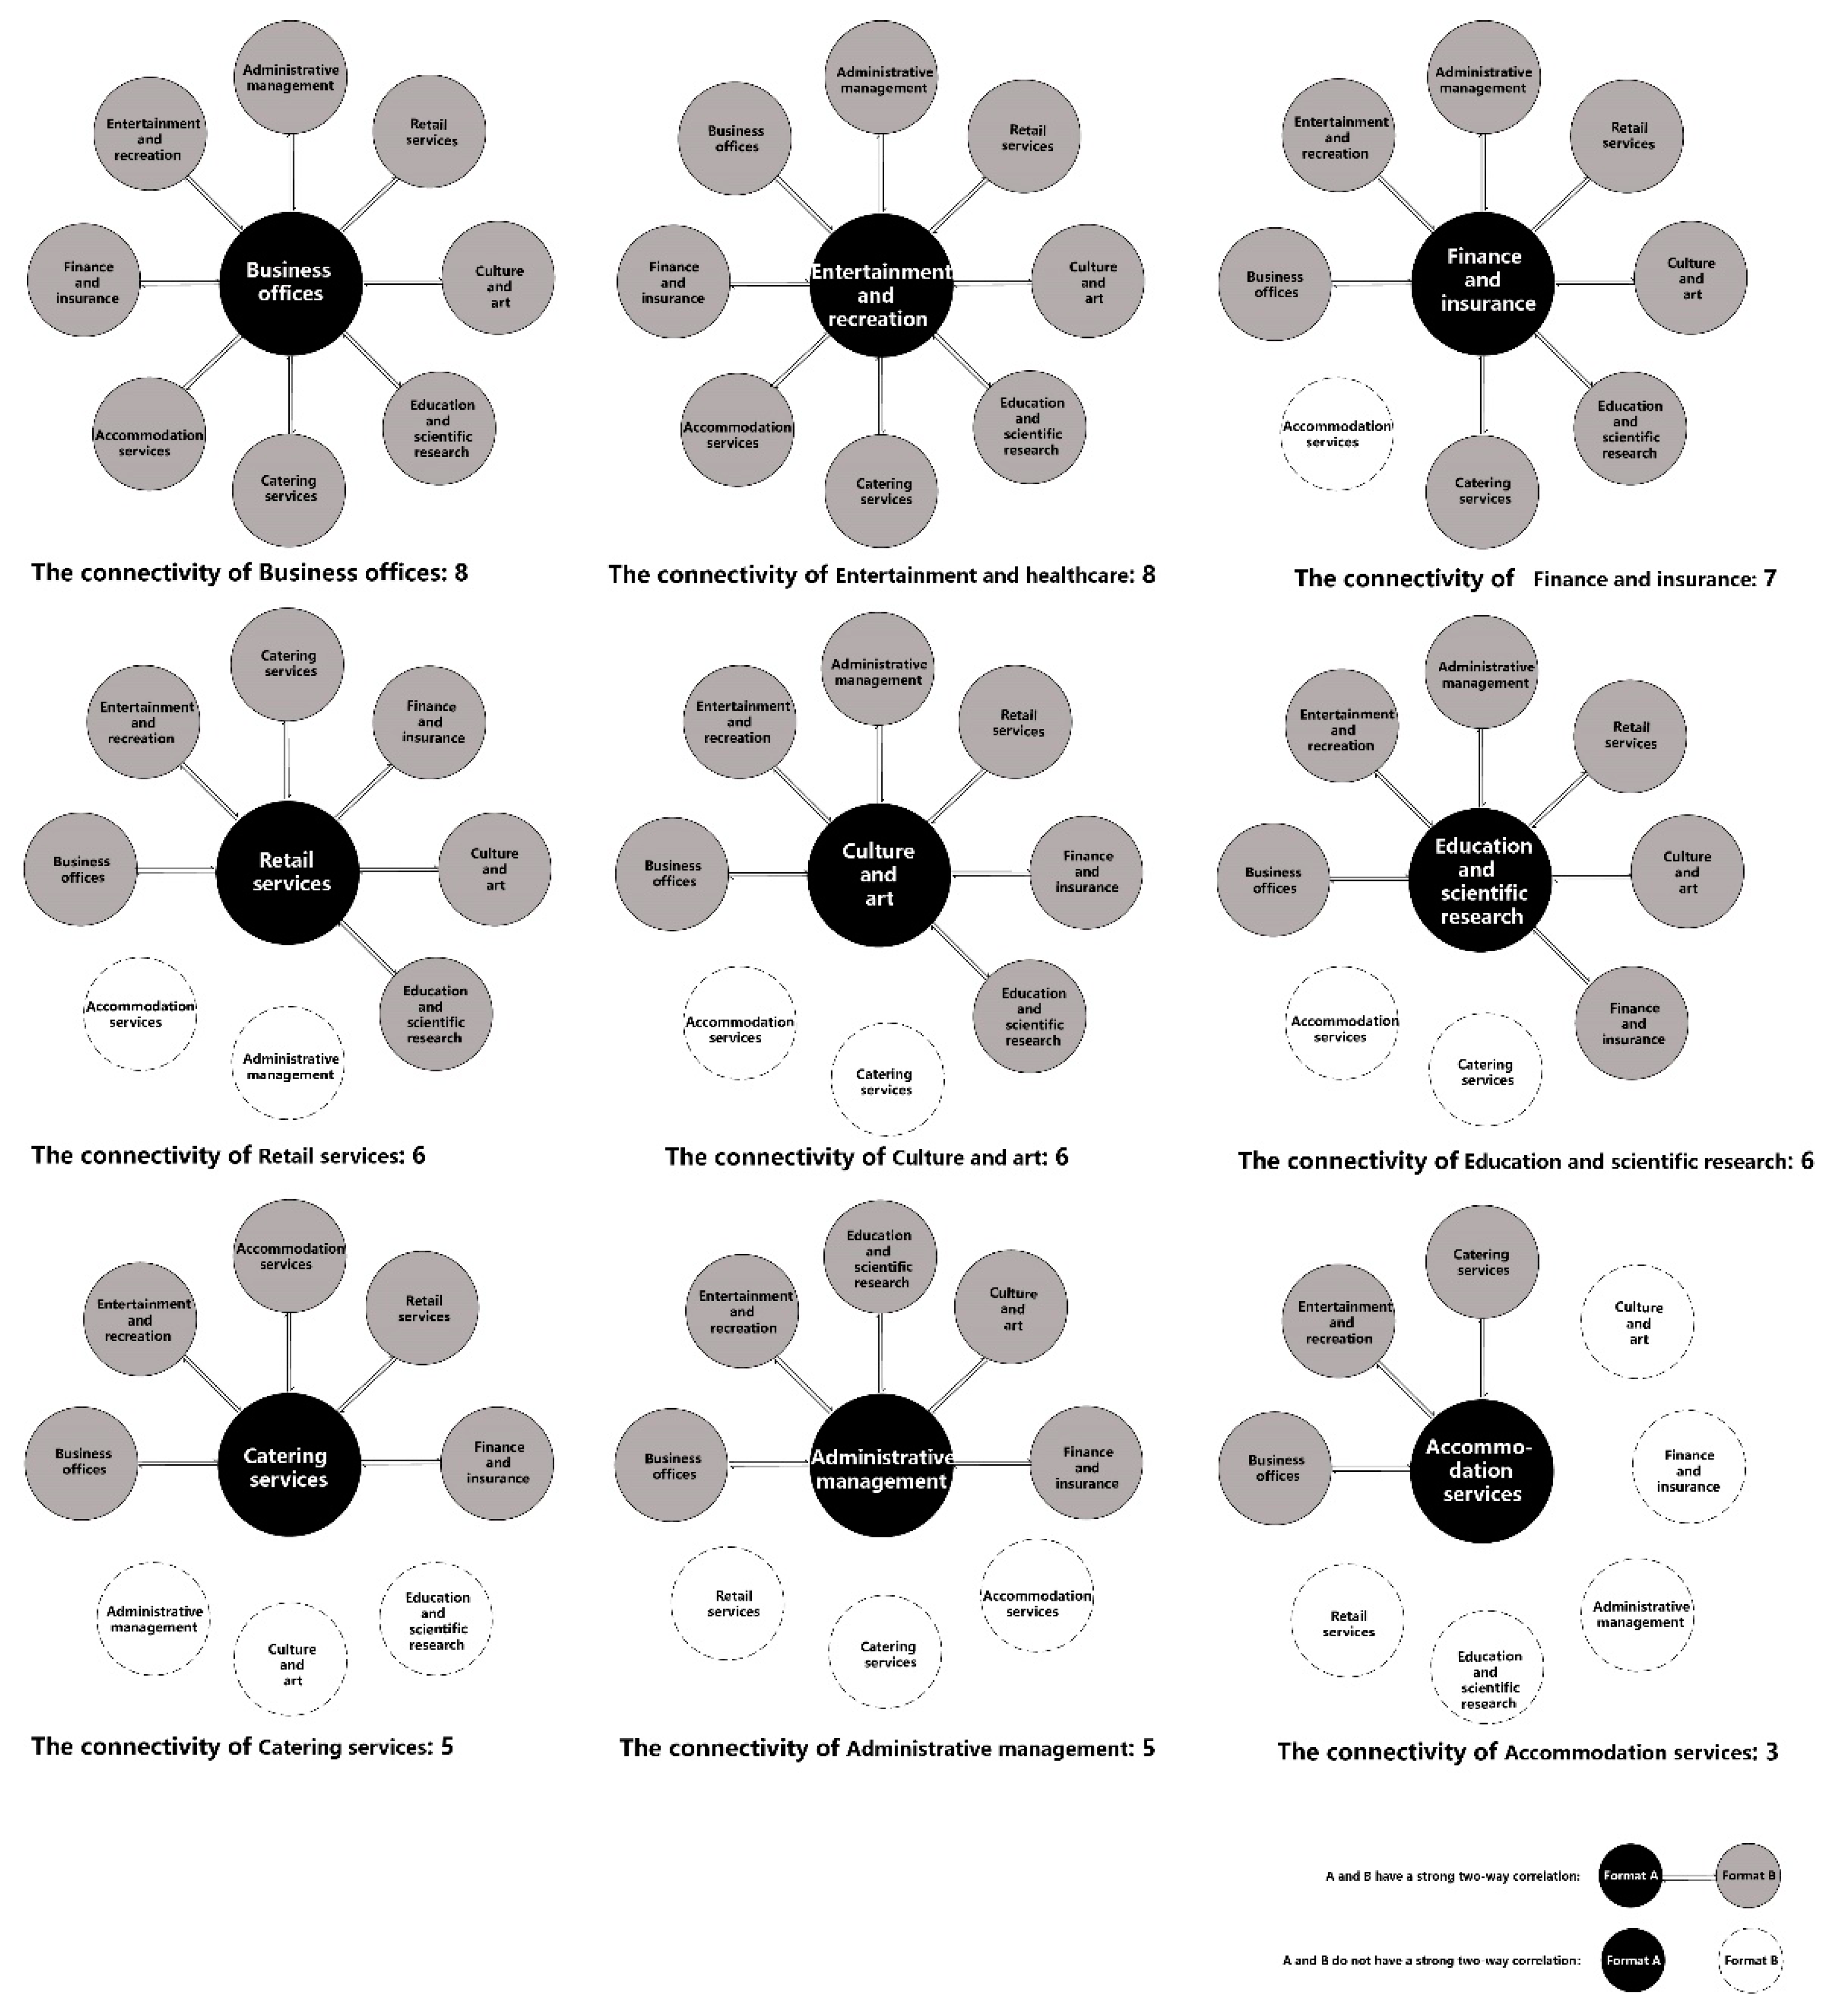
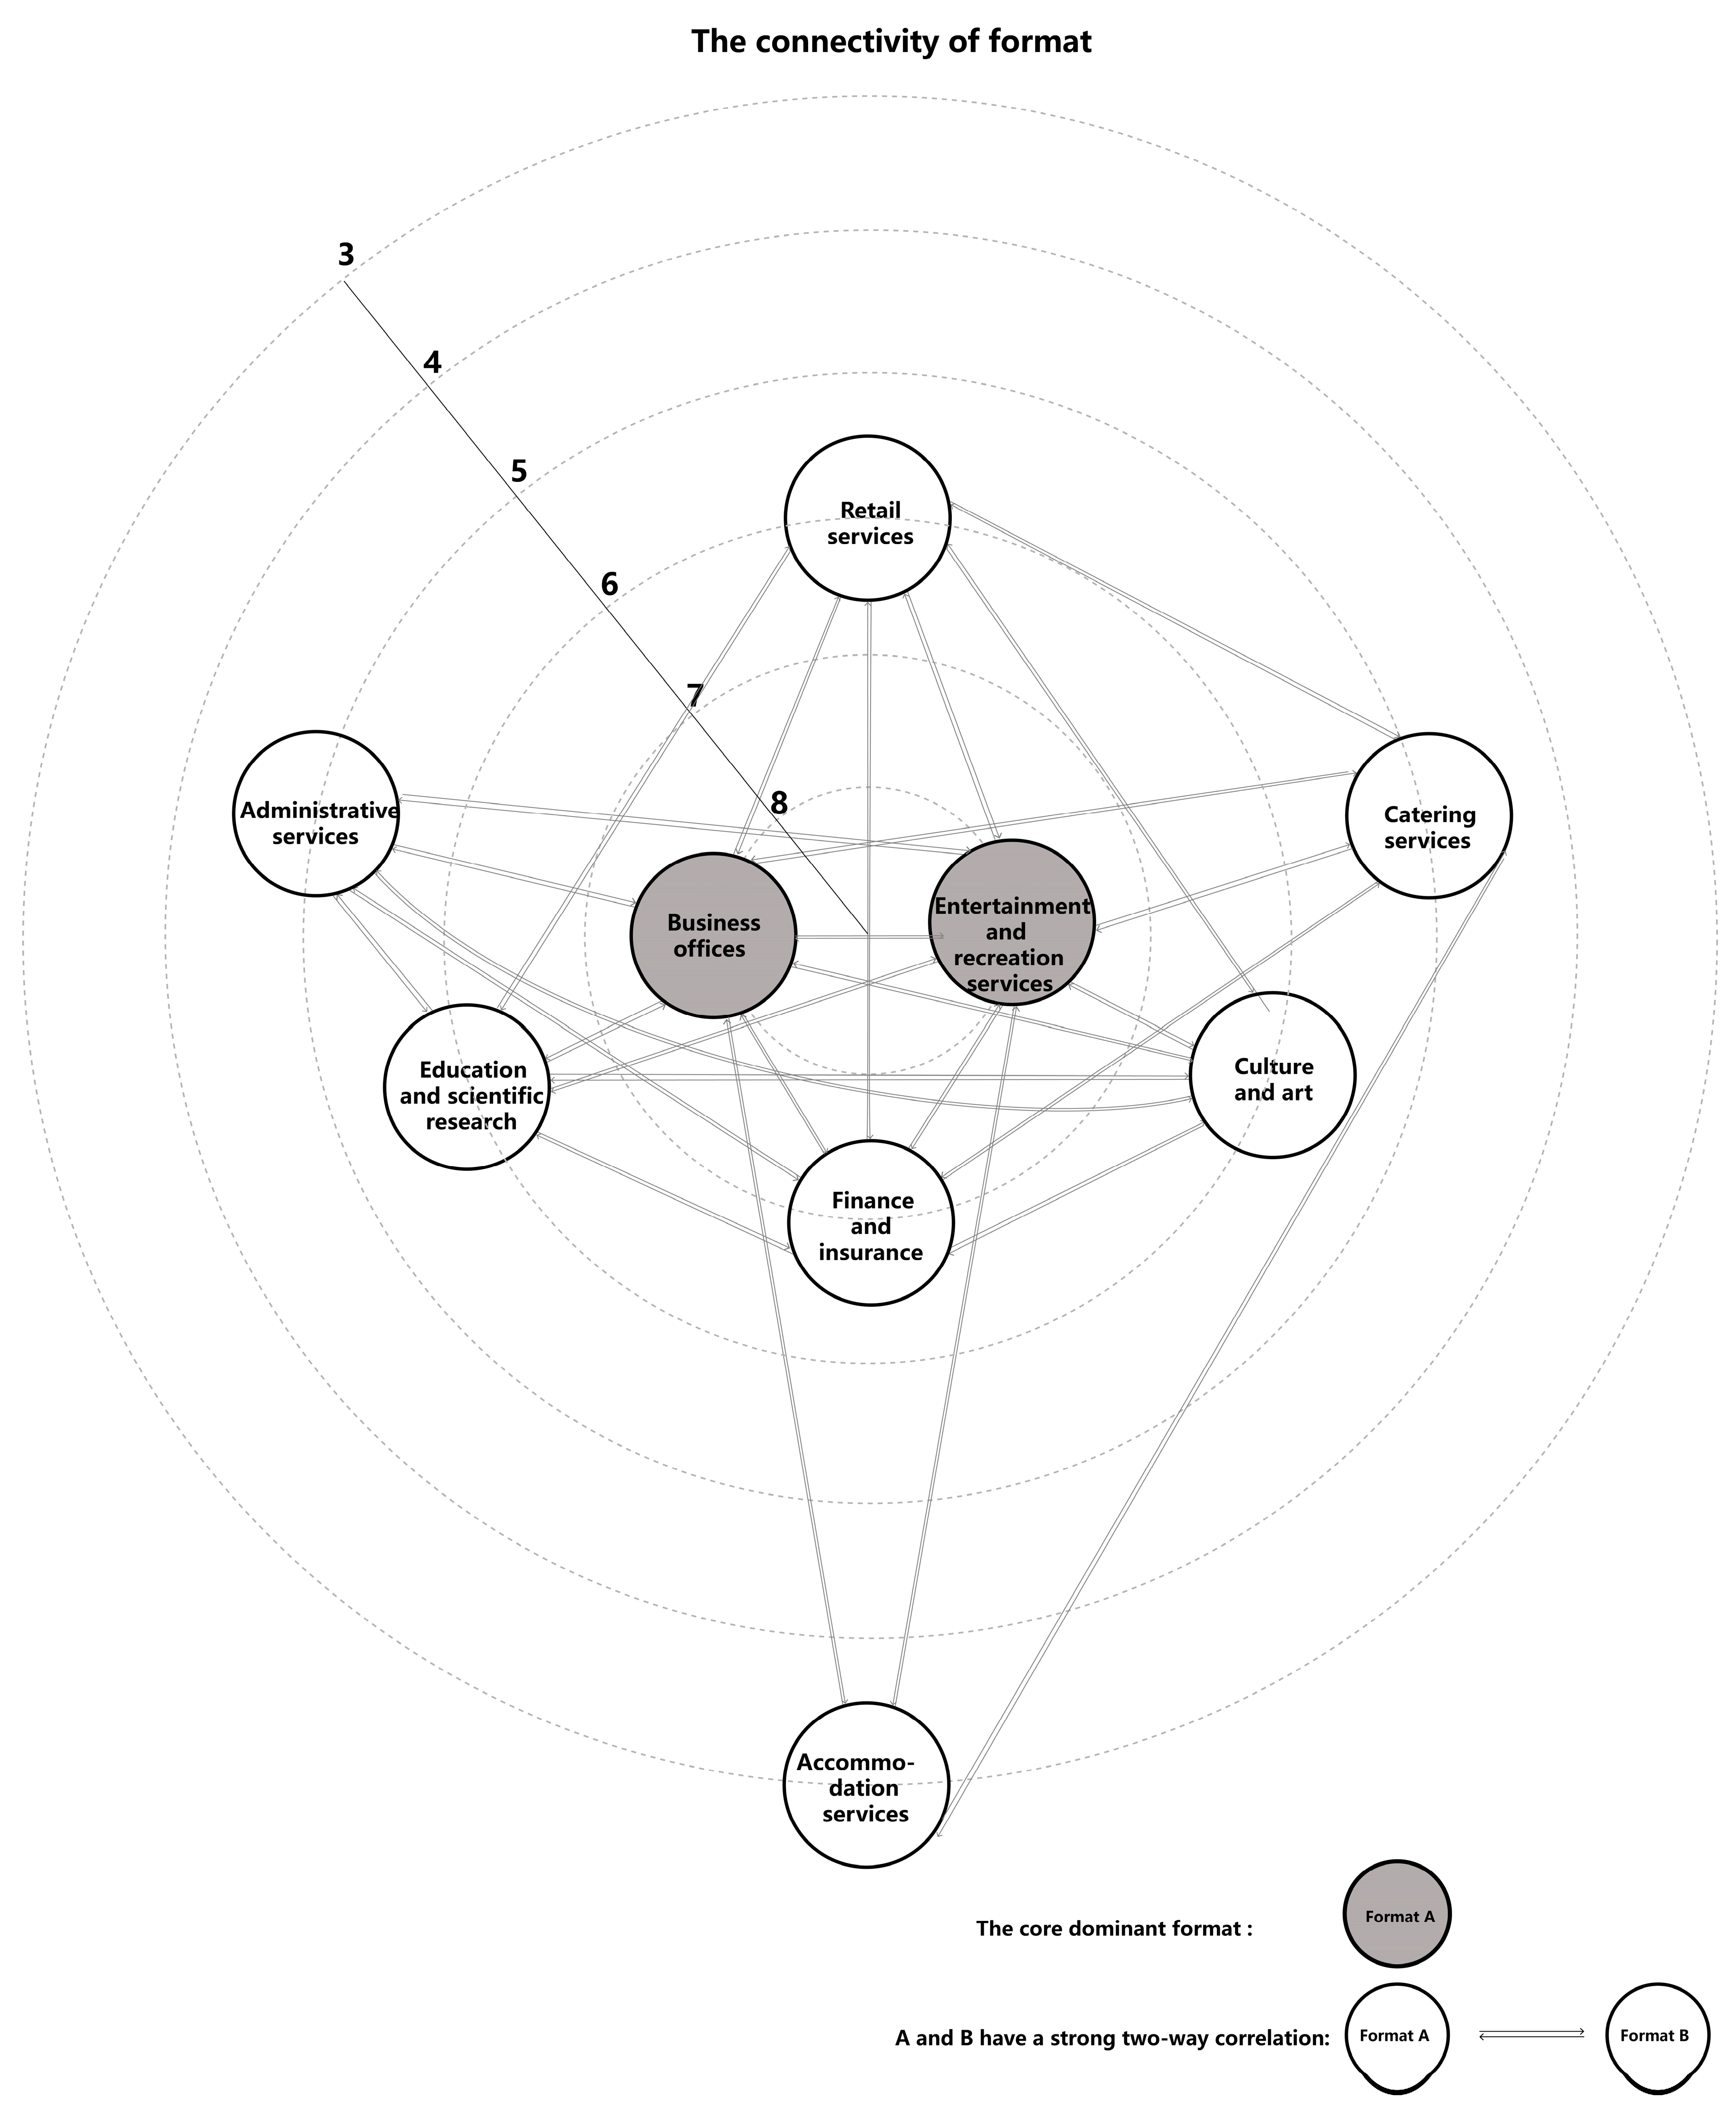
2.4. Format Connectivity

Connectivity has previously been used in space syntax [21] and refers to the number of all space nodes connected to any node in a space system when it is the measurement object. It shows the degree of spatial connection between the nodes within a space. The higher the connectivity within a space, the better the permeability of the space. To express the degree of spatial correlation of the overall format structure at a network level, this study applies the concept of connectivity to the spatial relationships between formats and defines it as follows: the connectivity of formats is the number of all formats connected to any formats in the format association network when it is the target of measurement. The quantitative method of format connectivity can expand upon the previous spatial correlation between two formats, which shows the degree of correlation and spatial relationship between formats in the overall format network structure. The specific steps (including an illustrated description) are as follows: First, according to Hu’s summary of the spatial relationship between two formats, the two formats with a connection (strong two-way correlation) are summarized in Table 4. Among them, we believe that only when the spatial relationship between the two formats is a strong two-way correlation, these formats will converge with each other spatially and the two formats will have a connection. Otherwise, there is no connection between formats (Figure 5).
Second, all the connections between two formats are summarized to form an interconnected format association network structure according to all the connections between paired formats and their connectivity (Table 5 and Figure 6).
Finally, we found the connectivity of each format according to the format association network structure and then determined the hierarchy through the connectivity of each format. If the format is more connected, it indicates that the format is more important in the format association network, with a higher level and stronger core.

3. Results

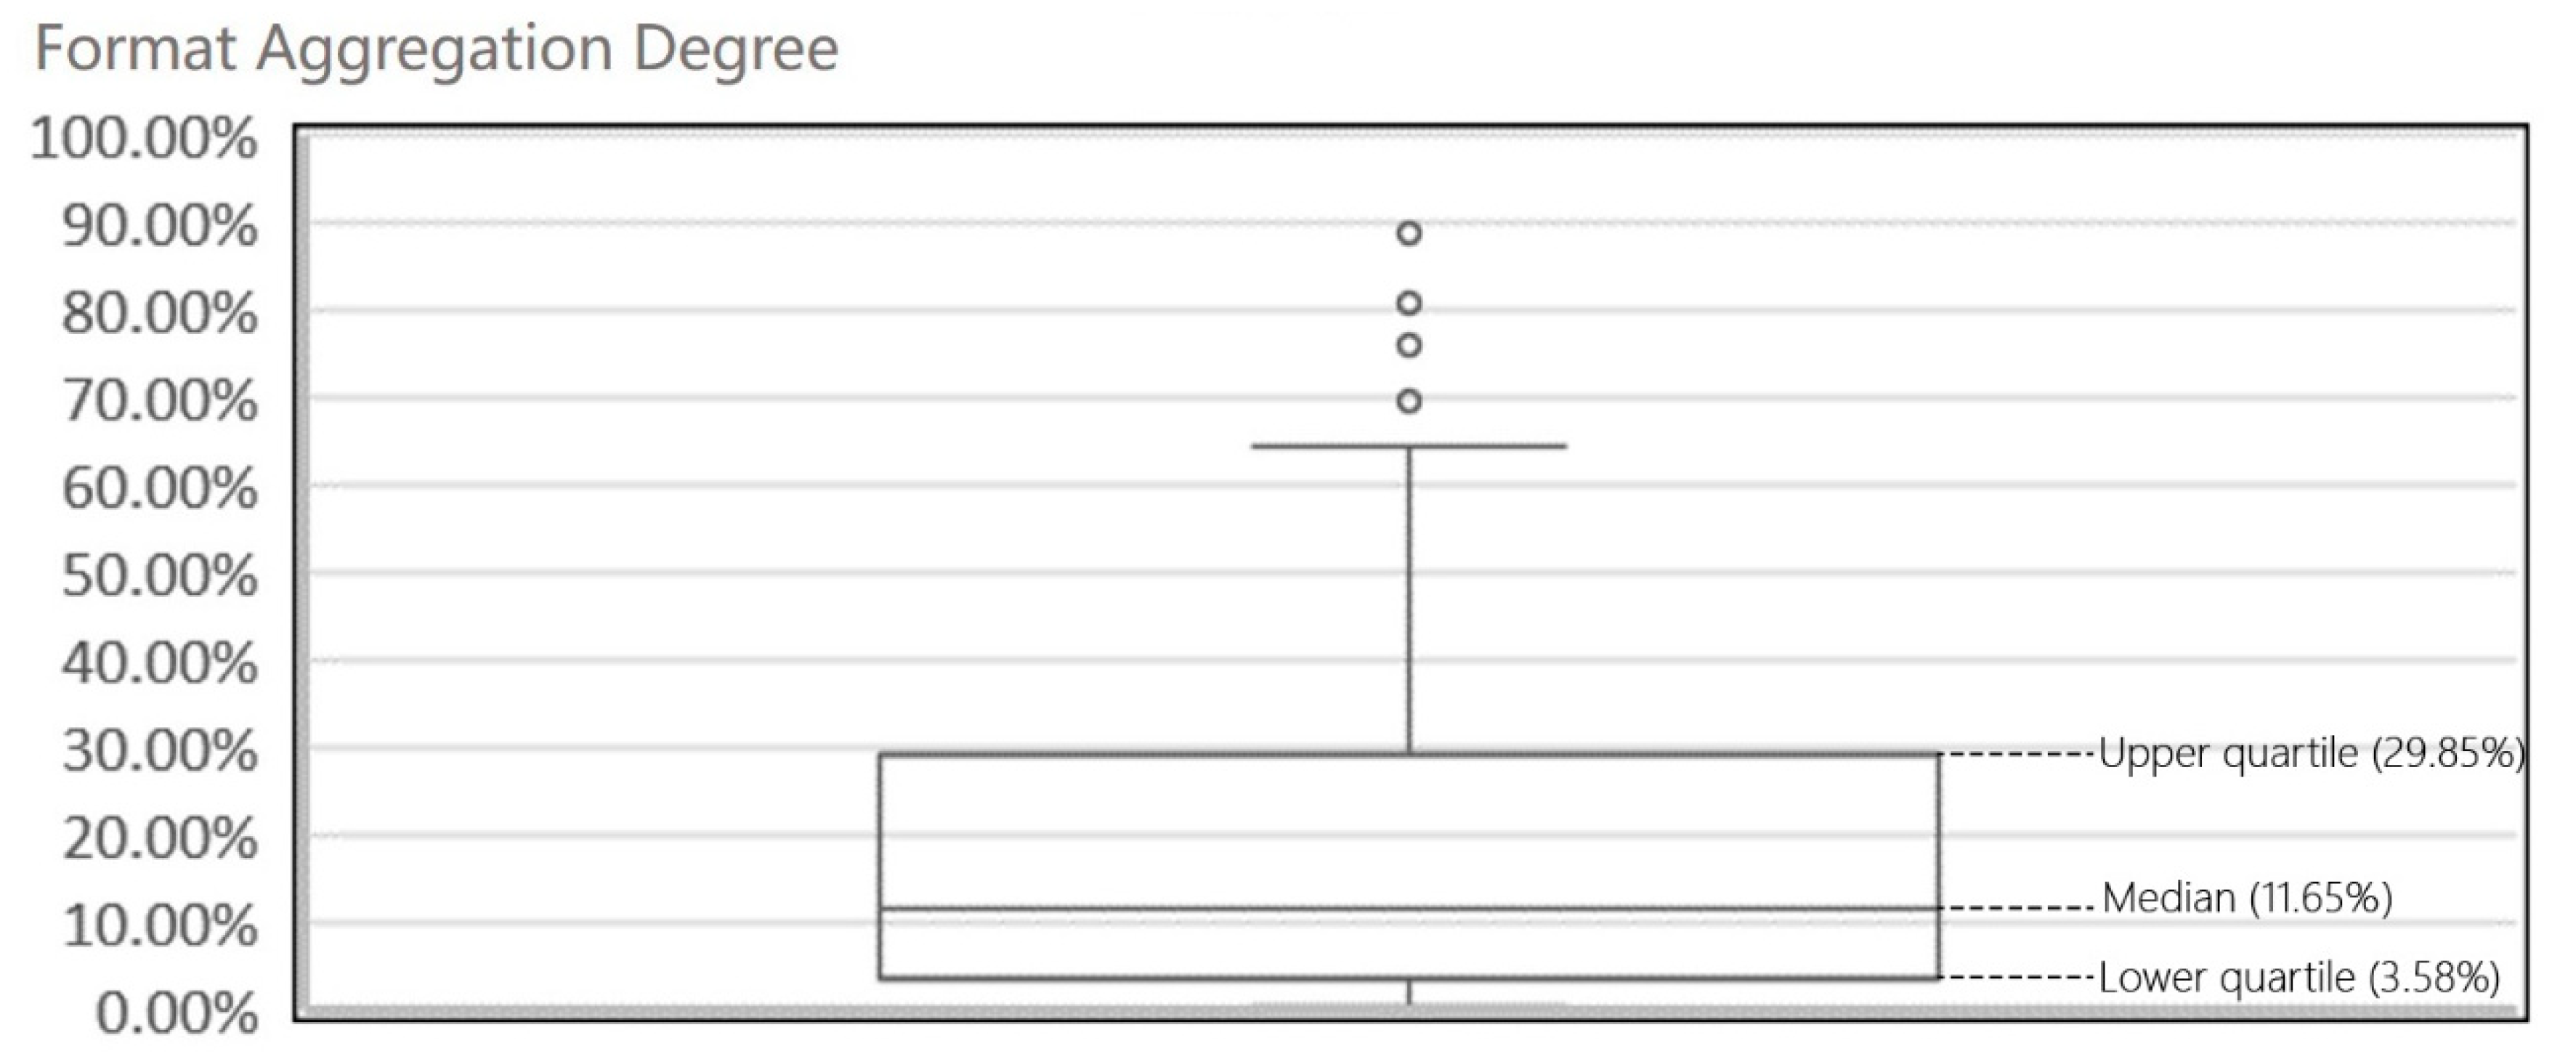
3.1. Degree of Format Aggregation

Referring to our calculations and the analysis of the degree of format aggregation, we present the strongest pairwise connected formats in Table 6. It can be seen that the formats with strong two-way associations occur in the following nine formats: administrative services, culture and art, education and scientific research, retail services, entertainment and recreation services, accommodation services, finance and insurance, business offices, and catering services.

3.2. Spatial Statistical Results

According to the steps above and Hu’s summary of spatial relationships between two formats, the two formats with a strong two-way correlation are summarized and the spatial connections between any one format and the other formats are expressed spatially in Figure 7. Table 7 summarizes the connectivity of each format.
Next, all the paired formats that have connections are summarized in Figure 8 to form an interconnected format association network structure.
Finally, the figure above shows the connectivity of each format according to the format association network structure as well as the hierarchy through the connectivity of each format. The connectivity of formats refers to the number of all formats connected to any one format being measured within the format association network. As shown in Figure 8, the eight formats with strong two-way correlations with business office include administrative services, retail services, culture and art services, education and scientific research services, entertainment and recreation services, financial and insurance services, accommodation services, and catering services. This means that the connectivity of the business office format is eight. Similarly, the connectivity of financial and insurance is seven, and that of administrative service is five. The numerical distribution is divided into two distinct levels. The formats in the first level have strong two-way correlations with all other formats, while those on the second level only have strong two-way correlations with some formats. Based on this, the first level is the upper level and the lower levels are dominated by the upper level. Moreover, the higher the level is, the closer the format is connected with other formats within the format association network, the higher its importance of the format is, and the closer it is to the core.
On the first level, we find business offices and entertainment and recreation services, the two business-oriented formats with the highest degree of connectivity and a value of eight. These formats are connected to all formats in the network except to themselves. This indicates that they have strong spatial correlations with all formats in the network. Additionally, due to the strong correlations between themselves and all of the other formats, they are able to gather different types of formats and thereby continue to strengthen their connectivity with other formats in a scale effect. This level of format has the strongest core and dominance within the format association network. Without them, the vitality of the format association network in the central districts will be reduced, making it difficult to maintain the vitality of the central district.
The second level includes seven formats: finance and insurance, retail services, culture and art, education and scientific research, administrative service, catering service, and accommodation service. This format level is not able to influence all other formats. The formats in this level have strong two-way correlations with some formats due to their different functional characteristics and capabilities. However, they will not form a strong two-way association with some other formats. Among them, the formats at this level with the highest connectivity is seven. This means that this format has a strong two-way correlation with seven other formats, all except accommodation service. Moreover, accommodation and catering services, education and scientific research, and culture and art are connected with the six other format types. Retail service is not connected with accommodation service and administrative management, but it is connected with the other six types of format. Therefore, the connectivity of retail service, culture and art, education and scientific research is six. The connectivity of catering service and administrative service is five. Among them, catering and accommodation services are operation-oriented while administrative services have non-operational functions, especially the administrative offices of the Chinese government. Administrative management has strong two-way associations with the composition of the other five formats, except for retail service, catering service, and accommodation service, while catering service has a strong two-way association with five formats within the network, excluding education and scientific research, administrative service, and culture and art. The connectivity of accommodation service is three. This format is only strongly correlated with entertainment and leisure service, business service, and catering service. In general, the format at this level only affects a small number of formats and its dominance and core within the format association network are weaker than those on the first level.

4. Discussion

This study proposes the two main characteristics of a format association network: that each format association network has a hierarchy and that the structure of the format association network is stable. It was found that there are two types of format in the format association networks of central urban areas, namely (1) core dominant formats and (2) non-core dominant formats.

4.1. Characteristics of the Overall Structure of Format Association Network

4.1.1. Each Format in the Format Association Network Has Hierarchy

This hierarchy is due to the strong core of formats in the network which is, in turn, due to the strong competition within a format. In this network, it is easier to compete for the advantage of location, which—through its own scale effect and synergies with other formats—leads to the formation of different types of format convergence and the replacement of unnecessary formats. The network has always maintained its own core attributes and the rest of the formats according to their own connectivity levels.

4.1.2. The Format Association Network Structure Is Stable

Stability in the format association network structure refers to the stable format among the two levels and within each level. This trend can be observed from the following factors: first, concerning the external factors, the industry association network is formed by many businesses through strong two-way correlations, ensuring that the network itself has a certain stability. Moreover, due to the strong aggregation of these formats within the space, these connections will not be easily broken due to changes in external factors. Second, from the perspective of the internal format of the system, the supply and demand of a single format will promote the development of other formats and the formats will adapt through the correlation network and internal synergy. This is especially true for the two central districts in Shanghai used in this study, as they are relatively mature and large in scale. With the long-term development and self-adjustment of the central districts, different formats have maintained a relatively stable proportion.

4.2. Characteristics of Formats at All Levels

The first level of formats is the core dominant format and includes business offices and entertainment and recreation services. First, in terms of their correlation with other formats, these two formats have the highest degree of connectivity with other formats and the closest connectivity with other formats, which can influence most formats and play a central role in the entire network. Second, from an economic perspective, strong market rules dictate that for an economic district to maintain strong vitality, the central area must offer a large number of formats—such as fitness and entertainment, commerce, and office formats—to provide for a large number of consumers. This makes these two formats the largest land users in central or downtown areas. Therefore, this type of format is the driving force for the development of other formats, making them the core dominant formats.
The second level includes seven formats: finance and insurance, retail services, culture and art, education and scientific research, administrative service, catering service, and accommodation service. These types are non-core formats. In these types of format, there are generally two trends. First, finance and insurance, retail services, culture and art, and education and scientific research are auxiliary type formats. Although auxiliary formats cannot affect all the other formats in the network as much as the core dominant formats can, it can provide professional support and technical guarantees for the high-level formats and the internal format. It simultaneously promotes the self-competition of finance and insurance, retains financial institutions with high comprehensive ability, eliminates relatively low financial institutions, and maintains a certain stability. For example, when the business office format develops to a higher level, the demand for monetary transactions increases. The financial and insurance format then provides a guarantee for the monetary security and capital turnover of business office and assists in the development of business offices. Additionally, the rise of cultural arts and aesthetic education due to the vigorous development of cultural and artistic functions such as gallery formats leads to the development of education formats such as drawing and painting. Galleries and artists will assume education agencies such as class counselling, meaning that the format will also undertake exhibitions in galleries, causing the culture and art and the education and scientific research formats to provide a continuous supply and demand through professional auxiliaries, promoting the development of the formats involved. Second, catering, accommodation, and administrative services are non-core dominant formats. For example, the administrative service is a non-operating function, mainly the administrative service of the Chinese government. This format not only needs to cover all regions in the city, but also depends upon the government’s uniform decisions concerning distribution. It does not always follow the laws of market economy, has weak connectivity with other formats, and has no dominant characteristics within the format association network. However, it fulfils the basic needs of residents in the central area. Catering service and accommodation service also belong to the non-core dominant format type and is related to basic human needs and behavior. For example, services such as social clubs to watch movies and play games or businesses providing entertainment and sports leisure activities such as meals and accommodation is often associated with casual events. This format therefore addresses physical needs and basic demands, which are not limited to the central or downtown areas. Therefore, even though these formats are basic, they are indispensable.

4.3. Limitations

The purpose of this study is to provide a basic reference for a functional model and development mechanism of future research using the existing format association network and the connectivity between formats. The results may simultaneously prove helpful for spatial planning and related decision-making processes concerning the central areas of megacities. We chose Shanghai to perform an in-depth investigation and to present an exploration of the spatial relationships between formats in megacities in Asia. However, we did not consider the perspective of consumer demand and consumption mode. Furthermore, there are significant differences between European and American (Western) cities and Asian cities. The fact that the development of Asian cities depends upon their own functional preferences cannot be ignored. These preferences may be economically, politically, or culturally motivated. Future studies therefore need to employ this research method to evaluate the format relationships in the central areas of other megacities in Asia, Europe, and the United States to verify and expand our research.

4.4. Conclusions

This study is based on sufficient and accurate experimental data. We hope that our analysis presents objective predictions concerning urban planning and management for the future and that it provides valuable policy suggestions for urban planning managers.

4.4.1. Considering the Type of Central Business and Its Layout, We Need to Consider Consumer Demand and Consumption Mode Changes

The results show that business offices and entertainment and recreation services are connected with all other formats in the network, meaning that these are the core dominant formats. This differs from the traditional idea that the retail and business office formats are the dominant formats. We found that along with the improvement of consumers’ living standards, consumers have higher expectations of both the products and services they use and their spiritual life. In the past, people have tended to base their shopping and consumption mainly on buying necessary commodities, which was also the reason for the success of department stores in the 20th century. Entering the 21st century and the information age, online sales have become mainstream, causing a sharp decline in the traditional retail format. People also tend to want their experiences to be entertaining and interactive. This type of consumer to consumer shopping is the ultimate goal, along with keeping consumers in cities’ central districts and increasing the number of consumer visits. Therefore, entertainment services such as cinema and social clubs should be offered as recreation services.

4.4.2. The Spatial Layout of Business Formats Is Not Isolated and the Correlation of Different Formats Should Be Fully Utilized

A shopping center is an area that integrates shopping with leisure and entertainment. Due to its versatility and high attraction, it is guaranteed to create popularity within the district. However, shopping centers rely on lease income to obtain a long-term stable cash flow. After certain conditions are reached, it performs asset packaging and listing financing as a means to relieve the financial pressure of business office. Furthermore, the proportion of the business office format in the central districts of Shanghai is relatively large, which provides shopping centers with a large and stable population base. Moreover, concerning the provision of people’s basic needs, business offices will lead to an increase in catering services. The characteristics of each type of format determine its role in the central area of the city, and the relationship between the types of formats becomes an important factor affecting the development of the central district. Therefore, during practical planning, diversified formats should be combined to fully utilize the connections and complementarity between different formats, providing consumers with all-round services.

4.4.3. While Fully Utilizing the Spatial Correlation of Different Formats, the Differential Operation of Tthe Formats and the Stability of All the Formats’ Correlations Should Be Recognized

To avoid overly intense competition between similar formats caused by “blind” construction and development, it is not advisable to pursue the large-scale development of a certain type of format or of only certain formats. Therefore, we present the following models: when a certain format reaches saturation in a central district, caution should be applied concerning the supply of the format to avoid entering the field too strongly. When the products of a certain type of format in a central district have not reached saturation and there is a certain market demand, competition can be facilitated by providing differentiated products or by introducing benchmark products to promote the upgrading of the regional value. When the product of a certain type of format in the central area is scarce and has a strong market demand, the supply of the product can be considered to be appropriately increased and accelerated. These measures may balance the supply and demand of the businesses in central districts, ensuring the stability of the entire network as well as steady development in the central area.

Author Contributions

Conceptualization, X.H. and J.Y.; Formal analysis, X.H. and J.Y.; Investigation, X.H., H.Y. and Z.Z.; Methodology, X.H., H.Y. and Z.Z.; Writing—original draft, X.H. and H.Y.; Writing—review & editing, X.H. and H.Y.

Funding

This research was funded by [the National Natural Science Foundation of China], grant number [No. 51708296]; [Jiangsu Government Scholarship for Overseas Studies]; [Top-notch Academic Programs Project of Jiangsu Higher Education Institutions], grant number [PPZY2015A063] and [A Project Funded by the Priority Academic Program Development of Jiangsu Higher Education Institutions].

Conflicts of Interest

The authors declare no conflict of interest.

References

  1. Kanemura, E. Reexamination of the theoretical hypothesis about the occurrence and development of retail industry on the premise of retailing categories. Bull. Grad. Sch. Commer. (Waseda Univ.) 36. (In Japanese)
  2. Ye-Feng, W. Industry formats: The theoretical evolution of retail formats. Ind. Econ. Rev. 2013, 4, 27–38. (In Chinese) [Google Scholar]
  3. González-Hernández, E.M.; Orozco-Gómez, M.A. segmentation study of Mexican consumers based on shopping centre attractiveness. Int. J. Retail Distrib. Manag. 2012, 40, 759–777. [Google Scholar] [CrossRef]
  4. Luceri, B.; Latusi, S. The cross-shopping behaviour: Patterns of store format mobility in the apparel sector. Int. J. Retail Distrib. Manag. 2016, 44, 89–104. [Google Scholar] [CrossRef]
  5. Ferreira, D.; Paiva, D. The death and life of shopping malls: An empirical investigation on the dead malls in Greater Lisbon. Int. Rev. Retail Distrib. Consum. Res. 2017, 27, 317–333. [Google Scholar] [CrossRef]
  6. Koschmann, A.; Isaac, M.S. Retailer Categorization: How Store-Format Price Image Influences Expected Prices and Consumer Choices. J. Retail. 2018, 94, 364–379. [Google Scholar] [CrossRef]
  7. Calvo-Porral, C.; Lévy-Mangin, J.-P. Profiling shopping mall customers during hard times. J. Retail. Consum. Serv. 2019, 48, 238–246. [Google Scholar] [CrossRef]
  8. Miao, M. Do the different store formats of the same brand matter to Chinese customers? An International study on a Japanese fashion brand. J. Glob. Fash. Mark. 2019, 10, 18–34. [Google Scholar] [CrossRef]
  9. Cardinali, M.G.; Bellini, S. Interformat competition in the grocery retailing. J. Retail. Consum. Serv. 2014, 21, 438–448. [Google Scholar] [CrossRef]
  10. Yang, C.; Lan, S.; Huang, G.Q. Revenue sharing model in New Hong Kong’s warehousing business paradigm. J. Ambient Intell. Humaniz. Comput. 2019, 10, 883–892. [Google Scholar] [CrossRef]
  11. Berman, B. Flatlined: Combatting the death of retail stores. Bus. Horiz. 2019, 62, 75–82. [Google Scholar] [CrossRef]
  12. Maeda, T.; Wakana, S. Establishing International Standards for Information Exchange Between Platforms to Realize Connected Monozukuri. Fujitsu Sci. Tech. J. 2019, 55, 9–13. [Google Scholar]
  13. Noh, G.-H.; Chung, D.-J.; Cho, C.H. The Influence of Outlets on Surrounding Stores: Focused on Yeoju Premium Outlets. J. Channel Retail. 2019, 24, 1–23. [Google Scholar]
  14. Lin, G.; Xu, X. Forming mechanism of spatial structure of commercial types in Guangzhou city. J. Geogr. 2004, 59, 755–762. (In Chinese) [Google Scholar]
  15. Yoon, H. Interrelationships between retail clusters in different hierarchies, land value and property development: A panel VAR approach. Land Use Policy 2018, 78, 245–257. [Google Scholar] [CrossRef]
  16. Hu, X.Y.; Zhang, Z.H.; Yang, J.Y. Spatial Correlation of Formats in the Central Districts of a Megacity: The Case of Shanghai. Sustainability 2019, 11, 1658. [Google Scholar] [CrossRef]
  17. Hu, X.; Yang, J. Quantitative analysis of the urban factors limiting central district plane form expansion: Twenty-one case studies of Asian megacities’ central districts. J. Asian Archit. Build. Eng. 2018, 17, 345–351. [Google Scholar] [CrossRef]
  18. Shanghai Bureau of Statistics, Shanghai Survey Team of National Bureau of Statistics. Statistical bulletin of Shanghai national economic and social development in 2018. Stat. Sci. Pract. 2019, 413, 13–23. (In Chinese) [Google Scholar]
  19. Jing, S.; Lei, H.; Guangwei, H. Research on the development speed index of government data opening -based on the evaluation of Chinese provincial government data opening platform. Intell. J. 2018, 37, 160–167. (In Chinese) [Google Scholar]
  20. Shi, Y.; Hu, X.; Yang, H.; Yang, J. Format compositions and spatial distribution characteristics of central districts in megacities: People’s Square and Shanghai’s Lujiazui District. Urban Des. Int. 2018, 1–11. [Google Scholar] [CrossRef]
  21. Hillier, B. The hidden geometry of deformed grids: Or, why space syntax works, when it looks as though it shouldn’t. Environ. Plan. B Plan. Des. 1999, 26, 169–191. [Google Scholar] [CrossRef]
Figure 1. Spatial distribution of formats in Shanghai’s central areas (Data source: author plotted).
Sustainability 11 05191 g001
Figure 2. Format density distribution map (data source: author plotted).
Sustainability 11 05191 g002
Figure 3. Thirty sample areas in the Shanghai central districts (data source: author plotted).
Sustainability 11 05191 g003
Figure 4. Distribution of scores showing a scattered format aggregation (data source: author plotted).
Sustainability 11 05191 g004
Figure 5. Spatial connection relationship between formats (data source: author plotted).
Sustainability 11 05191 g005
Figure 6. Format association network (data source: author plotted).
Sustainability 11 05191 g006
Figure 7. Spatial connection relationships between “X” format and other formats in Shanghai (data source: author plotted).
Sustainability 11 05191 g007
Figure 8. Structure of format association network in a Shanghai central district (data source: Author plotted).
Sustainability 11 05191 g008
Table 1. Total number and proportion of formats in the People’s Square.
Classification of FormatsNumber of Formats in People’s SquareFormat Proportions in People’s Square
Administrative management1258 Sustainability 11 05191 i001
Culture and art836
Education and scientific research613
Sports services98
Healthcare360
Social welfare44
Retail services13,004
Market services256
Catering services6353
Accommodation services684
Finance and insurance1333
Businesses8017
Entertainment and recreation1957
Traffic services129
Other services113
(data source: author plotted).
Table 2. Total number and proportion of formats in Lujiazui.
Classification of FormatsNumber of Formats in LujiazuiFormat Proportions in Lujiazui
Administrative management405 Sustainability 11 05191 i002
Culture and art307
Education and scientific research294
Sports services90
Healthcare139
Social welfare19
Retail services3869
Market services68
Catering services2168
Accommodation services322
Finance and insurance1186
Businesses4297
Entertainment and recreation853
Traffic services36
Other services65
(data source: author plotted).
Table 3. Degree of aggregation among formats in Shanghai’s two main central districts.
Administrative ManagementCulture and Art Education and Scientific ResearchSports ServicesHealthcareSocial WelfareRetail ServicesMarketing ServicesCatering ServicesAccommodation ServicesFinance and InsuranceBusiness OfficesEntertainment and HealthcareTransport ServicesOther Service Functions
Administrative management--22.43%16.06%2.04%9.74%2.16%48.11%2.77%27.60%7.10%24.17%48.53%18.46%4.09%3.37%
Culture and art23.36%--18.11%2.89%4.99%1.05%57.04%1.92%37.88%11.20%22.75%49.61%27.21%3.67%2.54%
Education and scientific research23.26%24.37%--2.32%10.58%0.55%59.98%2.21%41.46%10.25%27.78%54.58%28.34%3.09%4.19%
Sports services15.43%13.30%11.17%--5.85%1.60%52.66%1.06%42.02%18.62%17.02%45.21%44.68%1.60%5.32%
Healthcare21.00%12.60%13.60%2.20%--2.00%57.80%1.20%36.40%8.00%23.60%52.20%21.40%3.40%4.60%
Social welfare31.75%17.46%9.52%3.17%11.11%--49.21%3.17%30.16%6.35%11.11%34.92%17.46%3.17%6.35%
Retail services9.07%11.85%10.61%1.94%4.87%1.62%--8.49%64.29%10.93%20.45%56.40%31.13%1.49%3.14%
Marketing services11.42%7.10%4.94%0.62%1.23%0.62%80.86%--51.54%7.72%13.27%50.62%20.99%3.09%2.47%
Catering services7.73%9.68%8.52%2.30%4.30%0.68%75.97%4.28%--14.38%17.92%47.73%34.82%1.49%1.97%
Accommodation services11.03%12.52%8.25%3.28%3.58%0.50%61.03%1.89%54.77%--17.69%52.29%37.97%1.89%3.28%
Finance and insurance23.14%17.35%16.99%3.06%9.25%0.75%70.78%3.37%51.05%11.16%--72.09%29.85%9.17%4.72%
Business offices24.80%21.41%21.07%2.61%10.03%1.01%76.35%4.86%50.67%14.49%48.24%--30.49%9.67%8.79%
Entertainment and healthcare12.06%13.70%12.14%5.09%4.98%0.43%69.68%2.88%59.11%18.79%20.85%49.54%--2.06%2.42%
Transport services40.96%28.31%19.88%1.81%11.45%1.20%71.69%10.24%39.16%10.84%48.80%80.72%28.31%--4.22%
Other service functions20.79%15.73%14.61%3.93%13.48%2.81%78.09%3.93%51.69%17.98%43.26%88.76%28.65%3.37%--
(data source: [16]).
Table 4. Two formats with a connection (strong two-way correlation).
Two Formats with Connection/Relationship
AB
AC
AD
BC
(data source: author plotted).
Table 5. Format connectivity.
FormatConnectivity
A3
B2
C2
D1
(data source: author plotted).
Table 6. Formats with strong pairwise connections in the two central districts of Shanghai.
RelationshipFormat AFormat B
Strong two-way associationAdministrative servicesCulture and art
Administrative servicesEducation and scientific research
Administrative servicesFinance and insurance
Administrative servicesBusiness offices
Administrative servicesEntertainment and recreation services
Culture and artEducation and scientific research
Culture and artRetail services
Culture and artFinance and insurance
Culture and artBusiness offices
Culture and artEntertainment and recreation services
Education and scientific researchRetail services
Education and scientific researchFinance and insurance
Education and scientific researchBusiness offices
Education and scientific researchEntertainment and recreation services
Retail servicesCatering services
Retail servicesFinance and insurance
Retail servicesBusiness offices
Retail servicesEntertainment and recreation services
Catering servicesAccommodation services
Catering servicesFinance and insurance
Catering servicesBusiness offices
Catering servicesEntertainment and recreation services
Accommodation servicesBusiness offices
Accommodation servicesEntertainment and recreation services
Finance and insuranceBusiness offices
Finance and insuranceEntertainment and recreation services
Business officesEntertainment and recreation services
(data source: author plotted).
Table 7. The connectivity and hierarchy of Shanghai formats.
Format AThe Connectivity of Format A
Business office8
Entertainment and recreation services8
Finance and insurance7
Culture and art6
Retail services6
Education and scientific research6
Catering services5
Administrative services5
Accommodation services3
(data source: author plotted).

