Article

The Economic Effects of Research-led Agricultural Development Assistance: The Case of Korean Programs on International Agriculture

by
Sauk-Hee Park
1,*,† and
Kwang-Min Moon
2,†
1
Department of Public Administration, Catholic University of Korea, Jibong-Ro 43, Bucheon-Shi, Gyeonggi-Do, Bucheon 14662, Korea
2
Department of Public Administration, Chungnam National University, Daehak-Ro 99, Yuseong-Gu, Daejeon 34134, Korea
*
Author to whom correspondence should be addressed.
These authors contributed equally to this work.
Sustainability 2019, 11(19), 5224; https://doi.org/10.3390/su11195224
Submission received: 23 August 2019 / Revised: 17 September 2019 / Accepted: 20 September 2019 / Published: 24 September 2019
(This article belongs to the Section Sustainable Agriculture)

Abstract

:
South Korea’s Rural Development Administration embarked on the Korean Programs on International Agriculture (KOPIA) in six developing countries for agricultural development assistance in 2009, and the programs were undertaken in 21 countries in 2018. The purposes of the KOPIA are to introduce new agricultural technologies by cooperative research and development, and to extend developed technologies to farmers and agricultural businesses. In this paper, the economic effects of the KOPIA are estimated in 23 recipient countries in terms of their production and value-added inducement effect. In doing so, the inter-industry relation analysis method is used with an input-output table for each country from the Eora multi-region input-output (Eora MRIO) database. From the analysis between 2009 and 2017, the production inducement effect (PIE) by the KOPIA in the 23 countries is estimated to total US$99 million, accounting for 1.7 times its total budget of US$58.9 million, and the value-added inducement effect (VIE) in the 13 countries is estimated to total US$23.9 million. More importantly, the PIE and VIE continue to be higher in some countries, and the annual VIE tends to increase in most of the countries. These findings imply that the research-led KOPIA has contributed to agricultural development and further economic growth through inter-industrial relations in the recipients.

1. Introduction

According to the most recent World Bank’s estimates [1], about ten percent of the world’s population of 7.4 billion as of 2015 lives on less than $1.9 per day and the majority of the global poor live in rural areas. Reportedly between 62% and 75% of the 1.2 billion people living on less than $1 per day lived in rural areas in 2001 [2]. Hence, agricultural development is of the utmost significance for rural economic growth and improvement in living conditions in developing countries [3,4,5,6]. It is widely held that development in agriculture has a more positive effect on poverty reduction in developing countries than growth in the manufacturing and service sectors [7,8], and that agricultural income rests upon the growth of agricultural productivity [9].
Agricultural aid includes various forms, such as technological support for the improvement of agricultural productivity, institutional improvement to overhaul agricultural policies, the building of infrastructure, including irrigation and farmland arrangement, equipment supplies and storage for crop yields, and wide-scale rural infrastructure development. Among them, aid for agricultural technologies and technical skills are of more importance to agricultural development and rural economies. A large body of literature has so far held that technology-driven agricultural growth can make effective contributions to reducing poverty [2,10,11,12,13]. Likewise, the World Development Report [14] also puts a stress on technology in the development process, holding that technology increases productivity and creates new opportunities for jobs.
In this context, South Korea’s (hereinafter Korea) Rural Development Administration (RDA) launched the Korean Programs on International Agriculture (KOPIA) in 2009 to provide its advanced agricultural technologies and skills, and to develop agricultural resources together with recipient countries. The KOPIA was initially undertaken in six countries: Vietnam, Myanmar, Uzbekistan, Kenya, Brazil and Paraguay, and the number of recipient countries has grown, and now extends to 21 in Asia, Africa and South America as of 2018. The goals of the KOPIA, as an official development assistance (ODA) program, are to introduce and apply new agricultural technologies by cooperative research and development (R&D), and to extend developed technologies and skills to farmers and agricultural businesses. The functions of the KOPIA include, but are not confined to: (1) the research and development of technologies, and testing and extending developed technologies only in areas agreed with a recipient country; (2) to educate and train its researchers, government officers and farmers; (3) to provide Korean researchers with opportunities to conduct research and development in recipient institutions; and (4) to exchange technical information and publish research results and data for the cooperative programs. It is argued in some Korean literature that the KOPIA can give economic benefits to recipients despite its relatively small expenditure [15,16]. Its average annual budget from 2009 to 2017 was just US$6.5 million, ranging from $2.1 million in 2009 to $12.3 million in 2014.
However, there has been little research empirically analyzing the economic effects of the KOPIA on recipients. Hypothetically, the KOPIA could have a positive effect upon all of a recipient’s industries via inter-industrial relations. In terms of its economic benefits for recipients, an ODA program could increase the ultimate demand in related industries, and the increase can eventually enhance overall production and added-value in a recipient’s economy via inter-industrial relations. Accordingly, the main question of this study is to what extent the KOPIA contributes to an increase in production and added value across all industries. Thus, the economic effects of the KOPIA in 23 recipient countries were comprehensively estimated in terms of both production and value-added inducement effect. This can be said to be the originality of this study. In doing so, the inter-industry relation analysis method was used with the input-output (IO) table from the Eora MRIO database to estimate the effects in each recipient country.

2. Outline of the KOPIA

Global demand for Korea’s role and responsibility in ODA has continued to rise, and in particular, requests from developing countries to provide its advanced agricultural technologies and experiences have increased. In accordance with this, the RDA began to execute agricultural technology ODA projects. The number of KOPIA centers around the world was six at its inception in 2009, and then increased to 10 in 2010, 13 in 2011, 15 in 2012, 17 in 2013, and 20 in 2014 through 2017. During that period, the KOPIA centers in the Democratic Republic of the Congo and Peru were abolished in 2015, and in Brazil in 2016. Thus, the number finally reached 21 in 2018, as illustrated in Figure 1. The purposes of the KOPIA are: (1) To introduce and apply to recipients new and advanced agricultural technologies and technical skills by cooperative R&D with recipient institutions, (2) to extend developed technologies and skills to farmers and agricultural businesses of recipient countries, (3) to develop agricultural genetic resources with recipient institutions, and (4) to support domestic agricultural firms operating in recipient countries by providing technical advice. These goals can be compatible with the sustainable development goals (SDGs) endorsed at a session of the United Nations General Assembly in 2013.
Compared to ODA programs in agriculture by other domestic institutions such as the Ministry of Agriculture, Food and Rural Affairs (MAFRA), the Korea International Cooperation Agency (KOICA) and the Korea Rural Community Corporation (KRC), the total budget of the KOPIA is relatively small. Its total budget was only US$2.1 million in 2009, which increased to $4.3 million in 2011, $7.1 million in 2013, and reached a peak of $12.3 million in 2014, as shown in Table 1. It then continued to decrease to $10.1 million in 2015 and $6.7 million in 2017. However, this does not mean that the KOPIA has been less productive, but rather that it has made various achievements in agricultural and rural development through agricultural R&D, despite its small budget [15].
In general, as it takes a longer time to accomplish R&D in agriculture than in any other sector, a KOPIA center usually runs three- to five-year projects, which generally contain an extension of developed technologies to farm households and businesses, and demonstration projects after R&D completion. With these projects, the KOPIA could make a contribution to industrial growth for the recipients via inter-industrial relations. As of 2017, a total of 62 projects were undertaken in 20 countries, including 46 technology development projects, 10 developed technology extension projects and 10 demonstration village projects [17].
To briefly describe some examples of important crops developed in each KOPIA center, in Asia, the Vietnam and Sri Lanka centers had good products in vegetables and pulse crops like beans, Myanmar and Philippines in rice grains, Cambodia and Thailand in corn and poultry, Mongolia in wheat and animal feed crops and Uzbekistan in vegetables. In Africa, the Kenya center produced good outputs in livestock, as well as root and tuber crops like potatoes and sweet potatoes, Algeria in vegetables, wheat and barley, the DR of the Congo in rice and cassava (a tropical potato), Ethiopia in vegetables, Uganda in root and tuber crops as well as corn and Senegal in rice and vegetables. In South America, the Brazil center yielded outputs in strawberries, Paraguay in vegetables and potatoes, Bolivia and Peru in potatoes and quinoa (a tropical grain), Ecuador in house vegetables and Dominica in fruits and vegetables. Furthermore, in some countries such as the Philippines, Vietnam, Uzbekistan, Paraguay and Bolivia, demonstration sites were built to extend technologies and skills to farmers and demonstrate various products [17,19].
In addition, some statistics of the KOPIA centers’ activities are summarized in Table 2. The number of cooperation projects implemented in the recipient countries increased sharply from eight in 2009 to 46 in 2014, the number of domestic agriculture experts dispatched to the recipients more than doubled between 2009 and 2013, and the number of recipients’ experts visiting Korea for advanced training rose to 81 in 2013, four times more than the 18 in 2009. Viewed from the standpoint of Korea, the number of global domestic agriculture personnel trained by the KOPIA notably increased from 44 in 2009 to 127 in 2014, and the number of times technical advice was given to domestic agricultural firms operating in the recipient nations increased to 77 in 2013, more than 10 times the seven instances in 2009.

3. Literature Review and Methods

3.1. Literature Review

The purpose of official development assistance (ODA) is not simply limited to economic growth and social welfare improvement in recipient nations, but it is also carried out with various backgrounds, including political and diplomatic goals, the economic motivations of donors, humanitarian aid, and increased interdependence among countries [20,21]. Notwithstanding, ODA is usually embarked on for the purpose of aid in funds, technical skills or technologies for economic development and social welfare growth of a developing country to its central and local governments, or international organizations, from public institutions of a donor country, such as the central or local governments and their executive organs, as put by the Organization for Economic Cooperation and Development’s Development Assistance Committee (OECD DAC). ODA is limited to aid that satisfies the following four criteria. It should be carried out (1) by public bodies such as central or local governments and their executive institutions of the donor country (2) for the purpose of economic development or welfare growth of a recipient country, and not for commercial and military purposes, (3) to developing countries or eligible international organizations that are included on the list of the OECD DAC, and (4) with at least a 25 percent grant component if it is given in a grant-in-aid or a loan. Hence, much literature—either with case studies or with quantitative research—has hitherto reported the benefits of ODA in developing countries in terms of economic effects [22,23] or the political effects on democracy [24,25], despite its problems and limitations investigated [26,27,28].
In particular, a greater effect of assistance in agricultural development than in other industrial sectors for rural economic growth and poverty reduction has recently been researched in earnest. For instance, according to Mellor [3], agricultural productivity growth is more likely to reduce rural poverty effectively, because it generates income for poor farmers. This reduces urban poverty as well, by slowing migration to urban areas and generating an increased demand for goods and services from rural areas. Moreover, increases in agricultural productivity also result in lower food prices that primarily benefit both the rural and urban poor. Dethier and Effenberger [4] argue that food productivity is essential in developing countries for food security and poverty alleviation, and hold that viable solutions for better food productivity are required for a number of complex technical and institutional policy issues. The policy issues include land markets, research on seeds and inputs, agricultural extension, credit, rural infrastructure, storage, connection to markets, rural nonfarm employment, and food price stabilization. Similar results are also found in other studies [6,7,8,9,29,30].
Moreover, the importance of agricultural technology in economic growth has continued to be studied. Lipton [10] shows that agricultural growth based on improved technology is effective in reducing poverty in developing countries. Kerr and Kolavalli [11] highlight the role of improved agricultural technology, primarily by international agricultural research systems, in alleviating poverty, although technology’s role is indirect and partial because it is combined with other socioeconomic and institutional factors. Thirtle, Lin and Piesse [2] hold that it is research-led technological change in agriculture that generates productivity growth, with high rates of return in Africa and Asia, and has a substantial impact on poverty alleviation, whereas productivity growth in industry and services has no impact. The authors estimate that productivity growth in agriculture by research-led technological change reduces the number of people around the world living on less than $1 per day by 27 million per annum. In an empirical cross-country analysis of agricultural technology’s role in economic development, Self and Grabowski [12] argue that improvements in agricultural technology have a significant impact on both measures of economic growth and human development. These results are also echoed in other studies [13,31,32].
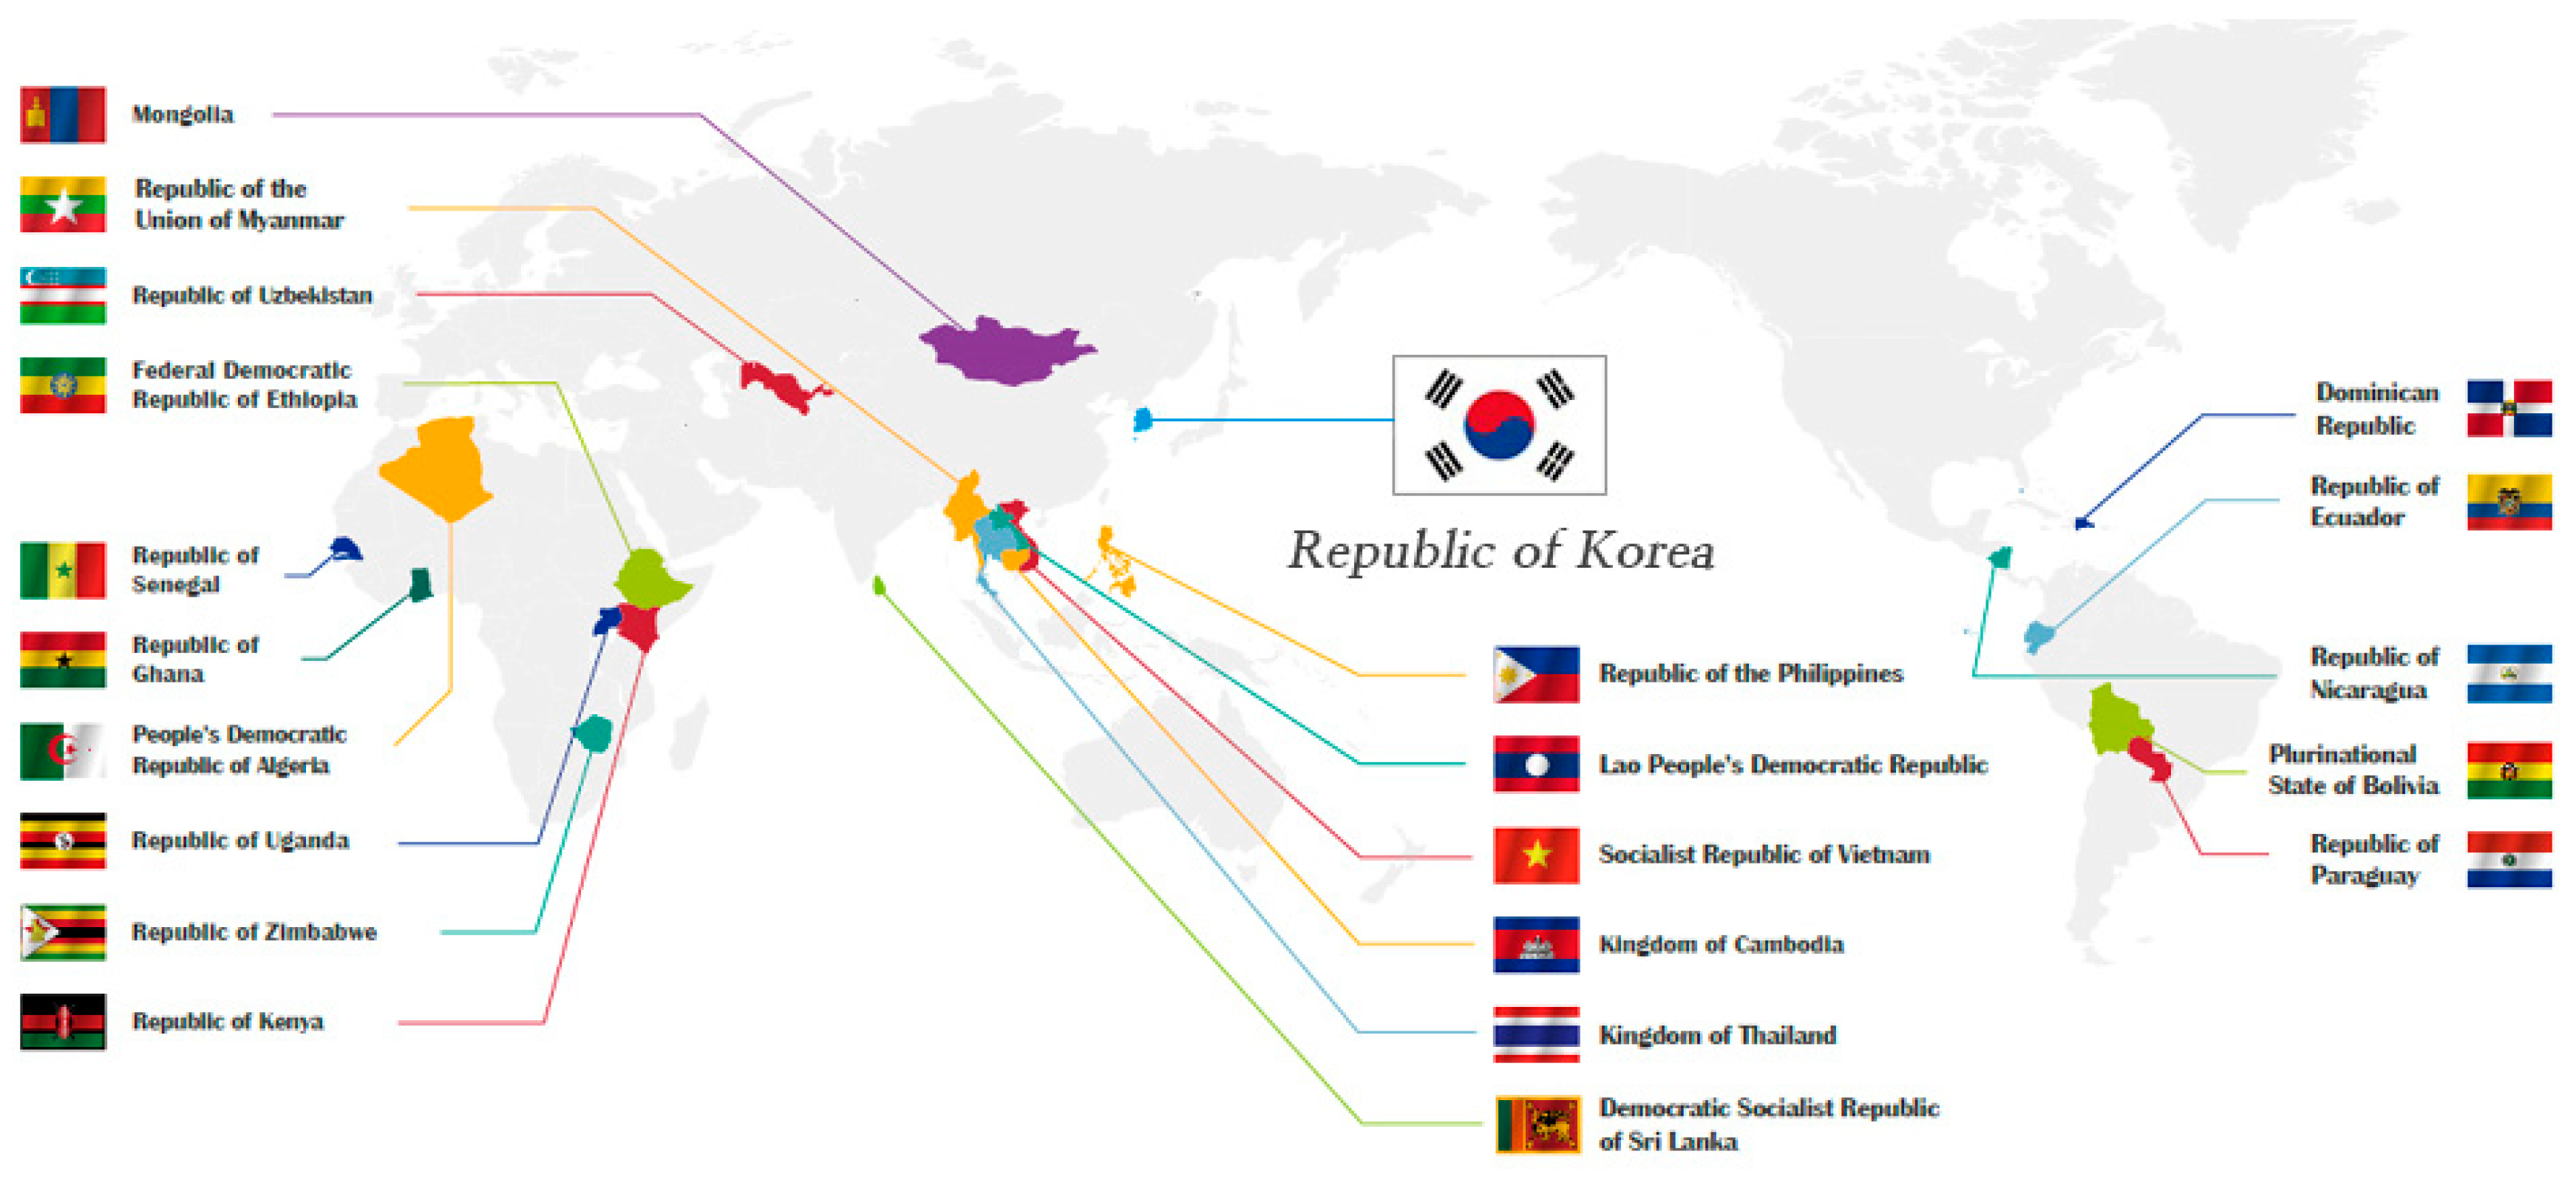
Given the literature discussed above, this study aims to find empirical evidence of the beneficial effects, in terms of production and value-added inducement, that agricultural development assistance by the Korean Programs on International Agriculture (KOPIA) bring about in recipients’ economies. Hence, production and value-added growth by KOPIA projects in recipients’ industries are deeply assessed with inter-industrial relation analysis, although the direct effects of advancements in agricultural technology through the projects are briefly sketched, with focal cases in the second section. This underlies an important role of agriculture and agricultural technology in the development process and the benefits of ODA in a recipient’s economy via inter-industrial relations. Thus, the key contribution of this study is to explore, for the first time, the economic effects of the KOPIA, as aid in the development of agricultural technology, with nine years of data for 23 countries.

3.2. Models and Data

The increase in agricultural productivity and rural economic growth by research-driven agricultural development assistance projects might lead to the growth of production demand in relevant industries, and this growth could again cause an increase in production in other industries. Therefore, the economic benefits of agricultural development assistance are supposed to spill over into entire industries through inter-industrial chains, and are not simply confined to the agricultural sector. Accordingly, the economic benefits of the KOPIA for the 23 recipient countries can be comprehensively assessed using the inter-industrial relation analysis method and a demand-driven model with an IO table for each recipient country.
IO analysis is a practical extension of the classical theory of general interdependence, which views the whole economy of a region, country and even the entire world as a single system, and sets out to describe and interpret its operation in terms of directly observable basic structural relations [33]. In a national economy, each industry purchases goods and services for production activities and sells the products produced to other industries, thereby establishing direct or indirect relationships. The IO table is a statistical table that records these inter-industry transaction relationships in a matrix form based on certain principles for a certain period of time (usually one year), and the quantitative analysis of inter-industry correlations using IO tables is called inter-industry analysis or input-output analysis.
While the analysis of national income has the advantage of indicating the level of activity of the entire national economy, the analysis of IO tables has the advantage of grasping the correlation between industries in terms of industrial structure. In addition, the analysis of industry-related effects such as production, employment and income caused by final demand can be divided into industries and analyzed by various industries, so it is used in various fields such as economic policy establishment and policy effect measurement [33].
Inter-industrial relation analysis starts with the calculation of an input coefficient representing the input composition ratio of raw materials in each industry sector. Production inducement coefficients are the direct and indirect production ripple effects of each sector due to final demand, which plays a central role in industry-related analysis [33]. The structure of an IO table is expressed as in Table 3. Both the production and value-added inducement effect can be estimated with an IO table and the amount of KOPIA’s annual budget for each country. The demand-driven model is widely used to calculate the amount of product needed to satisfy final demand in all industries [33,34,35].
In an IO table, the structure of products in industry i can be expressed with Equation (1), where X i , X i j , Y i and M i represent the total amount of products, intermediate demand, final demand and total imports in industry i , respectively, and α i j indicates the ratio of the amount of input resource i used in sector j to the total amount of products in sector j   ( α i j =   x i j / X j ) . Equation (1) means that the total amount of products in a sector is equal to a value that from the sum of products in a sector input to products in all sectors, plus the amount of final demand, subtracts the amount of total imports in the sector. Equation (1) can be converted to a matrix equation as in Equation (2), and it can be again converted to Equation (4) via Equation (3) to get the solution for the variable X .
X i = j = 1 n x i j + Y i M i = j = 1 n α i j   X j + Y i M i
X =   AX +   Y   M
( I A ) X =   Y   M
X = ( I A ) 1 ( Y M )
Here, X represents a vector of the total amount of products, A is a matrix of input coefficients, Y is a vector of final demand, and M indicates a vector of the amount of imports.
In Equation (4), factor ( I A ) 1 indicates the production inducement coefficient (PIC). If the value of the PIC is estimated, a change in the total amount of products ( X ), which is induced directly or indirectly by an increase in the final demand ( ( Y M ) ) in all industries, can be readily calculated.
In addition, the converted factor A υ ^   ( I A + M * ^ ) 1 indicates the value-added inducement coefficient (VIC), where υ indicates a vector of added value, and A υ ^ represents a diagonal matrix of value-added ratios. The VIC means an increase in the total amount of added value induced directly or indirectly in the whole national economy when the final demand for the domestic products of an industrial sector increases by a unit.
The data for the amount of each KOPIA center’s annual budget was obtained from the RDA’s annual report for the KOPIA (2009–2017, each year) [18], and data of the IO tables for the inter-industry relation analysis was gathered from the Eora multi-region input-output (Eora MRIO) database [36]. The Eora are an indigenous Australian people of New South Wales. The Eora project, carried out with the support of the Australian Research Council at Sydney University, provides MRIO tables for a total of 190 countries from 1970 through 2015. To estimate the coefficients for production and value-added inducement, the industry related to the KOPIA was matched with one of the industries classified in the Eora database. The Eora MRIO database [36] classifies the total industries into 26 categories: “Agriculture,” “Fishing,” “Mining and Quarrying,” “Food and Beverages,” “Textiles and Wearing Apparel,” “Wood and Paper,” “Petroleum, Chemical and Non-Metallic Mineral Products,” “Metal Products,” “Electrical and Machinery,” “Transport Equipment,” “Other Manufacturing,” “Recycling,” “Electricity, Gas and Water,” “Construction,” “Maintenance and Repair,” “Wholesale Trade,” “Retail Trade,” “Hotels and Restaurants,” “Transport,” “Post and Telecommunications,” “Financial Intermediation and Business Activities,” “Public Administration,” “Education, Health and Other Services,” “Private Households,” “Others,” and “Re-export and Re-import.” In addition, as the database provides either an industry-symmetric or a commodity-symmetric IO table by country, all of the tables of the 23 countries were converted to industry-symmetric tables for coherent comparison. The annual budgets of the KOPIA centers may be regarded to be an increase in investment in or ultimate demand for agriculture in the IO table of a country. Using the data, the PICs are estimated for the 23 countries and the VICs only for 13 countries, which provide the information on imports needed to get the VICs by industry. Due to the absence of IO tables for 2016 and 2017, the coefficients for both years are substituted with the coefficients for the year 2015, as shown in Table 4 and Table 6.

4. Findings and Results

4.1. Production Inducement Effect

As presented above, the KOPIA has so far made various achievements in crop products R&D and contributed to the productivity growth of crop yields in many countries. These achievements have induced an increase in production in agriculture-related industries, such as seeds, fertilizers, materials, tools and machinery, as documented by the RDA [17,18]. Production growth by the KOPIA in the agricultural industry has reportedly been likely to result in the growth of second- and third-related industries. This can be evidenced in agricultural development cases in some countries, as discussed in the second section, and empirically underpinned by the following inter-industry relation analysis results.
The estimated PICs of the KOPIA by country for each year are given in Table 4. The PIC indicates the extent to which the amount of production rises directly or indirectly in all of the industrial sectors when final demand, such as consumption, investment and exports, increases by a unit in the agricultural sector. In 2015, the country with the highest score in the PIC among the 23 countries was Thailand (3.604), which was followed by Myanmar (3.203) and Nicaragua (2.301), whereas the country with the lowest score was Zimbabwe (1.000), which was preceded by the Philippines (1.125) and Ethiopia (1.180). Other than 2015, the PIC for Myanmar continued to be estimated as the highest, over 3.0, during the period from 2009 to 2014, whereas the PIC for the Philippines was estimated to be the lowest at 1.125. This implies that developing countries with a higher PIC score—such as Vietnam, Myanmar, Sri Lanka, Thailand, and Paraguay—have well-structured industrial relations with the agricultural industry, and that research-led assistance to agriculture can eventually lead to industrial growth.
With the PICs, the production inducement effect (PIE) by the KOPIA in the 23 recipient countries from 2009 until 2017 was estimated to total US$99 million, accounting for 1.7 times the total budget of US$58.9 million of the 23 KOPIA centers during the period. As shown in Table 5, Vietnam, Sri Lanka, Thailand, Paraguay, and so on, tended to have higher annual PIE scores after 2013. In terms of the 2017 PIE score, Vietnam recorded the highest with US$1.21 million, followed by Sri Lanka (US$1.12 million) and Paraguay (US$0.87 million), whereas Zimbabwe was the lowest with US$0.25 million, preceded by Ethiopia (US$0.29 million) and Laos (US$0.34 million). In addition, as illustrated in Figure 2, the total PIE by country from 2009 to 2017 was estimated to be relatively higher in Vietnam (US$10.79 million), Myanmar (US$9.58 million) and Paraguay (US$7.83 million), where KOPIA centers were established at an earlier time. In comparison, the total PIE in Laos (US$0.61 million), Zimbabwe (US$0.46 million), and Nicaragua (US$0.55 million), where the operation period of the KOPIA centers was relatively short, was estimated to be lower.
These results reveal that in developing countries with a higher PIE score, KOPIA projects are effectively implemented for agricultural development through cooperation with recipient institutions. In these countries, assistance to and investment in agriculture may fundamentally lead to successful industrial growth along with a well-structured agricultural industry. For instance, Vietnam has witnessed technological development with a variety of crops, such as cassava, sugarcane, sweet potatoes, strawberries, mushrooms, potatoes and peanuts, as well as the successful extension of developed technologies to farm households and agricultural firms through cooperation between the KOPIA Vietnam center and the Vietnam Academy of Agricultural Sciences (VAAS) [37] (pp. 19–43). These benefits have also been seen in Thailand, where achievements have been made with sugarcane and orchids, and in Paraguay, where projects have been accomplished with grains, such as chia and quinoa [37].

4.2. Value-Added Inducement Effect

The estimated VICs of the KOPIA by country for each year are presented in Table 6. The VIC indicates the extent to which the amount of added value rises when final demand for domestic products in the agricultural sector increases by one unit. Hence, the greater the dependence on imported resources in an industry or upon an item there is, the lower the VIC tends to be. In contrast, a higher VIC score means a higher increase in added value by an increase in demand for domestic products. In the 2015 VICs, Myanmar was estimated to have the highest score of 0.860, which was followed by Algeria (0.855) and Sri Lanka (0.847), whereas Zimbabwe was estimated to have the lowest score of 0.728, which was preceded by Nicaragua (0.740) and Ethiopia (0.774). This implies that in developing countries with a higher VIC score, investment by the KOPIA in the agricultural industry induced higher added value in related industries as the projects for agricultural development were accomplished. The tendency in the 2013 and 2014 VICs was almost similar to the one in the 2015 VICs.
From the VICs, the total value-added inducement effect (VIE) in the 13 countries from 2009 until 2017 was estimated to be US$23.9 million, which was rather lower than the total budget of US$26.2 million of the 13 KOPIA centers during the same period. However, an annual VIE tended to increase in most of the countries after the commencement of the KOPIA, as shown in Table 7. This tendency might show the economic benefits of the KOPIA for the recipients. On the other hand, the annual VIEs in countries varied. In terms of the 2017 VIEs, Sri Lanka was estimated to be the highest with US$473 thousands, which was followed by Cambodia (US$417 thousands) and Mongolia (US$222 thousands). As illustrated in Figure 3, the total VIE by the KOPIA from 2009 through 2017 in Sri Lanka, Cambodia, Mongolia and Myanmar was estimated to be as high as US$4.95, 3.02, 2.43, and 2.42 million, respectively, whereas the effect in Laos, Zimbabwe and Nicaragua was estimated to be as low as US$1.13, 0.33, and 0.18 million, respectively. These estimates also imply that developing countries with higher VIEs gained achievements in industrial growth through crop development and the extension of developed technologies from the KOPIA.

5. Discussion and Implications

After its miraculous economic development, Korea was transformed from a recipient to an ODA donor in the 2000s, and was approved to become a member of the OECD DAC in November 2009. In particular, it accomplished a higher rate of self-supply in food, mainly due to the advancement of agricultural research and successful rural development, represented by the Saemaeul or “new village” movement. The purposes of ODA in the agriculture sector encompass humanitarian aid, improvement of agricultural productivity, development of agricultural infrastructure, provision of equipment and facilities, R&D and extension of advanced technologies and skills, and amelioration of agricultural policies and institutions. Along with these goals, Korea has for the last decade keenly aided developing countries with its good experience, such as the improvement of agricultural productivity and rural development. As an example, the OECD’s Query Wizard for International Development Statistics [38] reports that the total disbursement of Korea’s ODA to all developing countries in the agriculture, forestry and fishing sector tended to increase from US$30.0 million in 2007 to 52.3 in 2008, 40.7 in 2009, 50.6 in 2010, 57.1 in 2011, 72.0 in 2012, 100.2 in 2013, 111.0 in 2014, 111.8 in 2015, and most recently US$104.3 million in 2016. The values in each year are measured with the current price and do not include disbursements to multilateral recipients. In the QWIDS, the agriculture, forestry and fishing sectors are composed of 18, six and five subsectors, respectively [38].
Theoretical controversies on the effectiveness of ODA still remain, as previously discussed in the literature review section. Nonetheless, many studies have argued that it has positive effects on recipients’ economies and democracy. In particular, the greater effect of agricultural development assistance on rural economic growth and poverty reduction has been reported, and the importance of agricultural technology in economic growth has been examined in many studies. Against this background, investigations of the production and value-added inducement effect caused by an ODA program in all industries could contribute to a better understanding of the economic effects of the program in a recipient country, as ODA itself can bring about the enhancement of overall production and added value in a recipient’s economy through inter-industrial relations. Likewise, the KOPIA can help recipient countries to develop their agricultural industry by providing technological support based on the fruitful results of agricultural R&D. Furthermore, agricultural development can again lead to production and value-added growth in other related industries.
Examples of the economic benefits of the KOPIA can be seen in successful projects such as the rice project of the Vietnam center, the poultry project of the Cambodia center, the onion project of the Sri Lanka center, the potato project of the Kenya center, and the sesame project of the Paraguay center [17]. Furthermore, some of these have become more beneficial to the recipient’s economy through a combination with the large-scale ODA projects MAFRA and KOICA. The findings of the laborious work of this study, albeit rather simple, have some significant implications for the research and practice of ODA. To summarize the findings, the KOPIA is likely to lead to industrial growth in most of the recipient countries. The estimated PIEs and VIEs in most countries demonstrate that the KOPIA have a positive effect on the rise in production and added value in related industries by an increase in investment in the agricultural sector. This can be particularly seen in the finding that the annual VIE tended to increase in most of the countries after the commencement of the KOPIA, although this tendency is less clear in the estimates of annual PIEs.
With the empirical findings, some implications can be drawn. First, agricultural development by the KOPIA can generally contribute to an increase in industrial production and added value in recipient countries, with possible exceptions in some countries. The KOPIA aims mainly to supply the technical support needed to solve the problems that each recipient faces in the agricultural sector, and not to give aid with massive funds for the provision of agricultural infrastructure, equipment or facilities. Importantly, through cooperative R&D and an extension of technology, it has achieved fruitful results in many countries, and these are highly appreciated in documents by the Committee for International Development Cooperation (CIDC) under Korea’s prime minister [19,37]. When planning KOPIA projects, the needs and demands of a recipient country are considered with high priority through many regular and occasional meetings with recipient institutions. In addition, by applying and extending advanced technologies and skills, the KOPIA can lead to a rise in farm household income and rural development. In brief, the KOPIA, in line with the SDGs, could help recipients to develop their agricultural industry through technological improvement and productivity growth by themselves, and furthermore related industries, through inter-industrial relations. This is underscored by the findings in this study.
Despite some constraints on its operation, including a relatively small amount of expenditure and a tiny number of personnel, the positive economic effects can show the sustainability and significance of the KOPIA. In summary, the KOPIA has made many fruitful products in the agricultural and rural development of the recipient countries through cooperative ways. The RDA has advanced agricultural technologies and skills for the improvement of agricultural productivity for many years. These accomplishments have been extended to developing countries via the KOPIA, and has helped them develop agriculture and rural communities. Put simply, these results infer that when ODA is arranged between recipients and donors in cooperative and reciprocal ways, it can be beneficial and sustainably executed.

6. Conclusions

Agricultural development is of the utmost significance for the improvement in the living conditions of a population, through poverty alleviation and further rural economic growth in developing countries. In particular, agricultural productivity growth by improved technology might be more effective in reducing rural poverty and precipitating economic growth. As agricultural productivity is quite a bit lower in most developing countries, aid in the form of agricultural technologies and technical skills can be helpful to agricultural development and rural improvement, as reported in much literature. Moreover, global demand for Korea’s role and responsibility in ODA has continued to rise, and in particular, requests from developing countries to provide its advanced experience in the agricultural sector, have increased remarkably.
In line with this, the RDA embarked on ODA programs with the KOPIA in 2009 to provide its advanced agricultural technologies and skills and to collaboratively develop agricultural resources with recipient countries. There were six recipient countries for the KOPIA at its inception, and it reached 21 in Asia, Africa and South America in 2018.
The purposes of the KOPIA, in accordance with the SDGs, are to research and develop new agricultural technologies and skills with the cooperation of recipient institutions, extend developed technologies and skills to farmers and agricultural businesses of the recipient countries, and ultimately contribute to poverty reduction and rural economic growth. These goals have been achieved in most countries, as demonstrated by many examples, although the outputs are relatively small in scale and scope. Hence, this study estimates the PIEs and VIEs of the KOPIA in each country to comprehensively understand their economic effects.
The main finding of this study is that the annual VIE tends to increase in most of the countries, although this is less clear in the estimates of annual PIEs, and that the PIE and VIE vary in countries. First, the PIE by the KOPIA in the 23 recipient countries from 2009 to 2017 is estimated to total US$99 million, which accounts for 1.7 times the total budget of US$58.9 million of the 23 KOPIA centers during the period. In terms of the 2017 PIE by country, Vietnam recorded the highest with US$1.21 million, followed by Sri Lanka (US$1.12 million) and Paraguay (US$0.87 million), whereas Zimbabwe recorded the lowest with US$0.25 million, preceded by Ethiopia (US$0.29 million) and Laos (US$0.34 million). Second, the total VIE in the 13 countries from 2009 until 2017 is estimated to be US$23.9 million, which is slightly lower than the total budget of US$26.2 million of the 13 KOPIA centers during the same period. In terms of the 2017 VIEs by country, Sri Lanka is estimated to be the highest with US$1.59 million, followed by Mongolia (US$0.79 million) and Laos (US$0.75 million).
The following implications can be drawn from these findings. In developing countries with higher PIE and VIE scores, KOPIA projects were effectively implemented for agricultural development via cooperation with recipient institutions. More importantly, research-led agricultural assistance in these countries may eventually lead to successful industrial growth in line with well-structured industrial relations with the agricultural industry. This accomplishment can be observed in Vietnam, Myanmar, Sri Lanka, Thailand, Paraguay, and so on. All of this shows the economic benefits of the KOPIA for the recipients, particularly achievements in industrial growth through crop development and the extension of developed technologies.
The originality of this study might lie in exploring the production and value-added inducement effects of an ODA program, and in particular researching the KOPIA, which is little known to the world. Despite some methodological limitations, the findings of this study could shed light on the empirical research on the economic effects of ODA and provide helpful implications for future directions of Korea’s ODA programs.

Author Contributions

Conceptualization, S.-H.P. and K.-M.M.; methodology, K.-M.M.; formal analysis, K.-M.M.; investigation, S.-H.P. and K.-M.M.; data curation, K.-M.M.; writing—original draft preparation, S.-H.P.; writing—review and editing, S.-H.P.; and funding acquisition, S.-H.P.

Funding

This work was supported by a policy research grant from South Korea’s Rural Development Administration.

Conflicts of Interest

The authors received funding for the paper from South Korea’s Rural Development Administration (RDA). RDA had no role in the design, execution, interpretation, and writing of the study. RDA did only review and provide feedback on an earlier draft of the paper. In addition to publishing a draft as a project report, RDA approved the submission to an academic journal for peer review.

References

  1. World Bank. Poverty and Shared Prosperity 2018: Piecing Together the Poverty Puzzle. Available online: https://www.worldbank.org/en/publication/poverty-and-shared-prosperity (accessed on 13 May 2019).
  2. Thirtle, C.; Lin, L.; Piesse, J. The Impact of Research-led Agricultural Productivity Growth on Poverty Reduction in Africa, Asia and Latin America. World Dev. 2003, 31, 1959–1975. [Google Scholar] [CrossRef]
  3. Mellor, J. Faster More Equitable Growth: Agriculture, Employment Multipliers and Poverty Reduction. Agric. Policy Dev. Proj. Res. Rep. 2001, 4. [Google Scholar]
  4. Dethier, J.-J.; Effenberger, A. Agriculture and Development: A Brief Review of the Literature; Policy Research Working Paper 5553; World Bank: Washington, DC, USA, 2011. [Google Scholar]
  5. Organization for Economic Cooperation and Development (OECD). Agricultural Policies for Poverty Reduction; OECD Publishing: Paris, France, 2012. [Google Scholar]
  6. Ssozi, J.; Asongu, S.A.; Amavilah, V. The Effectiveness of Development Aid for Agriculture in Sub-Saharan Africa. MPRA Paper, 88530. 2018. Available online: https://mpra.ub.uni-muenchen.de/88530/ (accessed on 13 May 2019).
  7. Diao, X.; Hazell, P.; Thurlow, J. The Role of Agriculture in African Development. World Dev. 2010, 38, 1375–1383. [Google Scholar] [CrossRef]
  8. Christiaensen, L.; Demery, L.; Kuhl, J. The (evolving) Role of Agriculture in Poverty Reduction: An Empirical Perspective. J. Dev. Econ. 2011, 96, 239–254. [Google Scholar] [CrossRef]
  9. Corral, S.; Díaz, A.S.; del Monagas, M.C.; García, E.C. Agricultural Policies and Their Impact on Poverty Reduction in Developing Countries: Lessons Learned from Three Water Basins in Cape Verde. Sustainability 2017, 9, 1841. [Google Scholar] [CrossRef]
  10. Lipton, M. Why Poor People Stay Poor: A Study of Urban Bias in World Development; Australian National University Press: Canberra, Australia, 1977. [Google Scholar]
  11. Kerr, J.; Kolavalli, S. Impact of Agricultural Research on Poverty Alleviation: Conceptual Framework with Illustrations from the Literature; EPTD Discussion Paper No. 56; Impact Assessment and Evaluation Group, IFPRI: Washington, DC, USA, 1999. [Google Scholar]
  12. Self, S.; Grabowski, R. Economic Development and the Role of Agricultural Technology. Agric. Econ. 2007, 36, 395–404. [Google Scholar] [CrossRef]
  13. Thirtle, C.; Piesse, J. Governance, Agricultural Productivity and Poverty Reduction in Africa, Asia and Latin America. Irrig. Drain. 2007, 56, 165–177. [Google Scholar] [CrossRef]
  14. World Bank. World Development Report 2019: The Changing Nature of Work; World Bank: Washington, DC, USA, 2019. [Google Scholar]
  15. Park, S.-H.; Oh, K.-S. The Performance of Official Development Assistance Projects on Agricultural Technology by the Korean Programs on International Agriculture. J. Korean Soc. Int. Agric. 2019, 31, 1–10. (In Korean) [Google Scholar]
  16. Park, S.-H.; Joo, S.-D.; Choi, J.-Y. The Assessment of Performance of the Korean Programs on International Agriculture. J. Gov. Policy 2016, 8, 31–75. (In Korean) [Google Scholar]
  17. Rural Development Administration (RDA). Past, Present and Future of ODA Projects of the KRDA. In Proceedings of the Conference of the Korean Association for Public Administration, Jeonju-shi, Korea, 22 June 2017. (In Korean). [Google Scholar]
  18. Rural Development Administration (RDA). The Annual Report of the KOPIA; Each Year; RDA: Wanju, Korea, 2009–2017. (In Korean) [Google Scholar]
  19. Rural Development Administration (RDA). The Performance Evaluation of the Projects for Demonstration Villages in Asia Linked with the Saemaul-Undong Movement; Project Report 11-1390000-003933-01; RDA: Wanju, Korea, 2015. (In Korean) [Google Scholar]
  20. Devarajan, S.; Dollar, D.R.; Holmgren, T. (Eds.) Aid and Reform in Africa: Lessons from Ten Case Studies; World Bank: Washington, DC, USA, 2001. [Google Scholar]
  21. Lipton, M.; Toye, J. Does Aid Work in India? A Country Study of the Impact of Official Development Assistance; Routledge: London, UK, 2010. [Google Scholar]
  22. Chenery, H.B.; Strout, A.M. Foreign Assistance and Economic Development. Am. Econ. Rev. 1966, 56, 679–733. [Google Scholar]
  23. Bornschier, V.; Chase-Dunn, C.; Rubinson, R. Cross-National Evidence of the Effects of Foreign Investment and Aid on Economic Growth and Inequality: A Survey of Findings and a Reanalysis. Am. J. Sociol. 1978, 84, 651–683. [Google Scholar] [CrossRef]
  24. Goldsmith, A. Foreign Aid and Statehood in Africa. Int. Organ. 2001, 55, 123–148. [Google Scholar] [CrossRef]
  25. Dunning, T. Conditioning the Effects of Aid: Cold War Politics, Donor Credibility, and Democracy in Africa. Int. Organ. 2004, 58, 409–423. [Google Scholar] [CrossRef] [Green Version]
  26. Maren, M. Road to Hell: The Ravaging Effects of Foreign Aid and International Charity; Free Press: New York, NY, USA, 1997. [Google Scholar]
  27. Lancaster, C. Aid to Africa: So Much to Do, So Little Done; University of Chicago Press: Chicago, IL, USA, 1999. [Google Scholar]
  28. Easterly, W. The Cartel of Good Intentions: Bureaucracy Versus Markets in Foreign Aid; Working Paper No. 4; Center for Global Development at the Institute for International Economics: Washington, DC, USA, 2002. [Google Scholar]
  29. Humphries, H.; Knowles, S. Does Agriculture Contribute to Economic Growth? Some Empirical Evidence. Appl. Econ. 1998, 30, 775–781. [Google Scholar] [CrossRef]
  30. Gollin, D.; Parente, S.; Rogerson, R. The Role of Agriculture in Development. Am. Econ. Rev. 2002, 92, 160–164. [Google Scholar] [CrossRef]
  31. Datt, G.; Ravallion, M. Farm Productivity and Rural Poverty in India. J. Dev. Stud. 1998, 34, 62–85. [Google Scholar] [CrossRef]
  32. Ravallion, M.; Datt, G. When is Growth Pro-Poor? Evidence from the Diverse Experience of India’s States; World Bank Policy Research Working Paper Series, 2263; World Bank: Washington, DC, USA, 1999. [Google Scholar]
  33. Leontief, W. Input-Output Analysis; Palgrave Macmillan: London, UK, 2008. [Google Scholar]
  34. Bank of Korea (BOK). Input-Output Statistics; BOK: Seoul, Korea, 2014. (In Korean) [Google Scholar]
  35. Miller, R.E.; Blair, P.D. Input-Output Analysis: Foundations and Extensions; Cambridge University Press: Cambridge, UK, 2009. [Google Scholar]
  36. Eora MRIO Database. National Input-Output Tables. Available online: http://worldmrio.com/countrywise/ (accessed on 21 July 2018).
  37. Rural Development Administration (RDA). An Evaluation of KOPIA’s Official Development Assistance Projects; Project Report 11-1390000-004272-01; RDA: Wanju, Korea, 2017. (In Korean) [Google Scholar]
  38. Organization for Economic Cooperation and Development (OECD). Query Wizard for International Development Statistics. Available online: https://stats.oecd.org/qwids/ (accessed on 17 December 2018).
Figure 1. Locations of KOPIA Centers Across the Globe as of 2018. Note: Korean Programs on International Agriculture (KOPIA) centers in the DR Congo and Peru were closed in 2015, and in Brazil in 2016. Source: www.rda.go.kr.
Sustainability 11 05224 g001
Figure 2. Estimated Total Production Inducement Effects of the KOPIA by Country. (Unit: US$ million).
Sustainability 11 05224 g002
Figure 3. Estimated Total Value-added Inducement Effects of the KOPIA by Country. (Unit: US$ million).
Sustainability 11 05224 g003
Table 1. Annual Budgets of KOPIA Centers by Country. (Unit: US$ thousand)
200920102011201220132014201520162017Total
Vietnam449.0468.0468.0779.0915.0889.2851.7670.7658.46149.0
Myanmar212.2218.0268.0102.0500.0526.1461.1308.9212.92809.1
Cambodia-210.0285.0387.0560.0630.1760.9607.9537.03977.9
Philippines-210.0330.0458.4360.0608.1832.3600.0467.73866.5
Sri Lanka--350.0405.0310.0697.8885.3613.3558.93820.4
Thailand---508.0350.0387.7366.7330.5161.32104.2
Laos-------210.0263.6473.6
Uzbekistan417.7391.0409.0399.6242.1489.1457.7370.5316.43493.1
Mongolia-----760.0422.3403.4282.01867.7
Kenya442.1400.0200.0538.0719.0579.4704.3566.9533.04682.7
DR Congo-359.0270.0363.4300.0580.7343.6--2216.8
Algeria-100.0365.0233.0300.0440.1327.5249.3244.42259.3
Ethiopia--234.0222.0570.0616.2594.0290.0248.52774.6
Uganda----300.0702.9321.2300.0244.81868.8
Senegal-----896.0270.1300.0242.91709.0
Zimbabwe-------210.0249.8459.8
Paraguay426.6401.0548.0393.0210.0521.5685.8670.9490.34347.1
Brazil100.0130.0150.056.0240.0170.945.91.0-893.8
Bolivia--370.0261.0300.0669.7526.6340.7248.72716.6
Ecuador---660.0350.0757.3523.5316.0261.22868.0
Peru----600.0574.8380.8--1555.7
Dominica-----825.0367.4294.1234.31720.7
Nicaragua--------238.7238.7
Total2047.62887.04247.05765.57126.112,322.510,128.77654.16694.758,873.2
Source: Rural Development Administration (RDA) (2009–2017, each year) [18].
Table 2. Summary of Activities of the KOPIA centers from 2009 to 2014.
Year200920102011201220132014
Number of cooperation projects implemented in the recipient nations81111193246
Number of domestic experts dispatched to the recipient nations in the short term283654606325 *
Number of recipients’ experts invited to Korea for training183137458160 *
Number of globally trained domestic agriculture personnel4488116152124127
Number of times technical advice was given to domestic agricultural firms operating in the recipient nations731576777n.a.
* The 2014 column means the data only through July. Source: RDA [19].
Table 3. Structure of an Input-Output (IO) Table.
Intermediate DemandFinal DemandImport (Deduction)Total Output
12jn
Intermediate Input1 x 11 x 12 x 1 j x 1 n Y 1 M 1 X 1
2 x 21 x 22 x 2 j x 2 n Y 2 M 2 X 2
I x i 1 x i 2 x i j x i n Y i M i X i
n x n 1 x n 2 x n j x n n Y n M n X n
Value Added V 1 V 2 V j V n
Total Input X 1 X 2 X j X n
Table 4. Estimated Annual Production Inducement Coefficients of the KOPIA by Country.
2009201020112012201320142015Years of IO Table
Vietnam1.8311.8181.8241.7261.7251.5191.83109, 12, 15
Myanmar3.6253.6333.5833.5353.5143.3993.20309~15
Cambodia-1.6631.6371.5991.5911.4981.43709~15
Philippines-1.1251.1251.1251.1251.1251.12509~15
Sri Lanka--1.9941.9872.0021.9952.00311~15
Thailand---1.7971.7371.6753.60412~15
Laos------1.29815
Uzbekistan1.2471.2641.2551.2491.2461.2171.21909~15
Mongolia-----2.0622.05414, 15
Kenya1.3761.3721.3721.3091.2821.2061.19609~15
DR Congo-1.7251.7421.7311.6911.6421.63110~15
Algeria-1.6641.6661.6591.6501.6111.58410~15
Ethiopia--1.4401.4281.4171.1811.18011~15
Uganda----1.7671.7011.57913~15
Senegal-----1.6611.68614~15
Zimbabwe------1.00015
Paraguay1.8111.8421.8611.8941.8551.7021.77409~15
Brazil2.0552.0762.0802.0962.1051.9972.13809~15
Bolivia--1.4311.4171.4151.3681.38811~15
Ecuador---1.5411.4741.4031.43212~15
Peru----1.5571.4711.51113~15
Dominica Rep.-----1.6101.62314~15
Nicaragua------2.30115
Table 5. Estimated Annual Production Inducement Effects of the KOPIA by Country. (Unit: US$ thousand).
200920102011201220132014201520162017Total
Vietnam822.1850.8853.61344.61578.41350.81559.51228.11205.510,793.3
Myanmar769.2792.0960.2360.61757.01788.11476.9989.4681.89575.3
Cambodia-349.2466.5618.8891.0944.01093.4873.5771.76008.1
Philippines-236.3371.3515.7405.0684.1936.3675.0526.24349.8
Sri Lanka--697.9804.7620.61392.11773.41228.51119.67636.7
Thailand---912.9608.0649.31321.61191.1581.45264.3
Laos-------272.6342.2614.7
Uzbekistan520.9494.2513.3499.1301.7595.3557.9451.6385.64319.7
Mongolia-----1567.1867.4828.5579.33842.3
Kenya608.3548.8274.4704.2921.8698.7842.3678.1637.55914.1
DR Congo-619.3470.3629.1507.3953.5560.5--3740.0
Algeria-166.4608.1386.5495.0709.0518.8394.9387.13665.8
Ethiopia--337.0317.0807.7727.7700.9342.2293.23525.7
Uganda----530.11195.6507.2473.7386.53093.1
Senegal-----1488.3455.4505.8409.52858.9
Zimbabwe-------210.0249.8459.8
Paraguay772.6738.61019.8744.3389.6887.61216.61190.2869.87829.1
Brazil205.5269.9312.0117.4505.2341.398.22.1-1851.6
Bolivia--529.5369.8424.5916.2730.9472.9345.23788.9
Ecuador---1017.1515.91062.4749.6452.5374.14171.6
Peru----934.2845.6575.4--2355.2
Dominica Rep.-----1328.2596.2477.3380.32782.0
Nicaragua--------549.2549.2
Total3698.65065.57414.09341.912,192.820,124.717,138.412,938.011,075.398,989.2
Table 6. Estimated Annual Value-added Inducement Coefficients in Agriculture by Country.
2009201020112012201320142015Years of IO Table
Myanmar0.8640.8640.8640.8640.8640.8620.86009~15
Cambodia-0.7330.7290.7360.7360.7550.77809~15
Sri Lanka--0.8290.8300.8400.8410.84711~15
Laos------0.83215
Mongolia-----0.7770.78814, 15
DR Congo-0.7770.7760.7770.7760.7800.78810~15
Algeria-0.8520.8560.8560.8530.8510.85510~15
Ethiopia---0.0140.1120.2590.7460.77411~15
Uganda----0.7590.7650.78613~15
Senegal-----0.8010.80714~15
Zimbabwe------0.72815
Dominica Rep.-----0.8420.85214~15
Nicaragua------0.74015
Table 7. Estimated Annual Value-added Inducement Effects of the KOPIA by Country. (Unit: US$ thousand).
200920102011201220132014201520162017Total
Myanmar183.3188.4231.688.1432.0453.5396.5265.7183.12422.1
Cambodia-153.9207.8284.8412.2475.8592.0472.9417.83017.1
Sri Lanka--290.2336.2260.4586.8749.9519.5473.44947.5
Laos-------174.7219.31131.2
Mongolia-----590.5332.8317.9222.22430.8
DR Congo-278.9209.5282.4232.8452.9270.8--1727.4
Algeria-85.2312.4199.4255.9374.5280.0213.2208.91929.6
Ethiopia---3.324.9147.6459.6459.8224.5192.31505.4
Uganda----227.7537.7252.5235.8192.41446.0
Senegal-----717.7218.0242.1196.01373.8
Zimbabwe-------152.9181.9334.7
Dominica Rep.-----694.6313.0250.6199.61457.8
Nicaragua--------176.6176.6
total183.3706.41248.21215.81968.65343.73865.24296.35072.723,900.2

