Abstract
The construction industry is one of the main contributors to the production of large volumes of greenhouse gases, since it consumes a large quantity of energy and construction materials. The purpose of this research is to assess the environmental impacts and economic efficiency of the voided slab system compared to the ordinary reinforced concrete slab. A life cycle assessment (LCA) and the total cost of construction were calculated to evaluate the performance of both slab systems. Additionally, the total costs of construction for both cases were determined based on the unit price of the building materials. The results of this study indicate that manufacturing building materials contributes most to the total GHG emissions where concrete is responsible for nearly 1/2 of all emissions. Additionally, forms are the second largest contributor of the total GHG emissions and account for nearly 40% and 15% of emissions for the ordinary reinforced concrete slab and the voided slab system, respectively. This study verified that the voided slab system indicated better environmental performance than the ordinary reinforced concrete slab. The total GHG emissions of the ordinary reinforced concrete slab were 256,599 and 13,989 kg·CO2·eq, for concrete and forms, respectively. Additionally, the total GHG emissions of the voided slab system were 224,945 and 12,211 kg·CO2·eq. The reduction of GHG emissions from Case 1 for aboveground floors and Case 2 for underground parking was 12.3% and 12.7% over the ordinary reinforced concrete slab, respectively. The economic efficiency of the ordinary reinforced concrete slab and the voided slab system were assessed by comparison of the total costs of construction. This showed a total cost reduction of 12.3% and 11.2% for the case of applying the voided slab system to the aboveground floors and underground parking, respectively. Thus, replacing the ordinary reinforced concrete slab by the voided slab system in the aboveground floors and the underground would make it possible to decrease not only the emissions of GHG, but also the cost of construction.
1. Introduction
According to the Intergovernmental Panel on Climate Change (IPCC) Fifth Assessment Report, human factors have been one of the crucial contributors to global warming since the mid-20th century when it was first observed [1]. In the IPCC report, human activities generate large amounts of greenhouse gases, such as carbon dioxide, methane, and nitrous oxide [1]. Recently, increasing attention has been focused on alleviating the manmade emissions of greenhouse gases (GHG). For example, the Kyoto Protocol stipulated that the industrialised countries and the member states of the European community would lessen greenhouse gas emissions by 18% from the 1990s levels by 2020 [2]. Similarly, the Chinese Government has committed to reducing greenhouse gas emissions per gross domestic product (GDP) up to 45% by 2020 [3]. In a similar vein, the South Korean Government set a target value of reducing the emissions of domestic GHG by up to 37%, compared to the business as usual (BAU) levels by 2020 [4]. Moreover, various industrial sectors in South Korea have made efforts to achieve the goal of sustainable development at the national level.
The construction industry is one of the main sources of a large volume of GHG emissions, since it consumes a large quantity of energy and building materials [5,6,7,8]. The IPCC report pointed out that this industry not only consumes approximately 40% of global energy, but also emits up to 30% of total global GHG emissions [1]. Furthermore, when the operation and maintenance phase is taken into consideration, the proportion of global energy consumption and GHG emissions from the construction sector is increased [9,10,11,12,13]. The operation and maintenance of the products of the construction industry are quite a lot longer than those of other products or services, because the life span of buildings or structures is more than 40 years [13,14]. Due to this reason, studies regarding energy consumption and the reduction of GHG emissions in this stage have been dominant for many years, compared to other phases of the life cycle of buildings [13,14,15]. While various approaches have been investigated to mitigate the GHG emissions of buildings during the operation and maintenance stage, a growing number of studies in recent years have focused on the GHG emissions in other stages of the life cycle.
Reducing GHG emissions before the operation and maintenance stage has been achieved in various ways, such as the use of low environmental impact materials, the application of high-strength building materials, the use of recycled material or by-products, and design optimisation and process improvement during the manufacturing stage. The majority of studies have maintained that building materials are the main contributor to GHG emissions and that the reduction of building material in the construction stage would be an effective approach to minimise the volume of GHG emissions [16,17,18,19,20,21]. For example, González and Navarro [21] pointed out that the application of low environmental impact building materials would reduce the emissions of GHG at the construction site by up to 28%. Several studies maintained that replacing the typical building materials by high-strength ones would be beneficial to mitigating GHG emissions [11,22,23,24,25,26]. Since reinforced concrete structures and buildings are the most popular materials adopted in the construction industry, numerous studies have concentrated on mitigating the emissions of GHG through the adoption of high-strength materials. Concrete and rebars, which are the main components of reinforced concrete, are the topics mainly dealt with for the strengthening of building materials [25,26,27]. Pacheco-Torres et al. [27] indicated that architects and designers should pay more attention to selecting environmentally friendly building materials in the design stage to minimise the GHG emissions of entire construction projects. In addition to minimising the amount of building materials, various researchers have also argued for the utilisation of recycled materials. Cho and Chae [11] recommended the utilisation of recycled material and by-products, such as blast furnace slag and silica fume, as building materials during the construction stage. Likewise, design optimisation, such as replacing the structural systems, is one of the beneficial approaches during the early execution of construction projects [8,28,29,30,31,32].
Minimising the quantities of building materials and the optimal design of a building or facility might be one effective method to lower GHG emissions during the construction stage. The voided slab system or hollow core slab system is a newly developed slab system that is considered an alternative to lower the impact of greenhouse gases. This would make it possible to enhance the structural performance by reduced self-weight and increased stiffness (see Figure 1). The middle section of the voided slab, where the structural performance is relatively less important than the other parts, is filled with lightweight void formers. In this way, the amount of building materials would be reduced, compared to the ordinary reinforced concrete slab. Additionally, it has been considered that the voided slab system is environmentally friendly compared to the ordinary reinforced concrete slab system, as the hollow parts of the slab would make it possible to reduce the amount of materials. However, research on the assessment of the environmental impacts of the voided slab system is relatively scant, whilst studies have been carried out on the topics of the reliability of the structural performance (i.e., shear and flexural capacities of the voided slab system), optimal void ratio for the best structural capacity, and shapes of void formers, since it works as a structural member of the entire building [33,34,35,36,37,38].
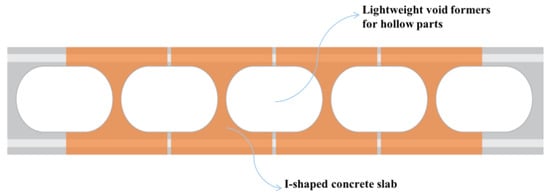
Figure 1.
Conceptual diagram of the voided slab system.
While the cost of change in the early design stage is relatively lower than in the later phases, the impacts of design change are greater than in the latter stages [39,40,41,42,43]. In some cases, materials or methods that are superior for the environmental performance are more expensive than the conventional practices in the construction industry. As growing interest is shown in sustainable and environmentally friendly development in this industry, it is difficult to replace existing materials, even though they have low environmental impact. Hence, it is necessary to determine the cost of construction when replacing conventional building materials. However, assessment of the environmental and economic influences has been performed individually in various studies, rather than through joint analysis. In order to fill these gaps of knowledge, the environmental and economic impacts need to be investigated at the same time.
The purpose of this study is to assess the environmental impacts and the economic efficiency of the voided slab system compared to the ordinary reinforced concrete slab. The life cycle assessment (LCA) and the total cost of construction were calculated to evaluate the performance of both slab systems. In this study, process-based life-cycle assessment was applied to calculate the emissions of GHGs from the ordinary reinforced concrete slab and the voided slab system. Additionally, the total construction costs for both cases were determined based on the unit price of the building materials. An evaluation was conducted to compare the ordinary reinforced concrete slab and the voided slab system, in the two case studies. A comparison was also carried out for the following three stages: manufacture of the building materials, transportation of the building materials to the construction site, and the use of construction equipment on site. Figure 2 indicates the overall procedure of this research.
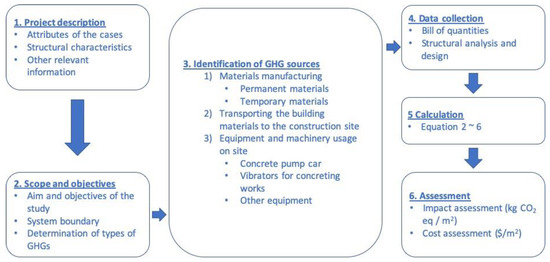
Figure 2.
The overall process of the research.
2. Research Method
2.1. Life Cycle Assessment (LCA)
There are many approaches to assess the environmental performance of a variety of products, processes, and services. Life cycle assessment (LCA) is recognised as one of the methods to support environmental improvements and management. In order to evaluate the GHG emissions of different slab systems, the LCA technique in accordance with ISO 14040 [44] was adopted. The LCA method followed three steps: definition of goal and scope, life cycle inventory analysis, and assessment and interpretation of impacts (see Figure 3). There are two methods to determine the LCA of a product or service, namely the process-based method and the input-output analysis method. In the process-based approach, the system boundary is established to calculate the GHG emissions of a target product or service. The input-output analysis uses the input-output matrix representing all the interactions amongst interconnected industrial sectors in a comprehensive manner. In this research, the process-based approach was adopted to analyse the GHG emissions of structural systems for slab. The system boundary was determined from the manufacturing of building materials to the construction stage, which was from cradle to pre-operation.
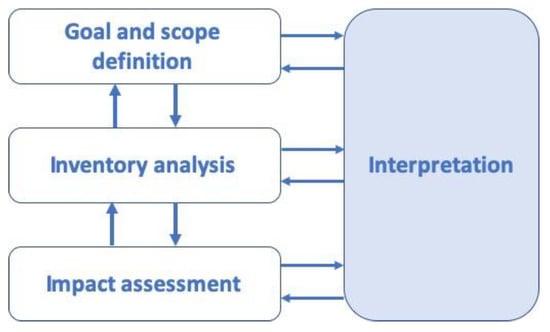
Figure 3.
Phases of a life cycle assessment [44].
2.1.1. Definition of Goal and Scope
Defining the goal and scope of the studied target is the first stage of the LCA. The goal of the present study is to evaluate the emissions of GHG (in kg·CO2·eq/m2) and the total construction cost ($/m2) of the ordinary reinforced concrete slab and the voided slab system. Once this information has been determined, the GHGs emissions and the total construction costs of the ordinary reinforced concrete slab and the voided slab system were compared.
The life cycle of buildings is normally composed of five phases, which are the manufacture of building materials, transportation of the building materials to the construction site, construction and installation, operation and maintenance, and demolition and recycling. The scope of this research was limited to the stages from the manufacture of the building materials to the construction and installation (i.e., cradle to pre-operation). This covered the GHG with the manufacture of the building materials, transportation of the building materials from the manufacturers to the construction site, and the consumption of fuels and usage of the electricity on site by the construction machinery and equipment. In this study, the building materials were divided into permanent and temporary materials. The permanent materials were concrete and rebars for the ordinary reinforced concrete slab, while the voided slab system additionally included void formers and steel decking. In addition, the forms were considered as temporary materials during the evaluation of the GHGs emissions from both slab systems.
According to the definition of GHGs in the Kyoto Protocol to the UN Framework Convention on Climate Change [2], carbon dioxide (CO2), methane (CH4), nitrous oxide (N2O), hydrofluorocarbon (HFCs), perfluorocarbons (PFCs), and sulphur hexafluoride (SF6) are defined as six type of the GHGs. Several studies regarding the GHGs in construction projects have claimed that the emissions of HFCs, PFCs, and SF6 are relatively rare compared to those of CO2, CH4, and N2O. In this study, the definition of the GHGs is only limited to CO2, CH4, and N2O, which commonly occur from buildings and construction projects [3,6,9,43].
2.1.2. Life Cycle Inventory (LCI)
The life cycle inventory (LCI) of this study is adopted from the South Korean National Life Cycle Inventory Database [45]. The materials used for both the ordinary reinforced concrete slab and the voided slab system were divided into permanent materials and temporary materials. The permanent materials for the ordinary reinforced concrete were ready-mixed concrete and reinforcing bars, and the temporary material was forms. The voided slab system comprised the same material properties as the ordinary reinforced concrete slab. However, the voided slab system included two more permanent materials, which were the steel decking and the void formers. The national life cycle inventory database in South Korea (KLCI DB) was used for the GHG emission factors for building materials in this study. Table 1 summarises the inventory of items associated with the functional unit.

Table 1.
Life cycle inventory database.
2.1.3. Assessment of the Life Cycle Impact
The quantification and assessment method adopted in this study was process-based analysis. This method investigates the energy consumption and the GHG emissions from production to demolition of a product. This is a bottom-up approach that complies with ISO 14044 [46] and ISO 21930 [47] to assess the environmental impacts of products or services based on the production processes. In this study, a process-based analysis was adopted to evaluate and compare the GHG emissions from the ordinary reinforced concrete slab with those from the voided slab system during the construction phase. Processes in the construction of buildings are comprised of the production of building materials, which includes the process of raw materials and manufacturing of the building materials; transportation of building materials to the construction site; and construction and installation.
The emissions of GHGs from each stage were determined using Equations (1)–(5) to evaluate the life cycle impacts of both slab systems. Equation (1) was used to determine the emissions of GHG that occurred from building materials before transporting them to the construction site. The elements for computing the GHG emissions from this stage are the amount of each building material (in kg for rebars and void formers, m3 for ready-mixed concrete, and m2 for forms and steel decking), and the GHG emission factors (in kg·CO2·eq/unit) for the building materials.
where E1 is the total emissions of the GHG of building materials (in kg·CO2·eq); Mi represents the amount of building material i (in m3 for ready-mixed concrete, kg for reinforcing bars and expanded polystyrene for void formers, and m2 for forms and steel decking); and fi is the GHG emission factors for material i.
Equation (2) is used to calculate the GHG emissions from transporting building materials to the construction site. In order to calculate the GHG emissions from the transportation of building materials, the amount of building materials and the fuel consumption were considered:
where E2 represents the total GHG emissions from the transportation of building materials to the construction site (in kg·CO2·eq); Fc is the amount of fuel consumed in the transportation stage (in L); Nt is the number of vehicles for materials transportation; and ftrans is the carbon dioxide emissions factors for transportation method (e.g., concrete mixer truck, 4.5 ton lorry, and 11.5 ton lorry).
The fuel consumption of each transportation method (Fc) was determined based on the distance between the manufacturers’ location and the construction site, and the fuel efficiency of the transportation method (see Equation (3)).
where Dm represents the distance between the manufacturer and the construction site (in km) and FEm is the fuel efficiency of the transportation method (in km/L).
Likewise, the number of vehicles needed to transport building materials from the manufacturing location to the construction site (Nt) was calculated considering the amount of building materials and the capacity of each construction method, as indicated in Equation (4):
where Mm is the amount of construction materials (in m3 for ready-mixed concrete, and kg for rebars, steel decking and forms); and Ccap is the capacity of each transportation method. Table 2 summarises the distance of the manufacturer’s location to the construction site and the types of transportation method in this study.
Table 2.
Transportation distance and types of building materials.
The amount of GHG emissions from the construction equipment usage on site was determined by the amount of fuel consumed by the construction equipment. Equation (5) was used to calculate the GHG emissions from the fuel combustion of construction equipment:
where E3 is the total GHG emissions from the fuel consumption of construction equipment (in kg·CO2·eq); Fj is the amount of fuel j consumed by the construction equipment and machinery (in L); and fj is the GHG emission factors for fuel j consumed by the construction equipment (in kg·CO2·eq/L). In this study, only diesel was considered to determine the total GHG emissions from the construction equipment, since the construction equipment in this study consumed only diesel fuel.
2.2. The Cost of Construction
With regard to calculating the total cost of construction in the ordinary reinforced concrete slab and the voided slab system, the database of Korea Price Information was applied to determine the unit price of building materials [48]. The building materials used in both slab systems were ready-mixed concrete, reinforcing bars, forms, steel decking, and void formers. The price evaluation includes the production of corresponding building materials, transportation of building materials from manufacturers to the construction site, and construction and installation of the materials. Table 3 shows the lists of the unit price for all the building materials used in this study. Additionally, the unit price of each material was converted from South Korean Won to US dollars. The conversion rate of one US dollar (USD) was calculated at the rate of 1178 South Korean Won (KRW).
Table 3.
Unit price of the building materials [48].
The construction cost of the both slab systems was computed based on the exact amount of materials from the bill of quantities. The amount of each material for a square meter of each ready-mixed concrete, reinforcing bars, forms, steel decking, and void formers was calculated by structural analysis. Equation (6) was used to calculate the cost of producing the building materials for the ordinary reinforced concrete slab and the voided slab system:
where Qi represents the amount of building materials used for each square meter and Pi indicates the unit cost of the building materials for each square meter.
2.3. Description of the Cases
In this study, two cases were evaluated for the GHG emissions and the total cost of construction from the ordinary reinforced concrete slab and the voided slab system. Figure 2 describes the overall research process of this study. The evaluated cases of this study are two commercial buildings located in Seoul, South Korea. Case 1 started construction of the building in 2012 and was completed in 2014; while the construction of Case 2 started in 2015 and finished in 2016. As indicated in Table 4, the buildings’ structural systems complied with building code requirements for structural concrete (ACI 318-05) [49] and minimum design loads and associated criteria for buildings and other structures (ASCE/SEI 7-10) [50]. Table 4 shows that the overall structural attributes of both cases were similar, but the service load for Case 2 was 50% higher than for Case 1. Since the voided slab system for Case 2 was applied to underground parking and the weight of vehicles was heavier than other items in the building, the service loads for Case 2 were assumed to be slightly higher than for Case 1. In both cases, the structural systems for the slabs were initially designed in the early design stage to be ordinary reinforced concrete slab.
Table 4.
The structural attributes of the cases.
The voided slab system was proposed to replace the ordinary reinforced concrete slab not only to reduce the construction cost, but also to enhance the structural stability and the workability during the construction phase. As shown in Figure 4, construction workers would install the void formers with ease of assembly during the construction phase. The method of anchoring the void formers in this system is to insert the anchoring device into the slots and rotate them by 90° for firm fixing between the lower T-shaped steel decking and the void formers. Due to this ease of work, even novice workers would be able to assemble the void formers with a high degree of accuracy and enhanced workability with reduced work time. Moreover, the lower T-shaped steel decking would work not only to serve as the lower forms for moulding slabs, but also to provide additional structural strength to complement the tensile strength.
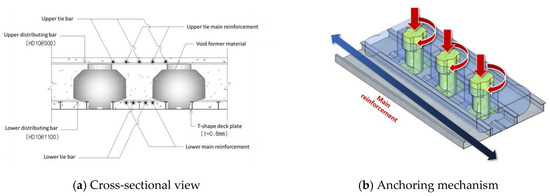
Figure 4.
Illustrations of the voided slab system.
3. Results and Discussions
3.1. The Emissions of Greenhouse Gases
The amount of building materials for the ordinary reinforced concrete slab and the voided slab system were taken off. Then the results of the unit price of each material were separately obtained and analysed. Once the amount of building materials had been calculated, the emissions of GHGs, as well as the costs from the two cases, were determined by applying the indicated equations in the previous section. Table 5 shows the total GHG emissions of the ordinary reinforced concrete slabs and the voided slab systems (i.e., Cases 1 and 2). Within Case 1, the total GHG emissions for the ordinary reinforced concrete slab and the voided slab systems are 256,599 and 224,945 kg·CO2·eq respectively. For Case 2, the ordinary reinforced concrete slab and the voided slab system emit 13,989 and 12,211 kg·CO2·eq of the total GHGs, respectively. Table 5 shows the GHG emissions per square meter that were also calculated in order to compare Cases 1 and 2. For the ordinary reinforced concrete slab system, the emissions of GHG per square meter show similar results, which are 193.82 and 198.24 kg·CO2·eq/m2 for Cases 1 and 2, respectively. Likewise, the GHG emissions of the voided slab systems indicate 169.91 and 173.04 kg·CO2·eq/m2 for Cases 1 and 2, respectively. Based on the above results, the emissions of GHGs per square meter from the ordinary reinforced concrete slab and the voided slab system for both cases indicate approximately 196 and 171 kg·CO2·eq/m2, respectively. In this study, the voided slab system emits roughly 13% less than the ordinary reinforced concrete slab, when the GHG emissions per square meter are considered.
Table 5.
Total GHG emissions.
In both cases, the major source of the GHG emissions is the manufacturing of the building materials (E1), which accounts for approximately 95% (see Table 5). In Case 1, transportation of building materials to the construction site (E2), which is the second largest source of the GHG emissions, produces emissions of 12,123 and 11,032 kg·CO2·eq for the ordinary reinforced concrete slab and the voided slab system, respectively. Case 2 indicates similar results, emitting 13,285 and 11,490 kg·CO2·eq from the transport of the building materials (E2), respectively. The GHG emissions from the operation of construction equipment and electricity usage on site accounts for less than 1% in all cases.
Table 6 indicates the reduction ratio of the GHG emissions of both Cases 1 and 2. A significant reduction would be achieved from the manufacturing of the building materials in both cases. The reduction ratio of each emissions source to the total GHG emission reduction due to the replacement of the ordinary reinforced concrete slab by the voided slab system is indicated in columns 3 and 5 of Table 6. In Case 1, a reduction of 11.9% of GHG emissions is achieved due to the manufacturing of building materials (E1); 0.5% of the reductions are due to the transportation of building materials to the construction site (E2); and a negligible increase of 0.1% is from the operation of construction machinery and electricity usage on site (E3). Case 2 shows similar results in the manufacturing of the building materials (E1), the transportation of building materials to the construction site (E2), and the operation of construction machinery and electricity usage (E3). A 12.8% reduction of the GHG emissions is derived from the manufacture of the building materials (E1). Furthermore, the operation of construction machinery and electricity usage on site (E3) increases 0.1%, the same as E3 in Case 1. The transportation of building materials to the construction site (E2) shows a 0.1% increase of the GHG emissions from applying the voided slab systems. The reason for the slightly higher GHG emissions for the transportation of building materials for the voided slab system is that more lorries were required to convey void formers. Even though the weight of the void formers is lighter than those of other building materials in this study, more lorries are required to convey them since the height of the void formers is higher than other materials. Based on the results, it would make it possible for the voided slab system to reduce GHG emissions by about 12.3 and 12.6% for Cases 1 and 2, respectively. As a result, replacing the ordinary reinforced concrete slab by the voided slab system would be beneficial to mitigating GHG emissions during the construction phase.
Table 6.
Reduction ratio of the total GHG emissions.
Table 5 shows that the manufacturing of the building materials stage is the main source of GHG emissions, regardless of the structural system (i.e., ordinary reinforced concrete slab or the voided slab system) and cases in this study. In all cases, the process of the building materials production accounts for approximately 95% of the GHG emissions. These results are similar to previous studies, which maintain that one of the major contributors to GHG or carbon dioxide emissions in the construction of buildings is the manufacturing stage [3,6,13,27]. Moreover, this research confirmed that the voided slab system provides a potential method to reduce GHG emissions from the materials production stage. When the emissions of GHG from the materials production stage is evaluated, the impact of concrete is greater than the other materials in both cases. Moreover, even though forms are temporary materials for the construction of both slab systems, it is indicated that these account for the second largest source of GHG emissions in the materials production stage. In order to minimise the impacts of forms, it is necessary to increase the ratio of reuse and recycling, or to adopt low embodied carbon materials.
In this study, concrete is the major contributor of the GHG emissions in both slab systems in all cases. For the ordinary reinforced concrete slab, about 58% and 56% of the GHG emissions occur from the concrete. Likewise, the concrete in the voided slab system accounts for approximately 71% and 66% of the GHGs, respectively. While both slab systems were applied to the above ground floors for Case 1, Case 2 was installed for the underground floor slab. This locational attribute would result in a slight increase of the total emissions of GHG in Case 2. In Case 2, which applied to the basement slab, the permanent and service loads of the underground were designed higher, since it was designed as a parking space. In general, the amount of building materials required would be more than for typical floors and the service load factors would be higher than the above ground floor slabs (see Table 6 and Table 7). Considering the locational characteristics of constructing the slabs, it seems that there is a difference in the GHG emissions.
Table 7.
GHG emissions of the building materials in Case 1.
It is generally recognised that the voided slab system or hollow core slab has a reduction possibility of GHG emissions, since its hollow section would cut down the amount of concrete in the slab system [4,36,51]. However, the results of this study show that while there is a slight increase in concrete from Cases 1 and 2, the amount of rebars and steel materials and a significant quantity of forms could be reduced, due to the lower number of beams and girders in the voided slab system (see Table 7 and Table 8). In the case of the voided slab system, the steel decking, which replaced the forms to mould the bottom of the slab, was one of the main contributors to lowering the emissions of the GHGs. Moreover, the steel decking applied to the voided slab system serves a dual purpose of forming the bottom of the slab, as well as providing additional structural performance to complement the rebars and steel materials in the ordinary reinforced concrete slabs. Thus, the voided slab system applied in this study would be beneficial not only to alleviate the environmental burden from the use of less concrete, but also to enhance the structural performance of a building for longer usage.
Table 8.
GHG emissions of the building materials in Case 2.
3.2. Costs
The results of the costs were obtained and analysed separately, based on the quantity take-off data. Regarding the total cost, the voided slab system results in the reduction of total cost in Cases 1 and 2. For the ordinary reinforced concrete slab in both cases, the total cost of construction is USD 113,420 and 6526 for Cases 1 and 2, respectively (see Table 9). Likewise, it is indicated that the total cost of construction for the voided slab system is USD 97,230 and 5792 for Cases 1 and 2, respectively. In all cases, the cost of construction materials and transportation (C1 + C2) are the main contributors to the total cost of construction. The cost of operating construction machinery (C3) is 2.7% and 2.9% for the ordinary reinforced concrete slab and the voided slab system in Case 1, respectively. In Case 2, the cost of operating machinery accounts for 6.4% and 6.8% for the ordinary reinforced concrete slab and the voided slab system, respectively (see Table 9). In this study, the cost of construction and installation only deals with the direct costs, which includes materials, transportation, and the operation of the construction machinery. However, if the overhead costs including costs for space and structures and utilities were also considered, the total cost of construction and installation might be slightly increased.
Table 9.
Total costs and ratio (unit: USD).
In addition, the total cost per square meter ($/m2) is also considered in order to compare each slab system in both cases. Table 9 shows that the total cost per square meter for the voided slab system is lower than for the ordinary reinforced concrete slab. In both cases, the total cost per square meter of the voided slab system is less than 14.3% and 11.2% for Cases 1 and 2, respectively, which is 13 and 11 $/m2 (see Table 9). In this study, Cases 1 and 2 have been applied to different locations, namely aboveground and underground of the building. For Case 1, the voided slab system was applied to the above ground floors, which indicates the total cost of construction is lower than for Case 2 overall. On the other hand, the total cost of construction underground is relatively higher than the aboveground construction, as shown in Table 10. Based on the results of the total cost, it is expected that replacing the ordinary reinforced concrete slab system by the voided slab system would be beneficial to the economic aspect, regardless of the locations of the construction and installation.
Table 10.
Total costs and reduction of costs by structural members (unit: USD).
In this study, a factor that has distinct influence on evaluating the cost of the ordinary reinforced concrete slab and the voided slab system is the quantity of rebars and steel materials for the permanent materials and forms for the temporary ones. In particular, reinforcement is a significant element for reinforced concrete structures to overcome the disadvantage of tensile strength. This might explain why the rebars and steel materials in the ordinary reinforced concrete slab and the voided slab system account for a large proportion of the costs. Moreover, even though the unit price of a rebar is relatively cheaper than that of the other building materials, it seems that the rebars and steel materials account for a high percentage of the total cost, due to the nature of reinforced concrete structures. In some cases, one of the alternative approaches to minimise the cost of rebars in South Korea is to use imported materials, especially rebars from Chinese manufacturers. From an economic perspective, the unit price of Chinese rebars is 680 South Korean Won per kilogram, which is equivalent to 0.57 US dollars per kilogram [48]. This means that a cost reduction of approximately 13% could be achieved. However, the GHG emissions of the imported rebars would be larger compared to that of the domestic ones, since the distance and methods of transportation would be increased.
Once the parameters of the GHG emissions and the total cost had been analysed separately, a joint analysis (kg·CO2·eq/$) was conducted of both the cost of square meter and the GHG emissions. Column 4 and 7 in Table 11 indicate the average of GHG emissions per dollar for the ordinary reinforced concrete slab and the voided slab system. The GHG emissions per dollar for the voided slab system is 2.22, which is slightly higher than the ordinary reinforced concrete slab (see Figure 5). As for the materials perspective, the voided slab system utilises additional building materials such as void formers and steel decking compared to the ordinary reinforced concrete slab. This would cause the slight increase of the total construction costs, and application of alternative building materials for void formers would make it possible to lower the construction costs. Based on the GHG emissions per unit cost in Table 11 and the total GHG emissions from Table 5, the estimation value of GHG emissions per unit cost is indicated in Equations (7) and (8).
Table 11.
GHG emissions and total cost per square meter.
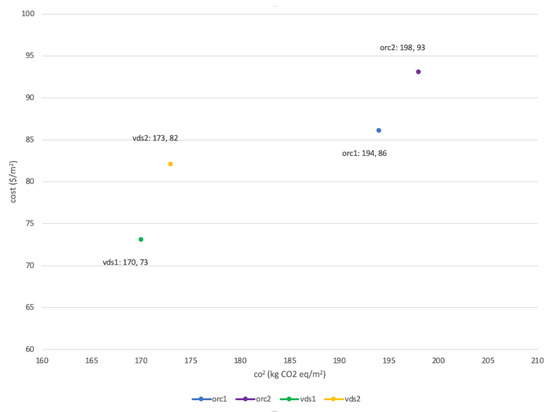
Figure 5.
Unit emissions and cost for Case 1 and 2.
In Equations (7) and (8), 2.195 and 2.123 are the GHG emission conversion coefficient for the ordinary reinforced concrete slab and the voided slab system. These equations would make it possible to predict the total GHG emissions based on the total construction costs in the early design. These would be a useful tool for estimating the GHG emissions for both slab systems utilising the cost of construction.
Moreover, it would be possible to estimate the total cost and the GHG emissions of the voided slab system by adopting the value of an ordinary reinforced concrete slab. That is, it would make it possible for designers or architects to approximate either the GHG emissions or the total costs of the voided slab system by using Equations (9) and (10). In Equation (9), 0.866 is the estimation coefficient for the voided slab system, which would make it possible to calculate the construction cost per square meter based on the unit construction cost ($/m2) of the ordinary reinforced concrete slab. Similarly, 0.878 in Equation (10) is the GHG emission conversion coefficient for the voided slab system based on the unit emission of GHG from the ordinary reinforced concrete slab. These proposed equations could be useful tools for designers and contractors in a construction project to estimate and compare the GHG emissions as well as the total construction costs during the early design stage. Moreover, they could be used as practical decision-making tools which considers both economic and environmental aspects.
If the proposed equations in this study were used during the design stage in building projects, it would be possible to evaluate both the environmental and economic feasibility of the ordinary reinforced concrete slab and the voided slab system at the same time. This is a useful tool for any building project with reinforced concrete slabs to expand the application of the voided slab system in the early design stage. Although the proposed method in this study seems to have such usefulness, it is necessary to carry out further studies to strengthen the suggested procedures. The method proposed in this research was concluded based on two case studies. However, more cases should be investigated in order to enhance the accuracy and applicability of the proposed equations. In this research, the total GHG emissions and the total cost of the ordinary reinforced concrete slab and the voided slab system were limited to the major building materials. However, it would be necessary to carry out further research, which deals with all the building materials for both slab systems, in order to improve the practical application of the proposed method.
4. Conclusions
The purpose of this study was to corroborate the environmental and economic performance of the voided slab system compared to the ordinary reinforced concrete slab. The GHG emissions and the total costs of construction for both slab systems were quantified in order to achieve the purpose. The results of this study indicate that manufacturing building materials contributes most to the total GHG emissions, where concrete accounts for nearly 1/2 of all emissions. Additionally, forms are the second largest contributor of the total GHG emissions and account for nearly 40% and 15% of emissions for the ordinary reinforced concrete slab and the voided slab system, respectively. The production of building materials is an upstream process, which typically involves large energy consumption sectors. Thus, it is considered that the selection of materials in building construction would be an effective approach to alleviating the environmental impact.
In this study, it was verified that the voided slab system indicated better environmental performance than the ordinary reinforced concrete slab. The total GHG emissions of the ordinary reinforced concrete slab were 256,599 and 13,989 kg·CO2·eq, respectively. Additionally, 224,945 and 12,211 kg·CO2·eq of the GHGs were emitted from the voided slab system. For Cases 1 and 2, the reduction of GHG emissions were 12.3% and 12.6% over the ordinary reinforced concrete slab, respectively. From Table 7 and Table 8, the voided slab system would reduce the number of beams and girders, and this would make it possible to reduce the quantity of reinforcing bars. Such reduction in beams and girders for the voided slab system also influenced lowering of the form quantities, which was the second largest contributor of GHG emissions.
Along with the environmental performance of the two slab systems, the economic efficiencies of the ordinary reinforced concrete slab and the voided slab system were assessed by comparison of the total costs of construction. While the construction costs per square meter for the ordinary reinforced concrete was 86 and 93 $/m2, the voided slab system would cost 73 and 82 $/m2. These results indicate that the total construction cost would be reduced by approximately 12% on average for both slab systems. A total cost reduction of 12.3% and 11.2% applied for the case of applying the voided slab system to the aboveground floors and underground parking, respectively. Thus, replacing the ordinary reinforced concrete slab with the voided slab system in the aboveground floors and the underground would make it possible to decrease not only the GHG emissions, but also the cost of construction. Moreover, based on the research findings, it would be beneficial to adopt the voided slab system for both environmental and economic benefits when the voided slab system is being considered during the design stage of building projects.
A limitation of this research is that it only focused on the main building materials for both slab systems. The investigated cases in this study were only one project each for the aboveground floors and the underground floors. To verify the applicability and sustainability of the voided slab system in practice, more studies that investigate more cases for multiple evaluation of the correlation between the GHG emissions and the cost of construction are needed.
In addition, the system boundary of this study was limited to the materials production stage to the construction stage. However, an assessment of GHG emissions during the operation and maintenance and demolition stages should be conducted in order to verify the environmental performance of the entire life cycle of a building.
The results of this study show that the reduction ratio of the underground is relatively higher than the aboveground floor case. This result could be verified by carrying out further studies. While the applied life cycle inventory database of this study was the South Korean LCI DB, a foreign life cycle inventory database is required to expand the application of the voided slab system to other countries. Likewise, the foreign data for the unit price of building materials could be applied to calculate its economic viability.
Author Contributions
S.N. conducted the assessment of GHG emissions and the cost of construction. I.P. designed the overall research and calculated the quantities of building materials.
Funding
This research received no external funding.
Acknowledgments
This work was supported by the National Research Foundation of Korea (NRF) grant funded by the Korea government Ministry of Education (No. NRF-2017R1D1A1B03033452).
Conflicts of Interest
The authors declare no conflict of interests.
References
- Intergovernmental Panel on Climate Change. Global Warming of 1.5C. 2018. Available online: https://www.ipcc.ch/sr15/ (accessed on 20 June 2019).
- UN. Kyoto Protocol to the United Nations Framework Convention on Climate Change; United Nations: Kyoto, Japan, 1997. [Google Scholar]
- Zhang, X.; Wang, F. Assessment of embodied carbon emissions for building construction in China: Comparative case studies using alternative methods. Energy Build. 2016, 130, 330–340. [Google Scholar] [CrossRef]
- Yi, I.S.; Seo, K.S. Social Indicators in Korea; National Statistical Office: Seoul, Korea, 2010. [Google Scholar]
- Cole, R.J. Energy and Greenhouse Gas Emissions Associated with the Construction of Alternative Structural Systems. Build. Environ. 1999, 34, 335–348. [Google Scholar] [CrossRef]
- Yan, H.; Shen, Q.; Fan, L.C.; Wang, Y.; Zhang, L. Greenhouse gas emissions in building construction: A case study of One Peking in Hong Kong. Build. Environ. 2010, 45, 949–955. [Google Scholar] [CrossRef]
- Kim, T.H.; Chae, C.U.; Kim, G.H.; Jang, H.J. Analysis of CO2 Emission Characteristics of Concrete Used at Construction Sites. Sustainability 2016, 8, 348. [Google Scholar] [CrossRef]
- Xing, S.; Xu, Z.; Jun, G. Inventory analysis of LCA on steel- and concrete-construction office buildings. Energy Build. 2008, 40, 1188–1193. [Google Scholar] [CrossRef]
- Hong, J.; Shen, G.Q.; Feng, Y.; Lau, W.S.-T.; Mao, C. Greenhouse gas emissions during the construction phase of a building: A case study in China. J. Clean. Prod. 2015, 103, 249–259. [Google Scholar] [CrossRef]
- Wang, J.; Tam, V.W.Y. Construction industry carbon dioxide emissions in Shenzhen, China. Proc. Inst. Civ. Eng. Waste Resour. Manag. 2016, 169, 114–122. [Google Scholar] [CrossRef]
- Cho, S.-H.; Chae, C.-U. A Study on Life Cycle CO2 Emissions of Low-Carbon Building in South Korea. Sustainability 2016, 8, 579. [Google Scholar] [CrossRef]
- Mao, C.; Shen, Q.; Shen, L.; Tang, L. Comparative study of greenhouse gas emissions between off-site prefabrication and conventional construction methods: Two case studies of residential projects. Energy Build. 2013, 66, 165–176. [Google Scholar] [CrossRef]
- Gan, V.J.; Chan, C.; Tse, K.; Lo, I.M.; Cheng, J.C. A comparative analysis of embodied carbon in high-rise buildings regarding different design parameters. J. Clean. Prod. 2017, 161, 663–675. [Google Scholar] [CrossRef]
- Nadoushani, Z.S.M.; Akbarnezhad, A. Effects of structural system on the life cycle carbon footprint of buildings. Energy Build. 2015, 102, 337–346. [Google Scholar] [CrossRef]
- Peng, C. Calculation of a building’s life cycle carbon emissions based on Ecotect and building information modeling. J. Clean. Prod. 2016, 112, 453–465. [Google Scholar] [CrossRef]
- Ahmadian, F.F.A.; Rashidi, T.H.; Akbarnezhad, A.; Waller, S.T. BIM-enabled sustainability assessment of material supply decisions. Eng. Constr. Archit. Manag. 2016, 24, 668–695. [Google Scholar] [CrossRef]
- Chau, C.-K.; Yik, F.; Hui, W.; Liu, H.; Yu, H. Environmental impacts of building materials and building services components for commercial buildings in Hong Kong. J. Clean. Prod. 2007, 15, 1840–1851. [Google Scholar] [CrossRef]
- Lave, L.; Hendrickson, C.; Horvath, A. Economic input-output models for environment life-cycle assessment. Environ. Sci. Technol. 2002, 32, 184–191. [Google Scholar]
- Lee, J.; Tae, S.; Kim, R. A Study on the Analysis of CO2 Emissions of Apartment Housing in the Construction Process. Sustainability 2018, 10, 365. [Google Scholar] [CrossRef]
- Lee, S.; Park, W.; Lee, H. Life cycle CO2 assessment method for concrete using CO2 balance and suggestion to decrease LCCO2 of concrete in South-Korean apartment. Energy Build. 2013, 58, 93–102. [Google Scholar] [CrossRef]
- González, M.J.; Navarro, J.G. Assessment of the decrease of CO2 emissions in the construction field through the selection of materials: Practical case study of three houses of low environmental impact. Build. Environ. 2006, 41, 902–909. [Google Scholar] [CrossRef]
- Cho, S.; Na, S. The Reduction of CO2 Emissions by Application of High-Strength Reinforcing Bars to Three Different Structural Systems in South Korea. Sustainability 2017, 9, 1652. [Google Scholar]
- Baek, C.; Tae, S.; Kim, R.; Shin, S. Life Cycle CO2 Assessment by Block Type Changes of Apartment Housing. Sustainability 2016, 8, 752. [Google Scholar] [CrossRef]
- Park, J.; Tae, S.; Kim, T. Life cycle CO2 assessment of concrete by compressive strength on construction site in Korea. Renew. Sustain. Energy Rev. 2012, 16, 2940–2946. [Google Scholar] [CrossRef]
- Tae, S.; Baek, C.; Shin, S. Life cycle CO2 evaluation on reinforced concrete structures with high-strength concrete. Environ. Impact Assess. Rev. 2011, 31, 253–260. [Google Scholar] [CrossRef]
- Tae, S.; Shin, S.; Woo, J.; Roh, S. The development of apartment house life cycle CO2 simple assessment system using standard apartment houses of South Korea. Renew. Sustain. Energy Rev. 2011, 15, 1454–1467. [Google Scholar] [CrossRef]
- Pacheco-Torres, R.; Jadraque, E.; Roldán-Fontana, J.; Ordóñez, J. Analysis of CO2 emissions in the construction phase of single-family detached houses. Sustain. Cities Soc. 2014, 12, 63–68. [Google Scholar] [CrossRef]
- Basbagill, J.; Flager, F.; Lepech, M.; Fischer, M. Application of life-cycle assessment to early stage building design for reduced embodied environmental impacts. Build. Environ. 2013, 60, 81–92. [Google Scholar] [CrossRef]
- Martí, V.J.; García-Segura, T.; Yepes, V. Structural design of precast-prestressed concrete U-beam road bridges based on embodied energy. J. Clean. Prod. 2016, 120, 231–240. [Google Scholar] [CrossRef]
- Guggemos, A.A.; Horvath, A. Comparison of Environmental Effects of Steel- and Concrete-Framed Buildings. J. Infrastruct. Syst. 2005, 11, 93–101. [Google Scholar] [CrossRef]
- Cabeza, L.F.; Rincón, L.; Vilariño, V.; Pérez, G.; Castell, A. Life cycle assessment (LCA) and life cycel energy analysis (LCEA) of buildings and the building sector: a review. Renew. Sustain. Energy Rev. 2014, 29, 394–416. [Google Scholar] [CrossRef]
- Ibrahim, I.; Elliott, K.; Abdullah, R.; Kueh, A.; Sarbini, N. Experimental study on the shear behaviour of precast concrete hollow core slabs with concrete topping. Eng. Struct. 2016, 125, 80–90. [Google Scholar] [CrossRef]
- Hwang, H.; Kim, S.; Hwang, H.; Lee, K.; Lee, J. Structural performance of hollow reinforced concrete half slabs. Proc. Korea Concr. Inst. 2008, 20, 45–48. [Google Scholar]
- Kim, H.-S.; Kang, I.-S.; Lee, H.-S. Experimental study on the flexural behavior of I-slab. Proc. Korea Concr. Inst. 2007, 19, 5–8. [Google Scholar]
- Lee, K.; Lee, G.; Hwang, H. Hollow Core Slab by Light Weight Assembly. Patent 1009584070000, 10 May 2010. [Google Scholar]
- Chung, J.-H.; Jung, H.-S.; Bae, B.-I.; Choi, C.-S.; Choi, H.-K. Two-Way Flexural Behavior of Donut-Type Voided Slabs. Int. J. Concr. Struct. Mater. 2018, 12, 26. [Google Scholar] [CrossRef]
- Aldejohann, M.; Schnellenbach-Held, M. Investigations on the shear capacity of biaxial hollow slabs-test results and evaluation. Darmst. Concr. 2003, 18, 532–545. [Google Scholar]
- Schnellenbach-Held, M.; Pfeffer, K. Punching behavior of biaxial hollow slabs. Cem. Concr. Compos. 2002, 24, 551–556. [Google Scholar] [CrossRef]
- Song, L.; Mohamed, Y.; Abourizk, S.M. Early Contractor Involvement in Design and Its Impact on Construction Schedule Performance. J. Manag. Eng. 2009, 25, 12–20. [Google Scholar] [CrossRef]
- Azhar, S.; Carlton, W.A.; Olsen, D.; Ahmad, I. Building information modeling for sustainable design and LEED® rating analysis. Autom. Constr. 2011, 20, 217–224. [Google Scholar] [CrossRef]
- Zimina, D.; Ballard, G.; Pasquire, C. Target value design: using collaboration and a lean approach to reduce construction cost. Constr. Manag. Econ. 2012, 30, 383–398. [Google Scholar] [CrossRef]
- Chau, C.-K.; Leung, T.; Ng, W. A review on Life Cycle Assessment, Life Cycle Energy Assessment and Life Cycle Carbon Emissions Assessment on buildings. Appl. Energy 2015, 143, 395–413. [Google Scholar] [CrossRef]
- Ferreiro-Cabello, J.; Fraile-Garcia, E.; de Pison Ascacibar, E.M.; de Pison Ascacibar, F.J.M. Minimizing greenhouse gas emissions and costs for structures with flat slabs. J. Clean. Prod. 2016, 137, 922–930. [Google Scholar] [CrossRef]
- International Organisation for Standization. ISO: 14040: Environmental Management Life Cycle Assessment Principles and Framework; ISO: Geneva, Switzeland, 2006. [Google Scholar]
- The Korea Environmental Industry and Technology Institute (KEITI). Korea LCI DB Information Network. Available online: http://www.epd.or.kr/en/lci/lci_intro.asp (accessed on 20 June 2019).
- International Organistion for Standard. ISO14044: Life Cycle Assessment (Requirement and Guidelines); Interantional Organisation for Standization: Geneva, Switzeland, 2006. [Google Scholar]
- International Organisation for Standization. ISO: 21930: Environmental Declaration of Building Product; ISO: Geneva, Switzeland, 2007. [Google Scholar]
- Korea Price Information Corporation. Korea Price Information; Korea Price Information Corporation: Seoul, Korea, 2017. [Google Scholar]
- American Concrete Institute Committee. Building Code Requirements for Structural Concrete (ACI 318-05) and Commentary (ACI 318R-05); American Concrete Institute: Farmington Hills, MI, USA, 2005. [Google Scholar]
- American Society of Civil Engineers. Minimum Design Loads and Associated Criteria for Buildings and Other Structures (7–10); American Society of Civil Engineers: Preston, WV, USA, 2010. [Google Scholar]
- Kim, S.; Jang, T.; Kim, S. Structural performance tests of two-way void slabs. J. Archit. Inst. Korea Struct. Constr. 2009, 25, 35–42. [Google Scholar]


© 2019 by the authors. Licensee MDPI, Basel, Switzerland. This article is an open access article distributed under the terms and conditions of the Creative Commons Attribution (CC BY) license (http://creativecommons.org/licenses/by/4.0/).