Article

Sustainability Assessment of Provincial-Level Regions in China Using Composite Sustainable Indicator

1
School of Business Administration, Northeastern University, Shenyang 110167, China
2
Northeastern Evaluation Center, Northeastern University, Shenyang 110167, China
3
School of Economics, Liaoning University, Shenyang 110136, China
*
Author to whom correspondence should be addressed.
Sustainability 2019, 11(19), 5289; https://doi.org/10.3390/su11195289
Submission received: 7 August 2019 / Revised: 10 September 2019 / Accepted: 24 September 2019 / Published: 25 September 2019

Abstract

:
Sustainability development is a core issue and policy-priority in China to meet the long-term ecological civilization and economic growth. In this paper, the sustainability of the 31 Chinese provincial-level administrative regions (provinces for short) was investigated using a composite sustainability indicator (CSI). The CSI was constructed by aggregating thirty sustainability indicators involving economic, social, and environmental dimensions hierarchically. Moreover, a piecewise mean range normalization method was developed for weakening the impact of outlier(s). The results indicate that further improvement of the provinces’ sustainability is needed, since only three provinces (accounting for 9.68%) showed better performance and development momentum, simultaneously. However, over half of the provinces showed comparatively optimistic sustainability prospect, indicating a possibility of further sustainability improvement in China under a positive and effective guidance. In terms of the individual provinces, the decline of the sustainability of Liaoning and Tianjin was significant whereas Anhui, Hunan, and Hubei showed more optimistic development prospects. For the four regions, Middle China was on the rise, the decline of Northeastern China was serious, and East China and West China showed better development, but they should also keep vigilance on the possible decline because of the decline of competitive advantages.

1. Introduction

The assessment of sustainability is now a major concern for national governments and international organizations. Improving sustainability of the provincial-level administrative regions (provinces for short) in mainland China has become a core issue and policy-priority for the Chinese government to meet the long-term ecological civilization and achieve economic growth goals. Sustainability assessment is becoming an increasingly important instrument for policy dialogue and governance given the need to tackle the trade-offs between the economy and the environment. A widely accepted definition of sustainability as given by Brundtland [1] is “development that meets the needs of the present without compromising the ability of future generations to meet their own needs”. The research of sustainability development has become popular for scholars and researchers in various fields [2,3,4,5,6,7,8,9,10,11]. As the differences of the geographical locations, natural resources, population, economic foundation, and others are significant for the 31 provinces in mainland China, it is necessary to investigate sustainability development to provide reference for strategic planning and natural resource management [12].
Sustainability assessment plays an essential role in implementing sustainability since it can act as a framework for better decision-making on all undertakings, such as policies, plans, and programs as well as physical undertakings that may have lasting effects [13]. Various frameworks and models have been developed for sustainability assessment by involving a number of sustainability criteria [9]. The selection of sustainability criteria is a key factor that exercises a great influence on the performance of provinces’ sustainability. A widely accepted approach is represented as a 3-pole or 3-pillar model [14,15,16], either explicitly or tacitly bringing together the environment, economy, and society dimensions [17]. Raveta developed an integrated assessment framework by considering the index factors of environment, economy, and society used for the investigation of integrated planning for long-term sustainable development in Greater Manchester, UK [18]. Krajnc and Glavič built a composite sustainable development index (ICSD) by integrating the information on economic, environmental, and social performance to monitor Henkel company sustainability [19]. Lozano analyzed the complex and dynamic equilibria among economic, environmental, and social aspects and the short-, long- and longer-term perspectives [20]. Bibri and Krogstie adopted an analytical and philosophical framework of STS to demonstrate that the success and expansion of smart sustainable cities stems from the transformational power, knowledge/power relation, productive and constitutive force [8]. Garcia and Davide disclosed useful techniques and strategies, aiming to integrate social aspects, green architecture designs and traditional ecological issues [10]. In addition, more models introduced other dimensions as additional pillars [17], such as natural resources [21], culture [22,23], tourism [11] and others [24,25].
Since the number of the sustainability criteria is large and the criteria are often from different dimensions, such as the environmental, economic, and social dimensions, it is necessary to integrate them into a composite indicator (CI) so as to provide comprehensive information for assessing provinces’ sustainable performances. The CI can be defined as an aggregation of different indicators according to a well-developed and pre-determined methodology [26,27]. The framework used for constructing a CI generally includes the procedures of selecting relevant indicators and data, inputting missing data, normalizing the selected indicators, weighting, and aggregating [28]. Even though all of the steps are essential for the validity of the final CI, the normalizing, weighting and aggregating steps seem to have the greatest impact [27].
Normalization approaches are used for scaling the criteria values down to a unified scale and rendering the units of measurement dimensionless [29,30]. A great many normalization approaches have been developed in the literature, including the mean range normalization, frequency normalization, maximize normalization, rational normalization, statistical normalization, ordinal normalization, and others [31,32].
For a number of sustainability criteria, it is necessary to rank their importance before aggregating them [33]. Therefore, the weight of each criterion is needed. The analytical hierarchy process (AHP) method [34], Shannon’s entropy [35], and the equal weighting method are three types of common techniques used for calculating criteria weight in applications. It is known that the AHP method determines criteria weights subjectively, which integrates individual judgments of experts to determine priority scales through pair-wise comparison matrices [36]. Hu et al. applied the AHP method to determine the relative weightings of the criteria, which were used for evaluating the quality and the contents of the voluntary information disclosure of sustainability reports in Taiwan [37]. Lee and Chan used the AHP to work out the most sustainable design proposal for an area undergoing urban renewal such as Hong Kong [38]. The entropy technique is an objective weighting method. It suggests that the weight assigned to a certain criterion should be larger when the alternatives show greater differences between the values of the associated criteria [39]. Zinatizadeh et al. used the entropy to get the criteria weights when constructing the composite indicator for sustainable development in different urban areas of Kermanshah city [40]. Yan et al. adopted the entropy weight to evaluate the sustainability development of machining process based on extension theory [41]. Peng et al. developed a general decision-making framework for dynamic monitoring the sustainability of urban regeneration, where the entropy method was used to determine the weight of critical measurement indicator [42]. In addition, the equal weighting method is popular in most of the composite indicators that assign all the criteria the same weight [43,44,45].
Many aggregation methods have been developed for aggregating the criteria weight and the normalized values to a final composite indicator, such as the weighted arithmetic mean (WAM) method [46], the weighted geometric average (WGA) method [33], the hybrid optimization model for electric renewable (HOMER) for estimating and analyzing the economic and technical systems [47], the exponential weighted mean function [48], the technique for order preference by similarity to ideal situation (TOPSIS) method [49,50], and others [51,52]. In applications, the WAM method is one of the most widely used methods for its simplicity, transparency, and easy understanding.
This paper attempts to assess the sustainability of provinces in China using a weak sustainability approach without considering the interaction or interdependence among criteria. The assessment results could provide more reference for the sustainable development of the provinces. A three-level assessment structure including the dimension level, criteria level, and sub-criteria level was used to construct the CSI. In the dimension level, the 3-pillar model, involving the economic, social, and environmental dimensions, was adopted. The rest of the paper is organized as follows. Section 2 proposes the framework for building the CSI and introduces some key methods for calculating the CSI from the weak sustainability aspect. In Section 3, a case study regarding the dynamic assessment of the 31 provinces’ sustainability performances in mainland China is introduced. The assessment results are given in this section. Section 4 presents some discussion. Conclusions and suggestions are outlined in Section 5.

2. Methods

An assessment framework involving the dimension level, criteria level, and sub-criteria level is used for the construction of the CSI in this paper, which is shown in Figure 1.
The CSI is used to measure the sustainable performances of the 31 Chinese provinces over consecutive years in the following section. Therefore, without loss of generality, let x i j ( q , u ) ( t h ) represent the actual performance value of alternative (province) a i with respect to sub-criterion c j ( q , u ) in assessment period t h , where i = 1 , 2 , , n indicates n alternatives, q = 1 , 2 , , m indicates m dimensions, u = 1 , 2 , , z q indicates z q criteria under the qth dimension, j = 1 , 2 , , z q u indicates z q u sub-criteria under the u th criteria and the qth dimension, and h = 1 , 2 , , p indicates p assessment periods.
The WAM method is selected for the aggregation of criteria values at different levels. Let I i u ( q ) ( t h ) represent the aggregation score of alternative a i with respect to criterion c u ( q ) in assessment period t h , then
I i u ( q ) ( t h ) = j = 1 z q u w j r i j ( q , u ) ( t h ) ,   i = 1 , 2 , , n ;   h = 1 , 2 , , p
where r i j ( q , u ) ( t h ) is the normalized value of x i j ( q , u ) ( t h ) , and w j is the equal weight of the associated sub-criterion such that w j = 1 / z q u .
Let I i q ( t h ) represent the aggregation score of alternative a i with respect to dimension c q in assessment period t h , then
I i q ( t h ) = u = 1 z q w u I i u ( q ) ( t h ) ,
where w u is the equal weight of criterion c u ( q ) such that w u = 1 / z q .
Let I i ( t h ) represent the final aggregation score (CSI) of alternative a i in assessment period t h , then
I i ( t h ) = f = 1 m w q I i q ( t h ) ,
where w q = 1 / m is the equal weight of dimension c q .
Using the I i ( t h ) , it can not only rank alternatives so as to select the optimal alternative(s), but also analyze the alternatives’ development over consecutive assessment periods.
However, when dealing with complex problems, such as provinces’ sustainability assessment, outliers may exist in the actual performance values. For example, the actual performance values of the 31 Chinese provinces on the criterion “water resources per capita” (unit: m3) are shown in Figure 2. It can be seen that there is an outlier among the actual performance values, which is the performance of Tibet autonomous region. The mean range normalization is selected to scale the actual values into the range of [0,1]. The normalized results are shown in Figure 2a. It can be seen that the divergent of the normalized values of the 30 provinces, except for Tibet autonomous region, was narrowed compared with that of the actual performance values because of the existence of the outlier.
To this problem, a new normalization method is proposed based on the mean range method called the piecewise mean range normalization. This method also scales the performance values into the range of [0,1] but weakens the impact of outlier(s) using a piecewise way. Without loss of generality, assume that there are l piecewise points in the range of [0,1] that divide the range into l + 1 piecewise intervals marked as [ α 0 , α 1 ] , ( α 1 , α 2 ] , , ( α l , α l + 1 ] , where α 0 = 0 , α l + 1 = 1 , and α 1 , , α l ( 0 , 1 ) . Then, calculate the percentiles of the left/right endpoints of the piecewise intervals according to a set of actual sub-criteria values { x 1 j ( q , u ) ( t h ) , x 2 j ( q , u ) ( t h ) , , x n j ( q , u ) ( t h ) } on sub-criterion c j ( q , u ) in assessment period t h , labeled as β 0 , β 1 , , β l , β l + 1 , respectively.
If c j ( q , u ) is a benefit criterion, the normalized value of the sub-criteria value x i j ( q , u ) ( t h ) ( i { 1 , 2 , , n } ) is defined as
r i j ( q , u ) ( t h ) = α k + ( α k + 1 α k ) x i j ( q , u ) ( t h ) β k β k + 1 β k ,   if x i j ( q , u ) ( t h ) [ β k , β k + 1 ] , k = 0 , 1 , , l
Whereas, when c j ( q , u ) is a cost criterion, the normalized value is calculated by
r i j ( q , u ) ( t h ) = α l k + ( α l + 1 k α l k ) β k + 1 x i j ( q , u ) ( t h ) β k + 1 β k
where r i j ( q , u ) ( t h ) [ 0 , 1 ] is the normalized value of alternative a i with respect to sub-criterion c j ( q , u ) in assessment period t h .
For the example mentioned above, use the piecewise mean range method to normalize the actual values of 31 provinces on the “water resources per capita” according to Equation (4), where the piecewise points are designed as quartiles, such as α 0 = 0 , α 1 = 0.25 , α 2 = 0.5 , α 3 = 0.75 , α 4 = 1 . The normalization results are shown in Figure 2b. Comparing Figure 2b with Figure 2a it can be seen that the differentiation of the normalized values obtained by the piecewise mean range method is improved significantly compared with that by the traditional mean range method.
Example 1
Assume that there are 11 objectives o 1 , , o 11 and two dimensions c 1 and c 2 . c 1 has two criteria c 1 1 , c 1 2 , and c 2 has one criterion c 2 1 . c 1 1 has two sub criteria c 1 11 and c 1 12 . c 1 2 has sub criteria c 1 21 and c 1 22 . c 2 1 has two sub criteria c 2 11 and c 2 12 . Specially, c 1 21 is cost indicator while others are benefit indicators. The initial assessment information is as shown in Table 1.
(1) Normalizing
Normalizing the initial information by the method of the piecewise mean range normalization. The indicator c 2 11 is normalized by the Equation (5) and other indicators by the Equation (4). Then, as α 0 = 0 , α 1 = 0.25 , α 2 = 0.5 , α 3 = 0.75 , we obtain the normalizing results as shown in Table 2.
(2) The CSI
The weight of each sub-criterion is obtained by the entropy method, and the values of criteria c 1 1 , c 1 2 , c 2 1 of each objective are calculated by Equation (1). Then we obtain the result as shown in Table 3.
Then, the weight of each criterion can be obtained by the entropy method, and the values of dimensions c 1 and c 2 of each objective are calculated by the Equation (2). The result is shown in Table 4.
Assume that the weight of each dimension is equal weight; then, by the Equation (3), we obtain the final aggregation score (CSI) of each objective. The result is I 1 = 0.7626 , I 2 = 0.6111 , I 3 = 0.2373 , I 4 = 0.3510 , I 5 = 0.5222 , I 6 = 0.4602 , I 7 = 0.3812 , I 8 = 0.2403 , I 9 = 0.6741 , I 10 = 0.6071 , I 11 = 0.6250 , as Table 4 shows.

3. Case Study: Sustainability Assessment of Provincial-Level Regions in China

3.1. Index System

In this section, 31 provinces in mainland China were selected for investigation. Their locations are shown in Figure 3.
In this paper, the matter to be assessed is whether or not a province is progressing in a sustainable manner. Having this in mind, we lead to a discussion about the criteria selection around the following questions:
(1)
What is the priority in the current period from the policy dialogue?
(2)
What dimensions of sustainability should be taken into account?
(3)
Which criteria represent better each dimension at the macro level?
Firstly, the assessment sustainability has different priorities in different periods. China is a developing country, and the authorities take economy development as the primary task in the current circumstances. Secondly, the indicators are classified into three dimensions, economy, society, and environment. The purpose of economic development is to assist people for better living standard, even for survival. Economy is the basis of social development. Then, the environment and the natural resources provide the material basis for economic development. That is the interrelation among the three-pillars. Similarly, Mischen et al. argue that the trade-offs that are inherent in the interrelations between the three pillars of sustainability raise the question of whether it is acceptable to substitute natural capital for other forms of capital [53], such as people’s better living standards. Thirdly, the availability of data was also a criterion for selection. This is why some consistent indicators involving gender issues like water quality or the state of biodiversity have to be excluded from the dataset. We point out that strictly speaking, the selected criteria cannot completely reflect the depth and variety of factors affecting provinces’ sustainability since it should ensure the dada of indicators for all provinces can be available over time.
For provinces sustainability assessment, however, there are no commonly recognized criteria used for measuring sustainable development [54]. A set of 30 sub-criteria have been developed by referring to the relevant literature reviews on sustainability investigation of China’s cities, urban or provinces [9,55,56]. Note that we chose 30 sub-criteria, which strictly speaking are not sufficient for sustainability assessment because we were fettered by the accessibility of criteria data. All the sub-criteria are categorized into 6 criteria under the economic, social and environmental dimensions based on the 3-pillar model, as shown in Table 5.
The assessment of sustainability has different priorities in different periods. There is essentially a difference in development stages between developed countries and developing countries. In developed countries, the sustainability discussion focuses on environmental topics largely, while in developing countries the issues of poverty are equally important [64]. Issues of sustainability have been addressed differently in different parts of the world, according to the policymaking and environmental priorities of cities and countries [65]. The authorities in China take economic development as the primary task in the current circumstances, even for future decades. Therefore, economic sustainability serves as the guarantee of provincial sustainability. Motivated by the concept of sustainable consumption and production (SCP) [64], we consider the efficiency of resource use in the production. We construct the criteria of the quantity of economic growth and the quality of economic development to reflect the purpose of keeping the energy, material, and pollution intensity of production and consumption functions within the carrying capacities of natural systems. As one of the important indicators of economic quantity, c 1 ( 1 , 1 ) directly reflects the economic level of an individual province. c 2 ( 1 , 1 ) points to the situation of economic growth. c 3 ( 1 , 1 ) shows the capability of enlarging reproduction and readjusting the economic structure. c 4 ( 1 , 1 ) was selected to reflect people’s consumption level and purchasing power of social commodities [66]. c 5 ( 1 , 1 ) reflects the economic openness of an individual province. c 1 ( 1 , 2 ) reveals the development of service industry. c 2 ( 1 , 2 ) , c 3 ( 1 , 2 ) , c 4 ( 1 , 2 ) , and c 5 ( 1 , 2 ) indicate the impact of the economy on the environment, then measure the economic sustainability.
Social sustainability considers the basic demands of contemporary people as well as the development of future generations. It focuses on the population of provinces and their infrastructure and living standard and security as well. c 1 ( 2 , 1 ) represents the trend of natural population growth, and c 2 ( 2 , 1 ) reflects the distribution of a province’s population. c 3 ( 2 , 1 ) , c 4 ( 2 , 1 ) , c 5 ( 2 , 1 ) reflect the construction of a province’s infrastructure. c 1 ( 2 , 2 ) was chosen to indicate the state of unemployment and social stability. c 2 ( 2 , 2 ) measures the living standard of a province’s residents. c 3 ( 2 , 2 ) , c 4 ( 2 , 2 ) indicate the situation of the living security for a province’s residents. c 5 ( 2 , 2 ) reflects the efforts that the local authorities make to satisfy the people’s demands of basic living.
Environmental sustainability serves as the basis of a province’s sustainability, which primarily pays attention to natural resources, ecosystem, and environmental protection. c 1 ( 3 , 1 ) shows the possession of water resources within a province. c 2 ( 3 , 1 ) , c 3 ( 3 , 1 ) , c 4 ( 3 , 1 ) , and c 5 ( 3 , 1 ) reveal the situation of green area within a province. The government pays more attention to the environmental investment rather than the environmental incomes due to the current state of technologies and economic development. We chose c 1 ( 3 , 2 ) , c 4 ( 3 , 2 ) to measure the investment that the local authorities put in environmental protection and reflect the importance that a province attaches to environmental protection. c 2 ( 3 , 2 ) , c 3 ( 3 , 2 ) , and c 5 ( 3 , 2 ) reflect a province’s ability to repair the environment.

3.2. The Implementation of the CSI

The performance values of the sub-criteria in 2011–2016 were collected from the China Statistical Yearbook (2012–2017). The methods introduced in Section 2 were used to obtain the aggregations at criteria level, dimension level, and the final CSI in different assessment years. The process can be summarized as follows.
Step 1: Scale the performance values of the sub-criteria into the range of [0,1] by using Equations (4) and (5).
Step 2: For the normalized sub-criteria values, aggregate them with the equal weight by Equation (1) to get the aggregations of the criteria level.
Step 3: For the aggregations of the criteria level, aggregate them with the associated equal weight by Equation (2) to get the aggregations of the dimension level.
Step 4: The final CSI is received by integrating the aggregations of the dimensions by Equation (3).
Note that the equal weights at different levels are shown in Table 5. By the steps above, the final CSI of 31 provinces from the year 2011 to 2016 is obtained. The results are shown in Table 6.
The average score of Beijing (0.598), for example, is calculated by the formula of (0.565 + 0.590 + 0.609 + 0.605 + 0.588 + 0.634)/6, and the growth rate (2.44%) is calculated by (0.634 − 0.565)/(0.565   ×   5)   × 100%.

4. Discussion

It can be seen that Beijing had the best performance with the highest average sustainability score. Henan province is comparatively lower, but it showed the largest growth rate (9.30%). All of the provinces, except Tianjin and Liaoning, showed better development momentum with positive growth rates. The rank of the four regions from the best to the worst was as follows: East China, West China, Northeastern China, and Middle China. Although East China had the best performance, its growth rate was the lowest among the four regions. On the contrary, Middle China showed the largest growth rate but its performance was located at the bottom. It indicates that Middle China has better sustainable development potential in the future. Additionally, both the performance and the growth rate of Northeastern China are comparatively lower among the four regions as the lack of development motivation.
Moreover, the 31 provinces were divided into four quadrants, shown in Figure 4, by the midpoints of the average score interval and growth rate interval. Quadrants (I) to (IV) represent higher development, higher growth rate; lower development, higher growth rate; lower development, lower growth rate; higher development, lower growth rate, respectively. Provinces located in the quadrant (I) have better sustainability performance and development momentum. In quadrant (II), although the provinces show poor performance, they have better development momentum. Quadrant (III) indicates poor performance and the lack of development motivation. The provinces in quadrant (IV) show better performance but lack of development motivation.
It can be seen that only three provinces (accounting for 9.68%) located in the quadrant (I). Meanwhile, there were six provinces (accounting for 19.35%) in the quadrant (Ⅲ). It indicates that further improvement of the provinces’ sustainability is necessary. The number of the provinces in the quadrant (Ⅲ) was the same as that in the quadrant (Ⅳ), accounting for 35.48%. Specially, Henan province showed the strongest development momentum, whereas the sustainability decline of Tianjin was significant. More attention should be paid to the sustainability of Liaoning province because of its comparatively poor performance and the lack of development motivation. Since the sub-criteria values in different assessment years are uniformly normalized and the weights of the dimensions, the criteria, and the sub-criteria are the same across different years, it is reasonable to rank 31 provinces overall from the year 2011 to 2016. In this case, the ranking range of the 31 provinces is [1,186] This type of ranking is denoted as dynamic ranking. The absolute development of each province can be analyzed by observing the change of the dynamic ranking in different years. For example, if the ranking is improved in the later years, the province associated can be considered to have better development momentum. The change of the dynamic ranking of the 31 provinces and the four regions is shown in Figure 5.
It can be seen that the rankings of the provinces, except Liaoning and Tianjin, showed increase to some extent. It indicates that these provinces had better development momentum, which is consistent with the judgment mentioned above. In terms of the four regions, Middle China showed the highest average annual increase. The optimal performances of the provinces in the four regions are: Beijing (1), East China; Chongqing (5), West China; Anhui (20), Middle China; Jilin (73), Northeastern China, respectively, where the value in the parentheses represents the optimal ranking of the province associated. In addition, it can be seen that Northeastern China ranks at the bottom and has the lowest increase. As typical examples, Beijing, Hainan and Tibet perform well. By analyzing the actual data, the outstanding performance of the economy of Beijing compensates for the weakness of environment performance. For similar reasons, Tibet and Hainan have abundant natural resources and relatively good environment that compensate for the low-level economy.
Moreover, the provinces can be ranked within a single year. In this case, the ranking scores of the 31 provinces range in [1,31]. Using the single year ranking across different years, the provinces’ relative (or competitive) development can be further discussed. The change of the single year rankings of the provinces is shown in Figure 6.
From Figure 6, it is shown that most provinces showed a decline with respect to the single year ranking compared with the dynamic ranking shown in Figure 5. For the four regions, only Middle China had a positive growth rate (3.9%). The decline of Northeastern China was significant, especially Liaoning province at the bottom among the 31 provinces in 2016. The optimal rankings of the provinces in the four regions are Beijing (1), East China; Tibet (3), West China; Anhui (9), Middle China; Liaoning (12), Northeastern China, respectively.
The provinces’ sustainability prospect in the future is discussed further by comparing the growth rate of the dynamic ranking and the single year ranking. For example, if both types of growth rates are positive, it indicates that the province associated has better development prospects. On the contrary, if the province has negative growth rates, it means that the province may be outperformed in the future. While for the province with positive growth rate in the dynamic ranking and negative growth rate in the single year ranking, even though it may not loss its edge in the short-term, it should be aware of the decline in absolute development because of the decrease of relative (or competitive) advantage in the future. Figure 7 shows the classification of the provinces.
In Figure 7 the x-axis represents the growth rate of the dynamic ranking, and the y-axis represents the growth rate of the single year ranking. It can be seen that there were 16 provinces (accounting for 51.6%) with positive growth rates of the dynamic ranking and the single year ranking, among which Anhui, Hunan, and Hubei had more optimistic development prospects. Eleven provinces (accounting for 35.5%) showed a positive growth rate of the dynamic ranking and negative growth rate of the single year ranking. The provinces with the decrease in competitive advantage, such as Gansu, Tibet, and Yunnan, should keep vigilance on the possible decline of sustainability in the future. The sustainability of the two provinces, Liaoning and Tianjin, may still present decrease in future. Beijing ranks at the top and had a better development prospect. Whereas Jiangsu showed lower competitiveness as the growth rate of the single year ranking was zero.
Figure 8 shows the performance of three pillars of the four regions. In Figure 8 East China performed best at Economic sustainability (3.6189) and social sustainability (3.4583), while the environmental sustainability had the lowest value (2.5520). However, West China, which showed a contrary performance compared to East China, had better environmental sustainability (3.4229), followed by economic sustainability (2.6690), and social sustainability (2.8136). The performance of Middle China was not very prominent on economic sustainability (2.6775), social sustainability (2.7355), and environmental sustainability (2.6765). Northeastern China performed moderately in all dimensions and the score of economic sustainability was 3.0312, social sustainability was 2.3467, and environmental sustainability was 2.8654.

5. Conclusions and Suggestion

In this paper, the sustainability of the 31 provincial-level regions in mainland China was assessed. Thirty sustainability indicators involving economy, society, and environment were constructed to obtain the CSI. In this process, the piecewise mean range normalization method was developed to weaken the impact of outlier(s).
Generally, the assessment results indicate that further improvement of the provinces’ sustainability is needed in mainland China as only three provinces (accounting for 9.68%) had better performance and development momentum, simultaneously. In terms of absolute sustainability development, almost all the provinces, except for Liaoning and Tianjin, showed increase to some extent. It indicates that most of the provinces in China had better development momentum. Thirteen provinces (accounting for 41.9%) presented a decline trend on relative (or competitive) development. Especially, the decline rates of Liaoning and Tianjin were over 10%. The provinces’ sustainability prospect was discussed by comparing the growth rate of the dynamic ranking and the single year ranking. It is found that the sustainability prospect in mainland China is comparatively optimistic, with about 18 provinces (accounting for 58.1%) showing non-negative growth rates of the dynamic ranking and the single year ranking.
More specifically, we suggest that all the provinces should pay more attention to the environmental sustainability. The local authorities of the provinces in Middle China, Northeastern China, especially the East China should invest more in environmental protection, such as Beijing. The local government can perfect the legal system to punish the behaviors that pollute the environment and destroy the ecosystem. There are also policy incentives for environmentalists. Moreover, the government should increase publicity efforts to raise the residents’ awareness of resource conservation and environmental protection. The West China can seek overall economic and social and progress based on the sustainable utilization of resources and good ecological environment. Although the Middle China shows better development momentum, the subordinate provinces should make efforts to develop all the dimensions. Similarly, we suggest that the Northeastern China improve social and environmental sustainability on the premise of maintaining current levels of economic sustainability.
Additionally, as one of the main contributions of this study, the various findings can provide meaningful information for planners and policy analysts to take suitable actions to improve the sustainability of the provincial-level regions in China. The methods developed in this paper are also suitable for the investigation of sustainability at different levels, such as city, urban, community, region, country, and others.

Author Contributions

P.Y. conceptualized the study and analyzed the data. L.W. conducted the research and wrote the original draft. D.Z. contributed to data collection. W.L. contributed to reviewing and editing the manuscript. All authors read and approved the manuscript.

Funding

This research was funded by the National Natural Science Foundation of China (71671031, 71701040 and 71803073), the Humanities and Social Sciences Foundation of Chinese Ministry of Education (17YJC630067 and 18YJC790211), and the Fundamental Research Funds for the Central Universities of China (N170604004).

Acknowledgments

We are grateful to the editor and the reviewers for their valuable comments and suggestions.

Conflicts of Interest

The authors declare no conflict of interest.

References

  1. Brundtland, G.H. Our Common Future; Oxford University Press: New York, NY, USA, 1987. [Google Scholar]
  2. Li, X.J.; Peterson, J.; Liu, G.J.; Qian, L.X. Assessing regional sustainability: The case of land use and land cover change in the middle Yiluo catchment of the Yellow River basin, China. Appl. Geogr. 2001, 21, 87–106. [Google Scholar] [CrossRef]
  3. Lukman, R.; Krajnc, D.; Glavič, P. Fostering collaboration between universities regarding regional sustainability initiatives—The University of Maribor. J. Clean. Prod. 2009, 17, 1143–1153. [Google Scholar] [CrossRef]
  4. Graymore, M.L.M.; Wallis, A.M.; Richards, A.J. An index of regional sustainability: A GIS-based multiple criteria analysis decision support system for progressing sustainability. Ecol. Complex. 2009, 6, 453–462. [Google Scholar] [CrossRef]
  5. Munda, G.; Saisana, M. Methodological Considerations on Regional Sustainability Assessment Based on Multicriteria and Sensitivity Analysis. Reg. Stud. 2011, 45, 261–276. [Google Scholar] [CrossRef]
  6. Kurka, T. Application of the analytic hierarchy process to evaluate the regional sustainability of bioenergy developments. Energy 2013, 62, 393–402. [Google Scholar] [CrossRef]
  7. Sueyoshi, T.; Yuan, Y. China’s regional sustainability and diversified resource allocation: DEA environmental assessment on economic development and air pollution. Energy Econ. 2015, 49, 239–256. [Google Scholar] [CrossRef]
  8. Bibri, S.E.; Krogstie, J. On the social shaping dimensions of smart sustainable cities: A study in science, technology, and society. Sustain. Cities Soc. 2017, 29, 219–246. [Google Scholar] [CrossRef] [Green Version]
  9. Zhang, L.; Xu, Y.; Yeh, C.H.; Liu, Y.; Zhou, D.Q. City sustainability evaluation using MCDM with objective weights of interdependent criteria. J. Clean. Prod. 2016, 131, 491–499. [Google Scholar] [CrossRef]
  10. Garcia, D.A. Green areas management and bioengineering techniques for improving urban ecological sustainability. Sustain. Cities Soc. 2017, 30, 108–117. [Google Scholar] [CrossRef]
  11. Lin, W.; Li, Y.; Li, X.; Xu, D. The dynamic analysis and evaluation on tourist ecological footprint of city: Take shanghai as an instance. Sustain. Cities Soc. 2018, 37, 541–549. [Google Scholar] [CrossRef]
  12. Graymore, M.L.M.; Sipe, N.G.; Rickson, R.E. Regional sustainability: How useful are current tools of sustainability assessment at the regional scale? Ecol. Econ. 2008, 67, 362–372. [Google Scholar] [CrossRef]
  13. Gibson, R.B. Beyond the pillars: Sustainability assessment as a framework for effective integration of social, economic and ecological considerations in significant decision-making. J. Environ. Assess. Policy Manag. 2006, 8, 259–280. [Google Scholar] [CrossRef]
  14. Elkington, J. Cannibals with Forks: The Triple Bottom Line of the 21st Century; Oxford Press: Oxford, UK, 1998. [Google Scholar]
  15. Costanza, R.; Wainger, L. Ecological Economics: The Science and Management of Sustainability; Columbia University Press: New York, NY, USA, 1991. [Google Scholar]
  16. Munasinghe, M. Environmental Economics and Sustainable Development; World Bank: Washington, DC, USA, 1993. [Google Scholar]
  17. Ali-Toudert, F.; Ji, L.M. Modeling and measuring urban sustainability in multi-criteria based systems—A challenging issue. Ecol. Indic. 2017, 73, 597–611. [Google Scholar] [CrossRef]
  18. Ravetz, J. Integrated assessment for sustainability appraisal in cities and regions. Environ. Impact Assess. Rev. 2000, 20, 31–64. [Google Scholar] [CrossRef]
  19. Krajnc, D.; Glavič, P. A model for integrated assessment of sustainable development. Resour. Conserv. Recycl. 2005, 43, 189–208. [Google Scholar] [CrossRef]
  20. Lozano, R. Envisioning sustainability three-dimensionally. J. Clean. Prod. 2008, 16, 1838–1846. [Google Scholar] [CrossRef]
  21. Spindler, E. Geschichte der Nachhaltigkeit–Vom Werden und Wirken Eines Beliebten Begriffes. 2012. Available online: http://www.nachhaltigkeit.info/media/1326279587phpeJPyvC.pdf (accessed on 24 September 2019).
  22. Hawkes, J. The Fourth Pillar of Sustainability: Culture’s Essential Role in Public Planning; Common Ground P/L: Melbourne, Australia, 2001. [Google Scholar]
  23. Higgins, K.L. From bud to blossom: Nurturing sustainable stewardship. In Economic Growth and Sustainability; Higgins, K.L., Ed.; Academic Press: San Diego, CA, USA, 2015; pp. 167–180. [Google Scholar]
  24. Valentin, A.; Spangenberg, J.H. A guide to community sustainability indicators. Environ. Impact Assess. Rev. 2000, 20, 381–392. [Google Scholar] [CrossRef]
  25. Curwell, S.; Deakin, M.; Symes, M. Sustainability Urban Development: The Environmental Assessment Methods; Taylor & Francis: London, UK, 2007. [Google Scholar]
  26. Geneletti, D. Impact assessment of proposed ski areas: A GIS approach integrating biological, physical and landscape indicators. Environ. Impact Assess. Rev. 2008, 28, 116–130. [Google Scholar] [CrossRef]
  27. Zhou, L.; Tokos, H.; Krajnc, D.; Yang, Y.R. Sustainability performance evaluation in industry by composite sustainability index. Clean Technol. Environ. Policy 2012, 14, 789–803. [Google Scholar] [CrossRef]
  28. Nardo, M.; Saisana, M.; Saltelli, A.; Tarantola, S.; Hoffman, A.; Giovannini, E. Handbook on Constructing Composite Indicators: Methodology and User Guide; OECD Publishing: Paris, France, 2008. [Google Scholar]
  29. Shults, W.D.; Beauchamp, J.J. Statistically based air-quality indices. In Indicators of Environmental Quality; Thomas, W.A., Ed.; Plenum Press: London, UK, 1972. [Google Scholar]
  30. Malkina-Pykh, I.G. Integrated assessment models and response function models: Pros and cons for sustainable development indices design. Ecol. Indic. 2002, 2, 93–108. [Google Scholar] [CrossRef]
  31. Ihsan, Z.; Idris, M.Y.; Abdullah, A.H. Attribute normalization techniques and performance of intrusion classifiers: A comparative analysis. Life Sci. J. 2013, 10, 2568–2576. [Google Scholar]
  32. Wang, W.; Zhang, X.L.; Gombault, S.; Knapskog, S.J. Attribute normalization in network intrusion detection. In Proceedings of the 10th International Symposium on Pervasive Systerms, Algorithms and Networks, Kaohsiung, Taiwan, 14–16 December 2009; pp. 448–453. [Google Scholar]
  33. Liu, G. Development of a general sustainability indicator for renewable energy systems: A review. Renew. Sustain. Energy Rev. 2014, 31, 611–621. [Google Scholar] [CrossRef]
  34. Saaty. Decision making – the analytic hierarchy and network processes (AHP/ANP). J. Syst. Sci. Syst. Eng. 2004, 13, 1–35. [Google Scholar] [CrossRef]
  35. Shannon, C.E. A mathematical theory of communication. Bell Syst. Tech. J. 1948, 27, 379–423. [Google Scholar] [CrossRef]
  36. Büyükozkan, G.; Karabulut, Y. Energy project performance evaluation with sustainability perspective. Energy 2017, 119, 549–560. [Google Scholar] [CrossRef]
  37. Hu, A.H.; Chen, L.T.; Hsu, C.W.; Ao, J.G. An evaluation framework for scoring corporate sustainability reports in Taiwan. Environ. Eng. Sci. 2011, 28, 843–858. [Google Scholar] [CrossRef]
  38. Lee, G.K.L.; Chan, E.H.W. The analytic hierarchy process (AHP) approach for assessment of urban renewal proposals. Soc. Indic. Res. 2008, 89, 155–168. [Google Scholar] [CrossRef]
  39. Erol, I.; Turgay, S.; Sari, R. A new fuzzy multi-criteria framework for measuring sustainability performance of a supply chain. Ecol. Econ. 2011, 70, 1088–1100. [Google Scholar] [CrossRef]
  40. Zinatizadeh, S.; Azmi, A.; Monavari, S.M.; Sobhanardakani, S. Evaluation and prediction of sustainability of urban areas: A case study for Kermanshah city, Iran. Cities 2017, 66, 1–9. [Google Scholar] [CrossRef]
  41. Yan, J.H.; Feng, C.H.; Li, L. Sustainability assessment of machining process based on extension theory and entropy weight approach. Int. J. Adv. Manuf. Technol. 2014, 71, 1419–1431. [Google Scholar] [CrossRef]
  42. Peng, Y.; Lai, Y.; Li, X.; Zhang, X. An alternative model for measuring the sustainability of urban regeneration: The way forward. J. Clean. Prod. 2015, 109, 76–83. [Google Scholar] [CrossRef]
  43. Begic, F.; Afgan, N. Sustainability assessment tool for the decision making in selection of energy system-bosnian case. Energy 2007, 32, 1979–1985. [Google Scholar] [CrossRef]
  44. Afgan, N.H.; Carvalho, M.G. Sustainability assessment of hydrogen energy systems. Int. J. Hydrog. Energy 2004, 29, 1327–1342. [Google Scholar] [CrossRef]
  45. Van de Kerk, G.; Manuel, A.R. A comprehensive index for a sustainable society: The SSI-the sustainable society index. Ecol. Econ. 2008, 66, 228–242. [Google Scholar] [CrossRef]
  46. Afgan, N.; Carvalho, M.; Hovanov, N. Energy system assessment with sustainability indicators. Energy Policy 2000, 28, 603–612. [Google Scholar] [CrossRef]
  47. Hossain, M.; Mekhilef, S.; Olatomiwa, L. Performance evaluation of a stand-alone PV-wind-diesel-battery hybrid system feasible for a large resort center in South China Sea, Malaysia. Sustain. Cities Soc. 2017, 28, 358–366. [Google Scholar] [CrossRef]
  48. Jovanovic, M.; Afgan, N.; Bakic, V. An analytical method for the measurement of energy system sustainability in urban areas. Energy 2010, 35, 3909–3920. [Google Scholar] [CrossRef]
  49. Govindan, K.; Khodaverdi, R.; Jafarian, A. A fuzzy multi criteria approach for measuring sustainability performance of a supplier based on triple bottom line approach. J. Clean. Prod. 2013, 47, 345–354. [Google Scholar] [CrossRef]
  50. Zhao, H.; Li, N. Performance evaluation for sustainability of strong smart grid by using stochastic AHP and fuzzy TOPSIS methods. Sustainability 2016, 8, 129. [Google Scholar] [CrossRef]
  51. Phillis, Y.; Davis, B. Assessment of corporate sustainability via fuzzy logic. J. Intell. Robot. Syst. 2009, 55, 3–20. [Google Scholar] [CrossRef]
  52. Jin, J.; Wang, R.; Li, F.; Huang, J.; Zhou, C.; Zhang, H.; Yang, W. Conjugate ecological restoration approach with a case study in Mentougou district, Beijing. Ecol. Complex. 2011, 8, 161–170. [Google Scholar] [CrossRef]
  53. Mischen, P.A.; Homsy, G.C.; Lipo, C.P.; Holahan, R.; Imbruce, V.; Pape, A.; Zhu, W.; Graney, J.; Zhang, Z.; Holmes, L.M.; et al. A foundation for measuring community sustainability. Sustainability 2019, 11, 1903. [Google Scholar] [CrossRef]
  54. Li, W.; Yi, P.; Zhang, D. Sustainability evaluation of cities in northeastern China using dynamic TOPSIS-entropy methods. Sustainability 2018, 10, 4542. [Google Scholar] [CrossRef]
  55. Lu, C.; Xue, B.; Lu, C.; Wang, T.; Jiang, L.; Zhang, Z.; Ren, W. Sustainability investigation of resource-based cities in Northeastern China. Sustainability 2016, 8, 1058. [Google Scholar] [CrossRef]
  56. Research Group on Sustainable Development Strategy, Chinese Academy of Sciences (CAS). China Sustainability Development Report 2015: Reshaping the Governance for Sustainability Development; Science Press: Beijing, China, 2015. [Google Scholar]
  57. Ding, L.; Shao, Z.; Zhang, H.; Xu, C.; Wu, D. A comprehensive evaluation of urban sustainable development in China based on the TOPSIS-entropy method. Sustainability 2016, 8, 746. [Google Scholar] [CrossRef]
  58. Tan, F.; Lu, Z. Assessing regional sustainable development through an integration of nonlinear principal component analysis and Gram Schmidt orthogonalization. Ecol. Indic. 2016, 63, 71–81. [Google Scholar] [CrossRef]
  59. Xu, C.; Wang, S.; Zhou, Y.; Wang, L.; Liu, W. A comprehensive quantitative evaluation of new sustainable urbanization level in 20 Chinese urban agglomerations. Sustainability 2016, 8, 91. [Google Scholar] [CrossRef]
  60. Liang, X.; Zhang, W.; Chen, L.; Deng, F. Sustainable urban development capacity measure—A case study in Jiangsu Province, China. Sustainability 2016, 8, 270. [Google Scholar] [CrossRef]
  61. Yi, P.; Li, W.; Zhang, D. Assessment of City Sustainability Using MCDM with Interdependent Criteria Weight. Sustainability 2019, 11, 1632. [Google Scholar] [CrossRef]
  62. UNEP (United Nations Environment Programme). Sustainable Consumption and Production Policies Report; UNEP: Nairobi, Kenya, 2009. [Google Scholar]
  63. UNEP (United Nations Environment Programme). Regional Resource Centre for Asia and the Pacific (RRC.AP). Environmental Indicators North East Asia; UNEP: Nairobi, Kenya, 2004. [Google Scholar]
  64. Kemmler, A.; Spreng, D. Energy indicators for tracking sustainability in developing countries. Energy Policy 2007, 64, 143–151. [Google Scholar] [CrossRef]
  65. UN-Habitat (United Nations Human Settlements Programme). The State of the World’s Cities Report 2006/2007; Earthscan: London, UK, 2006. [Google Scholar]
  66. Yi, P.; Li, W.; Li, L. Evaluation and Prediction of City Sustainability Using MCDM and Stochastic Simulation Methods. Sustainability 2018, 10, 3771. [Google Scholar] [CrossRef]
Figure 1. A three-level hierarchy of criteria for sustainability assessment.
Sustainability 11 05289 g001
Figure 2. The actual and normalized values of the 31 provinces on “water resources per capita”.
Sustainability 11 05289 g002
Figure 3. Location of the 31 provinces on the map of China (The standard map of China is downloaded from the website of National Bureau of Surveying and Mapping Geographic Information (http://bzdt.nasg.gov.cn))
Sustainability 11 05289 g003
Figure 4. Location of the 31 provinces in four quadrants
Sustainability 11 05289 g004
Figure 5. Change of the dynamic ranking of the 31 provinces and four regions in 2011–2016. Note: ① The 31 provinces that are classified into four regions (West China, Middle China, Northeastern China and East China) by their locations as shown in Fig. 3; ② The values on each curve form left to right represent the rankings of the associated province (or region) from the year 2011 to 2016; ③ The average annual growth rate of the four regions represents the increase of the dynamic ranking within the ranking interval, which was calculated by (R(2016) − R(2011))/(186 − 1)/5   ×   100%, where R represents the associated ranking; ④ Each region has a line to show the change of dynamic ranking from 2011 to 2016, and the lined numbers represent the average annual ranking of the subordinate provinces.
Sustainability 11 05289 g005
Figure 6. Change of the single year ranking of the 31 provinces and the four regions in 2011–2016. Note: ① The average annual growth rate of the four regions with respect to the single year ranking was calculated by (R(2016) − R(2011))/(31 − 1)/5   ×   100%, where R represents the associated ranking. ② The values on each curve form left to right represent the rankings of the associated province from the year 2011 to 2016; ③ Each region has a line to show the change of dynamic ranking of the single year, and the lined numbers represent the single year average ranking of the subordinate provinces.
Sustainability 11 05289 g006
Figure 7. Classification of the provinces by the growth rates of the dynamic ranking and the single year ranking.
Sustainability 11 05289 g007
Figure 8. Comparison of the average performance of the three pillars of the four regions.
Sustainability 11 05289 g008
Table 1. The initial data of indicators.
c 1 c 2
c 1 1 c 1 2 c 2 1
c 1 11 c 1 12 c 1 21 c 1 22 c 2 11 c 2 12
o 1 80494.95 0.15 0.00315 0.51 1.432903.03
o 2 83448.56 0.23 0.00160 0.15 3.626920.86
o 3 33856.87 0.20 0.00098 1.16 3.818292.23
o 4 31276.23 0.22 0.00090 2.13 3.518123.87
o 5 57856.08 0.23 0.00165 47.43 3.820407.57
o 6 50711.16 0.20 0.00219 4.61 3.720466.84
o 7 38446.09 0.22 0.00141 30.71 3.717796.57
o 8 32816.90 0.21 0.00188 39.67 4.115696.18
o 9 81788.20 0.12 0.00521 0.04 3.536230.48
o 10 62172.77 0.19 0.00301 0.44 3.226340.73
o 11 59159.53 0.17 0.00193 3.15 3.130970.68
Table 2. Normalizing results.
c 1 c 2
c 1 1 c 1 2 c 2 1
c 1 11 c 1 12 c 1 21 c 1 22 c 2 11 c 2 12
o 1 0.9390 0.1449 0.8025 0.2554 1 0.8858
o 2 10.8869 0.3146 0.0595 0.5000 0.6903
o 3 0.1323 0.4813 0.0320 0.3528 0.2143 0.2593
o 4 00.7753 0 0.5000 0.6000 0.2416
o 5 0.5000 1 0.3484 1 0.2143 0.4934
o 6 0.4177 0.5000 0.6073 0.5400 0.3333 0.5000
o 7 0.2764 0.7344 0.2096 0.8596 0.3333 0.2090
o 8 0.0790 0.6433 0.5000 0.9349 0 0
o 9 0.9657 01 0 0.6000 1
o 10 0.5801 0.3362 0.7891 0.2296 0.7692 0.6732
o 11 0.5242 0.2071 0.5152 0.5165 0.7821 0.8195
Table 3. The results of criteria level.
c 1 c 2
c 1 1 c 1 2 c 2 1
o 1 0.62560.52600.9423
o 2 0.95540.18570.5962
o 3 0.27010.19420.2370
o 4 0.30590.25280.4188
o 5 0.69730.67780.3554
o 6 0.45020.57330.4176
o 7 0.45720.53820.2705
o 8 0.30170.71980.0000
o 9 0.58460.49450.8022
o 10 0.48380.50630.7207
o 11 0.39910.51580.8010
Table 4. The results of dimension level and the CSI
c 1 c 2 CSI   ( I i )
o 1 0.58300.94230.7626
o 2 0.62590.59620.6111
o 3 0.23760.23700.2373
o 4 0.28320.41880.3510
o 5 0.68890.35540.5222
o 6 0.50290.41760.4602
o 7 0.49180.27050.3812
o 8 0.48070.00000.2403
o 9 0.54600.80220.6741
o 10 0.49340.72070.6071
o 11 0.44900.80100.6250
Table 5. Criteria for provinces sustainability performance assessment.
DimensionCriteriaSub-CriteriaUnitPropertyReferences
Economic
( c 1 ) (0.33)
Economic quantity ( c 1 ( 1 ) ) (0.5)GDP per capita ( c 1 ( 1 , 1 ) ) (0.2)YuanBenefit[9,54,57,58,59,60,61]
Growth rate of GDP ( c 2 ( 1 , 1 ) ) (0.2)%Benefit[9,54,57,58,59,60,61]
Investment in fixed assets per capita ( c 3 ( 1 , 1 ) ) (0.2)YuanBenefit[9,54,57,61]
Growth rate of consumer goods’ retail sales ( c 4 ( 1 , 1 ) ) (0.2)%Benefit[54,60,61]
Total export-import volume per capita ( c 5 ( 1 , 1 ) ) (0.2)USDBenefit[9,54,57,58,59,60]
Economic quality ( c 2 ( 1 ) ) (0.5)Proportion of GDP generated by the service industry ( c 1 ( 1 , 2 ) ) (0.2)%Benefit[9,54,57,58,59,60,61]
Wastewater discharged amount per unit of GDP ( c 2 ( 1 , 2 ) ) (0.2)TonCost[56,62]
Power consumption amount per unit of GDP ( c 3 ( 1 , 2 ) ) (0.2)Kilowatt-hourCost[56,57,62]
Industrial SO2 emissions per industrial added value ( c 4 ( 1 , 2 ) ) (0.2)TonCost[56,62]
Industrial smoke and dust emissions per industrial added value ( c 5 ( 1 , 2 ) ) (0.2)TonCost[56,62]
Social
( c 2 ) (0.33)
Population & infrastructure ( c 1 ( 2 ) ) (0.5)Natural growth rate of population ( c 1 ( 2 , 1 ) ) (0.2)%Benefit[9,54,57,60,63]
Population density ( c 2 ( 2 , 1 ) ) (0.2)Person/Km2Cost[56,63]
Per capita area of paved roads ( c 3 ( 2 , 1 ) ) (0.2)m2Benefit[56,60]
Number of public transportation vehicles per 10000 population ( c 4 ( 2 , 1 ) ) (0.2)unitBenefit[56]
Coverage rate of Urban population with access to tap water ( c 5 ( 2 , 1 ) ) (0.2)%Benefit[56,63]
Living & security ( c 2 ( 2 ) ) (0.5)Registered urban unemployment rate ( c 1 ( 2 , 2 ) ) (0.2)%Cost[9,54,57,58,59,60,61]
Per capita disposable income ( c 2 ( 2 , 2 ) ) (0.2)YuanBenefit[9,54,57,58,59,60]
Coverage rate of basic person insurance ( c 3 ( 2 , 2 ) ) (0.2)%Benefit[55,57,60]
Medical technical personnel per 1000 persons ( c 4 ( 2 , 2 ) ) (0.2)PersonBenefit[56,60]
Investment in social safety and employment as a proportion of GDP ( c 5 ( 2 , 2 ) ) (0.2)%Benefit[56]
Environmental ( c 3 ) (0.33)Resources & ecosystems ( c 1 ( 3 ) ) (0.5) Water resources per capita ( c 1 ( 3 , 1 ) ) (0.2)m3Benefit[9,54,56,57,58,59,60]
Arable land per capita ( c 2 ( 3 , 1 ) ) (0.2)AcreBenefit[56,63]
Ratio green coverage of built up areas ( c 3 ( 3 , 1 ) ) (0.2)%Benefit[56,60,61]
Per capita green area ( c 4 ( 3 , 1 ) ) (0.2)m2Benefit[9,53,57,58,59,60,61]
Per capita stock volume of forest ( c 5 ( 3 , 1 ) ) (0.2)HectareBenefit[56,60,63]
Environmental protection ( c 2 ( 3 ) ) (0.5) Investment in environmental protection as a proportion of GDP ( c 1 ( 3 , 2 ) ) (0.2)%Benefit[9,53,57,58,59,60]
Treatment rate of consumption wastes ( c 2 ( 3 , 2 ) ) (0.2)%Benefit[56,60,62]
Ratio of industrial solid wastes utilized ( c 3 ( 3 , 2 ) ) (0.2)%Benefit[9,53,57,58,59,60]
Investment completed in the treatment of industrial pollution as a proportion of GDP ( c 4 ( 3 , 2 ) ) (0.2)%Benefit[56,62]
Per capita afforestation area ( c 5 ( 3 , 2 ) ) (0.2)HectareBenefit[56,62]
Note: ① The equal weights of the sub-criteria; ② The equal weights of the criteria; ③ The equal weights of the dimensions. Additionally, the sources that we used to collect data are China City Statistical Yearbook (2012–2017), China Statistical Yearbook (2012–2017), China Statistical Yearbook on Environment (2012–2017), and China Health Statistics Yearbook (2012–2017).
Table 6. The aggregation scores and average annual growth rates of the 31 provinces and the four regions in 2011–2016.
The Composite Sustainability Indicator (CSI)Average ScoreGrowth Rate
201120122013201420152016
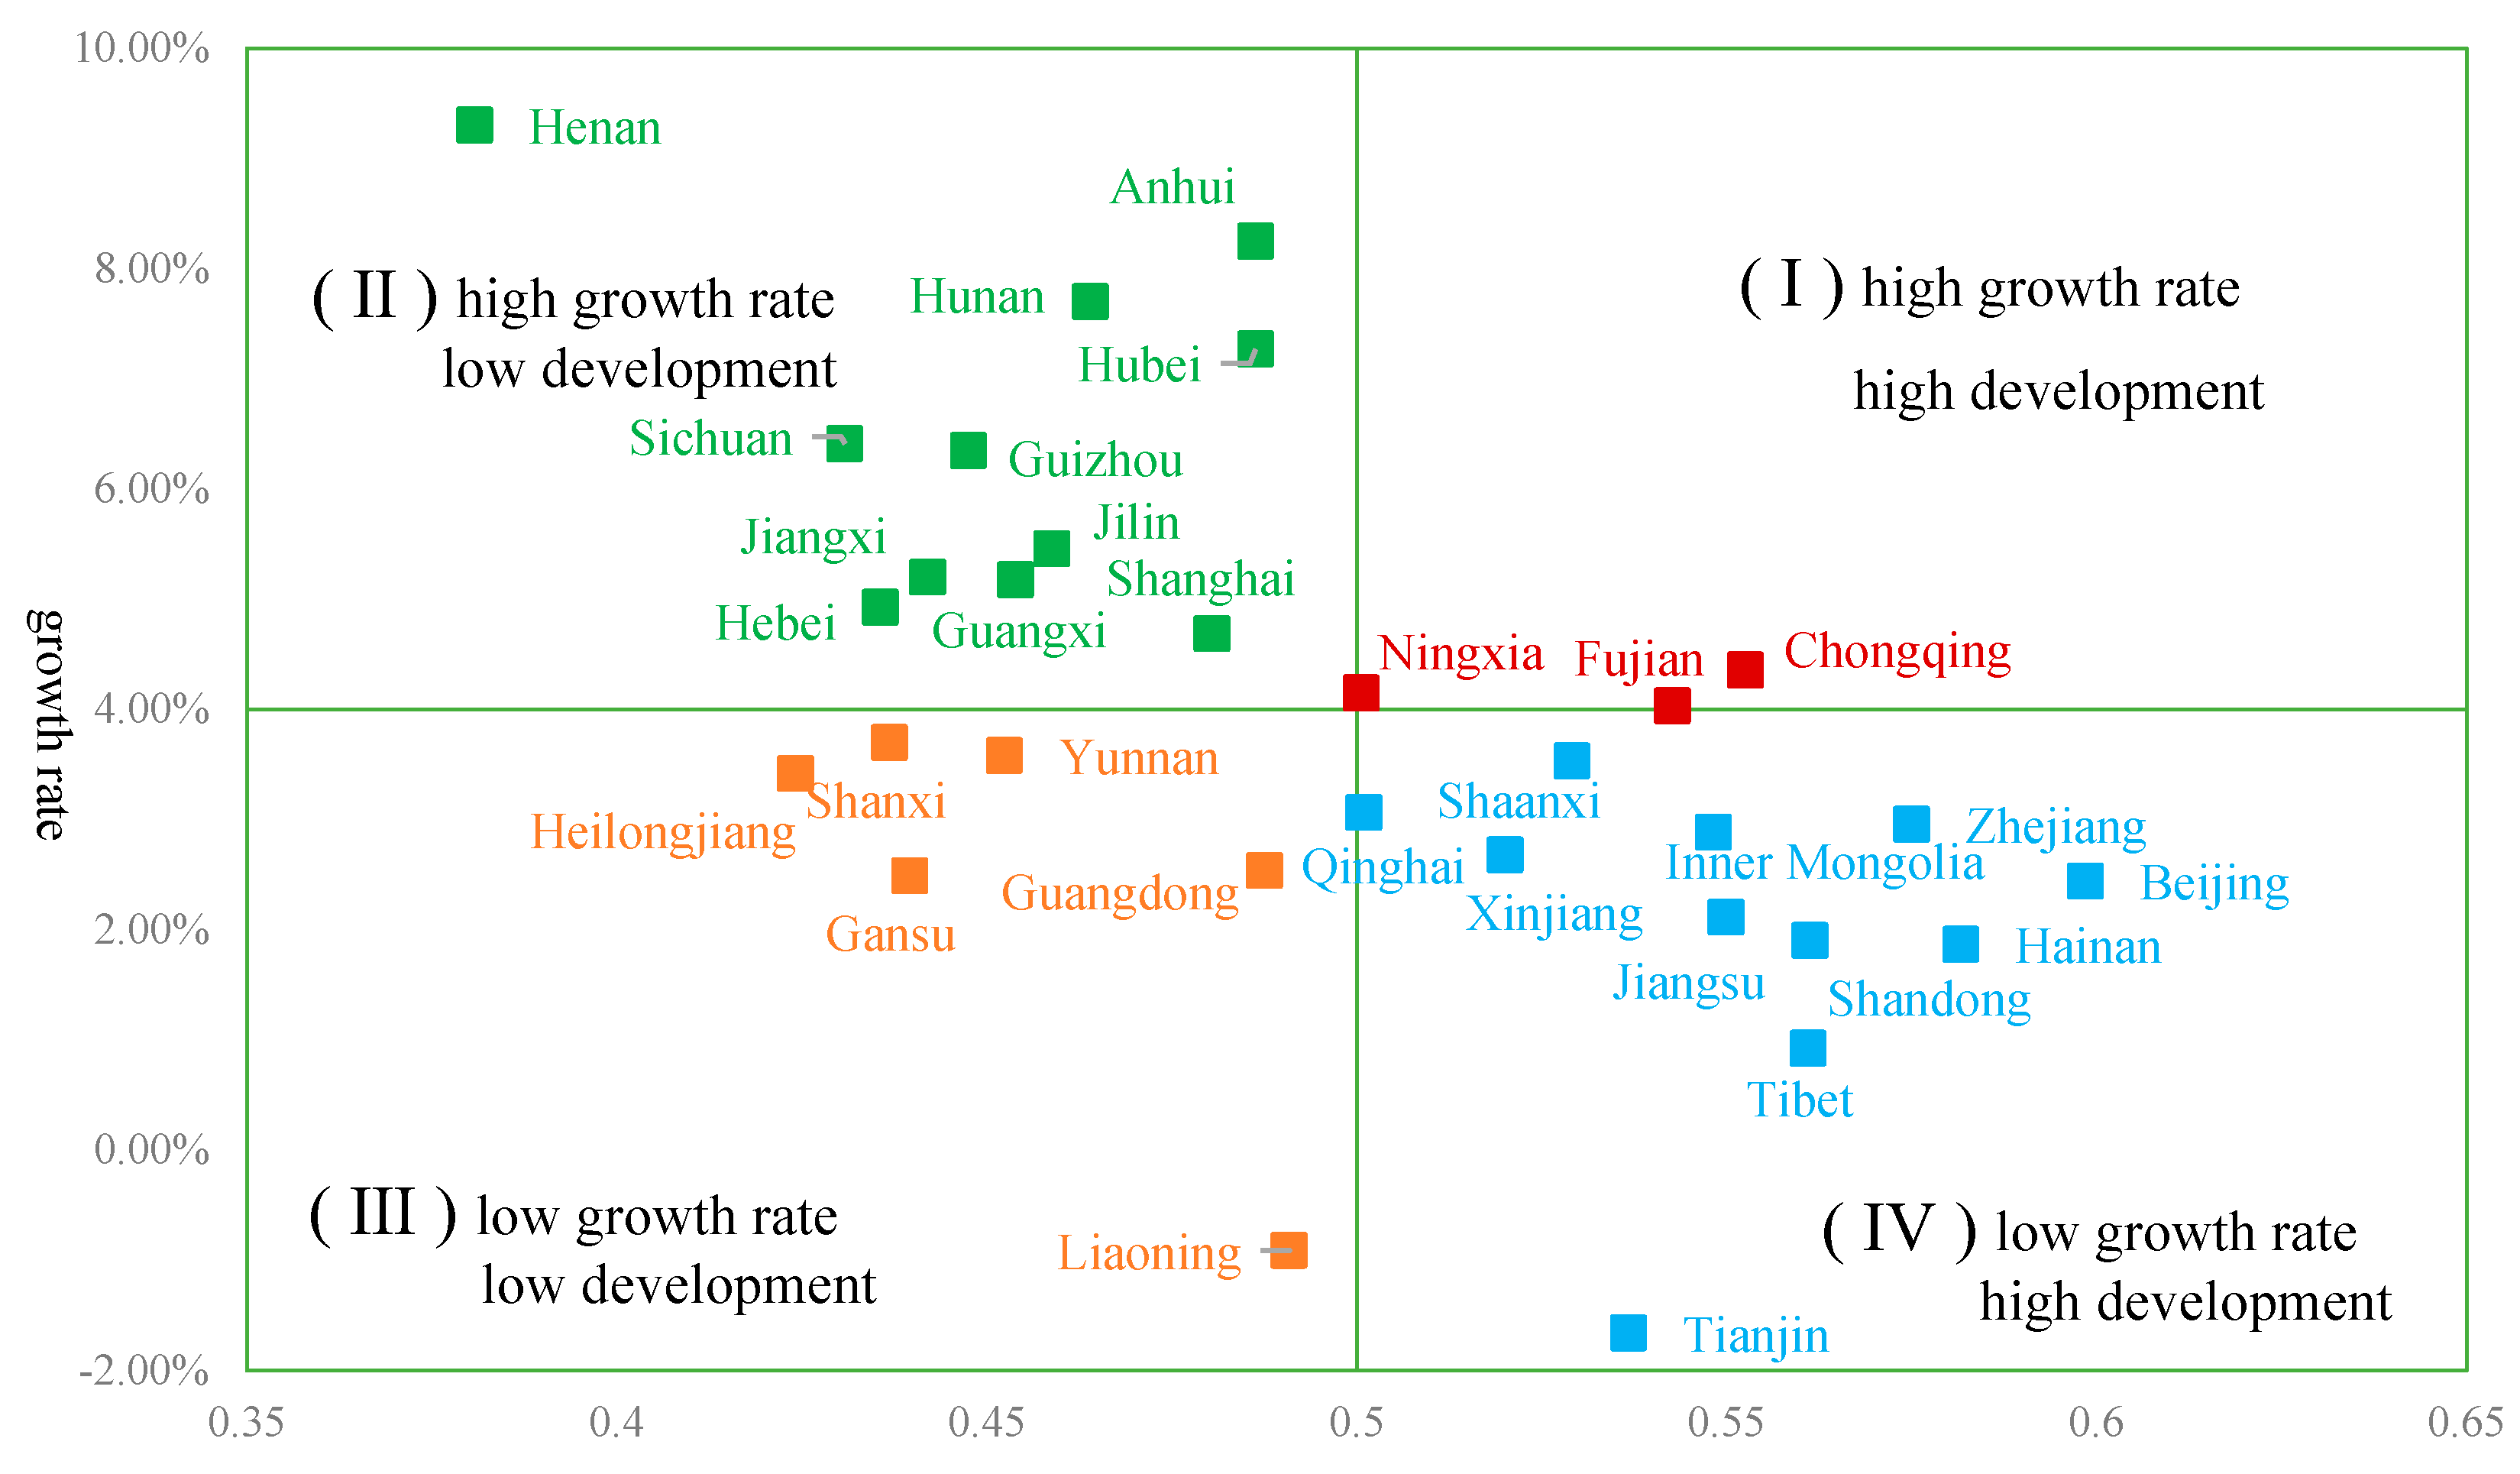
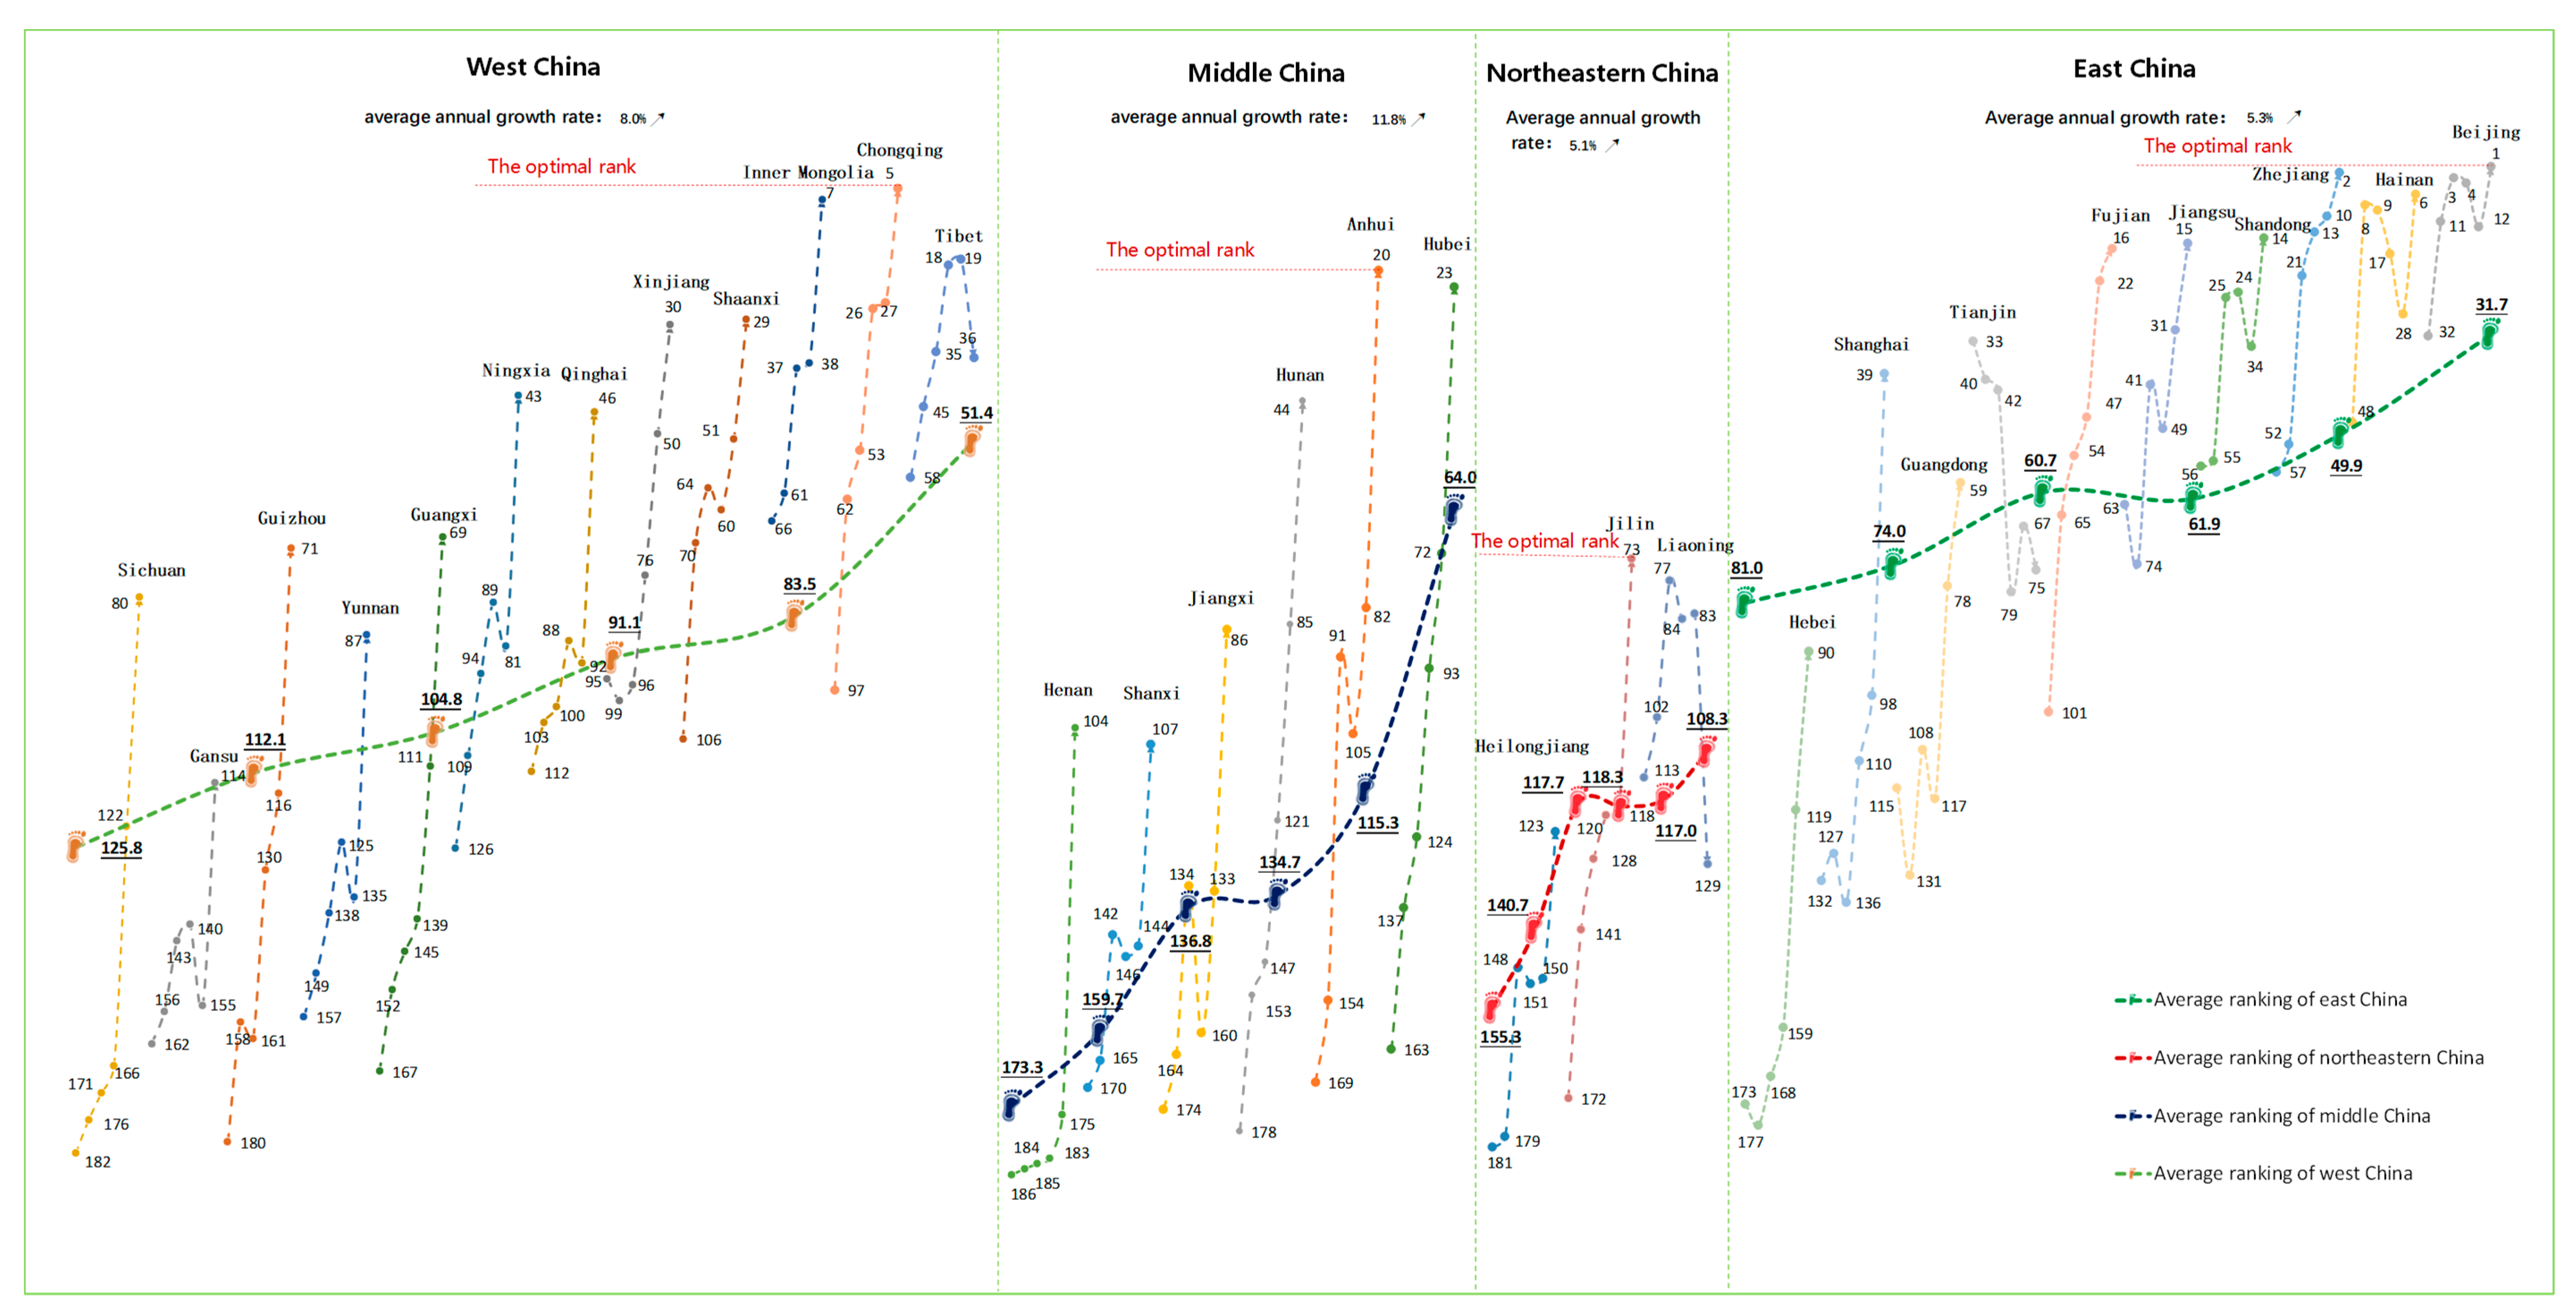
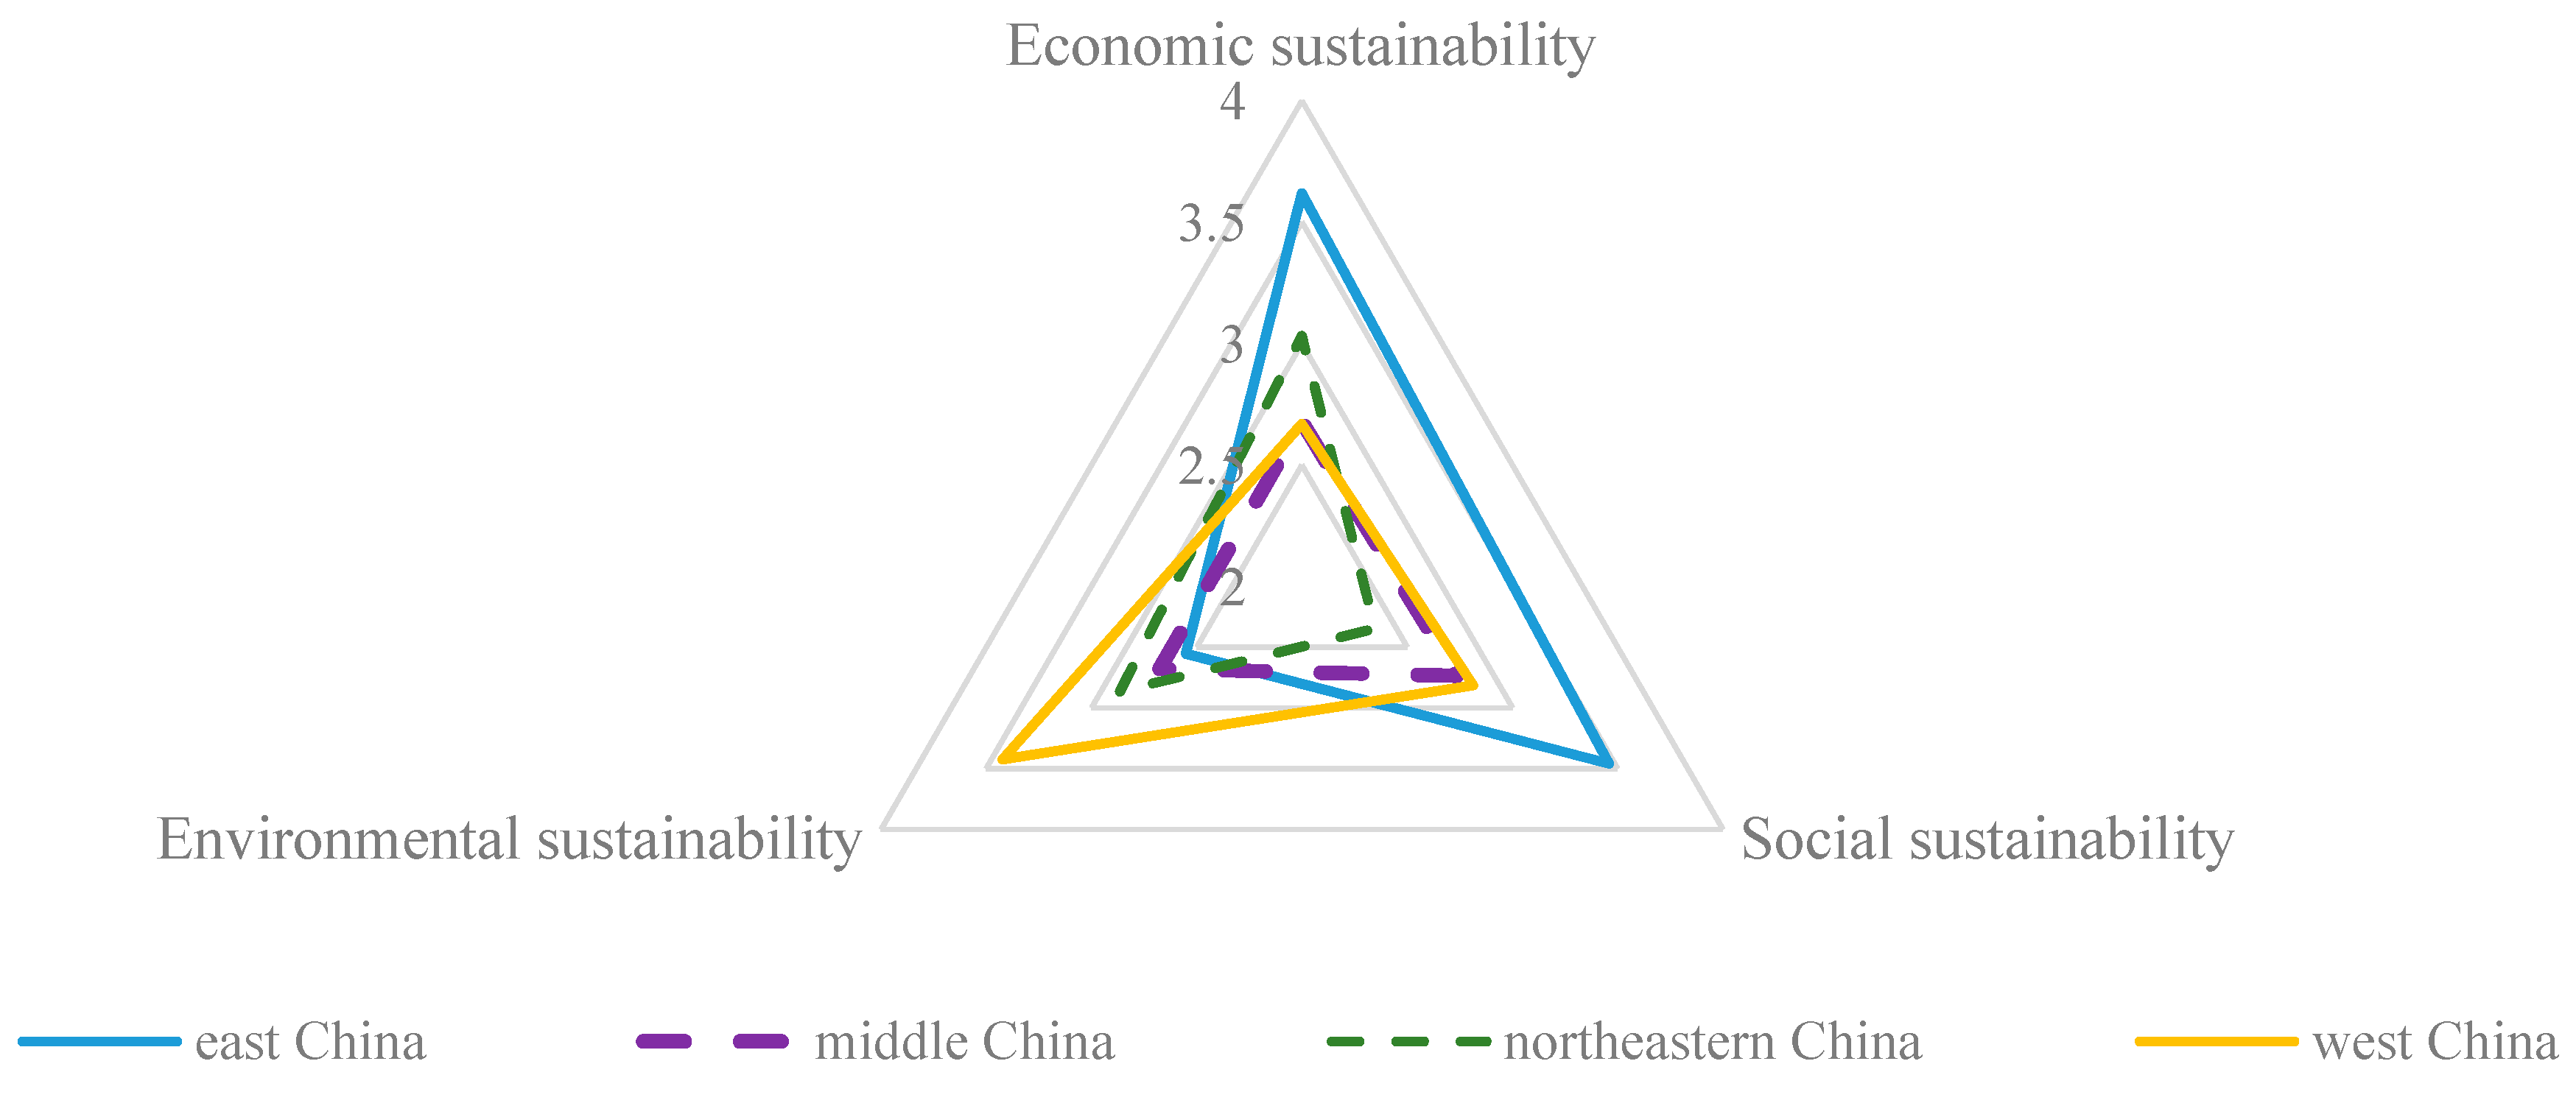
Beijing
Tianjin
Hebei
Shanxi
Inner Mongolia
Liaoning
Jilin
Heilongjiang
Shanghai
Jiangsu
Zhejiang
Anhui
Fujian
Jiangxi
Shandong
Henan
Hubei
Hunan
Guangdong
Guangxi
Hainan
Chongqing
Sichuan
Guizhou
Yunnan
Tibet
Shaanxi
Gansu
Qinghai
Ningxia
Xinjiang
East China
Middle China
West China
Northeastern China
0.565
0.562
0.403
0.407
0.522
0.474
0.406
0.393
0.450
0.530
0.534
0.412
0.487
0.403
0.537
0.330
0.421
0.398
0.474
0.415
0.547
0.496
0.388
0.393
0.427
0.534
0.483
0.421
0.476
0.457
0.500
0.509
0.395
0.459
0.424
0.590
0.555
0.401
0.419
0.523
0.486
0.442
0.397
0.455
0.517
0.545
0.430
0.525
0.420
0.537
0.337
0.446
0.431
0.451
0.431
0.596
0.531
0.401
0.427
0.432
0.550
0.521
0.429
0.485
0.481
0.494
0.517
0.414
0.475
0.442
0.609
0.553
0.414
0.442
0.532
0.515
0.455
0.432
0.449
0.555
0.576
0.503
0.537
0.450
0.572
0.351
0.458
0.433
0.482
0.436
0.595
0.541
0.407
0.422
0.446
0.560
0.532
0.442
0.490
0.501
0.498
0.534
0.439
0.484
0.467
0.605
0.513
0.426
0.434
0.556
0.509
0.466
0.431
0.477
0.547
0.588
0.483
0.547
0.423
0.574
0.382
0.501
0.464
0.471
0.443
0.585
0.571
0.417
0.452
0.457
0.582
0.526
0.442
0.504
0.512
0.515
0.533
0.448
0.498
0.469
0.588
0.522
0.467
0.437
0.558
0.509
0.467
0.432
0.496
0.566
0.594
0.510
0.574
0.450
0.561
0.402
0.518
0.508
0.514
0.477
0.569
0.572
0.460
0.473
0.449
0.582
0.545
0.430
0.502
0.503
0.546
0.545
0.471
0.508
0.469
0.634
0.515
0.503
0.482
0.598
0.453
0.517
0.460
0.556
0.586
0.613
0.582
0.586
0.507
0.588
0.484
0.574
0.551
0.534
0.522
0.598
0.604
0.512
0.518
0.504
0.558
0.568
0.474
0.549
0.551
0.567
0.571
0.530
0.544
0.477
0.598
0.537
0.436
0.437
0.548
0.491
0.459
0.424
0.480
0.550
0.575
0.486
0.543
0.442
0.561
0.381
0.486
0.464
0.488
0.454
0.582
0.553
0.431
0.448
0.452
0.561
0.529
0.440
0.501
0.501
0.520
0.535
0.449
0.495
0.458
2.44%
−1.66%
4.93%
3.70%
2.89%
−0.91%
5.46%
3.42%
4.69%
2.11%
2.96%
8.25%
4.03%
5.20%
1.90%
9.30%
7.27%
7.70%
2.54%
5.18%
1.87%
4.36%
6.41%
6.35%
3.58%
0.92%
3.53%
2.49%
3.06%
4.15%
2.68%
2.45%
6.83%
3.68%
2.46%
Note: ① Average score represents the average of the sustainability scores in 2011–2016; ② Growth rate is the average annual growth rate calculated by (Ii(2016) − Ii(2011))/Ii(2011)/5   ×   100%; ③ regional score was calculated by the average of the sustainability scores of the cities located in the region associated.

