1. Introduction
For a long time, due to natural factors, such as rainfall and landforms, and human activities, the Loess Plateau has become one of the most severely affected areas of soil erosion in the world. In the case of the loess hilly and gully region, owing to unreasonable land use and low vegetation coverage, the soil loss amounted to 5000–10,000 kg/km
2/year [
1,
2,
3], resulting in deterioration of the ecological environment. Large-scale reclamation of sloping farmland is considered to be one of the main causes of soil erosion and environmental degradation [
4,
5,
6]. Based on this, in 1999, the Chinese government launched the “Grain for Green” Program (GGP), aimed at improving the ecological environment, controlling soil erosion, adjusting the agricultural industrial structure, and promoting the sustainable development of the rural economy [
7,
8,
9,
10].
The GGP in China is known as the Sloping Land Conversion Program or the Conversion of Cropland to Forest Program [
11,
12]. The main goal of the GGP is to motivate farmers to convert farmland on steep slopes and other ecologically sensitive areas into forests by paying the equivalent of lost crop income [
11]. The GGP is an important decision made by the state in order to protect and improve the ecological environment. It is mainly for sloping farmland that is prone to causing soil erosion. It is planned to cultivate and plant trees according to the size of the land in different regions, so it is necessary for the provinces to plant trees and restore forest vegetation according to local conditions. The construction of the GGP mainly includes two aspects: one is the conversion of sloping farmland to forestry; the other is the afforestation of barren hills and wasteland suitable for forestation. The Chinese government has a special fund for the project, and has established a grain subsidy system. According to the approved area of returning farmland to forestry, the government will grant an appropriate grain subsidy for the people in a certain period, and will provide the seedling afforestation fee and some cash subsidy. The cash subsidy for farmland in the Yangtze River Basin and the southern region is 125 yuan per mu (=0.0667 hectares) per year, which is 90 yuan in the Yellow River Basin and the northern region. The subsidy period consists of eight years for ecological forest and five years for economic forest [
13]. Conversion of arable land and sloping land (where soil erosion is very serious or low-yield) to forests not only betters the local industrial and economic structure, but also promotes local sustainable development. In recent years, the forestry in China has gradually decreased, which seriously threatens the forest vegetation and the overall ecological environment [
14]. Therefore, the policy of the GGP is strongly supported by the state. In order to coordinate the local economic development on the basis of respecting the objective laws of nature, meet the basic living needs of residents, and improve the quality of life of local residents, returning farmland to forestry is mainly taking measures to restore economic forests, supplemented by necessary agricultural land.
Surface vegetation changes affect the concentration of greenhouse gases and aerosols in the atmosphere through the interaction of energy balance, water vapor exchange, and biogeochemical cycles between the ground and the atmosphere, which in turn affects climate change [
15,
16,
17,
18,
19,
20,
21,
22,
23,
24]. The state of vegetation growth is critical to the health of terrestrial ecosystems and biospheres, and is closely related to the rainfall [
25]. The relationship between precipitation and vegetation has always been the focus of researchers in various disciplines [
26,
27,
28], such as ecology, meteorology, and eco-hydrology. Although the relationship between the precipitation and vegetation on a global scale is well understood, it varies in different regions and ecosystems, and the impact of land use change on regional climate change is uncertain [
29].
In 1999, China initiated its GGP in Shaanxi, Gansu, and Sichuan provinces. The State Council intended to fully start the project on January 10, 2002 and extend it to 25 provinces in China. The GGP is an important decision of the country’s strategy for sustainable development to reduce or prevent soil erosion which has enlarged the area of vegetation, decreased the soil erosion, and manifested an impact on the ecological environment in the project area such as the Loess Plateau.
Based on the program and the economic and climatic changes in the Yan River Basin of the Loess Plateau, the objective of this study is to explore the relationships among policy (GGP), vegetation, people’s income, and climate changes in the Yan River Basin over the past 20 years. We selected land use and cover change, normalized difference vegetation index (NDVI), and vegetation coverage as the vegetation factor, precipitation as the climate factor, and total GDP, per capita GDP, and per capita net income of rural residents as the indicators of the rural economy. Studying the relationship between vegetation cover and rainfall at a regional scale is helpful to understand the interaction between vegetation and climate change, and to better formulate land use planning for government.
2. Methods
2.1. Study Area
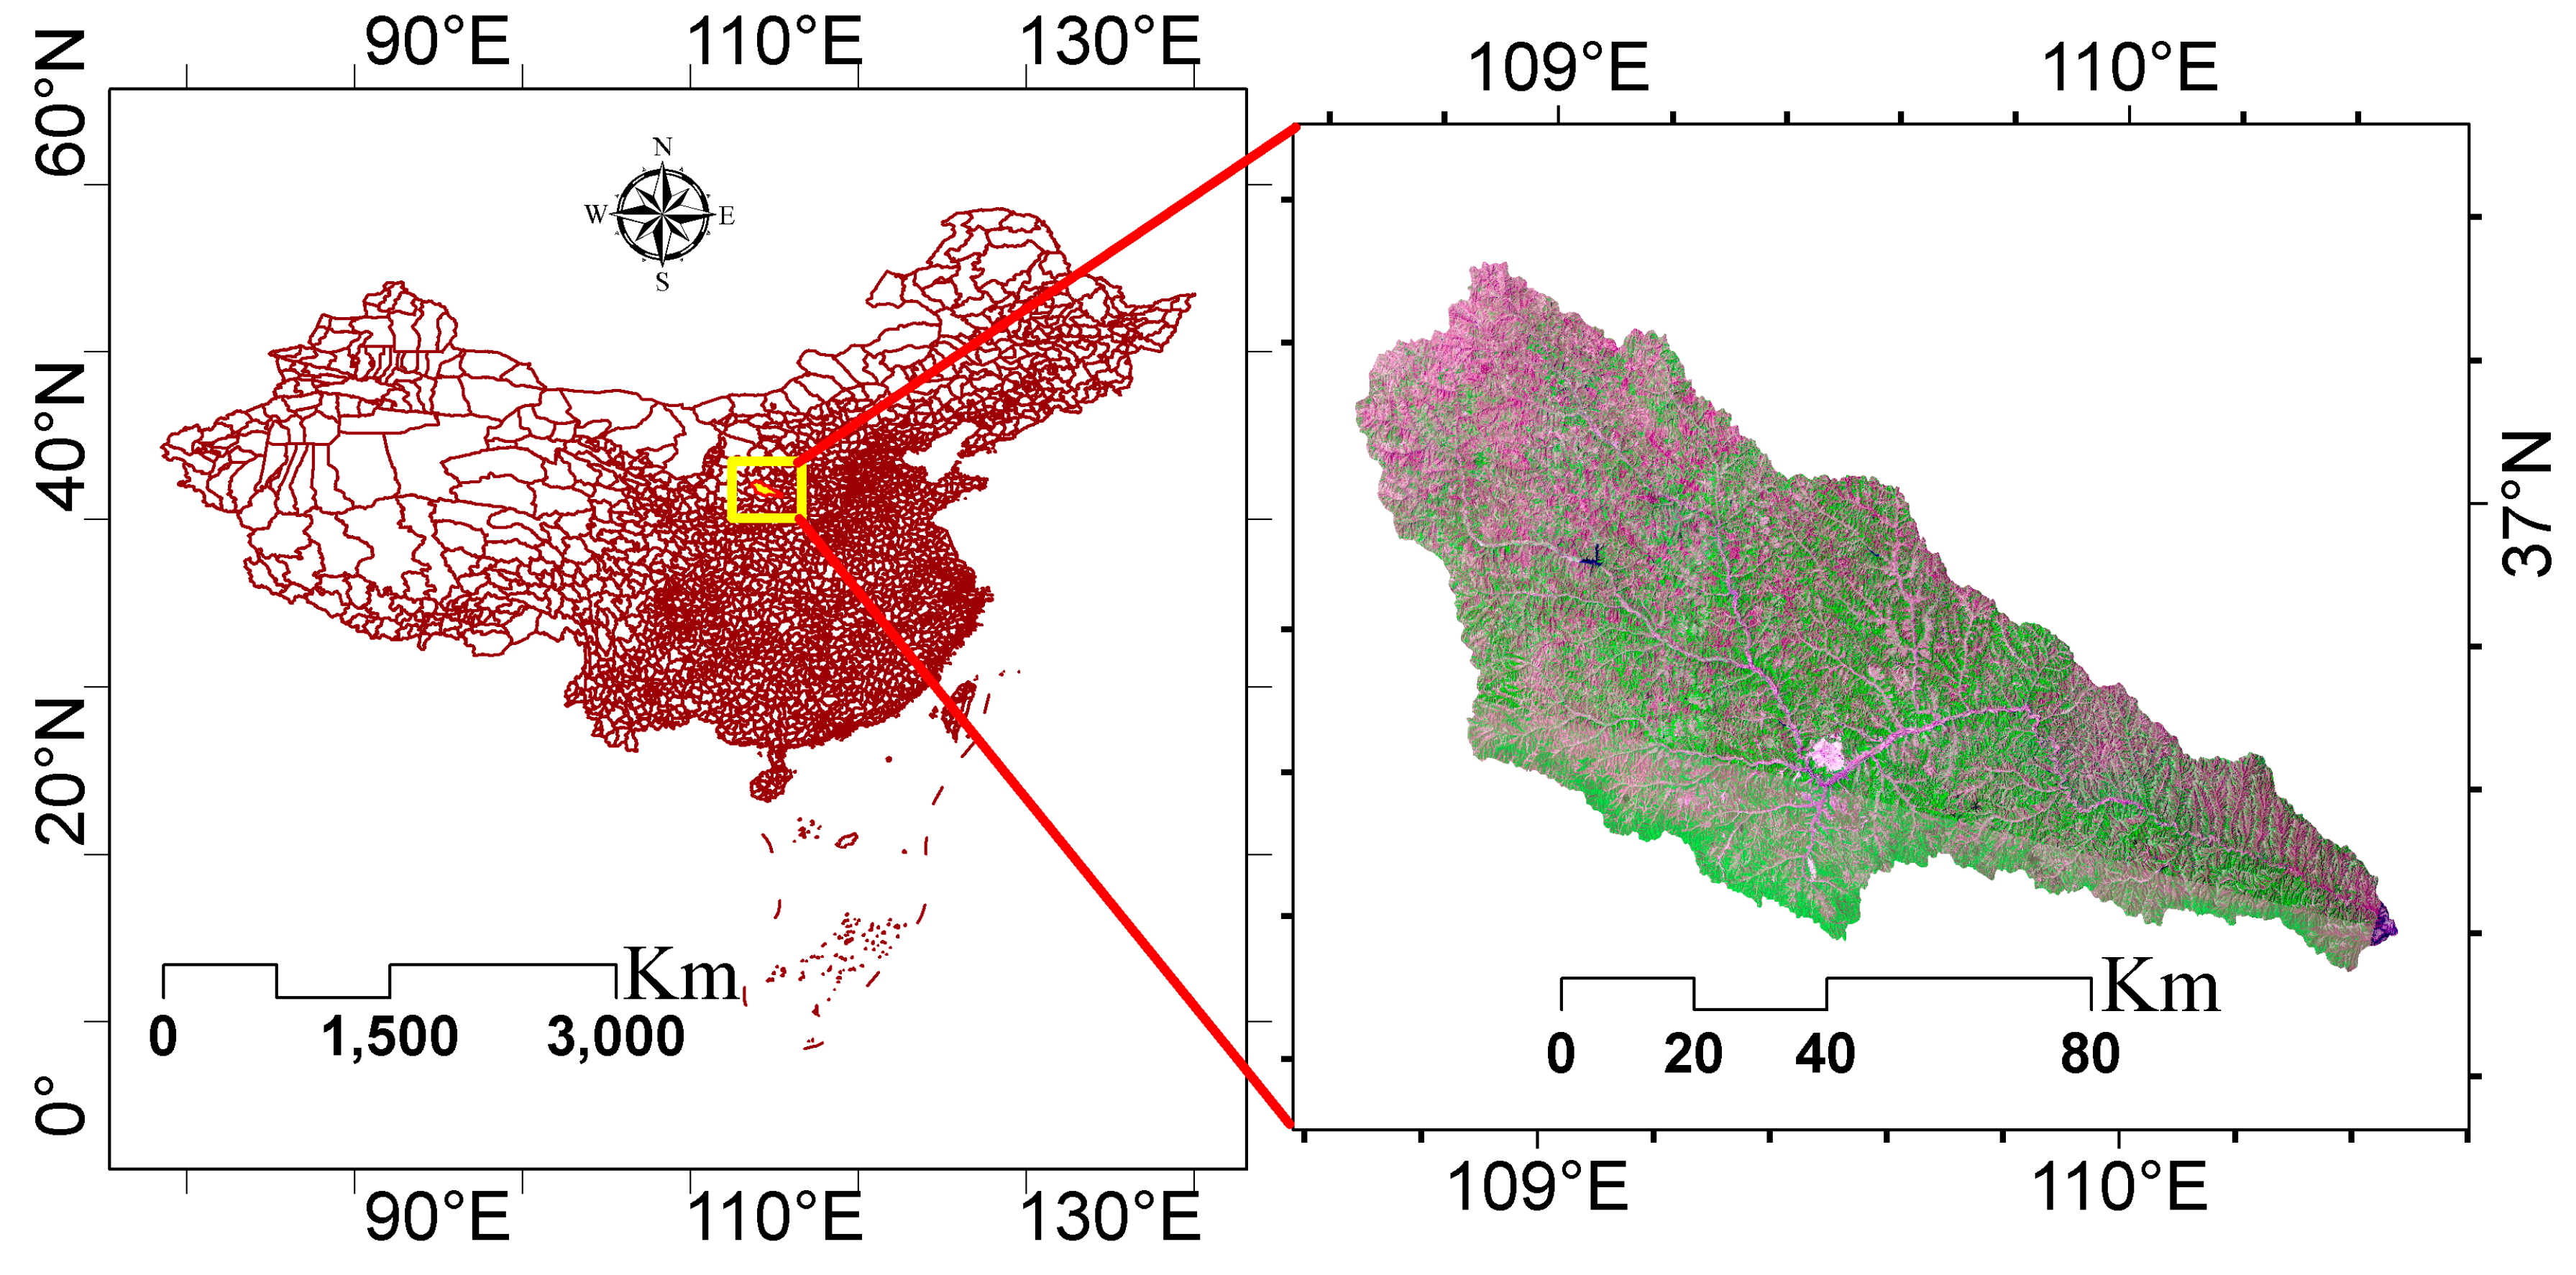
The Yan River Basin is located in the north of Shaanxi Province, China (the longitude is 108°39′43″–110°30′E and the latitude is 36°10′40″–37°19′41″N), with an area of 7725 km
2; see
Figure 1. It is a typical hilly and gully region of the Loess Plateau, and a key basin of the Yellow River sediment source. Yan River is the first tributary of the Yellow River. It originates in Zhoushan, Tianciwan Township, Jingbian County. It flows from northwest to southeast through Zhidan and Ansai counties, and Yan’an City. It converges into the Yellow River near the Liangshui Bank of South River Valley, Yanchang County, with a total length of 286.9 km. The terrain of the basin is high in the northwest and low in the southeast, with sparse vegetation and intense erosion. The annual precipitation of the basin is 514 mm and the annual average runoff is 293 million m
3. The soil erosion of Yan River is serious and the sediment content of the river is large. The annual average sediment transport and sediment content are 71.6 million t and 244–311 kg/m
3, respectively. The Yan River Basin belongs to the key implementation area of the GGP. The main land types in the basin are cultivated land, forestry, grassland, and construction land.
2.2. Sources and Methods of Data Collection and Analysis
2.2.1. Economic Data
The economic statistics of the Yan River Basin came from the China Statistical Yearbook (county-level) and Statistic Yearbook of Shaanxi Province [
30]. In this study, the economic data include the per capita net income of farmers, GDP, and per capita GDP. The per capita net income of farmers is the sum of the total income earned by rural residents from all sources in the current year after deducting the expenses incurred. GDP refers to the sum value of all the final products and services produced by a country (or region) in a certain period. PGDP is per capita GDP.
When presenting data, analysts can choose between nominal and real prices to represent benefits and costs. Either can be chosen without influencing the outcome of the analysis if consistently applied to all benefits, costs, and discount rates. Real values refer to the same statistics adjusted for inflation. Nominal values are measured in current values without taking inflation into account. Nominal value, by far the most important measure in economics, is used as the value of an item measured in monetary terms [
31,
32,
33]. The three economic data in this study are nominal values.
2.2.2. Precipitation
Meteorological data used for this study, such as rainfall, was taken from the Global Precipitation Climatology Project (GPCP) precipitation datasets over the study area. The product provides precipitation estimates on a one-degree grid over the entire globe for one day (daily) [
34]. The GPCP v1.3 daily precipitation (mm/day) data was used, with a time resolution of 24 hours and the range from January 1, 1970 to December 31, 2018. See
Figure 2.
2.2.3. Remote Sensing Image
The remote sensing images included Landsat-5 theme imager (TM) and Landsat-8 operational land imager (OLI) from 1999 to 2015, provided by International Scientific & Technical Data Mirror Site, Computer Network Information Center, Chinese Academy of Sciences (
http://www.gscloud.cn); for detailed information, see
Table 1 and
Figure 2.
The ENVI remote sensing image processing software was used to perform geometric correction, radiometric calibration, and atmospheric correction. Land use maps of different periods have been obtained by remote sensing images in 1999, 2005, 2010, and 2015 based on supervised classification method of ERDAS software. The result is shown in
Figure 3.
2.2.4. Normalized Difference Vegetation Index (NDVI)
The MODIS (Moderate Resolution Imaging Spectroradiometer) product MOD09GA was adopted to drive the vegetation coverage map. Vegetation coverage was described by the normalized difference vegetation index (NDVI), which is an indicator of plant growth status and spatial distribution of vegetation. The NDVI varies between −1.0 and +1.0. For the same vegetation, the greater the NDVI value, the better the vegetation growth. The NDVI was calculated from these individual measurements as follows:
where Red and NIR stand for the spectral reflectance measurements acquired in the red (visible, 0.58–0.68 µm) and near-infrared (0.725–1.1 µm) regions, respectively.
In this research, the NDVI was calculated by MODIS images and provided by International Scientific & Technical Data Mirror Site, Computer Network Information Center, Chinese Academy of Sciences (
http://www.gscloud.cn).
The method was as follows:
In the formula, B1 and B2 represent the band 1 and band 2 of MODIS remote sensing images, respectively.
In this research, NDVI was a daily product of MODND1D China 500 m; TERRA China 500 m NDVI daily products were processed by MOD09GA through stitching, cutting, projection conversion, unit conversion, and other processes. MOD09GA is MODIS Terra/Aqua Surface Reflectance Daily L2G Global 500 m and 1000 m, which provides MODIS band 1–7 daily surface reflectance at 500 m resolution and 1000 m observation and geolocation statistics. In order to compare the vegetation coverage in different years, each phase of NDVI was selected on July 1. Data description is shown in
Table 2.
2.2.5. Vegetation Coverage
Vegetation coverage is the percentage of vertical projection area of vegetation (including leaves, stems, and branches) on the ground as a percentage of the total area of the statistical area [
35,
36,
37]. The measurement of vegetation coverage includes two methods: ground measurement and remote sensing estimation. Ground surveys are often used for field scales and remote sensing estimates are used for regional scales. At present, many methods for measuring vegetation coverage by remote sensing have been established. A more practical method is to approximate vegetation coverage by using a vegetation index. The commonly used vegetation index is the normalized difference vegetation index (NDVI). The NDVI quantifies vegetation by measuring the difference between near-infrared (strong vegetation reflection) and red light (vegetation absorption). It ranges from −1 to 1. When the value is negative, it is highly likely that it is water; on the other hand, if it is close to 1, there is a high possibility that it is dense green leaves. In addition, when it is close to zero, there is no vegetation and it could be a bare ground. The calculation methods of vegetation coverage were as follows:
In the formula,
and
are the minimum and maximum values of NDVI in the study area, respectively.
is the NDVI value of completely bare soil or vegetation-free areas, and
is the NDVI value of completely covered pixels, that is, the NDVI value of pure vegetation pixels [
38,
39]. The Equation (3) changes to Equation (4).
2.2.6. Linear Regression
A linear trend line can be used for a best-fit line for a simple dataset [
40,
41,
42]. The linear trend line usually indicates the event increases (coefficient of independent variable is greater than zero) or decreases (coefficient of independent variable is less than zero) at a constant rate [
43,
44,
45,
46].
3. Results and Discussion
3.1. Land Use and Cover Change
The land use and cover change (LUCC) in the Yan River Basin has undergone tremendous changes since the implementation of the “Western Development” strategy in 2000 and “Grain for Green” Program at the end of 1999. The runoff and sediment discharge of Ganguyi hydrological station in the Yan River Basin decreased significantly from 2000 to 2010 [
47]. Using ETM+, TM, and OLI remote sensing images, land use data was obtained by the supervised classification method of ERDAS software [
48]. According to the actual situation of the study area, referring to the “National 1:100,000 Land Use Classification Standards” of the Chinese Academy of Sciences Resource and Environmental Data Center, the land use types are divided into six types: agricultural land, forestry, grassland (low, medium, and high coverage), water body, construction, and unused land. Wasteland with sparse vegetation on the surface is divided into grassland.
Figure 3 shows the land use maps in the Yan River Basin from 1999 to 2015. The main types of land use in the basin are sparse grassland and cropland. The land use structure has changed greatly in different periods. The area of cropland and sparse grassland has decreased significantly, and the area of woodland and grassland with high coverage has increased significantly.
3.2. Vegetation Coverage
In order to study the influence of GGP on vegetation coverage, the NDVI of Yan River Basin on July 1 of each year from 2000 to 2015 was used as the basic data. The vegetation coverage of the Yan River Basin in different periods was calculated by using NDVI and ERDAS Image, a remote sensing image analysis software.
Figure 4 shows the change of vegetation in Yan River from 2000 to 2015 in summer. The vegetation coverage map ranges from green to red color, the value from low to high, respectively. From the maps, the vegetation cover in the south and southwest is higher than that in the north, and the vegetation coverage increases gradually during the study period.
Figure 5 is a histogram of the vegetation coverage of the Yan River Basin in four periods calculated by
Figure 4. The value distribution is similar to the normal distribution, and the maximum, minimum, and mean values in different periods are shown in
Table 3. As can be seen in
Table 3, the values of vegetation coverage increased from 2000 to 2015 year by year. The GGP has played an important role in vegetation and ecological restoration. Meanwhile, due to the implementation of soil and water conservation and the GGP, a large area of cultivated land has been abandoned, so that it can be restored naturally, forming abandoned vegetation in different years, and increasing the vegetation coverage in the region.
3.3. Grain for Green Program Has Increased the Income of Farmers
Since the implementation of the Western Development Policy in 2000, a series of incentive policies have been issued in land management, population and labor mobility, major infrastructure construction, and important industrial layout, which have promoted the development of the urban and rural economy. Policy factors have a mandatory impact on land use change [
49]. Affected by the GGP in the development of the western region in China, the forest in this region has increased significantly and achieved remarkable results, which has a positive impact on the improvement of regional land cover [
50].
With the adjustment of industrial structure, the land use pattern in the basin has changed. The outstanding manifestation is the significant reduction of cultivated land and the increase of forestry. High-coverage grassland increased, while the medium- and low-coverage grassland transferred to woodland and high-coverage grassland. Social and economic development and national policies are the reasons for the transformation of industrial structure, which leads to the change of employment posts and land use patterns of residents. From 2000 to 2010, the proportion of the nonagricultural population in the basin increased from 25.31% to 39.09% [
47]. The share of agricultural gross domestic product (GDP) showed a downward trend, from 19.42% to 9.32% [
47]. In the nonagricultural industry, the development of the petroleum industry is the most significant. Taking Ansai County as an example, the petroleum revenue accounts for more than 80% of the county’s finances [
51].
The implementation of the GGP has significantly promoted the increase in farmers’ income. Since the implementation of the policy in 1999, the per capita arable land area has decreased significantly, while the per capita net income has steadily increased. According to the data of Ansai County Statistical Bureau, the per capita net income of farmers was 1,504 yuan in 1999 before the project, and reached 11,271 yuan in 2016. The implementation of GGP has resulted in a large number of surplus rural labor force transferring to nonagricultural industries in Ansai County, which has promoted the increase of farmers’ income [
52].
Figure 6 shows the total GDP of the Yan River Basin from 2000 to 2016 (billion yuan). From 2000 to 2016, the gross and PGDP of the Yan River Basin increased significantly (
Figure 6 and
Figure 7), from 13.063 billion to 108.291 billion yuan and 6690 to 48,300 yuan, respectively. The gross GDP and PGDP of the Yan River Basin decreased from 2015 to 2016.
Regression analysis was performed on GDP and PGDP from 2000 to 2016, and linear regression equations were used to obtain linear equations. The regression equation and R2 of GDP in the Yan River Basin are as follows:
From the equation, the annual growth rate of GDP in the Yan River Basin from 2000 to 2016 was 8.5103 times higher and 96% of points indicating agreement with the data.
In
Figure 7, the regression equation and R2 of PGDP for the Yan River Basin and Shaanxi Province from 2000 to 2016 are as follows:
From the above two equations, the annual growth rate of PGPD is faster in the Yan River Basin than that in Shaanxi Province; the slope of the Yan River Basin is 3.7695, and that of Shaanxi Province is 3.2136.
Figure 8 shows the per capita net income of rural residents in the Yan River Basin and Shaanxi Province from 2000 to 2016 (1000 yuan). As can be seen from
Figure 8, the per capita net income of rural residents is increasing steadily, and it is higher in the Yan River Basin than in Shaanxi Province, which is more obvious since 2008, with the fact that the slope of the Yan River Basin is 0.6216 and that of Shaanxi Province is 0.509.
Figure 8 represents the regression equations for rural residents’ per capita net income in the Yan River Basin and Shaanxi Province from 2000 to 2016 which are as follows:
From the above two equations, the annual growth rate of per capita net income (0.6216 billion yuan) in the Yan River Basin is faster than that in Shaanxi Province (0.509 billion yuan). The correlation of 95% and 94.59% respectively satisfy the two trend lines of Formulas 8 and 9.
After the compensation for the GGP, there was a decline in the rural people’s income in a few areas of project implementation (for example, the GDP and PGDP of the Yan River Basin in 2015 and 2016; see
Figure 6 and
Figure 7). It is mainly due to the fact that the implementation of the GGP can effectively increase the income of farmers in a short period. It can be illustrated as follows: (1) Throughout the implementation period, the state provides relevant subsidies for farmers, which effectively increases farmers’ income. (2) During the term, farmers can obtain a certain amount of nonagricultural income (eight years for ecological forest compensation, five years for economic forest compensation, three years for returning farmland to grassland). However, after the compensation for the GGP, the income of farmers declined. The main reasons are as follows: (1) After the compensation for the GGP, it is difficult for most farmers to find other jobs, which affects the income of farmers to a certain extent. (2) The farmers with forestry planting as the main income accounts for a small amount, and even if they can obtain a certain income, there is a drop in the GDP. (3) The GGP is mainly based on ecological construction, so the planting of ecological forests hinders the possibility of farmers getting income from forests to some degree, which lowers the possibility of farmers obtaining income from forests to some extent. (4) Due to the influence of various environmental factors, the forest growth cycle is too long, and it is difficult for farmers to obtain corresponding income. Except for some subsidies, there is no corresponding income, which seriously affects the livelihood of farmers.
3.4. Changes in Rainfall over the Last 40 Years
The variation of precipitation is mainly affected by factors such as climate (barometric and wind belt, monsoon), topography, ocean current, land and sea position, underlying surface, and other factors. Interannual variations in vegetation coverage are mainly due to climate fluctuations and human activities. Most of the Yellow River Basin belongs to arid and semiarid areas. Precipitation is the most important limiting factor affecting the growth of natural vegetation. Therefore, in a short period, the most significant factor affecting vegetation cover should be the amount of precipitation and the distribution during the year. At the same time, changes in vegetation also adversely affect local climate change. The influence mechanism of vegetation on climate is complex and varies in different regions. Vegetation growth can affect regional climate through the exchange of water, energy, and momentum between land and air, as well as various biological processes such as CO2 and CH4 emissions [
53]. In addition to regional scales, the effects of vegetation can also affect large-scale circulation by affecting local atmospheric circulation or biogeochemical cycles, ultimately affecting large-scale climate change, even global climate [
54,
55,
56,
57]. In recent years, researchers have used remote sensing data to diagnose and simulate the interaction between vegetation and climate change [
58,
59,
60,
61,
62]. Studies have shown that vegetation changes have a significant impact on surface temperature and precipitation in China and severe vegetation changes can affect the intensity of East Asian summer monsoons. In most regions of China, NDVI is positively correlated with precipitation, and there are regional differences in the correlation between them [
63].
The rainfall data in this study from the Global Precipitation Climatology Project (GPCP) precipitation datasets were used to analyze the impact of vegetation change on rainfall.
Figure 9,
Figure 10 and
Figure 11 show the annual average rainfall changes in the Yan River Basin from 1970 to 2018, before and after the program. It can be seen from the figures that the average rainfall from 1970 to 2018 was increasing with the slope of 1.0525. Before the implementation of the policy (before 1999), the rainfall was declining, when the slope was −1.0351. After 1999, the trend was on the rise with the slope of 4.2935. Before the implementation of the policy, due to local indiscriminate slashing, the surface cover was seriously damaged and the vegetation coverage reduced.
Vegetation cover has a great impact on the moisture content and convective activity in the atmosphere: the total amount of water vapor entering the atmosphere with vegetation cover has increased significantly, the convective activity in large or small scales has strengthened, the regional precipitation has increased, and the number of days without precipitation has decreased. Surfaces without vegetation cover show the opposite situation [
64]. Studies on the relationship between vegetation change and precipitation have found that the two can influence each other. From our research, the vegetation cover had a positive effect on rainfall in the research period. Generally, local vegetation change with sufficient precipitation or sufficient irrigation conditions is less affected by precipitation [
64]. Some scholars believe that forests can enhance precipitation to a certain extent, and the effect of vegetation change on precipitation increases with the decrease of atmospheric humidity. Some studies have suggested that vegetation has little effect on rainfall. The correlation between vegetation coverage and temperature is the highest, followed by rainfall, sunshine hours, and relative humidity in Northeast China [
65]. A recent study shows that vegetation growth can alleviate local surface temperature [
66,
67].
After the implementation of the GGP (after 1999), some vegetation types in the Loess Plateau changed from farmland to temperate deciduous broad-leaved forest. The surface state characteristic variables also changed accordingly (such as surface albedo, surface roughness, and soil moisture), which made the radiant flux and effective heat flux (sensible heat flux and latent heat flux) in the study area change in different degrees. The increase of vegetation cover, with the surface roughness, the soil water-holding capacity, the soil water content, and the surface evapotranspiration increase due to the increase of latent heat flux, has played a certain role in the increase of precipitation in this area [
68]. The Yan River Basin is located in the central part of the Loess Plateau. Since the implementation of the GGP, part of the agricultural land has changed into forestry, and sparse vegetation area has reduced. The surface cover has changed and the surface reflectance has decreased, while the roughness rate, the soil water content, and the surface evapotranspiration have increased, thus an increase of rainfall was caused in the region.
3.5. Impact of Vegetation Change on Climate
Increasing scientific evidence shows that anthropogenic land use and cover change (LUCC) have a significant impact on regional and global climate [
69]. The interactions between the land surface and the atmosphere at various temporal and spatial scales and the exchange of momentum, energy, matter, and radiation have a great impact on atmospheric circulation and climatic conditions [
70,
71]. The change of vegetation cover affects the processes of radiation balance and water balance by changing the surface properties such as albedo, roughness, and soil moisture, and ultimately leads to changes in regional precipitation, circulation, atmospheric temperature, and humidity, and other climate changes [
72]. Recent studies have shown that extensive deforestation in the Amazon Basin reduces regional moisture cycles and deep convection in the atmosphere [
73,
74]. Charney [
75] studied drought in Sahel, Africa, and proposed the Earth’s biofeedback mechanism to explain the aggravation of drought in desert margins. He believes that overgrazing destroyed the vegetation and increased the reflectivity, which changed the energy balance of the surface and made it a radiation heat sink.
Vegetation is an important feature of surface condition. Each vegetation has its own reflectivity, roughness, and soil moisture, forming a unique radiation, heat, and water balance relationship and local climate system. Different vegetation conditions affect atmospheric circulation and climate change by affecting surface albedo, soil temperature, and humidity, while the atmosphere affects vegetation by changing clouds, precipitation, and temperature. Precipitation and temperature have a restrictive effect on plant communities. Vegetation increases the surface roughness and has less albedo than bare land. Vegetation changes surface runoff and surface hydrological processes through transpiration and water-fixing effects on soil, and thus impacts climate.
The Yan River Basin is located in the inland area of China. With the increase of vegetation coverage, rainfall increases significantly and so does humidity. In summer, when forestry changes into grassland, or grassland changes into cultivated land, the temperature of the land surface increases continuously, which is due to the increase of sensible heat caused by vegetation degradation and land drying in this area. Usually, the degradation of surface vegetation will make summer hotter and winter colder, but in different regions (different natural environments and climate conditions), the same change of surface vegetation will produce different climatic effects.
4. Conclusions
It is found that by adjusting the land use patterns and carrying out engineering measures to restore vegetation, such as artificial afforestation, conversion of farmland to forests and grasses, and so forth, climate change can be mitigated on a certain scale. However, the feedback of vegetation change on the climate has not yet been determined.
China launched the ecological protection project, the “Grain for Green” Program (GGP), aimed at improving the ecological environment, controlling soil erosion, and adjusting the agricultural industrial structure to promote the sustainable development of the rural economy. Since the implementation of this project, remarkable achievements have been made in improving the ecological environment and reducing soil erosion. At the same time, the conversion of large-scale sloping farmland to forestry and grassland has greatly affected the agricultural and rural economic development of the project implementation area. The implementation of the project has created favorable conditions for the adjustment of the agricultural industrial structure in the mountainous areas. The peasant life and the local economy have improved to varying degrees, which has promoted local economic development and increased farmers’ income. The adjustment of the agricultural industrial structure has changed the land use type, and the change of surface cover has an impact on the regional climate.
This study used Landsat remote sensing imagery, TERRA satellite 500M NDVI daily product, and remote sensing image processing software ERDAS to obtain land use data for four different periods (1999–2015) in the Yan River Basin, and vegetation coverage on July 1 of each year after the implementation of the GGP (after 1999). Cropland in the Yan River Basin decreased significantly, while the forestry increased, and the transformation from low-coverage grassland to high-coverage grassland was obvious. The maximum, minimum, and mean values of vegetation coverage increased year by year in summer. The surface coverage of the Yan River Basin increased, and vegetation changes have had an important impact on precipitation. From 1970 to 2018, the annual average rainfall showed an increasing trend, while before the implementation of the project (1970–1999), the trend was downward. During this period, deforestation, vegetation degradation, surface bareness, low soil water content, and the surface evapotranspiration decreased in the Yan River Basin, which adversely affected the rainfall in the region. After the implementation of the project (after 1999), the vegetation coverage, the surface roughness, the soil water-holding capacity, the soil water content, and the surface evapotranspiration increased significantly, which had a positive impact on regional precipitation, and the annual average rainfall increased from 1999 to 2018.
Precipitation in the Yan River Basin is mainly related to large-scale climate system activities. The whole rainfall process is often accompanied by large-scale water vapor transport, and also has a certain relationship with vegetation cover. With the increase of vegetation coverage and the increase of water vapor content near the surface, precipitation is likely to occur if updraft is encountered. The GGP is found to be the main driving factor for the vegetation coverage increase. Increased vegetation results in lower surface albedo and higher temperature. This positive effect can be offset by higher evaporation, while the net effect is a decrease in surface temperature during the daytime. The increase of evapotranspiration after vegetation restoration is the main reason for the decrease of runoff [
76].
The influence mechanism of vegetation on climate varies in different regions. Scientifically exploring the impacts of vegetation on climate in different regions is conducive to the knowledge of climate, ecological environmental protection, and improvement programs.
Author Contributions
Conceptualization, B.G.; methodology, B.G. and T.X.; software, B.G. and M.V.S.; validation, B.G., M.V.S. and T.X.; formal analysis, M.V.S.; investigation, B.G.; resources, B.G.; data curation, B.G.; writing—original draft preparation, B.G.; writing—review and editing, T.X. and M.V.S.; supervision, B.G.; project administration, B.G.; funding acquisition, B.G.
Funding
This study is supported by the State Key Laboratory of Plateau Ecology and Agriculture, Qinghai University (Grant No. 2018-KF-02), the National Natural Science Foundation of China (Grant No. 51479179 and 51579230), and the Science Foundation of Zhejiang Ocean University (Grant NO. 21105011713).
Acknowledgments
Authors thank Runsheng Yin for his valuable suggestion.
Conflicts of Interest
The authors declare no conflict of interest.
References
- Chen, L.; Messing, I.; Zhang, S.; Fu, B.; Ledin, S. Land use evaluation and scenario analysis towards sustainable planning on the Loess Plateau in China—Case study in a small catchment. Catena 2003, 54, 303–316. [Google Scholar] [CrossRef]
- Wu, X.; Wang, S.; Fu, B.; Feng, X.; Chen, Y. Socio-ecological changes on the Loess Plateau of China after Grain to Green Program. Sci. Total Environ. 2019, 678, 565–573. [Google Scholar] [CrossRef] [PubMed]
- Wang, S.; Fu, B.; Piao, S.; Lü, Y.; Ciais, P.; Feng, X.; Wang, Y. Reduced sediment trans-port in the Yellow River due to anthropogenic changes. Nat. Geosci. 2015, 9, 38–41. [Google Scholar] [CrossRef]
- Yang, R. Cultivated land soil and water loss for our country and control measures. Bull. Soil Water Conserv. 1994, 14, 32–36. [Google Scholar]
- Bakker, M.M.; Govers, G.; van Doom, A.; Quetier, F.; Chouvardas, D.; Rounsevell, M. The response of soil erosion and sediment export to land-use change in four areas of Europe: The importance of landscape. Geomorphology 2008, 98, 213–226. [Google Scholar] [CrossRef]
- Fu, B.; Wang, S.; Liu, Y.; Liu, J.; Liang, W.; Miao, C. Hydrogeomorphic ecosystem responses to natural and anthropogenic changes in the Loess Plateau of China. Annu. Rev. Earth Planet. Sci. 2007, 45, 223–243. [Google Scholar] [CrossRef]
- Cao, S.; Chen, L.; Yu, X. Impact of China’s Grain for Green Project on the landscape of vulnerable arid and semi-arid agricultural regions: A case study in northern Shaanxi Province. J. Appl. Ecol. 2009, 46, 536–543. [Google Scholar] [CrossRef]
- Lu, Y.; Fu, B.; Feng, X.; Zeng, Y.; Liu, Y.; Chang, R.; Sun, G.; Wu, B. A policy-driven large scale ecological restoration: Quantifying ecosystem services changes in the Loess Plateau of China. PLoS ONE 2012, 7, e31782. [Google Scholar]
- Feng, X.; Fu, B.; Lu, N.; Zeng, Y.; Wu, B. How ecological restoration alters ecosystem services: An analysis of carbon sequestration in China’s Loess Plateau. Sci. Rep. 2013, 3, 2846. [Google Scholar] [CrossRef]
- Jiang, C.; Wang, F.; Zhang, H.Y.; Dong, X.L. Quantifying changes in multiple ecosystem services during2000–2012 on the Loess Plateau, China, as a result of climate variability and ecological restoration. Ecol. Eng. 2016, 97, 258–271. [Google Scholar] [CrossRef]
- Treacy, P.; Jagger, P.; Song, C.; Zhang, Q.; Bilsborrow, R.E. Impacts of China’s Grain for Green Program on Migration and Household Income. Environ. Manag. 2018, 62, 489–499. [Google Scholar] [CrossRef]
- Delang, C.O.; Yuan, Z. China’s Grain for Green Program: A Review of the Largest Ecological Restoration and Rural Development Program in the World; Springer: Cham, Switzerland, 2015. [Google Scholar]
- Ministry of Finance of China, State Administration of Forestry and Grassland, Management Measures of Fund for Forestry Ecological Protection Recovery, China Forestry Website. Available online: http://www.forestry.gov.cn/ (accessed on 8 November 2016).
- Li, Y.; Sulla-Menashe, D.; Motesharrei, S.; Song, X.P.; Kalnay, E.; Ying, Q.; Li, S.; Ma, Z. Inconsistent estimates of forest cover change in China between 2000 and 2013 from multiple datasets: Differences in parameters, spatial resolution, and definitions. Sci. Rep. 2017, 7, 8748. [Google Scholar] [CrossRef]
- Singh, D.; Mc Dermid, S.P.; Cook, B.I.; Puma, M.J.; Nazarenko, L.; Kelley, M. Distinct Influences of Land Cover and Land Management on Seasonal Climate. J. Geophys. Res. Atmos. 2018, 123, 12–017. [Google Scholar] [CrossRef]
- Diffenbaugh, N.S. Influence of modern land cover on the climate of the United States. Clim. Dyn. 2009, 33, 945. [Google Scholar] [CrossRef]
- Douglas, E.M.; Niyogi, D.; Frolking, S.; Yeluripati, J.B.; Pielke, R.A., Sr.; Niyogi, N.; Vörösmarty, C.J.; Mohanty, U.C. Changes in moisture and energy fluxes due to agricultural land use and irrigation in the Indian Monsoon Belt. Geophys. Res. Lett. 2006, 33, L14403. [Google Scholar] [CrossRef]
- Halder, S.; Saha, S.K.; Dirmeyer, P.A.; Chase, T.N.; Goswami, B.N. Investigating the impact of land-use land-cover change on Indian summer monsoon daily rainfall and temperature during 1951–2005 using a regional climate model. Hydrol. Earth Syst. Sci. 2016, 20, 1765–1784. [Google Scholar] [CrossRef]
- Hirsch, A.L.; Pitman, A.J.; Kala, J.; Lorenz, R.; Donat, M.G. Modulation of land-use change impacts on temperature extremes via land–atmosphere coupling over Australia. Earth Interact. 2015, 19, 1–24. [Google Scholar] [CrossRef]
- Lee, E.; Chase, T.N.; Rajagopalan, B.; Barry, R.G.; Biggs, T.W.; Lawrence, P.J. Effects of irrigation and vegetation activity on early Indian summer monsoon variability. Int. J. Climatol. 2009, 29, 573–581. [Google Scholar] [CrossRef]
- McDermid, S.S.; Mearns, L.O.; Ruane, A.C. Representing agriculture in Earth system models: Approaches and priorities for development. J. Adv. Model. Earth Syst. 2017, 9, 2230–2265. [Google Scholar] [CrossRef]
- Pielke, R.A.; Pitman, A.; Niyogi, D.; Mahmood, R.; Mc Alpine, C.; Hossain, F.; Goldewijk, K.K.; Nair, U.; Betts, R.; Fall, S.; et al. Land use/land cover changes and climate: Modeling analysis and observational evidence. Wiley Interdiscip. Rev. Clim. Chang. 2011, 2, 828–850. [Google Scholar] [CrossRef]
- Quesada, B.; Arneth, A.; de Noblet-Ducoudré, N. Atmospheric, radiative, and hydrologic effects of future land use and land cover changes: A global and multi model climate picture. J. Geophys. Res. Atmos. 2017, 122, 5113–5131. [Google Scholar] [CrossRef]
- Yamashima, R.; Matsumoto, J.; Takata, K.; Takahashi, H.G. Impact of historical land-use changes on the Indian summer monsoon onset. Int. J. Climatol. 2015, 35, 2419–2430. [Google Scholar] [CrossRef]
- Jiang, W.; Hou, P.; Zhu, X.; Cao, G.; Liu, X.; Cao, R. Analysis of vegetation response to rainfall with satellite images in Dongting Lake. J. Geogr. Sci. 2011, 21, 135–149. [Google Scholar] [CrossRef]
- Sale, O.E.; Parton, W.J.; Joyce, L.A.; Lauenroth, W.K. Primary production of the central grassland region of the United States. Ecology 1988, 69, 40–45. [Google Scholar] [CrossRef]
- Sun, R.; Liu, C.; Zhu, Q. Relationship between the fractional vegetation cover change and rainfall in the Yellow River Basin. Acta Geogr. Sin. 2001, 56, 667–672. (In Chinese) [Google Scholar]
- Cui, L.; Shi, J.; Yang, Y.; Fan, W. Ten-day response of vegetation NDVI to the variations of temperature and precipitation in eastern China. Acta Geogr. Sin. 2009, 64, 850–860. (In Chinese) [Google Scholar]
- Chandrasekar, K.; Sai, M.V.R.S.; Jeyaseelan, A.T.; Dwivedi, R.S.; Roy, P.S. Vegetation response to rainfall as monitored by NOAA-AVHRR. Curr. Sci. 2006, 91, 1626–1633. [Google Scholar]
- Xie, L.; Wen, G.; Fu, G. The response of the vegetation seasonal variability and its spatial pattern to climate variation in China: Multi-year average. Acta Meteorol. Sin. 2002, 60, 181–187. (In Chinese) [Google Scholar]
- Mankiw, N. Brief Principles of Macroeconomics; Cengage: Boston, MA, USA, 2006. [Google Scholar]
- Diana, F.; Wilcox, S.J. Cost-benefit Analysis for Public Sector Decision Makers; Greenwood Publishing Group: Westport, CT, USA, 1999. [Google Scholar]
- Barro, R.J. Macroeconomics; MIT Press: Cambridge, MA, USA, 1997. [Google Scholar]
- Robert, F.; George, A.; Huffman, J.; Chang, A.; Ferraro, R.; Xie, P.-P.; Janowiak, J.; Rudolf, B.; Schneider, U.; Curtis, S.; et al. The Version-2 Global Precipitation Climatology Project (GPCP) monthly precipitation analysis (1979–Present). J. Hydrometeorol. 2003, 4, 1147–1167. [Google Scholar]
- Liu, Q.; Shi, T. Spatiotemporal Differentiation and the Factors of Ecological Vulnerability in the Toutun River Basin Based on Remote Sensing Data. Sustainability 2019, 11, 4160. [Google Scholar] [CrossRef]
- Carlos, J.; Hernández, B.M.; Rico, A.M.; Olcina, J. The Hydrosocial Cycle in Coastal Tourist Destinations in Alicante, Spain: Increasing Resilience to Drought. Sustainability 2019, 11, 4494. [Google Scholar] [CrossRef]
- Chou, J.; Xian, T.; Zhao, R.; Xu, Y.; Yang, F.; Sun, M. Drought Risk Assessment and Estimation in Vulnerable Eco-Regions of China: Under the Background of Climate Change. Sustainability 2019, 11, 4463. [Google Scholar] [CrossRef]
- Liu, X.; Xu, Z.; Peng, D. Spatio-Temporal Patterns of Vegetation in the Yarlung Zangbo River, China during 1998–2014. Sustainability 2019, 11, 4334. [Google Scholar] [CrossRef]
- Liu, Y. Classification Research on Regional Conservation of Water and Soil Vegetation Synthesis Based on the High Time Resolution Remote Sensing Data-Taking the Loess Plateau as an Example. Ph.D. Thesis, Chinese Academy of Science Graduate School, Beijing, China, 2006. (In Chinese). [Google Scholar]
- Aitchison, J. The Statistical Analysis of Compositional Data; Blackburn Press: Caldwell, NJ, USA, 2003. [Google Scholar]
- Access for Office 365. Choosing the Best Trend Line for Your Data. Available online: https://support.office.com/en-us/article/ (accessed on 14 September 2019).
- Hron, K.; Filzmoser, P.; Thompson, K. Linear regression with compositional explanatory variables. J. Appl. Stat. 2012, 39, 1115–1128. [Google Scholar] [CrossRef]
- Jolliffe, I.T. Principal Component Analysis; Springer: New York, NY, USA, 2005. [Google Scholar]
- Dobson, A.J.; Barnett, A.G. An Introduction to Generalized Linear Models, 3rd ed.; CRC Press: Boca Raton, FL, USA, 2008. [Google Scholar]
- Montgomery, D.C.; Peck, E.A.; Vining, G.G. Introduction to Linear Regression Analysis; John Wiley & Sons, Inc.: Hoboken, NJ, USA, 2006. [Google Scholar]
- Filzmoser, P. StatDA: Statistical Analysis for Environmental Data. R Package Version 1.6.7. 2013. Available online: http://CRAN.R-project.org/package=StatDA (accessed on 9 August 2019).
- Lou, H.; Yang, S.; Zhou, Q.; Luo, Y.; Hou, L. Analysis of the land use/cover change and driving forces in Yan River Basin from 2000 to 2010. J. Arid Land Resour. Environ. 2014, 28, 15–21. [Google Scholar]
- Tang, G.; Zhang, Y.; Liu, Y. Digital Remote Sensing Data Processing; Press of Science: Beijing, China, 2004. (In Chinese) [Google Scholar]
- Wood, D.; Lenné, J.M. ‘Rreceived wisdom’ in agriculture land use policy: 10 years on from Rio. Land Use Policy 2005, 22, 75–93. [Google Scholar] [CrossRef]
- Liu, J.; Zhang, Z.; Xu, X.; Kuang, W.; Zhou, W.; Zhang, S.; Li, R.; Yan, C.; Yu, D.; Wu, S.; et al. Spatial patterns and driving forces of land use change in China in the early 21st century. Acta Geogr. Sin. 2009, 64, 1411–1420. [Google Scholar] [CrossRef]
- National Bureau of Statistics. Statistical Data on National Economic and Social Development of Ansai County. Available online: http://www.stats.gov.cn (accessed on 28 February 2017). (In Chinese)
- Hu, C.; Fu, B.; Chen, L. Agriculture and rural economics development in the Loess Hilly and Gully area-A case study in Ansai County. J. Arid Land Resour. Environ. 2006, 20, 67–72. (In Chinese) [Google Scholar]
- Wendler, G.; Eaton, F. On the desertification of the Sahel zone. Clim. Chang. 1983, 5, 365–380. [Google Scholar] [CrossRef]
- Snyder, P.k.; Delire, C. A Systematic analysis of the influence of vegetation on local and global climate using a coupled atmosphere-biosphere model, CCM3-IBIS[C]. In AGU Fall Meeting Abstracts; EOS Transactions: San Francisco, CA, USA, 2001. [Google Scholar]
- Neelin, J.D.; Su, H. Moist teleconnection mechanisms for the tropical South American and Atlantic sector. J. Clim. 2005, 18, 3928–3950. [Google Scholar] [CrossRef]
- Voldoire, A.; Royer, J.F. Tropical deforestation and climate variability. Clim. Dyn. 2004, 22, 857–874. [Google Scholar] [CrossRef]
- Voldoire, A.; Royer, J.F. Climate sensitivity to tropical land surface changes with coupled versus prescribed SSTs. Clim. Dyn. 2005, 24, 843–862. [Google Scholar] [CrossRef]
- Ding, Y.; Li, Q.; Dong, W. A numerical simulation study of the impacts of vegetation changes on regional climate in China. Acta Meteorol. Sin. 2005, 63, 613–621. (In Chinese) [Google Scholar]
- Fu, C.; Wen, G.; Xie, L.; Zhao, M.; Yuan, H. The diagnosis and simulation studies on climate and ecosystem interactions in East Asia monsoon region. J. Nanjing Univ. (Nat. Sci.) 2002, 38, 281–294. (In Chinese) [Google Scholar]
- Gong, D.; Shi, P. Inter-annual changes in Eurasian continent NDVI and its sensitivity to the large-scale climate variations in the last 20 years. Acta Bot. Sin. 2004, 46, 186–193. [Google Scholar]
- Li, X.; Wang, Y.; Li, K. NDVI sensitivity to seasonal and interannual rainfall variations in Northern China. Acta Geogr. Sin. 2000, 55, 82–89. (In Chinese) [Google Scholar]
- Pu, S.; Fang, J. Seasonal changes in vegetation activity in response to climate changes in China between 1982 and 1999. Acta Geogr. Sin. 2003, 58, 119–125. (In Chinese) [Google Scholar]
- Zhang, J.Y.; Dong, W.J.; Fu, C.B.; Wu, L.Y. The influence of vegetation cover on summer precipitation in China: A statistical analysis of NDVI and climate data. Adv. Atmos. Sci. 2003, 20, 1002–1006. [Google Scholar]
- Ma, W.; Zhao, Z.; Liu, X.; Yan, D. A quantitative analysis of the relationship between vegetation indices and land surface temperature based on remote sensing: A case study of TM data for Beijing. Remote Sens. Land Resour. 2010, 87, 109–112. (In Chinese) [Google Scholar]
- Nie, Q.; Xu, J.; Ji, M.; Cao, L.; Yang, Y.; Hong, Y. The vegetation coverage dynamic coupling with climatic factors in Northeast China. Environ. Manag. 2012, 50, 405–417. [Google Scholar] [CrossRef]
- Peng, S.S.; Piao, S.L.; Zeng, Z.Z.; Ciais, P.; Zhou, L.; Li, L.Z.; Myneni, R.B.; Yin, Y.; Zeng, H. Afforestation in China cools local land surface temperature. Proc. Natl. Acad. Sci. USA 2014, 111, 2915–2919. [Google Scholar] [CrossRef] [Green Version]
- Shen, M.; Piao, S.L.; Jeong, S.J.; Zhou, L.; Zeng, Z.; Ciais, P.; Chen, D.; Huang, M.; Jin, C.-S.; Li, L.Z.X.; et al. Evaporative cooling over the Tibetan Plateau induced by vegetation growth. Proc. Natl. Acad. Sci. USA 2015, 112, 9299–9304. [Google Scholar] [CrossRef] [Green Version]
- Wang, P.; Shen, R. Vegetation cover change effects on climate in the Loess Plateau region based on CLM Model. Sci. Technol. Eng. 2013, 13, 5754–5760. [Google Scholar]
- Zhao, M.; Pitman, A.J.; Chase, T.N. The impact of land cover on the atmospheric circulation. Clim. Dynam. 2001, 17, 467–477. [Google Scholar] [CrossRef]
- Pielke, R.A.; Marland, G.; Betts, R.A.; Chase, T.N.; Eastman, J.L.; Niles, J.O.; Niyogi, D.D.S.; Running, S.W. The influence of land-use change and landscape dynamics on the climate system: Relevance to climate-change policy beyond the radiative effect of greenhouse gases. Philos. Trans. R. Soc. Lond. Ser. A-Math. Phys. Eng. Sci. 2002, 360, 1705–1719. [Google Scholar] [CrossRef]
- National Research Council of the National Academies. Radiative Forcing of Climate Change Expanding the Concept and Addressing Uncertainties; The National Academies Press: Washington, DC, USA, 2005. [Google Scholar]
- Rial, J.A.; Pielke, R.A., Sr.; Beniston, M.; Claussen, M.; Canadell, J.; Cox, P.; Held, H.; de Noblet-Ducoudré, N.; Prinn, R.; Reynolds, J.F.; et al. Nonlinearities, feedbacks and critical thresholds within the earth’s climate system. Clim. Chang. 2004, 65, 11–38. [Google Scholar] [CrossRef]
- Roy, S.B.; Avissar, R. Impact of land use/land cover change on regional hydrometeorology in Amazonian. J. Geophys. Res. 2002, 107, 8037. [Google Scholar]
- Werth, D.; Avissar, R. The local and global effects of Amazon deforestation. J. Geophys. Res. 2002, 107, 8087. [Google Scholar] [CrossRef]
- Ju, C. Dynamics of deserts and drought in Sahel. Quartj. R. Meteor. Soc. 1975, 101, 193–202. [Google Scholar]
- Li, S.; Liang, W.; Fu, B.; Lü, Y.; Fu, S.; Wang, S.; Su, H. Vegetation changes in recent large-scale ecological restoration projects and subsequent impact on water resources in China’s Loess Plateau. Sci. Total Environ. 2016, 569–570, 1032–1039. [Google Scholar] [CrossRef]
© 2019 by the authors. Licensee MDPI, Basel, Switzerland. This article is an open access article distributed under the terms and conditions of the Creative Commons Attribution (CC BY) license (http://creativecommons.org/licenses/by/4.0/).


