Article

Sports Industry Agglomeration and Green Economic Growth—Empirical Research Based on Panel Data of 30 Provinces and Cities in China

1
Department of Public Sports, Fujian Jiangxia University, Fuzhou 350108, China
2
College of Management and Economics, Tianjin University, Tianjin 300072, China
*
Author to whom correspondence should be addressed.
Sustainability 2019, 11(19), 5399; https://doi.org/10.3390/su11195399
Submission received: 29 August 2019 / Revised: 23 September 2019 / Accepted: 26 September 2019 / Published: 29 September 2019

Abstract

:
Based on the panel data of 30 provinces and cities in China from 2008 to 2017, this paper empirically analyzes the current situation of the development of China’s sports industry and the impact of the concentration of sports industry on green economic growth by using the exploratory spatial data analysis method (ESDA), static panel model and dynamic panel model. The empirical results show that the sports industry in the southeast coastal provinces of China has a good foundation for concentration. The sports industry concentration in the provinces along the Yangtze River Economic Belt is in the stage of rapid development. The development of sports industry concentration has obvious positive spatial aggregation characteristics, and the spatial spillover effect is obvious; The concentration of sports industry has a significant influence on green economic growth, which expresses the “inverted U-type” relationship. There are significant differences in influence between regions, which show the greatest influence in the middle, followed by the east and the smallest in the west.

With the rapid development of social economy, environmental pollution and resource consumption have severely restricted sustainable development. The report of the 19th National Congress of the Communist Party of China clearly states that China should “promote green development, focus on solving outstanding environmental problems and increase the protection of ecosystems”, which shows the urgent need for China to attach importance to the construction of ecological civilization and adhere to the path of “green growth” economic development in the current situation. “Green Economy”, first put forward by British economist Pierce in the Blue Book of Green Economy in 1989, incorporated environmental and resource factors into the performance study of economic growth, and developed a new economic situation based on the market-oriented, traditional industrial economy and the aim of economic and environmental harmony [1], which is not only one of the five development concepts of China’s economy and society, but also one of the important indicators to reflect the sustainable development of a country or region.
On 27 June 2016 at the World Economic Forum, Premier Li Keqiang of the State Council of China pointed out, that as the one of China’s five happy industries, the sports industry is committed to improving the physical quality and health of human beings [2]. In 2014, the State Council promulgated “Several Opinions on Accelerating the Development of Sports Industry to Promote Sports Consumption”, which called for the total size of the sports industry to exceed 5 trillion yuan by 2025, turning into a significant force for promoting the sustainable economic and social development. The “13th Five-Year Plan for the Development of Sports Industry” in 2016 points out that it shall plan rationally and strengthen the development of the sports industry in order to actively build characteristic sports gathering areas and industrial zones. Up to now, the development of China’s sports industry has developed into a new historical process. A total of 45 national sports industry demonstration bases in China had been approved by 2018. According to the research, the development of industrial concentration has a beneficial effect on the sharing of resources among sports enterprises, which is not only beneficial to the production scale effect and the technology spillover effect [3], but also can enhance the regional competitive advantage to drive economic growth [4].
With the rapid development of sports industry, its strategic position in national economic and social development becomes more prominent, which is the new force of driving economic growth. As a green, sunrise industry, the sports industry is aimed at taking the “green sports” as its mission [2], sustainable development and social harmony as a guide, integrating sports with environmental protection, resource utilization and other organic concepts. The sports industry emphasizes that while exercising the body and improving one’s health, it thinks highly of reducing energy consumption, saving resources and maximizing the maintenance of ecological balance, which creates excellent ecological environment feedback for the people involved in sports activities, so as to achieve a win-win situation [5]. In addition, the sports industry is regarded as a strategic pillar industry in China’s key training in the new period, and as a significant guide in the construction of ecological civilization, while there is little research of the influence of sports industry convergence on green economic growth under the background that the government vigorously develops the sports industry. Therefore, it is essential to clarify the relationship between the concentration of sports industry and the green economy, so as to lay a theoretical foundation for the better development of sports industry and the promotion of green economy.

1. Literature Review

Industrial agglomeration is widespread in the world, not only in developed countries, such as the typical manufacturing cluster phenomenon in the United States [6], but also in developing countries [7]. Therefore, the research on industrial agglomeration for economic growth became a hot topic for scholars in the 1990s. Firstly, Eliison and Krugman et al. measured the industrial agglomeration through index method, which made a significant contribution to measuring industrial agglomeration [8,9]. Through empirical research on relevant data, Baldwin and Ottaviano et al. found that industrial agglomeration has a positive role in promoting economic growth, laying the foundation for the follow-up of related research [10,11]. Subsequently, scholars conducted research on the influence of different industries for economic growth, such as manufacturing industry [12], cultural industry [13], financial industry [14], marine industry [15], tourism industry [16], and high-tech industry [17]. According to numerous research results, each type of industrial agglomeration has a different influence on economic growth. Industrial agglomeration can boost economic growth, while there is not a simply linear relationship between the two.
For example, Yu et al. [15] found an “inverted U-type” relationship between the marine industry agglomeration and economic growth; Yu et al. believed that the process of manufacturing agglomeration’s effect on regional economic efficiency presents an “N” type relationship [12]. Ji and others’ research found that when the agglomeration of financial industry is low, it is conducive to economic growth. Conversely, the high agglomeration counts against economic growth [14]. In addition, some scholars believed that there are remarkable regional differences in the influence of industrial agglomeration on economic growth. Yao et al. point out that there is a significant nonlinear relationship between the agglomeration of sports industry and economic growth, which presents the “Inverted U-type”. At the same time, agglomeration of sports industry in central China has significantly better promoted economic growth than that in the eastern and western regions [18]. In the study of the impact of knowledge spillover on regional economic gap, Ji et al. believed that the knowledge spillover of inland areas can narrow the economic gap between regions more than that of coastal areas [19].
As the development of green economy is influenced by many factors such as enterprise innovation and environmental regulation, so it also attracts scholars to discuss the factors that promote green economic development in different aspects. Cao et al. show that innovation-driven strategies play a positive role in the green economic development, and different innovation-driven indicators play different roles in promoting green economic development [20]. Zhou et al. analyzed the relationship between China’s Foreign Direct Investment (OFDI) and green economic development, and the study shows that OFDI can indeed promote China’s green economic growth, but the effect of the effect severity between the provinces shows a greater heterogeneity [21]. Song et al. studied the influence of the economic opening and research and development investment on the green economy, and the results showed that there is a non-linear “inverted U-type” relationship between the degree of economic openness and the green economic growth; The influence of research and development investment on the green economy is not conducive to green economic growth in the short-term, but has a positive effect on green economic growth with time goes by. At the same time, it also showed obvious regional differences in the influence of economic opening on green economic growth, that is, the eastern region is not significant, the central region has the “U-type” relationship, the western region has the “inverted U-type” relationship [22].
As industrial agglomeration has the function of reducing energy agglomeration and saving resources, some scholars have discussed the relationship between different industrial clusters and the green economy. Ren et al. analyzed the relationship between food industry aggregation and the spatial spillover effect of green economy efficiency, and the results show that the green economy efficiency has significant positive spatial dependence, and the concentration of food industry can not only improve the local green economy efficiency, but also have significant positive spatial spillover effect in other regions [23]. Hu et al. pointed out that the agglomeration of high-tech industries has a catalytic effect on the efficiency of green economy, presenting a “U-type” relationship. That is, the influence of high-tech industrial agglomeration on efficiency of the green economy shows a relationship first of inhibition, and then promotion [17]. Li et al. found that industrial agglomeration can eliminate the fittest, eliminate enterprises with excess capacity, backward technology and serious pollution, thus reducing environmental pollution and promoting green economy growth [24]. Xie et al. analyzed the effect of industrial agglomeration on green economy growth by constructing a spatial panel measurement model. The research results showed that industrial agglomeration has a significant positive effect on green economy growth. In addition, this positive impact has significant regional differences, which are manifested in the fact that the impact of the eastern region is significantly higher than that of the central and western regions [25]. Wang et al. found that industrial agglomeration can not only effectively promote the improvement of green economic operation efficiency, but also have a significant spatial spillover effect [26]. Therefore, the existing research shows that there is a certain correlation or influence effect between industrial agglomeration and the green economy.
However, in the past, scholars mostly studied the role of industry agglomeration in promoting green economy from a macro perspective, while there were few studies specializing in sports industry and green economy. According to the advantages of western China and the characteristics of the development of sports industry, Zhang discussed the application principles of the connotation of green economy theory in the development of sports industry and believed that the development of green sports industry was an inevitable trend [27]. Yang et al. believed that the sports industry belongs to a kind of green industry and happy industry, taking the green economy with resource conservation and environmental friendliness as its important content, naturally having humanistic attributes, which is an economic form that implements the principle of “people-oriented”, and a form of “happy economic” essentially. “Happy economic” guides the development of “happy industry” through macro-means such as mechanism construction and structural adjustment. “Happy industry” improves the pattern of “happy economy” through micro-means such as perfect format and high product quality, so that green economy and sports industry complement each other [2]. To sum up, previous research literature indicates that sports industry is an environmentally friendly industry, and sports industry agglomeration is conducive to promoting green economic development.
Based on the above analysis and referring to the empirical research results of the various industries in the existing literature on economic growth and the impact of industrial agglomeration on green economic growth, this paper tries to analyze the current situation of China’s sports industry aggregation by using exploratory spatial data analysis from the perspective of spatial econometrics. This paper uses panel data from 30 provinces and cities in China (not including Hong Kong, Macao, Taiwan and Tibet) from 2008 to 2017 to empirically analyze the relationship between the concentration of sports industry and green economic growth, so as to explore the impact of sports industry agglomeration on green economic growth and the differences between different regions.

2. Variable Selection and Research Methods

2.1. Variable Selection

2.1.1. Dependent Variable (Explained Variable)

Green economy, measured by green gross domestic product (GGDP), was selected as the dependent variable in this paper. As early as 2004, China’s National Bureau of Statistics and the former State Environmental Protection Administration jointly conducted green GDP accounting work, and released the “China Green National Economic Accounting Research Report 2004.” With the development of China’s extensive growth model, environmental pollution, unreasonable use of resources and other problems are increasingly serious. Green GDP accounting resumed in 2015 and piloted in some provinces and cities. Referring to the 2004 China Green Economic Accounting Report and the Environmental and Economic Accounting System (SEEA) of the United Nations, the calculation formula for green GDP, following the principles of data availability and scientificity, the calculation formula for green GDP in this study is as follows:
Green GDP = GDP − Cost of resource depletion − Cost of environmental pollution loss
In Equation (1), the cost of resource depletion includes water consumption cost and energy consumption cost (coal, crude oil, natural gas and other fossil energy), and the indicator data are released from the CEIC and Support System for China Statistics Application. Water consumption cost equals total water use times water price. The price of water resources is the price of tap water in the capital cities; energy consumption cost equals total energy consumption times unit international price, in which coal is chosen by the price of coal in northwest Europe, crude oil is the spot price of Brent oil for the current period, natural gas is the spot price of Henry Hub natural gas. The cost of environmental pollution loss is mainly accounted for from four aspects, such as waste gas, wastewater, general industrial solid waste, garbage and so on. The cost of environmental pollution loss equals the price of waste emission times unit processing price. Taking into account the differences in the level of pollution of various wastes in reality, the differences in the treatment technology of pollutants by enterprises and so on, it is difficult to determine the reasonable disposal price of various kinds of waste. Therefore, with reference to the existing literature [28], the average unit processing price in the “three wastes” of “China Green National Economic Accounting Research Report 2004” is adopted for the calculation of the cost of environmental pollution losses.

2.1.2. Independent Variable (Explanatory Variable)

Sports industry agglomeration, measured by industrial weight index (CI), was selected as the independent variable. The measurement of the current industrial agglomeration is in the mature stage, so different measurement methods can be chosen for the characteristics of industrial agglomeration, data scale, etc. At this stage, the overall scale of China’s sports industry is smaller than other industries and regional differences are larger. For the sake of avoiding regions with low value added in the sports industry and to get a large concentration value, taking into account the characteristics of the difficulty of obtaining data in the sports industry, with reference to Yao, Zhou and other research methods on the concentration of sports industry [18,29], the industrial weight index (CI index) is adopted to calculate the concentration of sports industry in various provinces and cities. A larger CI index value indicates a, higher concentration of sports industry.
C I i t = X i t / i X i t
In Equation (2), X i t is the value added of the sports industry for the t-year of the i region, and i X i t is the total value added of the national sports industry in the t-year.

2.1.3. Controlled Variable

In this paper, the indicator data are published by the China Statistical Yearbook and the provincial and municipal statistical yearbook. Economic development can provide the foundation for high-tech research and development, environmental governance, etc. See Table 1 for details, The regional GDP per capita is adopted to measure the level of economic development (Eco). According to the new growth theory, the spillover effect of human capital will contribute to economic growth. The proportion of the number of people in primary, middle, middle and upper secondary education (middle school), college and above in each province and city is multiplied by 6, 9, 12 and 16 respectively, calculating the number of years of education per capita, and using it to measure the level of human capital (Hr). Some studies point out that cities have technological advantages and scale effects in improving the level of environmental pollution control and resource utilization, which is conducive to promoting the growth of green economy [17]. In this paper, the proportion of urban population to the total population is selected to measure the level of urbanization (Urb).
As the inflow of FDI may produce corresponding technology diffusion effects [30] and pollution transfer [31], the paper adopts the ratio of FDI to GDP after the current exchange rate conversion to measure the level of foreign investment (Fdi). The level of scientific and technological innovation also has a significant role in the upgrading of production technology and economic growth, so the number of patents granted per capita in the region is adopted as the measure of the level of regional science and technology innovation (Inn); The appropriate intervention of the government has the effect of regulating the allocation of resources and preventing the failure of the market’s own regulation, such as monopoly and information asymmetry. In this paper, the ratio of local fiscal expenditure to GDP is used to measure the degree of government intervention (Gov). According to the research, the adjustment of industrial structure has a positive effect on green economic growth [32]. The paper adopts the industrial structure level coefficient put forward by Jing [33] to measure the level of industrial structure upgrading (Upgrade), which is recognized by scholars and widely used in the measurement of industrial structure upgrades [34]. The industrial structure coefficient calculation formula is: Upgrade = i = 1 3 q i i , in which q i is the proportion of the output value of the i industry.

2.2. Research Methods

For the sake of revealing the spatial correlation status of the concentration of sports industry in various provinces and cities, this paper uses the method of exploratory spatial data analysis (ESDA) and uses GeoDa software for quantitative research. The ESDA method makes up for the defect of classical statistics that ignore geospatial orientation, adopting a series of spatial data analysis methods and techniques, taking spatial correlation measurement as the core and finding the distribution characteristics and laws of a certain attribute from a geospatial perspective [35]. This research adopts the Global Moran’s I index to detect the spatial correlation pattern of China’s overall sports industry agglomeration. Through the analysis of the full-scale spatial correlation features, for the sake of further finding out the spatial association characteristics of the local area, excavating the spatial self-correlation locations that may be concealed, this research measures the spatial difference degree and significance between an area and adjacent area by using the Local Moran’s I index [36].
The calculation formula for the Global Moran’s I index is as follows:
I = i = 1 n j 1 n W i j ( x i x ¯ ) ( x j x ¯ ) S 2 j = 1 n j = 1 n W i j
In Equation (3), n represents the total number of areas in the research, W i j is the spatial weight (setting W i j by whether province i and province j are adjacent to each other: when i and j are adjacent, W i j = 1 ; when i and j are not adjacent, W i j = 0 ); x i and x j represent the observed values of provincial I and y, respectively. x ¯ is the average value of x i . S 2 represents the variance of x i . The value range of Moran’s I index is [−1, 1], and when the value is greater than 0, it indicates that there is a spatial positive correlation; When it is less than 0, it indicates that there is a spatial negative correlation; The closer the value is to 0, the lower the spatial association it indicates, or a random distribution [36].
The calculation formula for the Local Moran’s I index is as follows:
I = ( x i x ¯ ) S 2 j W i j ( x j x ¯ )
In Equation (4), x i presents the sports industry agglomeration of various provinces and cities, W is a spatial weight matrix, W i j represents the geographical relationship between the provinces and cities and other regions. If the two regions are adjacent, the value of W i j is 1, otherwise the value of W i j is 0. When the value of I i is positive, it indicates that the province’s sport industry agglomeration is similar to the adjacent provinces (“high–high” or “low–low”); when the value of I i is negative, it indicates that the province’s sport industry agglomeration is not similar to the adjacent provinces.

3. Spatial Econometric Analysis of China’s Sports Industry Agglomeration

3.1. Analysis of the Current Situation of China’s Sports Industry Agglomeration

Under the guidance and support of macro-policy, China’s sports industry shows a trend of rapid development, setting up sports industrial parks in Shanghai, Beijing, Guangdong and other economically more developed regions, which promotes the agglomeration of sports industry. However, due to the vast land of China, different provinces and cities have obvious differences in the aspects of social and economic condition, resulting in the unbalanced development of the sports industry in various provinces and cities, so that there is an unbalanced sport industry agglomeration. For exploring the regional differences between the agglomeration of sports industry in various provinces and cities, this study draws on the research methods of Wei et al. [37], taking the agglomeration of sports industry in 2008 and the average annual growth rate of sports industry agglomeration in the provinces and cities in 2008–2017 as the basic index. According to its coupling relationship, we divides the spatial type of sports industry in each province and city. Compared the provincial and municipal sports industry agglomeration with the average of the national sports industry concentration in the country in 2008, if the sports industry agglomeration in 2008 is higher than the national average, the basis is good. If the industry agglomeration is lower than the national average, the basis is poor. Compared with the average annual growth rate of sports industry in each province from 2008 to 2017, if the annual average growth rate is higher than the national average, it is a fast development type, otherwise, it is a slow development type. Based on the coupling relationship between the sports industry agglomeration and the average annual growth rate, this research adopts GIS spatial analysis method to divide the change of sports industry agglomeration into four spatial types: good foundation–rapid development type; good foundation–slow development type; poor foundation–rapid development type; poor foundation–slow development type (for specific classification, see Figure 1).
As it can be seen from Figure 1, the provinces and cities with good agglomeration of China’s sports industry are mainly concentrated in the southeast coastal areas (Shandong, Jiangsu, Shanghai, Zhejiang, Fujian, Guangdong) and Beijing, where Jiangsu, Fujian and Shanghai still maintain an active development trend on the original basis, belonging to the provinces of good foundation–rapid development type. Jiangsu is the first province in China to propose the construction of a strong province of sports, and is also the first province in China to innovate and develop a new carrier for the development of sports industry, such as sports-characteristic town, sports service complex and sports industry base, etc. Jiangsu has named 100 provincial sports industry bases successively, among which seven national sports industry demonstration bases have created a total value added to the sports industry of 25,677 billion yuan in 2017, taking a prominent role in promoting the industrialization of sports in Jiangsu Province.
As the core area of the Maritime Silk Road, the China (Fujian) Free Trade Pilot Zone, the country’s first ecological civilization demonstration zone, the national independent innovation demonstration zone, etc., Fujian Province’s sports industry ushered in a historic and significant opportunity for development under the promotion of the national strategic deployment. “Fujian Province Sports Industry Development” 13th Five-Year Plan put forward the following mandate: Vigorously guide and support the industrial agglomeration and development, support Fuzhou, Quanzhou and Yantian to create a national demonstration base for intelligent manufacturing of sporting goods, cultivate a batch of productive service enterprises and industrial clusters with strong accumulation of radiation capacity, and enhance the value added of the sports industry in Fujian Province from 3.5% in 2010 to 4.1% in 2018, the proportion of the value reaching the level of the middle developed countries.
Unlike Fujian’s prominent sporting goods manufacturing cluster, Shanghai’s good business environment has increased its support for the sports industry, attracting more and more sports enterprises to invest in development, actively expanding the development of “sports and tourism” and other industries based on the favorable conditions of the international sports capital. In 2017, Shanghai sports service industry accounted for 65% of the sports industry, forming a sports industry structure with service industry as the main body. Therefore, the rich experience and achievements of Jiangsu, Fujian and Shanghai in deepening the reform of public sports service system and the construction of sports industrialization are significant reasons for maintaining their high agglomeration and sustainable development of the sports industry in the new era.
In addition to Fujian, Jiangsu and Shanghai, 13 provinces and cities including some along the Yangtze River Economic Belt with poor foundation in the past (Hubei, Hunan, Jiangxi, Chongqing, Guizhou, Sichuan, Yunnan) and Hebei, Henan, Shaanxi, Tianjin, Guangxi and Hainan, also showed a rapid development trend. The Yangtze River Economic Belt is one of the regions with the strongest comprehensive strength and the largest strategic support role in China. In 2014, the State Council’s Guidance on Promoting the Development of the Yangtze River Economic Belt by Relying on the Golden Waterway put forward: We should build the Yangtze River Economic Belt into an inland river economic belt with global influence, a demonstration zone of ecological civilization, a coordinated development zone of East–West interaction and cooperation, and an all-round open belt to the interior and the outside world, so as to build a green energy industry belt and cultivate world-class industrial clusters, etc. As an environmentally friendly, resource-saving, hugely influential, highly relevant green industry, the development of sports industry agglomeration in the Yangtze River economic belt is conducive to promote the construction of an ecologically secure, sustainable development system [38].
At the same time, on the basis of the important law of world economic development, “the coastal area starts first, and the inland river develops along the gradient of the depth and depth of the hinterland”, with the Yangtze River Delta region’s (Jiangsu, Shanghai, Zhejiang) strong radiation role in sports industry cluster, the Yangtze River economic belt of the sports industry has begun to take shape in recent years. In the region, the market value of listed companies in the sports industry has reached 70 billion yuan, such as Jiang Shuntian, Lansheng shares, Shuangxiang shares and Zhejiang Newspaper Media, etc. Under the influence of policy and market environment, the Yangtze River Economic Belt has formed more mature industrial clusters, such as sports services and sporting goods, promoting the rapid development of sports industry agglomeration. With marine fisheries, coastal tourism and other marine industries as the economic pillar, Hainan province has created a great number of sports and leisure towns in recent years, such as Wanning Surf Town and Wuzhizhou Island Marine Sports Tourism Style Town, which are typical representatives of the sports tourism gathering area, vigorously promoting the development of tourist agglomeration of competition in Hainan province.
Through observing the spatial distribution of the rapid-development-type and slow-development-type provinces and cities in Figure 1, it can be found that there are spatially connected characteristics between the same type of development, better connectivity with other provinces of the same type, and that the market characteristics of provinces and cities are very obvious, indicating that there may be spatial spillover effects in the development of the sports industry agglomeration in China.

3.2. Exploratory Spatial Data Analysis (ESDA) of Sports Industry Agglomeration

3.2.1. Global Spatial Autocorrelation Analysis

By using GeoDa software, this research conducted a spatial autocorrelation analysis for the sports industry agglomeration data of 30 provinces and cities in China from 2008 to 2017, and obtained the Global Moran’s I Index for each year (Figure 2), including Global Moran’s I index values of 2008, 2009 and 2010, which passed the 5% significance test; the Global Moran’s I value passed the 10% level of significance test in 2011; and the Global Moran’s I value passed the 1% level of significance test in 2012 to 2017.
As shown in Figure 2, Global Moran’s I values of 2008 to 2017 are positive, the overall growth trend shows that the development of sports industry concentration has obvious positive spatial aggregation characteristics, that is, provinces with good development of sports industry agglomeration are adjacent to provinces with good development, while provinces with poor development of sports industry agglomeration are adjacent to provinces with poor development, indicating that sports industry agglomeration has a strong spatial spillover effect. It is worth noting that the Global Moran’s I value of 2012 shows a high growth rate compared with 2011 and increases year by year. The reason for this is that General Office of the State Council promulgated the Guidance on Accelerating the Development of the Sports Industry in 2010, and the State Administration of Sports issued the “12th Five-Year Plan” for the Sports Industry and the 12th Five-Year Plan for the Development of Sports in 2011; China began to put forward some requirements for accelerating the development of the sports industry at the government level. When the policy document is issued, it needs to be implemented through practice for some time so that “quantity change” can trigger “quality change”, that is, the actual effect lags behind the policy document. Therefore, with the release of relevant policy documents in 2010 and 2011, China’s sports industry has shown a stronger momentum of development since 2012.

3.2.2. Local Spatial Autocorrelation Analysis

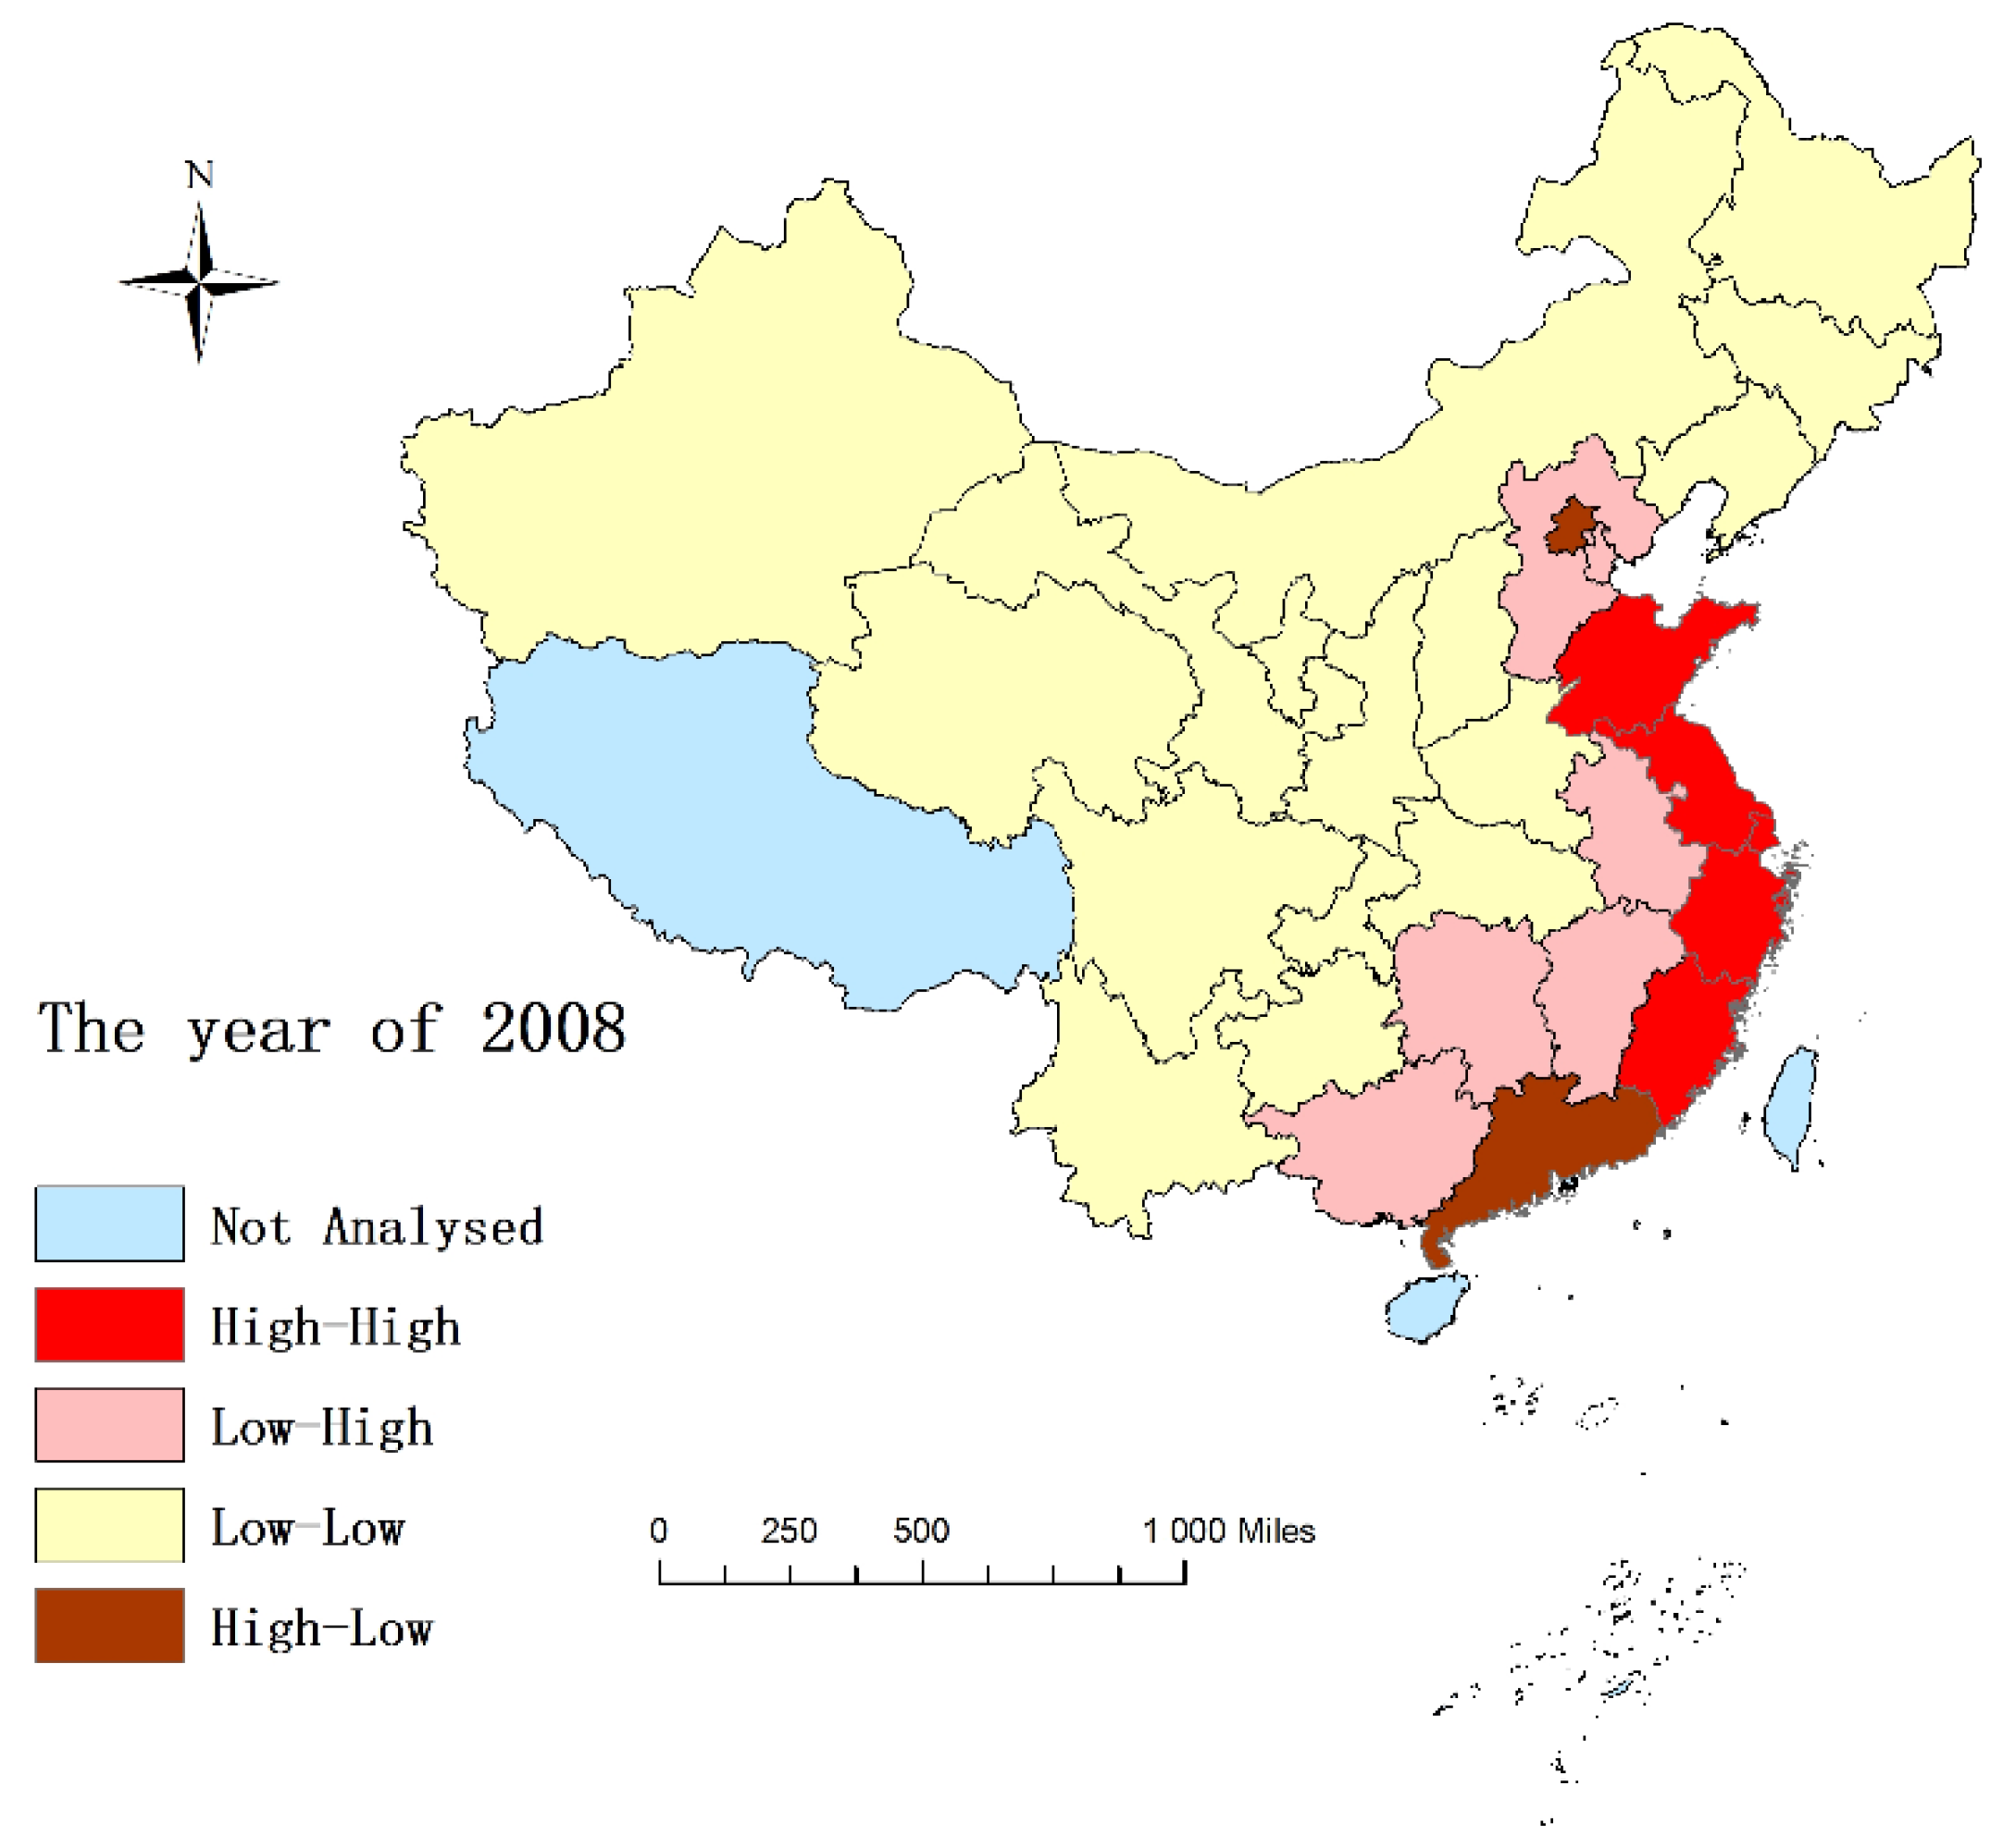
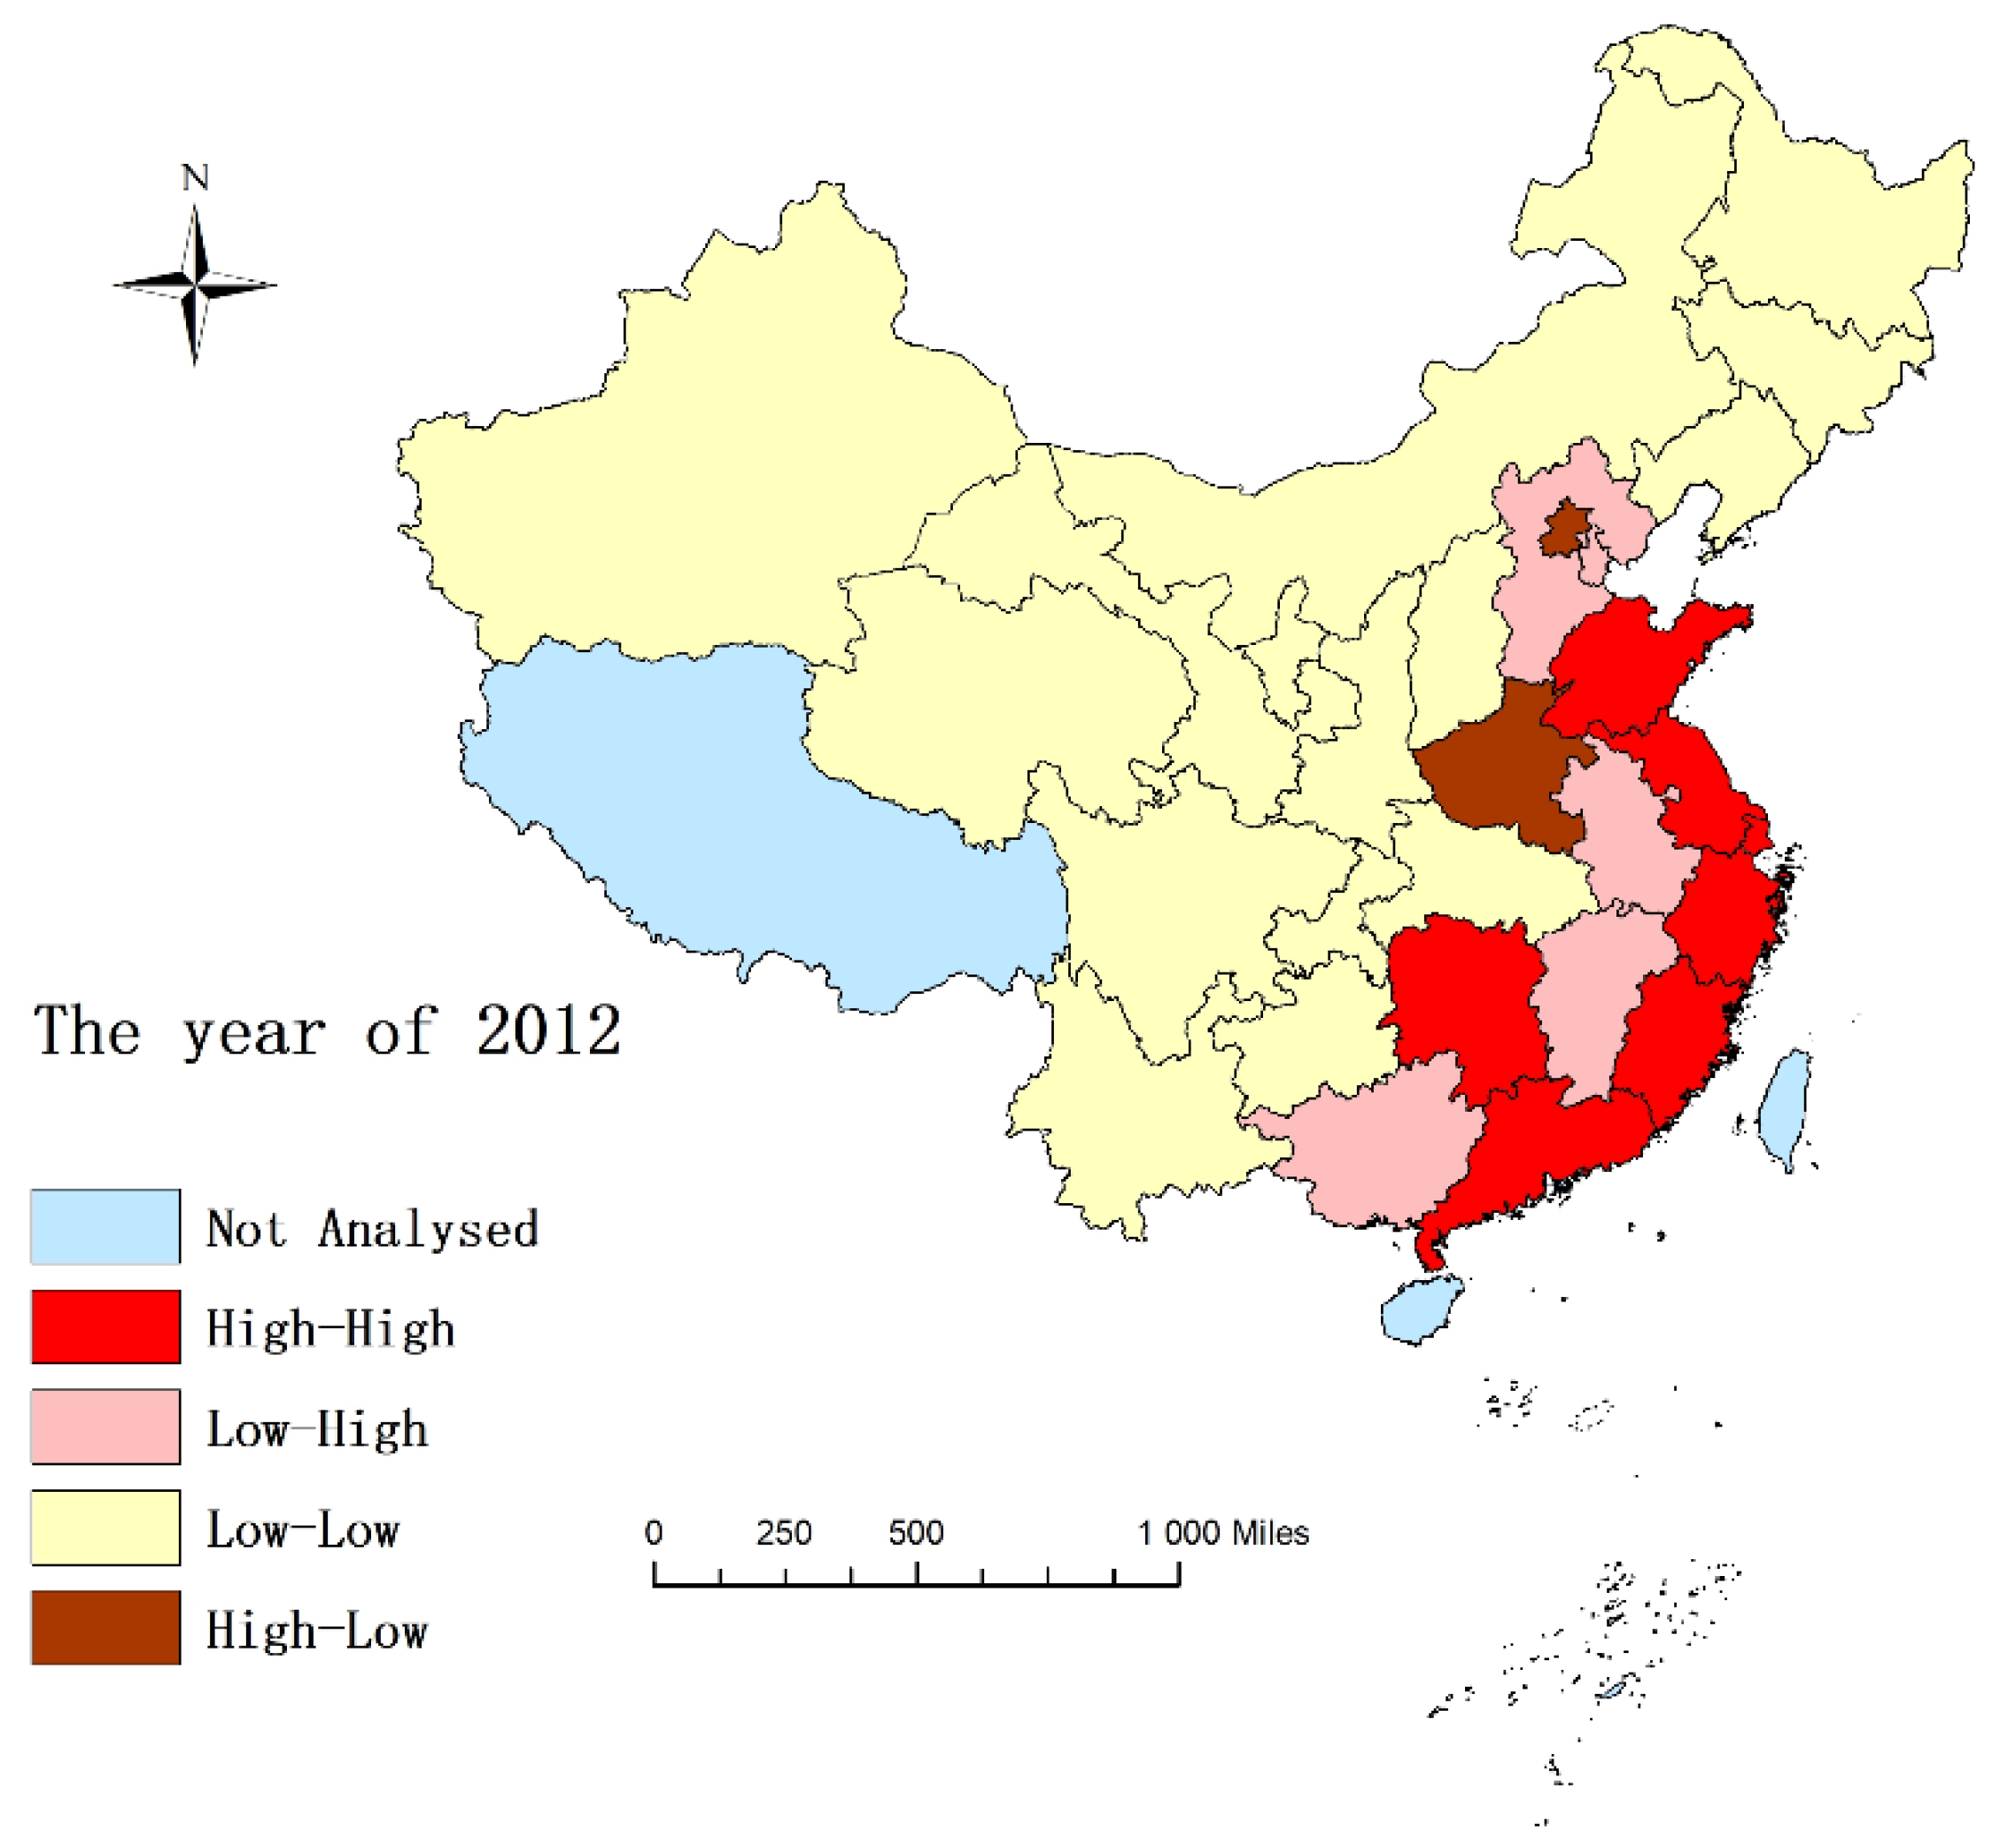
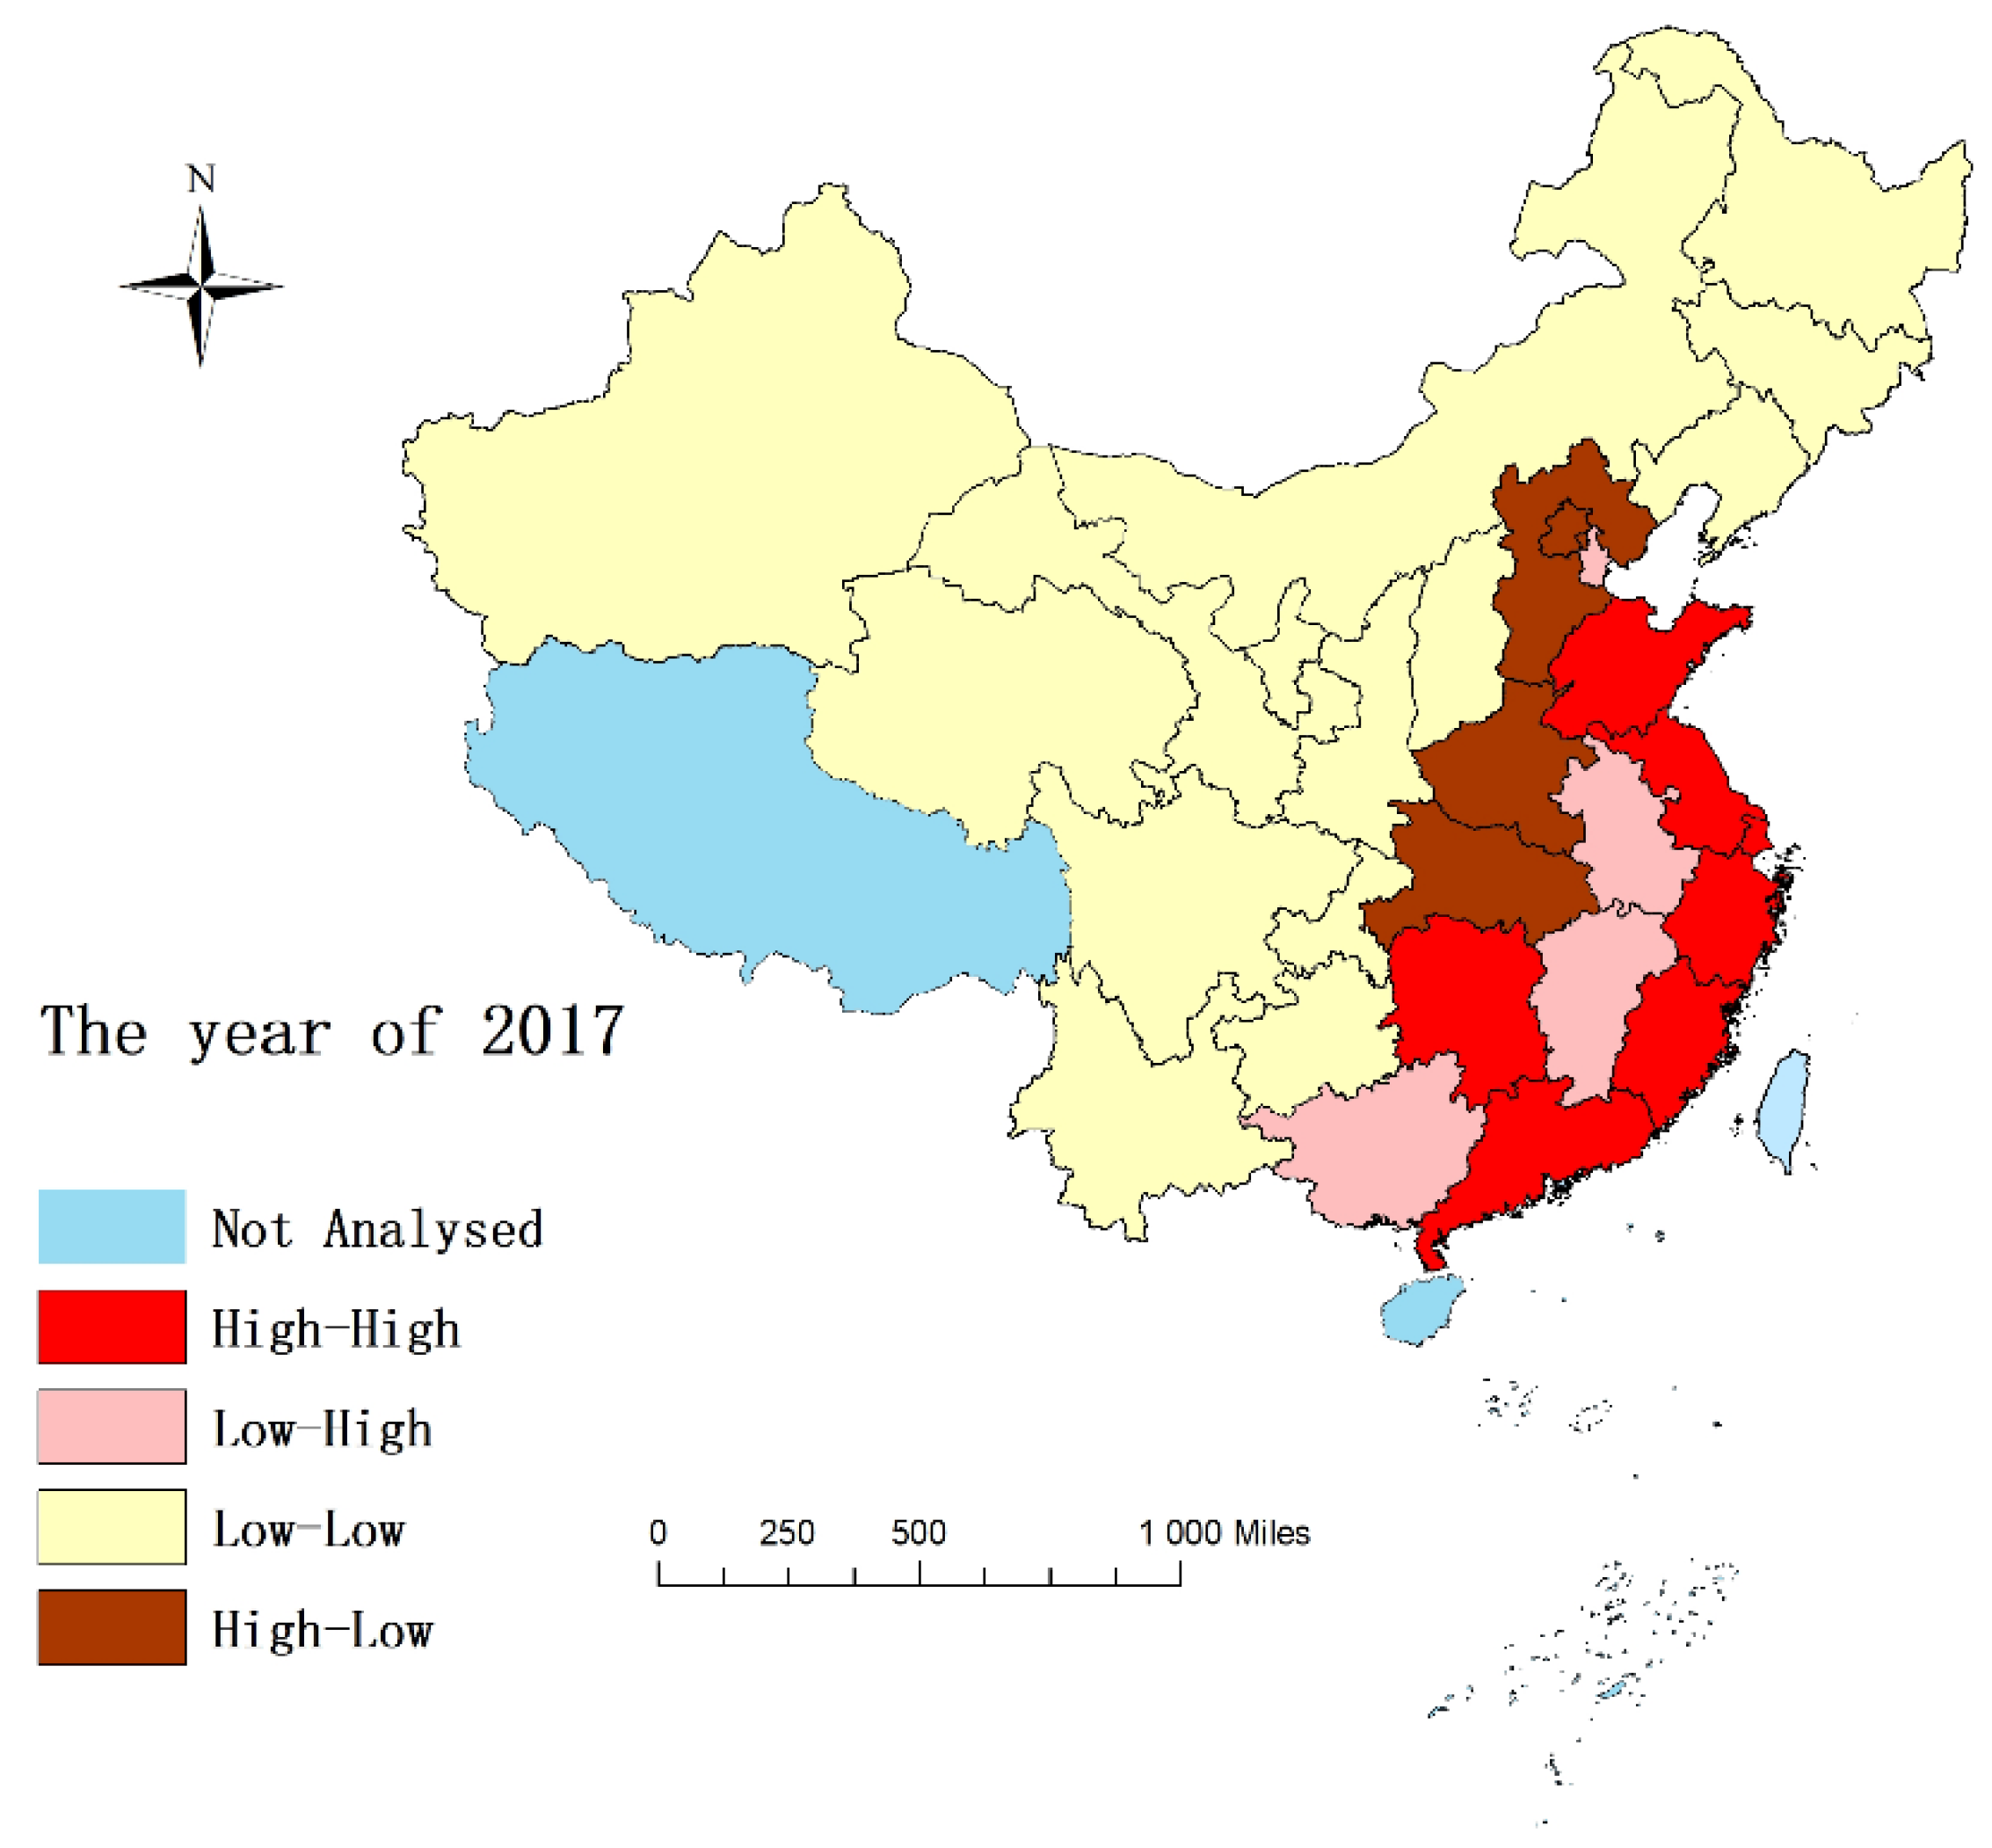
From the above analysis (Figure 2), 2012 is the first year that shows a strong development momentum of sports industry agglomeration in the research period. For further exploring the development of sports industry agglomeration in local space, the research selected the sports industry agglomeration of 2008, 2012 and 2017 as representative, thus revealing the spatial evolution of regional differences in the sports industries’ agglomeration in various provinces and cities during the period of research.
Combined with Figure 3, Figure 4 and Figure 5 and Table 2, it can be seen intuitively that the evolution of the development of China’s sports industry has an obvious pattern of spatial differences, with the main changes detailed as follows: The provinces of the “high–high” quadrant are mainly concentrated along the southeastern coast. After Guangdong and Hunan provinces joined the quadrant in 2012, it shows a stable pattern within the quadrant. The provinces in “low–high” and “low–low” quadrants are affected by the radiation effects of the neighbors in “high–high” and “high–low” quadrants, improving the development, and the number of provinces in the quadrant is gradually reduced. For example, as the transition zone of the eastern coastal region and the central and western regions, and the junction of the Yangtze River Open Economic Zone and the Coastal Development Economic Zone, Hunan has a special location advantage, located in the important geographical location of the world economic development law that “the coastal area starts first, and the inland river develops along the gradient of the depth and depth of the hinterland”. Under the influence of the concentrated radiation effect of coastal sports industry such as Guangdong, Hunan changes from “low–high” quadrant to “high–high” quadrant, resulting in Guangdong also changing from “high–low” quadrant to “high–high” quadrant.

4. Empirical Analysis of the Impact of Sports Industry Agglomeration on Green Economy

4.1. Model Construction

In measuring the interaction between sports industry agglomeration and green economy, in order to eliminate the different effects of the indicator stages and units, first the variables are standardized, natural logarithm transformation is adopted, and the basic measurement model is set up.
L n G g d p i t = β i t + β 2 L n C I i t + β 3 L n E C O i t + β 4 L n U p g r a d e i t + β 5 L n H R i t + β 6 L n U R B i t + β 7 L n F D I i t + β 8 L n I N N i t + β 9 L n G O V i t + ε i t
In order to reflect whether there is a nonlinear relationship between the impact of sports industry agglomeration on green economy growth, based on Equation (5), C I i t 2 is introduced; the model is as follows.
L n G g d p i t = β i t + β 2 L n C I i t + β 3 L n C I i t 2 + β 4 L n E C O i t + β 5 L n U p g r a d e i t + β 6 L n H R i t + β 7 L n U R B i t + β 8 L n F D I i t + β 9 L n I N N i t + β 10 L n G O V i t + μ i t
In Equation (6), i is the province, t is the year, β i t is the regional individual effects and ε i t is a random interference term. Panel data regression analysis is carried out in order to avoid the phenomenon of “spurious regression”, using Levin-Lin-Chu (LLC) and Im-Pesearn-Shin (IPS) test methods to carry out the scope root test of variables. According to the results, all variables are characterized by first-order stability, with the same smoothness, which can be used to conduct the regression analysis.

4.2. Empirical Analysis of Static Panel Models

Before analyzing, the regression method of panel data needs to be determined. As can be seen from Table 3, the F value is 76.95 and is significant at the 1% level, indicating that a fixed effect model in a hybrid OLS model and a fixed model shall be chosen. In the Hausman test, the results are remarkable. Therefore, the original hypothesis of random effect should be rejected and the fixed effect model should be chosen as the final explanation.

4.2.1. Linear Relational Regression Analysis

From the results of the regression analysis of the fixed effect model, it can be seen that the regression coefficient of the concentration of sports industry is 1.0532, and passes the 10% statistical level significance test, indicating that the impact of sports industry agglomeration has a significant, positive influence on green economic growth.
Through further analysis of the regression coefficient of control variables, it was found that the improvement of economic development (LnEco), industrial structure upgrading (LnUpgrade) and regional innovation (LnInn) all promote the growth of the green economy. Based on the value of the regression coefficient, the coefficient of industrial structure upgrading is highest, which shows that upgrading industrial structures had the most obvious influence on green economic growth in this period. The so-called industrial structure upgrading is the process or trend of the transformation of industrial structure from low-level form to high-level form, and the national economic center upgrade from the primary industry to the secondary industry, and then to the tertiary industry. In the process of industrialization, China blindly pursues economic benefits, lacking core green innovation technology, which leads to increased environmental costs, so that it is confronted with pressure of transforming the green economy [39]. According to the research, in addition to political, economic, social, cultural and other factors that can have an impact on green economic growth, the transformation and upgrading of industry is also conducive to improving production technology, effectively cutting down the pollutant emissions, and therefore has a decisive role in green economic development [40].
The regression coefficient of foreign investment level (LnFdi) is −0.0488 and passes the 10% statistical level significance test, which is in agreement with the existing research results. The main reason is that China is usually at the lower end of the industrial chain in the process of introducing foreign investment, with low value-added, low-tech and high non-expected output, while there may be cases where investors transfer polluting production to other countries by way of outward investment, resulting in “polluted paradise” [19]. Therefore, the improvement of the level of foreign investment will have a dampening effect on green economic growth.
The regression coefficients of urbanization level (LnUrb), human capital (LnHr) and government intervention level (LnGov) are positive, but not significant. In terms of human capital, high-quality talents are mainly concentrated in the core cities, while small and medium-sized cities are mainly home to low-tech workers, resulting in a large regional gap in the level of human capital, which does not have significant influence on the development of green economy [41]. In terms of urbanization level, there are different views on the impact of urbanization level on green economic growth. Some scholars believe that the improvement of urbanization level can promote the per capita utilization rate of public social resources, which is conducive to give full play to the agglomeration advantages of urban production factors so as to realize the intensive utilization of social resources [17]. However, some scholars believe that the improvement of urbanization level can improve people’s quality of life and urban ecology, as well as strengthen public awareness of environmental protection, but the construction of cities and urban life is also extremely destructive to the ecological environment. In addition, there are still problems that need to be solved in the current urbanization process [42]. Therefore, if the existing problems in the current urbanization process can be improved, it will significantly enhance its impact on green economic growth. In terms of the degree of government intervention, some pollution has a strong spatial spillover, resulting in the loss of environmental expenditure income in various regions [43]. However, fiscal expenditure has a certain lag, such that it cannot play an immediate effect [44]. Moreover, there are problems in China’s fiscal expenditure policy for promoting green development, such as lack of overall planning, uneven urban and rural input, unscientific financial subsidies, and over-reliance on financial resources for ecological construction and environmental protection. The above points inhibit the impact of government intervention on green economic growth to a large extent.

4.2.2. Nonlinear Relationship Analysis

For the sake of exploring whether there is a non-linear relationship between the sports industry’s agglomeration and green economic growth, this research adds the square item of the concentration of sports industry in the overall sample for regression analysis. According to the F-test and Hausman test results in Table 4, it is clear that the regression results of fixed effect should be selected as the basis for interpretation. According to the regression results of the fixed effect, it can be seen that the CI2 coefficient is −25.1976, and passes the 1% statistical level significance test, which indicates that there is a clear nonlinear relationship between the agglomeration of China’s sports industry and green economic growth, showing the “inverted U-type” relationship. The result is consistent with the “marginal benefit decline effect” in economics, that is, when the scale of the enterprise gradually increases, the economic benefits are increased, but the economic benefits are reduced after the large increase to a certain extent.
Lin et al. believed that when the size of economic aggregation is reasonable, it is conducive to the effect of agglomeration, making a positive impact on the green economy [45]. When the economic concentration is greater than the critical value, it will produce a “congestion effect”, bringing pressure and challenging the local economy and the carrying capacity of natural resources, resulting in the decrease in labor productivity of enterprises, the increase in pollutant emissions, decrease in resource utilization, etc., which are not conducive to the development of green economy. The CI coefficient is 2.0328, and passes the 1% statistical level significance test, indicating that the current increase in the concentration of sports industry has a positive and significant effect on green economic growth. However, it is still necessary to note that the sports industry should pay more attention to the protection of resources and the environment in the development process at the present stage; it should pay attention to the innovation and development of enterprises, and should not blindly increase as far as possible to reduce the “marginal benefit reduction effect” of the impact of industrial development.
After adding the nonlinear explanatory variables CI2, economic development (LnEco), industrial structure upgrading (LnUpgrade), regional innovation (LnInn) and foreign investment level (LnFdi), the regression coefficient and the significance level are similar to the linear model regression results. The regression coefficients of human capital (LnHr), urbanization level (LnUrb) and government intervention (LnGov) are all higher than that of linear model, and both pass the significance test.

4.2.3. Regional Difference Analysis

For exploring whether there are differences between regions, this study analyzes regression for each region and uses the fixed effect model as the final explanation basis for different regions. From the regression results in Table 5, it can be seen that the regression coefficient in the middle is the largest at 2.0146 and passes the 5% statistical level significance test. The second, in the east, is 1.5093 and passes the 10% statistical level significance test; the western coefficient is the smallest, 0.5171, which is not significant. From this, it can be concluded that there are regional differences in the influence of sports industry agglomeration on green economic growth. The concrete performance shows that the central has biggest influence, the eastern is the second, the western has smallest influence, all of which take a positive role in promoting.
In the analysis of the current situation of the development of sports industry concentration in the past, it can be seen that the provinces with rapid agglomeration and development of the sports industry are mainly concentrated in the Yangtze River Economic Belt, Shaanxi, Henan and other provinces. The sports industry in central China has a strong momentum of concentrated development, which has increasingly contributed to green economic growth. Influenced by the weak foundation of sports industry development and the significant development gap between provinces, there is a lot of room for improvement in the agglomeration of sports industry in the western region, and the impact of the current agglomeration level on green economic growth has not yet been significantly demonstrated.
Most of the provinces with a better base of sports industry are concentrated in the eastern coastal areas. Influenced by the relevant advantageous conditions, the development of sports industry in the southeast coastal area has formed a circular accumulation process, thus the ability of the sports industry agglomeration has also been continuously improved. Based on the sports industry agglomeration effect on green economic growth, there is an “inverted U-type” of promotion. With the improvements of sports industry concentration in the eastern region, there may be a decrease in the contribution to green economic growth. Therefore, drawing on the “cumulative causation model” put forward by economist Myrdal, the development of sports industry in the eastern region should give full play to the “spread effect” to export talents and technologies to the western region. At the same time, the government should reasonably avoid the “backwash effect” to prevent polarization and strengthen support for the western region. In addition, it can be seen from the regression coefficients of control variables that the upgrading of industrial structure and the upgrading of regional innovation levels have a greater impact on green economic growth in the eastern region than in the central and western regions, indicating the importance of industrial structure adjustment and enterprise innovation to the healthy development of the industry in the eastern region.

4.3. Dynamic Panel Regression Analysis

For testing the robustness of the model, the research adopts dynamic panel to deal with the data. Considering that weak tool variables tend to have an impact on Generalzed method of moments (GMM), the system GMM will have a good stability, which is a combination of horizontal regression equation and differential regression equation. Therefore, this paper selects the system GMM for estimation, and Table 6 shows the system GMM estimation results of the two models. According to the system GMM results of the two models, the first-order sequence correlation AR (1) is significant, but the second-order sequence correlation AR (2) test and Sargan over-recognition test are not significant, indicating that the model has first-order autocorrelation and that there is no second-order self-correlation. The hypothesis that the error items in the horizontal equation have sequence correlation should be rejected; the hypothesis of the validity of the instrumental variables should be accepted, and there is no problem of over-recognition.
In Table 6, Model 1 is added to the item of the sports industry agglomeration, which reflects the linear relationship between the sports industry agglomeration and green economic growth in dynamic panel. In the regression result of model 1, the regression coefficient of the sports industry agglomeration is 2.1451, with significance at the 5% statistical level, indicating that the regression estimation results of dynamic panel data are consistent with the results of static panel analysis, that is, the sports industry agglomeration has a positive effect on green economic growth. Moreover, the GGDP that lags in the first phase has a significant positive impact on the current green economy growth, with a regression coefficient of 0.2809, i.e., GGDP in the previous period has a significant effect on green economic growth. In the control variables, because the introduction of GGDP lag one-stage variable L.lnggdp constitutes a dynamic model, the coefficients of human capital (LnHr), urbanization level (LnUrb) and government intervention (LnGov) are changed from positive to positive in the static panel model. The reason may be that taking into account the inertia of green economic growth enhances the effect of three variables on green economic growth at a certain level.
Model 2 adds CI2 on the basis of Model 1, indicating the non-linear relationship between the sports industry agglomeration and green economic growth in the dynamic panel model. As the CI2 coefficient is −16.7620, and passes the 5% statistical level of significance test, it shows that the dynamic panel data regression estimation results are consistent with the static panel analysis results, and there is the “inverted U-type” influence of sports industry agglomeration on green economic growth. The GGDP that lags in the first phase still shows a significantly positive impact, with the regression coefficient of 0.2775, indicating that the GGDP that lags in the first phase also contributes to the growth of the green economy in the current period.
In the sub-regional study of dynamic model, the regression coefficient of the three regional CI is basically the same as that of the static panel, with significant differences, which are the highest in the middle, the second in the east and the lowest in the west. The different regions’ GGDP that lag in the first phase have a significantly positive impact on the green economic growth in the current period, with the greatest influence in the middle, the second in the east and the lowest in the west.

5. Conclusions and Discussion

As a significant component of China’s contemporary five major development concepts, focusing on green economic growth is the fundamental requirement to achieve “green development”. As one of the five most happy industries in China, sports industry has obvious advantages in energy conservation and efficiency, promoting the upgrading and transformation of industrial structure, which is an important dynamic for green development [38,46]. Based on the panel data of 30 provinces and cities in China from 2008 to 2017, this paper analyzes the current situation of the development of sports industry and its impact on green economic growth. The results show:
  • Most of the provinces with a good foundation for the development of China’s sports industry are concentrated along the southeast coast. Under the strong support and guidance of national policy, the provinces along the Yangtze River Economic Belt with poor sports industry accumulation have shown a relatively fast development trend, resulting in the formation of more mature industrial clusters of sports goods, sports services and others in the Yangtze River Economic Belt.
  • There is the characteristic of positive spatial aggregation in the development of China’s sports industry. Provinces of the same type of development have adjacent characteristics in spatial distribution, with a good inter-provincial connectivity. It is especially after 2012 that the development of sports industry concentration shows a strong space spillover effect.
  • In the spatial separation pattern, the provinces in the “high–high” quadrant gradually increase or decrease and stabilize, the provinces in the “low–low” quadrant gradually decrease and then transfer to the “high–high” and “high–low” quadrants.
  • Static and dynamic panel models show that the sports industry agglomeration has a significant role in promoting green economic growth with an “inverted U-shaped” relationship, that is, when the sports industry agglomeration is suitable, it is conducive to green economic growth. When the agglomeration level exceeds a certain threshold, it is not conducive to green economic growth. Meanwhile, there are significant regional differences in the impact of sports industry concentration on green economic growth influenced by the difference in the level of development of the sports industry, which is shown to be the strongest in the central region, second in the east and lowest in the west.
  • Among the control variables, economic development, industrial structure upgrading and regional innovation level significantly promote the growth of green economy, and the eastern region should pay attention to the upgrading and transformation of industrial structure and improve the level of enterprise innovation.
Sports industry agglomeration has a positive impact on green economic growth. For the sake of bettering the role of sports industry agglomeration in promoting green economy growth, the following points should be noted:
  • The development of sports industry in various regions of China is uneven, and the development of sports industry in the western region is dilatory, influenced by the restrictions of economic development level, natural environment and resource endowment. Therefore, the government should conduct overall planning and resource integration, enhancing the policy support for the sports industry in the western region, so as to build a good external environment for the development of the sports industry in the western region.
  • Province-to-province and region-to-region exchange and cooperation should be strengthened, a coordinated development mechanism should be established, and the establishment of strategic cooperation between cross-regional “sports plus” and other industrial groups should be encouraged, while breaking the regional boundaries and realizing the complementary advantages and resource integration optimization of each region. The eastern and central regions should be encouraged to support the western region with technology and talents, promoting the balanced development of the sports industry to achieve a benefit-sharing.
  • Industrial agglomeration of sports industry in the eastern and central regions is higher than that in the western regions. In the future, it will be necessary to correctly play the role of government intervention and market mechanism and to mobilize the enthusiasm of social subjects; the sports industry has shifted from a “high speed” to a “high quality” development model.
  • Economic development, industrial structure upgrading and regional innovation level improvement have a positive effect on the growth of green economy. It shall release the superposition effect of various powers, lay stress on the transformation and upgrading of industries, encourage enterprises to carry out technological innovation, reduce the damage to the ecological environment in the process of promoting urbanization, thus truly achieve the green development. While playing the role of the market mechanism “invisible hand”, it shall strengthen the government’s macro-control, play the role of “tangible hand”, and establish a clear policy orientation, to promote the sustainable development of the green economy.

Author Contributions

Conceptualization, J.X. and R.Y.; Methodology, J.X.; Software, J.X.; Validation, J.X.; Formal Analysis, J.X.; Investigation, J.X.; Resources, J.X.; Data Curation, J.X.; Writing—Original Draft Preparation, J.X.; Writing—Review & Editing, J.X. and R.Y.

Funding

This research was funded by the National Social Science Foundation of China (Grant No. 19ATY006) and Fujian Social Science Planning Project (FJ2019C013).

Acknowledgments

The authors are thankful to the National Social Science Foundation of China for the full support of this research study. The authors appreciate valuable and constructive feedback from the three anonymous reviewers. Special thanks to National Social Science Foundation of China for sponsoring the publication of this paper in the open access journal.

Conflicts of Interest

The authors declare no conflicts of interest.

References

  1. Wang, J.N.; Li, X.L.; Ge, C.Z. Current Situation and Prospect of Green Economy Development in China. Environ. Protect. 2009, 5, 535–536. [Google Scholar]
  2. Yang, F. Research on China’s Sports Industry Fiscal Policy from the Perspective of Green Economy. J. Shenyang Sport Univ. 2019, 3, 54–62. [Google Scholar]
  3. Porter, M.E. The competitive advantage of nations. Harv. Bus. Rev. 1990, 2, 73–93. [Google Scholar]
  4. Wang, Y.; Wang, Y.; Yin, G.W.; Xiao, Q.L. Space-Time Dynamic Changes of Sports Industry’s Spatial Agglomeration from the Perspective of Spatial Association: An Empirical Analysis Based on the ESDA. J. Xi’an Inst. Phys. Educ. 2018, 3, 2812–2888. [Google Scholar]
  5. Dan, Y.F. Essence, Features and Future of Green Sports. J. Wuhan Inst. Phys. Educ. 2013, 5, 323–325. [Google Scholar]
  6. Krugman, P. Increasing Returns and Economic Geography. J. Political Econ. 1991, 3, 4834–4899. [Google Scholar] [CrossRef]
  7. Clancy, P.; Malley, E.; Connell, L.; Van Egcraat, C. Industry Clusters in Ireland: An Application of Porter’s Model of National Competitive Advantage to Three Sectors. Eur. Plan. Stud. 2001, 1, 72–78. [Google Scholar] [CrossRef]
  8. Eliison, G.; Glaeser, E.L. Geographic concentration in U.S. manufacturing industries: A dartboard approach. J. Political Econ. 1994, 5, 889–927. [Google Scholar]
  9. Krugman, P.; Venables, A.J. Globalization and the inequality of nations. Q. J. Econ. 1995, 4, 8478–8480. [Google Scholar]
  10. Baldwin, R.; Martin, P. Agglomeration and regional growth. Handb. Reg. Urban Econ. 2006, 4, 2671–2711. [Google Scholar]
  11. Ottaviano, G.I.P.; Martin, P. Growth and agglomeration. Int. Econ. Rev. 2001, 4, 947–968. [Google Scholar]
  12. Yu, B.B.; Yang, H.X.; Jin, G. Can industrial agglomeration improve regional economic efficiency—Based on the spatial measurement analysis of Chinese urban data. J. Zhongnan Univ. Econ. Law 2015, 3, 1211–1230. [Google Scholar]
  13. Cao, Q.F.; Wang, J.T.; Yang, T. The Effects of Cultural Industrial Agglomeration on Regional Economic Growth Based on the Spatial Econometric Method. J. Xi’an Jiaotong Univ. 2014, 5, 515–517. [Google Scholar]
  14. Ji, Y.J.; Zhou, S.J. The Regional Economic Growth Effect of China’s Financial Industry Agglomeration—Empirical Research Based on Threshold Regression Model. Rev. Ind. Econ. 2015, 2, 43–51. [Google Scholar]
  15. Yu, J.K.; Liu, X.H.; Shan, C.H. Research on the Impact of Marine Industry Agglomeration on Economic Growth: GMM Method Based on Dynamic Panel Data. Dong Yue Trib. 2014, 2, 1401–1443. [Google Scholar]
  16. Zhou, J.W.; Jiang, Z.Y.; Li, F. The Impact of Tourism Industry Agglomeration on the Efficiency of Green Economy: An Empirical Research Based on Provincial Panel Data. Ecol. Econ. 2019, 3, 1221–1228. [Google Scholar]
  17. Hu, A.J.; Guo, A.J.; Zhong, F.L.; Wang, X.B. Can the high-tech industrial agglomeration improve the green economic efficiency of the region. China Popul. Resour. Environ. 2018, 9, 93–101. [Google Scholar]
  18. Yao, S.B.; Liu, Y. An Empirical Analysis of the Impact of Sports Industry Agglomeration on Regional Economic Growth—Based on Static and Dynamic Panel Data Model. China Sport Sci. 2017, 11, 21–29, 39. [Google Scholar]
  19. Ji, Y.H.; Cao, X.G. The Effects of Knowledge Spillovers of Industrial Agglomeration on Regional Economic Disparity—Comparative Study on Manufacturing Industry and Service Industry. Forum Sci. Technol. China 2017, 12, 106–113. [Google Scholar]
  20. Cao, W.B.; Zhang, Y.; Qian, P. The Effect of Innovation-Driven Strategy on Green Economic Development in China-An Empirical Study of Smart Cities. Int. J. Environ. Res. Public Health 2019, 9, 1520. [Google Scholar] [CrossRef]
  21. Zhou, Y.; Jiang, J.J.; Ye, B.; Hou, B. Green spillovers of outward foreign direct investment on home countries: Evidence from China’s province-level data. J. Clean. Product. 2019, 215, 829–844. [Google Scholar] [CrossRef]
  22. Song, X.G.; Zhou, Y.X.; Jia, W. How do Economic Openness and R&D Investment Affect Green Economic Growth? Evidence from China. Resour. Conserv. Recycl. 2019, 146, 405–415. [Google Scholar]
  23. Ren, Y.J.; Wang, C.X. Research on the Spillover Effects of Food Industry Agglomeration on Green Economic Efficiency: Including Tropical Fruit Industry. Arch. Latinoam. Nutr. 2018, 4, 2872–2896. [Google Scholar]
  24. Li, K.F.; Wang, J. Financial Agglomeration, Industrial Structure and Environmental Pollution—Spatial Econometric Analysis Based on China’s Provinces. Ind. Technol. Econ. 2017, 3, 31–32. [Google Scholar]
  25. Xie, T.T.; Liu, J.H. Financial Agglomeration, Industrial Structure Upgrade and Green Economic Growth. Wuhan Financ. Mon. 2019, 2, 515–516. [Google Scholar]
  26. Wang, Z.X.; Zhang, H.Z.; Gong, X.S.; Wang, Y. Logistics Industry Agglomeration, Market Segmentation and Regional Green Economic Efficiency. Econ. Surv. 2018, 5, 87–93. [Google Scholar]
  27. Zhang, N. Green Economy and Development on Western China Sports Industry. J. Chengdu Phys. Educ. Inst. 2001, 6, 373–379. [Google Scholar]
  28. Wang, F.; Li, J.X.; Chen, J.G.; Liu, J.; Wu, C. Population density, energy consumption and the development of green economy-Empirical analysis based on Provincial Panel Data. J. Arid Land Resour. Environ. 2017, 1, 61–62. [Google Scholar]
  29. Zhou, Z.H.; Li, X.Y.; Chen, R.Y. Evaluating the Policy Effect of Regional Sport Industry’s Agglomeration and Growth—New Evidence from the Synthetic Control Methods. Finance Econ. 2018, 7, 1211–1232. [Google Scholar]
  30. Taskin, F.; Zaim, O. The Role of International Trade on Environmental Efficiency: A DEA Approach. Econ. Model. 2001, 1, 11–17. [Google Scholar] [CrossRef]
  31. Zeng, D.Z.; Zhao, L. Pollution Havens and Industrial Agglomeration. J. Environ. Econ. Manag. 2009, 58, 1411–1453. [Google Scholar] [CrossRef]
  32. Koji, S.; Yoshitaka, T.; Kei, G.; Matsuoka, Y. Developing a Long-term Local Society Design Methodology towards a Low-carbon Economy: An Application to Shiga Prefecture in Japan. Energy Policy 2007, 9, 4688–4703. [Google Scholar]
  33. Jing, X.Q. Industrial structure and economy growth—The Analysis of Yangtze River Delta area. J. Nantong Univ. 2005, 3, 454–459. [Google Scholar]
  34. Xia, H.L.; Ye, A.S.; Zhou, X. High-tech Industry Development and Regional Industrial Structure Upgrade: Empirical Research Based on Provincial Panel Data. Sci. Technol. Manag. Res. 2019, 4, 1661–1673. [Google Scholar]
  35. Yang, R.; Chen, W. Spatial Correlation, Influencing Factors and Environmental Supervision on Mechanism Construction of Atmospheric Pollution: An Empirical Study on SO2 Emissions in China. Sustainability 2019, 11, 1742. [Google Scholar] [CrossRef]
  36. Xu, J.F.; Yang, R.Y.; Liu, R.; Ren, W.N. Vitamin Nutritional Status and Spatial Differentiation Characteristics of Chinese National Physical Fitness. Arch. Latinoam. Nutr. 2019, 2, 81–90. [Google Scholar]
  37. Wei, D.X.; Lei, W. Spatial Heterogeneity of Chinese Sports Lottery Sales and Driving Factors based ESDA-GWR. J. Tianjin Univ. Sport. 2013, 4, 304–309. [Google Scholar]
  38. Wu, J.; Hu, Y.H. Reconstruction of the Economic Function of the Sports Industry in the Yangtze River Economic Belt under the “New Normal”. J. Nantong Univ. (Soc. Sci. Ed.) 2015, 4, 17–22. [Google Scholar]
  39. Bei, J.; Gang, L. Green Economic Growth from a Developmental Perspective. China Finance Econ. Rev. 2013, 1, 95–118. [Google Scholar]
  40. Huang, H.; Xu, Q. Study on the Influence of Population Mobility and Industrial Structure Transformation upon Green GDP of Shanghai. China Soft Sci. 2017, 4, 94–108. [Google Scholar]
  41. Xu, N.; Shi, B.Z.; Tang, X.X.; Deng, M. Research on Financial Agglomeration and Green Economy Efficiency Based on Spatial Durbin Model. Resour. Dev. Market. 2018, 10, 1340–1347. [Google Scholar]
  42. Liu, Y.B.; Yuan, H.X.; Wang, Z. Dynamic panel data modeling of the effects of cultural industry clusters on green economic efficiency. Resour. Sci. 2017, 4, 747–755. [Google Scholar]
  43. He, L.D.; Wang, Y.J.; Zhang, X.N. Fiscal Decentralization, Expenditure of Energy Saving and Environmental Protection and Green Development. Rev. Econ. Manag. 2018, 6, 253–255. [Google Scholar]
  44. Ye, C.S.; Hui, L. The Impact of Agricultural Public Financial Expenditure on China’s Agricultural Green Productivity. Wuhan Univ. J. Philos. Soc. Sci. 2016, 3, 48–55. [Google Scholar]
  45. Lin, B.Q.; Tan, R.P. China’s Economic Agglomeration and Green Economic Efficiency. Econ. Res. J. 2019, 2, 119–132. [Google Scholar]
  46. Xu, K.J.; Huang, H.Y.; Lian, T.; Li, G.; Ren, B. Path and Key Issues of High-quality Development of Sports Industry in China. J. Shanghai Univ. Sport 2019, 4, 293–297. [Google Scholar]
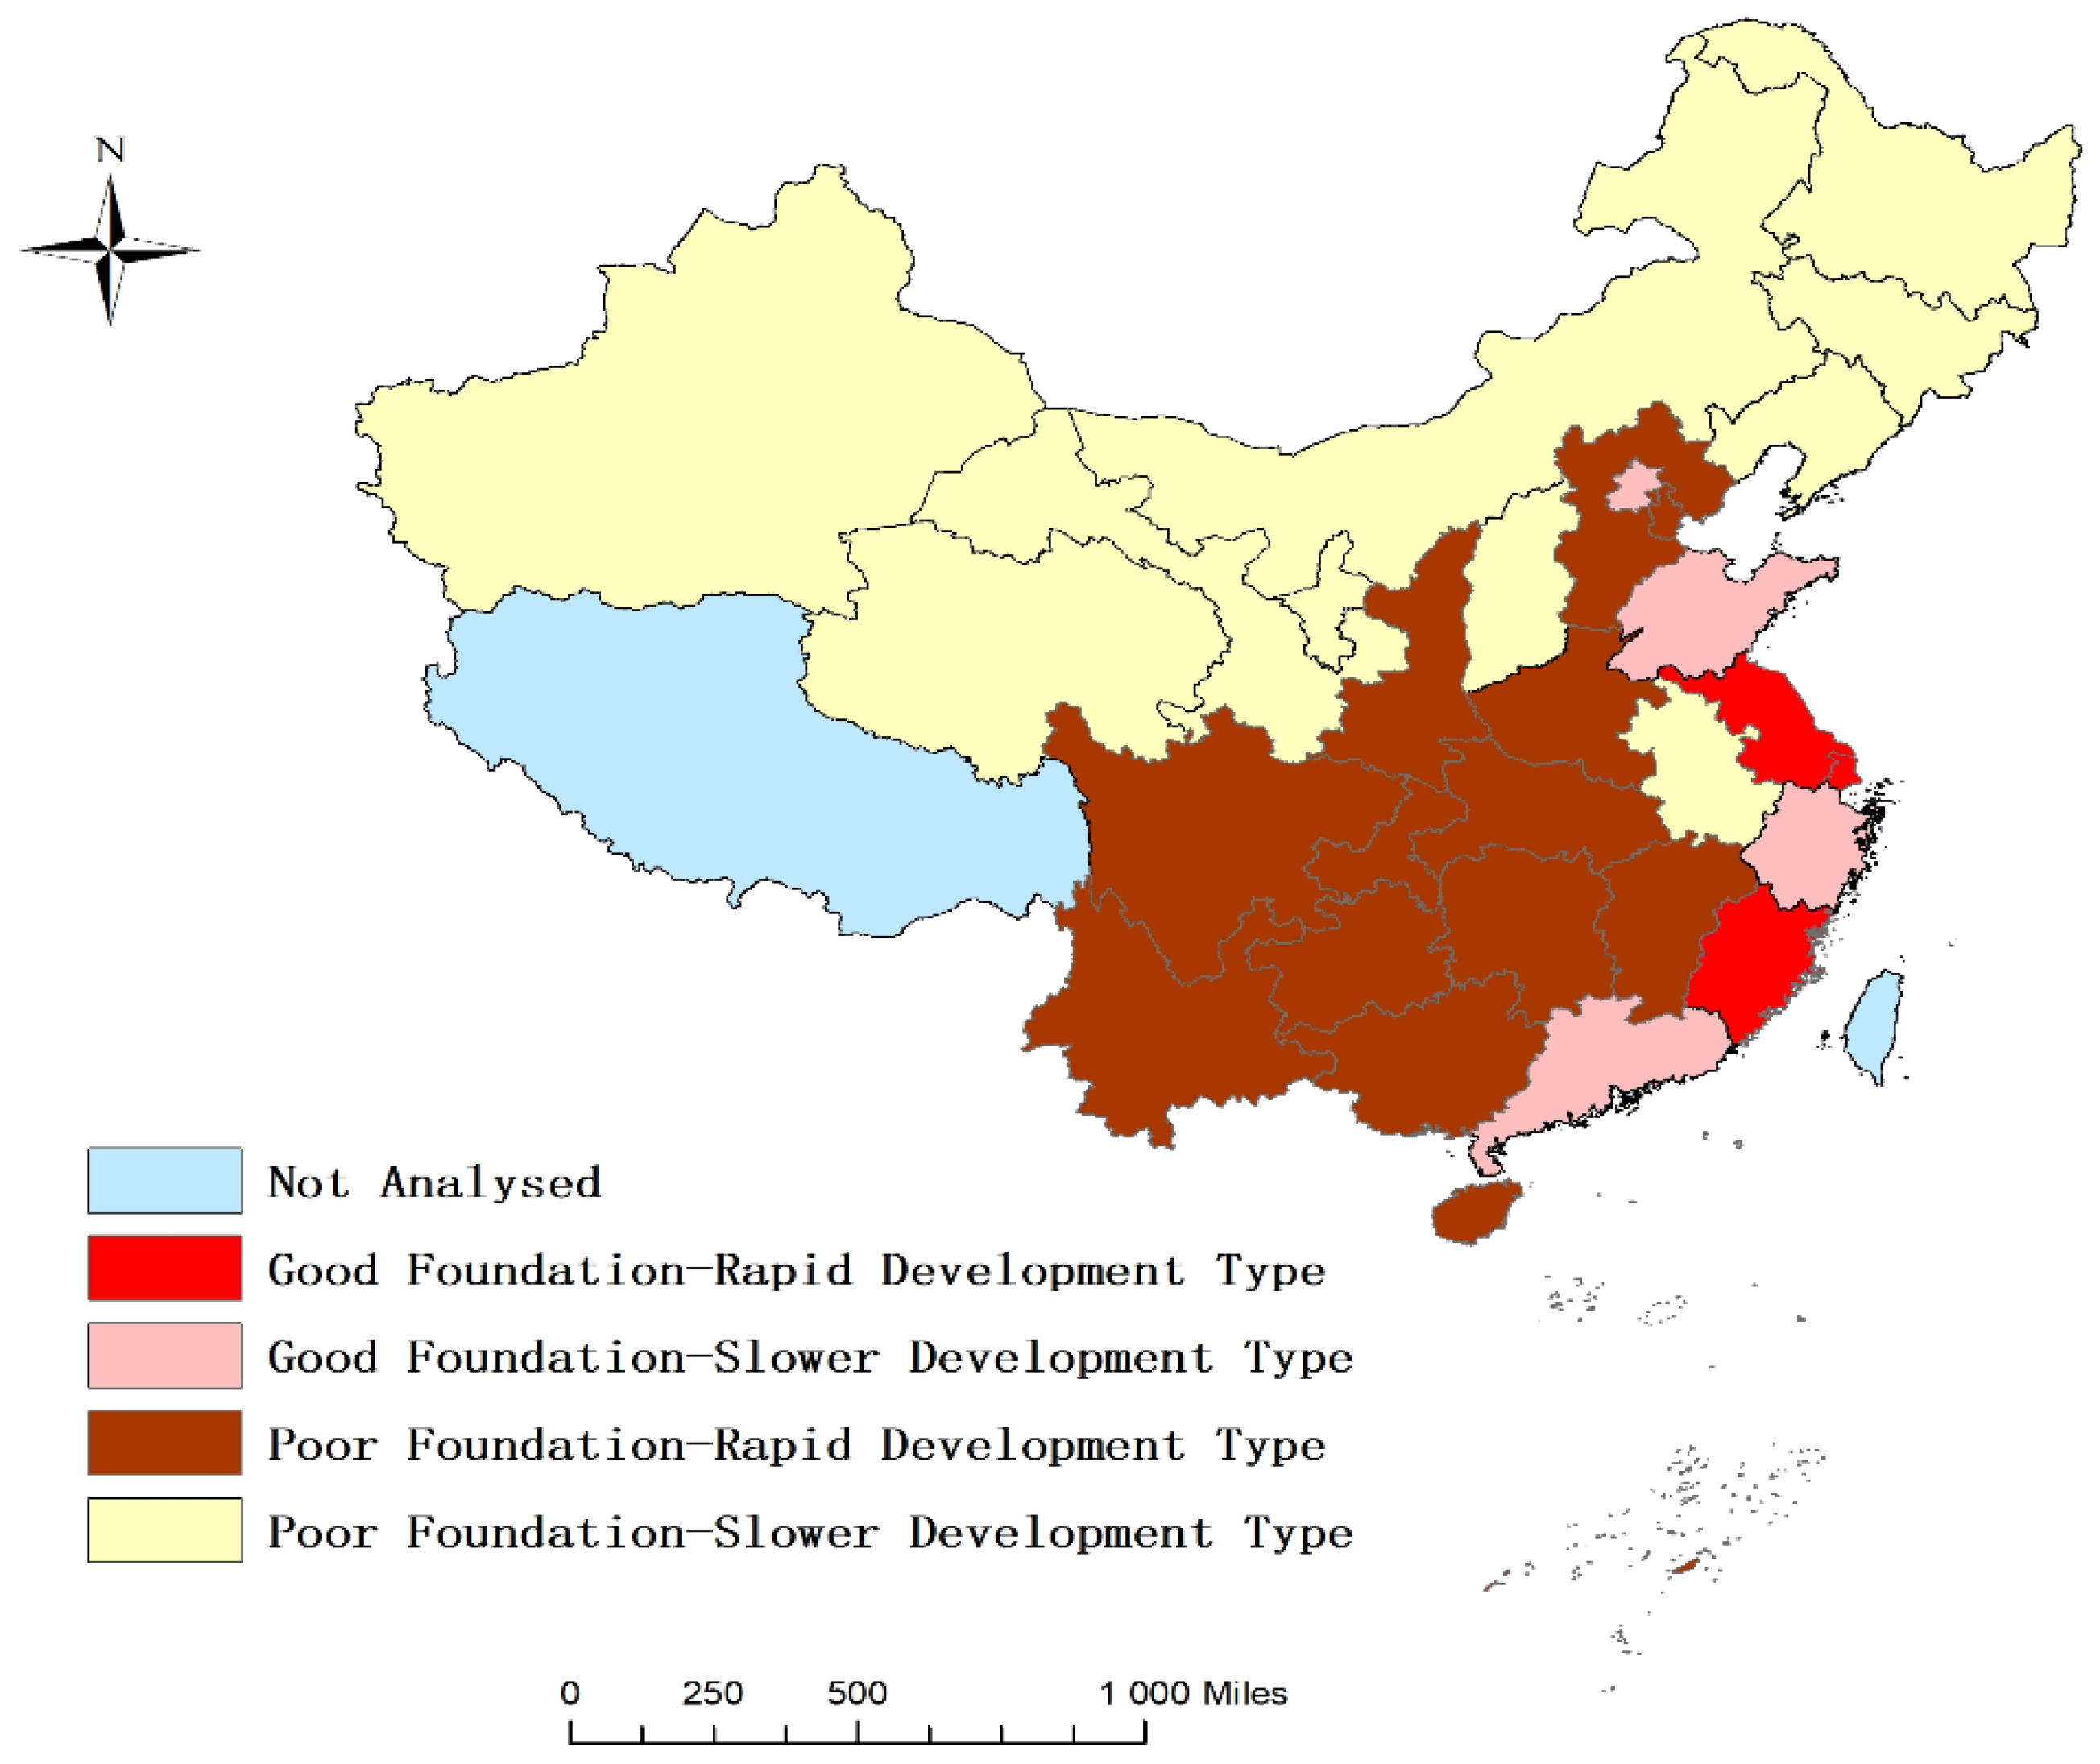
Figure 1. Spatial types of variation in sports industry agglomeration degree.
Sustainability 11 05399 g001
Figure 2. Global Moran’s I value of sports industry agglomeration from 2008 to 2017.
Sustainability 11 05399 g002
Figure 3. Sports industry agglomeration in 2008.
Sustainability 11 05399 g003
Figure 4. Sports industry agglomeration in 2012.
Sustainability 11 05399 g004
Figure 5. Sports industry agglomeration in 2017.
Sustainability 11 05399 g005
Table 1. Variable selection and description.
Variable Name SymbolDescription
Explanatory variable Sports industry agglomeration degreeCIThe degree of sports industry agglomeration
Explained variable Green GDPGGDPGDP—cost of resource depletion—cost of environmental pollution loss
Controlled variablesEconomic developmentEcoPer capita GDP
Human capitalHrAverage years of education
Urbanization levelUrbThe proportion of urban population to the total population
Foreign investment levelFdiThe ratio of FDI to GDP after exchange rate conversion
Regional innovation levelInnNumber of regional patent authorizations/10,000 people
Government intervention degreeGovRatio of local fiscal expenditure to GDP
Industrial structural upgradeUpgradeIndustrial structure hierarchy coefficient
Table 2. Provinces included in each quadrant in 2008, 2012 and 2017.
Type200820122017
H-H (The first quadrant)Fujian, Shanghai, Jiangsu, Zhejiang, Shandong (5)Fujian, Shanghai, Jiangsu, Zhejiang, Shandong, Guangdong, Hunan (7)Fujian, Shanghai, Jiangsu, Zhejiang, Shandong, Guangdong, Hunan (7)
L-H (The second quadrant)Jiangxi, Tianjin, Guangxi, Anhui, Hebei, Hunan (6)Jiangxi, Tianjin, Guangxi, Anhui, Hebei (5)Jiangxi, Tianjin, Guangxi, Anhui (4)
L-L (The third quadrant)Heilongjiang, Inner Mongolia, Jilin, Shanxi, Shaanxi, Hubei, Chongqing, Guizhou, Qinghai, Gansu, Ningxia, Liaoning, Yunnan, Sichuan, Xinjiang, Henan (16)Heilongjiang, Inner Mongolia, Jilin, Shanxi, Shaanxi, Hubei, Chongqing, Guizhou, Qinghai, Gansu, Ningxia, Liaoning, Yunnan, Sichuan, Xinjiang (15)Heilongjiang, Inner Mongolia, Jilin, Shanxi, Shaanxi, Chongqing, Guizhou, Qinghai, Gansu, Ningxia, Liaoning, Yunnan, Sichuan, Xinjiang, (14)
L (The fourth quadrant)Beijing, Guangdong (2)Beijing, Henan (2)Beijing, Henan, Hebei, Hubei (4)
Table 3. Regression results of full sample.
Pooled OLS RegressionsFixed Effect Model Random Effect Model
LnCI8.3155 ***1.0532 *0.6116
(10.15)(1.90)(1.03)
LnEco1.3707 ***1.1240 ***1.1662 ***
(8.83)(16.95)(16.56)
LnUpgrade1.64951.3746 ***1.4207 ***
(1.32)(3.22)(3.06)
LnHr0.6630 ***0.04910.0456
(6.24)(1.33)(1.14)
LnUrb12.0063 ***0.38910.3238
(8.62)(0.57)(0.46)
LnFdi−0.2461 ***−0.0488 *−0.0785 ***
(−2.78)(−1.77)(−2.70)
LnInn0.4060 ***0.0595 *0.0817 **
(6.05)(1.67)(2.12)
LnGov0.9246 ***0.07970.3857 **
(7.55)(0.41)(2.25)
_cons−8.7823−10.3623 ***−10.6449 ***
(−1.23)(−4.42)(−4.17)
N300300300
F117.0244592.7237
Wald 3979.85
R20.76780.94760.9460
P0.00000.00000.0000
Note: ***, ** and * denote a significance of 1%, 5% and 10%, respectively. F-test = 76.95, P = 0.0000; Hausman test: λ2 = 20.33, P = 0.0253.
Table 4. Full sample nonlinear regression results.
Pooled OLS RegressionsFixed Effect Model Random Effect Model
LnCI3.3997 ***2.0328 ***1.0333 *
(5.64)(3.70)(1.79)
LnCI2−27.6084 ***−25.1976 ***−22.9115 **
(−3.50)(−2.92)(−2.40)
LnEco1.21881.3334 ***1.4044 ***
(0.96)(3.10)(2.97)
LnUpgrade0.6680 ***0.4496 ***0.4456 ***
(6.34)(3.34)(3.13)
LnHr11.0798 ***0.8877 ***0.3805
(8.25)(3.89)(0.54)
LnUrb0.1577 *0.0468 *0.0793 ***
(1.79)(1.69)(2.69)
LnFdi−0.3438 ***−0.0618 *−0.0847 **
(−5.09)(−1.73)(−2.17)
LnInn0.8075 ***0.4838 **0.4122 **
(6.54)(2.43)(2.41)
LnGov1.3034 ***1.1244 ***1.1692 ***
(8.38)(16.95)(16.45)
_cons−6.1320−10.1319 ***−10.5542 ***
(−0.85)(−4.30)(−4.07)
N300300300
F113.3748526.6616
Wald 3894.71
R20.77900.94780.9459
P0.00000.00000.0000
Note: ***, ** and * denote a significance of 1%, 5% and 10%, respectively. F-test = 81.26, P = 0.0000; Hausman test: λ2 = 24.14, P = 0.0178.
Table 5. Regional regression results.
EasternMiddleWestern
LnCI1.5093 *2.0146 **0.5171
(1.74)(2.06)(1.37)
LnEco0.8589 ***1.1249 ***1.2220 ***
(12.24)(15.28)(7.03)
LnUpgrade2.3545 ***1.7306 *1.6392 *
(3.42)(1.85)(1.74)
LnHr0.03780.06530.0587
(0.96)(1.61)(0.75)
LnUrb0.41000.04900.8169
(0.64)(0.05)(0.40)
LnFdi−0.1101 ***−0.0608 ***−0.0056
(−3.38)(−2.87)(−0.10)
LnInn0.1433 ***0.04600.0048
(3.49)(1.00)(0.06)
LnGov−1.09834.17810.0023
(−1.39)(5.01)(0.01)
_cons−12.7033 ***−3.1239−13.2732 **
(−3.67)(−1.04)(−2.40)
N11070120
F437.3388530.3557160.8371
R20.97460.98720.9279
P0.00000.00000.0000
ModelFixed-effectFixed-effectFixed-effect
Note: ***, ** and * denote a significance of 1%, 5% and 10%, respectively.
Table 6. Estimation results of dynamic panel model.
Model 1Model 2EasternMiddleWestern
L.lnggdp0.2809 ***0.2775 ***0.4302 ***0.7481 ***0.2264 **
(11.41)(11.57)(3.83)(12.46)(2.30)
LnCI2.1451 **1.6159 **1.7791 * 2.2800 **0.0713
(2.07)(2.01)(1.90)(2.32)(0.02)
LnCI2 −16.7620 **
(2.21)
LnEco0.6753 ***0.6701 ***0.38170.10611.5923 ***
(11.90)(10.24)(1.09)(0.95)(2.73)
LnUpgrade0.489 ***0.935 ***6.0033 *0.72383.3056 *
(3.42)(4.20)(1.91)(1.46)(1.93)
LnHr0.1419 ***0.1412 ***2.2773 ***1.0907 ***1.4535
(15.86)(14.87)(4.94)(4.43)(1.23)
LnUrb1.9283 **1.7484 *4.92800.32578.0858
(2.45)(1.83)(0.71)(0.30)(1.37)
LnFdi−0.0259 ***−0.0223 ***−0.2967 ***−0.02320.1280
(−3.47)(−2.70)(−2.66)(−0.37)(−1.16)
LnInn0.3242 ***0.3153 ***0.1491 *0.02910.2503 ***
(11.81)(11.07)(1.85)(0.66)(4.85)
LnGov1.2081 ***1.2291 ***3.6381 **1.08090.1988
(11.15)(10.26)(2.17)(1.09)(0.27)
_cons−0.3464−0.5564−34.0315 **2.9595−19.1927 *
(−0.16)(−0.21)(−2.05)(1.03)(−1.79)
N2702709963108
AR (1)−2.3714 **−2.3882 **−2.5331 **−2.3194 **−2.4223 **
AR (2)0.90191.00340.92801.02910.0138
Sargan0.96870.97371.00001.00001.0000
Note: ***, ** and * denote a significance of 1%, 5% and 10%, respectively.