Article

Development of Economic Integration in the Central Yangtze River Megaregion from the Perspective of Urban Network Evolution

1
Center for Modern Chinese City Studies, East China Normal University, Shanghai 200241, China
2
School of Urban and Regional Science, East China Normal University, Shanghai 200241, China
*
Authors to whom correspondence should be addressed.
Sustainability 2019, 11(19), 5401; https://doi.org/10.3390/su11195401
Submission received: 2 September 2019 / Revised: 21 September 2019 / Accepted: 27 September 2019 / Published: 29 September 2019
(This article belongs to the Section Sustainability in Geographic Science)

Abstract

:
Megaregions are the new engines of global and regional economic growth, and they often are considered a principal urbanization platform in China. To understand megaregional processes’ responses to China’s regional policies, this study focused on two aspects of integration development in the Central Yangtze River megaregion between 2000 and 2014: The internal collaborative networks using enterprises’ headquarters-branch locations as a proxy measurement and the role of regional transportation in the integration networks. Based on a three-step network analysis, the Central Yangtze River megaregion was increasingly similar to a polycentric urban system with Wuhan, Changsha, and Nanchang as the dominant service cities, and there were some indications of a preliminary urban network formation. However, integration development remained a government-led administrative process with administrative boundaries that significantly influenced the network structure. A panel regression analysis further suggested that transportation accessibility to the three central cities was the key determinant of network participation for the peripheral cities compared to economic performance. This work contributes to the debate on the hierarchical-administrative properties of China’s megaregions and transportation implications of the economic integration process.

1. Introduction

In the context of economic globalization, urban megaregions have become the engines of regional and the global economic growth as they emerge and extend beyond their geographic limits, producing enormous economic outputs for those markets [1]. Meanwhile, as the recipients of the brunt of accelerating population growth, the expanding megaregions are expected to host most of the world’s urban population. As such, these new urban configurations have been employed as an ideal-type construct to measure urbanization processes, and they are increasingly translated into a normative policy framework in the Americas, Europe, and Asia [2,3,4]. An extensive literature and policy documents have stressed the role of megaregions in economic organization and their strategic positions at the national level [5,6]. It has sought to mobilize the region’s untapped resources through policies encouraging these cities’ integration and growth. According to the National New Type Urbanization Plan (2014–2020) released by the central government, Chinese authorities plan to develop a national system of 23 urban megaregions distributed along the major rivers, railways, and major urbanized areas. As a top national agenda item, megaregion development in China uses a strong top-down approach to enforce the central government’s political and economic objectives, which differ from those of Western countries [7]. Nevertheless, the policy and rhetoric of intercity integration sometimes failed to yield concordant material outcomes, as Ye observed in the case of China’s Pearl River Delta [8]. Further policy instruments require knowledge about the achievement and failure of megaregion policies that seek for spatial, economic, and social sustainability.
This paper approaches the process of megaregion building and economic integration through a case study of the Central Yangtze River Megaregion (CYRM), in which transboundary urban interaction has been questioned. Since the beginning of the new millennium, there have been some policy and planning endeavors for inter-jurisdictional cooperation and integration in Hubei, Hunan, and Jiangxi provinces. Most of them intended to resolve technical and localized problems rather than more general regional problems, thus contributing to the structural imbalances among metropolitan governments. Accordingly, a centralized political unit was widely proposed to produce and coordinate services across an entire region. In 2012, the integration development of the CYRM was officially launched by the three provinces, with the region planned as a new growth pole of China’s economy. The key factor in megaregional development is that growth does not start from a central agglomeration towards an empty area but can instead encompass many other smaller urban areas and some of a similar size to the central one [9]. However, prevailing network analysis in the economic integration study focuses on advanced producer service firms [10,11] or transnational corporations [12], which may lead to too much concentration on a limited number of large cities and result in small cities becoming ‘off the map’ [13], especially for the CYRM where producer service remains less advanced. By contrast, intercity connections based on the intra-firm network in all industrial sectors are conductive to reveal the region-building practices especially in those less-developed central and western regions in China. Additionally, increasing literature exists on how China’s intercity transportation has affected the process of economic growth and network formation. Policy-makers now more than ever concentrate on the development of transportation infrastructure linkages with metropolis to have optimal economic growth potentials [14]. However, the effect of transportation accessibility between core and periphery cities on network position has not been fully discussed. It is worthwhile to discuss how the proximity to rail and road infrastructure and their provided access to central cities affect business investment and whether the evolution of spatial accessibility encourage further strengthening of the core-periphery structure of intercity linkages or not. We assumed that cities benefit from economic advantages stemming not only from their own dimension but also from the transportation linkage with core nodes in the network.
Based on the literature, conventional researchers have not reviewed CYRM’s spatial structure based on firms in all industrial sectors or established a conceptual framework with which to study and interpret the economic integration and transportation interplays that are needed to illuminate the city. To address this gap, we aim to show some evidence that it is possible to combine both objectives: The economic integration through enterprise networks in all industrial sectors and the role of the transportation infrastructure on economic integration measured by regional accessibility. Drawing on ideas from the burgeoning literature on networks, collaboration, and new forms of governance, this paper investigates the long-term relationships between the development of collaboration networks, transportation accessibility, and spatial policies, by using a panel dataset consisting of grid cells measured at three time points from 2000 to 2014. Specifically, we constructed a network-based analytical framework for integration assessment. First, using data on headquarters-branch locations of all industrial sectors, we assessed the actual effects of intercity economic linkages in the CYRM from 2000 to 2014 regarding cities’ connectivity and network structures. Second, we developed a new regional accessibility measure to treat three core cities as the destinations and quantitatively reveal how regional accessibility significantly affected network evolution during the study period. To some extent, the two topics are metaphors for the significance of market mechanisms and national macro-control. This paper contributes to the converging literature on intercity networks and regional transportation in China’s megaregions through a focus on inter-jurisdictional cooperation and integration, which show that these two entities are complexly interdependent at the scale of megaregions. Furthermore, this comprehensive analysis may provide some new insights on megaregional sustainability, which also are informative for other developing economies.
The next section provides a general discussion of the concepts related to megaregions and the integration process in the CYRM, followed by an explanation of the study’s data and methods in Section 3. The following results section consists of two parts: A network representation of the CYRM’s intercity connections and a discussion of the influences of transportation on the integrated network. The final section discusses and concludes about the major findings, considers policy implications and offers suggestions for future studies.

2. Literature Review

2.1. Megaregions: The New Strategic Terrain

In the context of intensifying globalization, regional development has rescaled territorial and political spaces at the regional and metropolitan levels to meet the needs of greater economic integration [15,16]. Megaregion is the emerging globalizing politico-economic unit named by the United Nations as the ‘new engine’ of global and regional economic growth [1]. However, the ‘megaregion’ concept is not an entirely new idea to urban or regional scholars [17], and it dates to Gottman’s Megalopolis, which focused on the United States’ urban northeast seaboard [18]. During the following six decades, a plethora of terms were put forth to describe the spatial reorganization, from monocentric concepts (e.g., megacity, metacity, megalopolis, and agglomeration) and single functional units (e.g., metropolitan area, conurbation, city region, urban agglomerations, and conurbations) to polycentric organization (e.g., polycentric urban region, mega-city region, and megaregion) and urban systems/networks [19]. Among these urban spatial patterns, megaregion arose as the new strategic terrain for countries’ participation in the global economy. Megaregion has been defined as a functional polycentric network of metropolitan areas and their lower density surrounding areas [20,21], which is consistent with the network paradigm in urban systems [22,23]. A very important idea that this notion of ‘megaregions’ includes is an emphasis on transactional flows of people, goods, and services, which are considered at least as relevant as what happens within cities that determines cities’ positions within urban systems [24,25]. Different cities within the megaregion network show a marked degree of spatial interaction and hence integration.
Given the emergence of this new strategic terrain, recent studies have called for a restructuring of the conventional urban frameworks and treating megaregions as possible contextual frontiers for urban theorization [4,25,26]. Despite the successive promulgation and implementation of megaregional planning in China, relevant research has just begun, with much more attention focused on population and industrial/employment agglomerations than on functional and/or integrative characteristics [27,28]. Additionally, these studies’ methodologies have tended to rely on descriptive analyses and geographic information system (GIS) mapping rather than on economic relationships within or among regions. Therefore, it is imperative to explore the internal collaborations within megaregions using an explicit network approach.

2.2. Integrative Process in the CYRM

Almost simultaneous with what has happened to urban forms, significant changes have taken place in the breadth and depth of regional integration. Starting with the elimination of trade barriers among countries in the East Asian region [29], regional integration has progressed by emphasizing shrinking the gaps in countries’ internal development [30], which is particularly the case for China [31,32]. Its spatial carriers mainly include metropolitan areas, urban agglomerations, megaregions, and other urban spatial organizations. There has been a renaissance in the regional policies and planning across China that echo national strategies and highlight inter-jurisdictional cooperation and integration [33,34]. To some extent, these practices indicate a transition in regional governance from territorial competition to regional coordination, in which adjacent municipalities are encouraged to transcend jurisdictional boundaries and function in coordinated ways as unitary megaregions. In this context, extensive case studies have analyzed integration at the regional level, most notably the prima facie examples of the Pearl River Delta, the Yangtze River Delta and the Capital Economic Zone [35,36,37]. Regarding megaregions in central China, relevant research has just recently emerged [38,39,40].
During the past several decades, a host of integration policies have guided the CYRM’s economic integration (e.g., regional plans, industrial policies, and regional agendas) and attempts to reshuffle intercity linkages economically, socially, and institutionally. Particularly, the promulgation of the Outline of the Plan for the Reform and Development of the CYRM (2015–2030), released by the central government, indicated that CYRM economic integration had been privileged as the principal national development strategy. The plan intended to structure a new level of regional government in central China and provide a respite from the challenges of dealing with the gridlocked politics and (often) ineffective institutions at other administrative levels. However, the megaregion policy for central China was not an abrupt governmental decision, and it originated in regional policies. Since the early 1990s, non-governmental organizations and governmental agencies in central China have actively been dedicated to fostering regional integrated economic development using many approaches, including the redistribution of urban industries, building large-scale infrastructure projects, and establishing intercity cooperation. Cities in the CYRM are connected via strong and stable transportation and telecommunication networks characterized by transactional flows of people, goods, and information.

3. Materials and Methods

3.1. Geographic Sampling

The CYRM comprises three urban agglomerations/metropolitan areas (Wuhan Metropolitan Area, Changsha-Zhuzhou-Xiangtan Urban Agglomeration, and Poyang Lake Eco-economic Zone) in the Middle Yangtze River. The region covers an area of about 317,000 km2, which is comparable to the size of Germany. Administratively, the megaregion of 31 cities includes one centrally located national city, nine prefecture-level cities, and three provincial county-level cities in Hubei; eight prefecture-level cities in Hunan; and ten prefecture-level cities in Jiangxi. Due to data comparability and research requirements, municipal districts of the same prefecture-level city were merged into one analytical unit. Along with the other 150 counties and county-level cities, 178 county-level units were obtained (Figure 1). This study constructed an analytical framework at the county level to better depict the interaction between the core and the periphery. Based on the existing research conditions and availability of data, the time scale was designated as 2000 to 2014 in this paper, in consideration of the intensifying globalization as well as China’s state rescaling at the regional and metropolitan levels in the late 20th century.

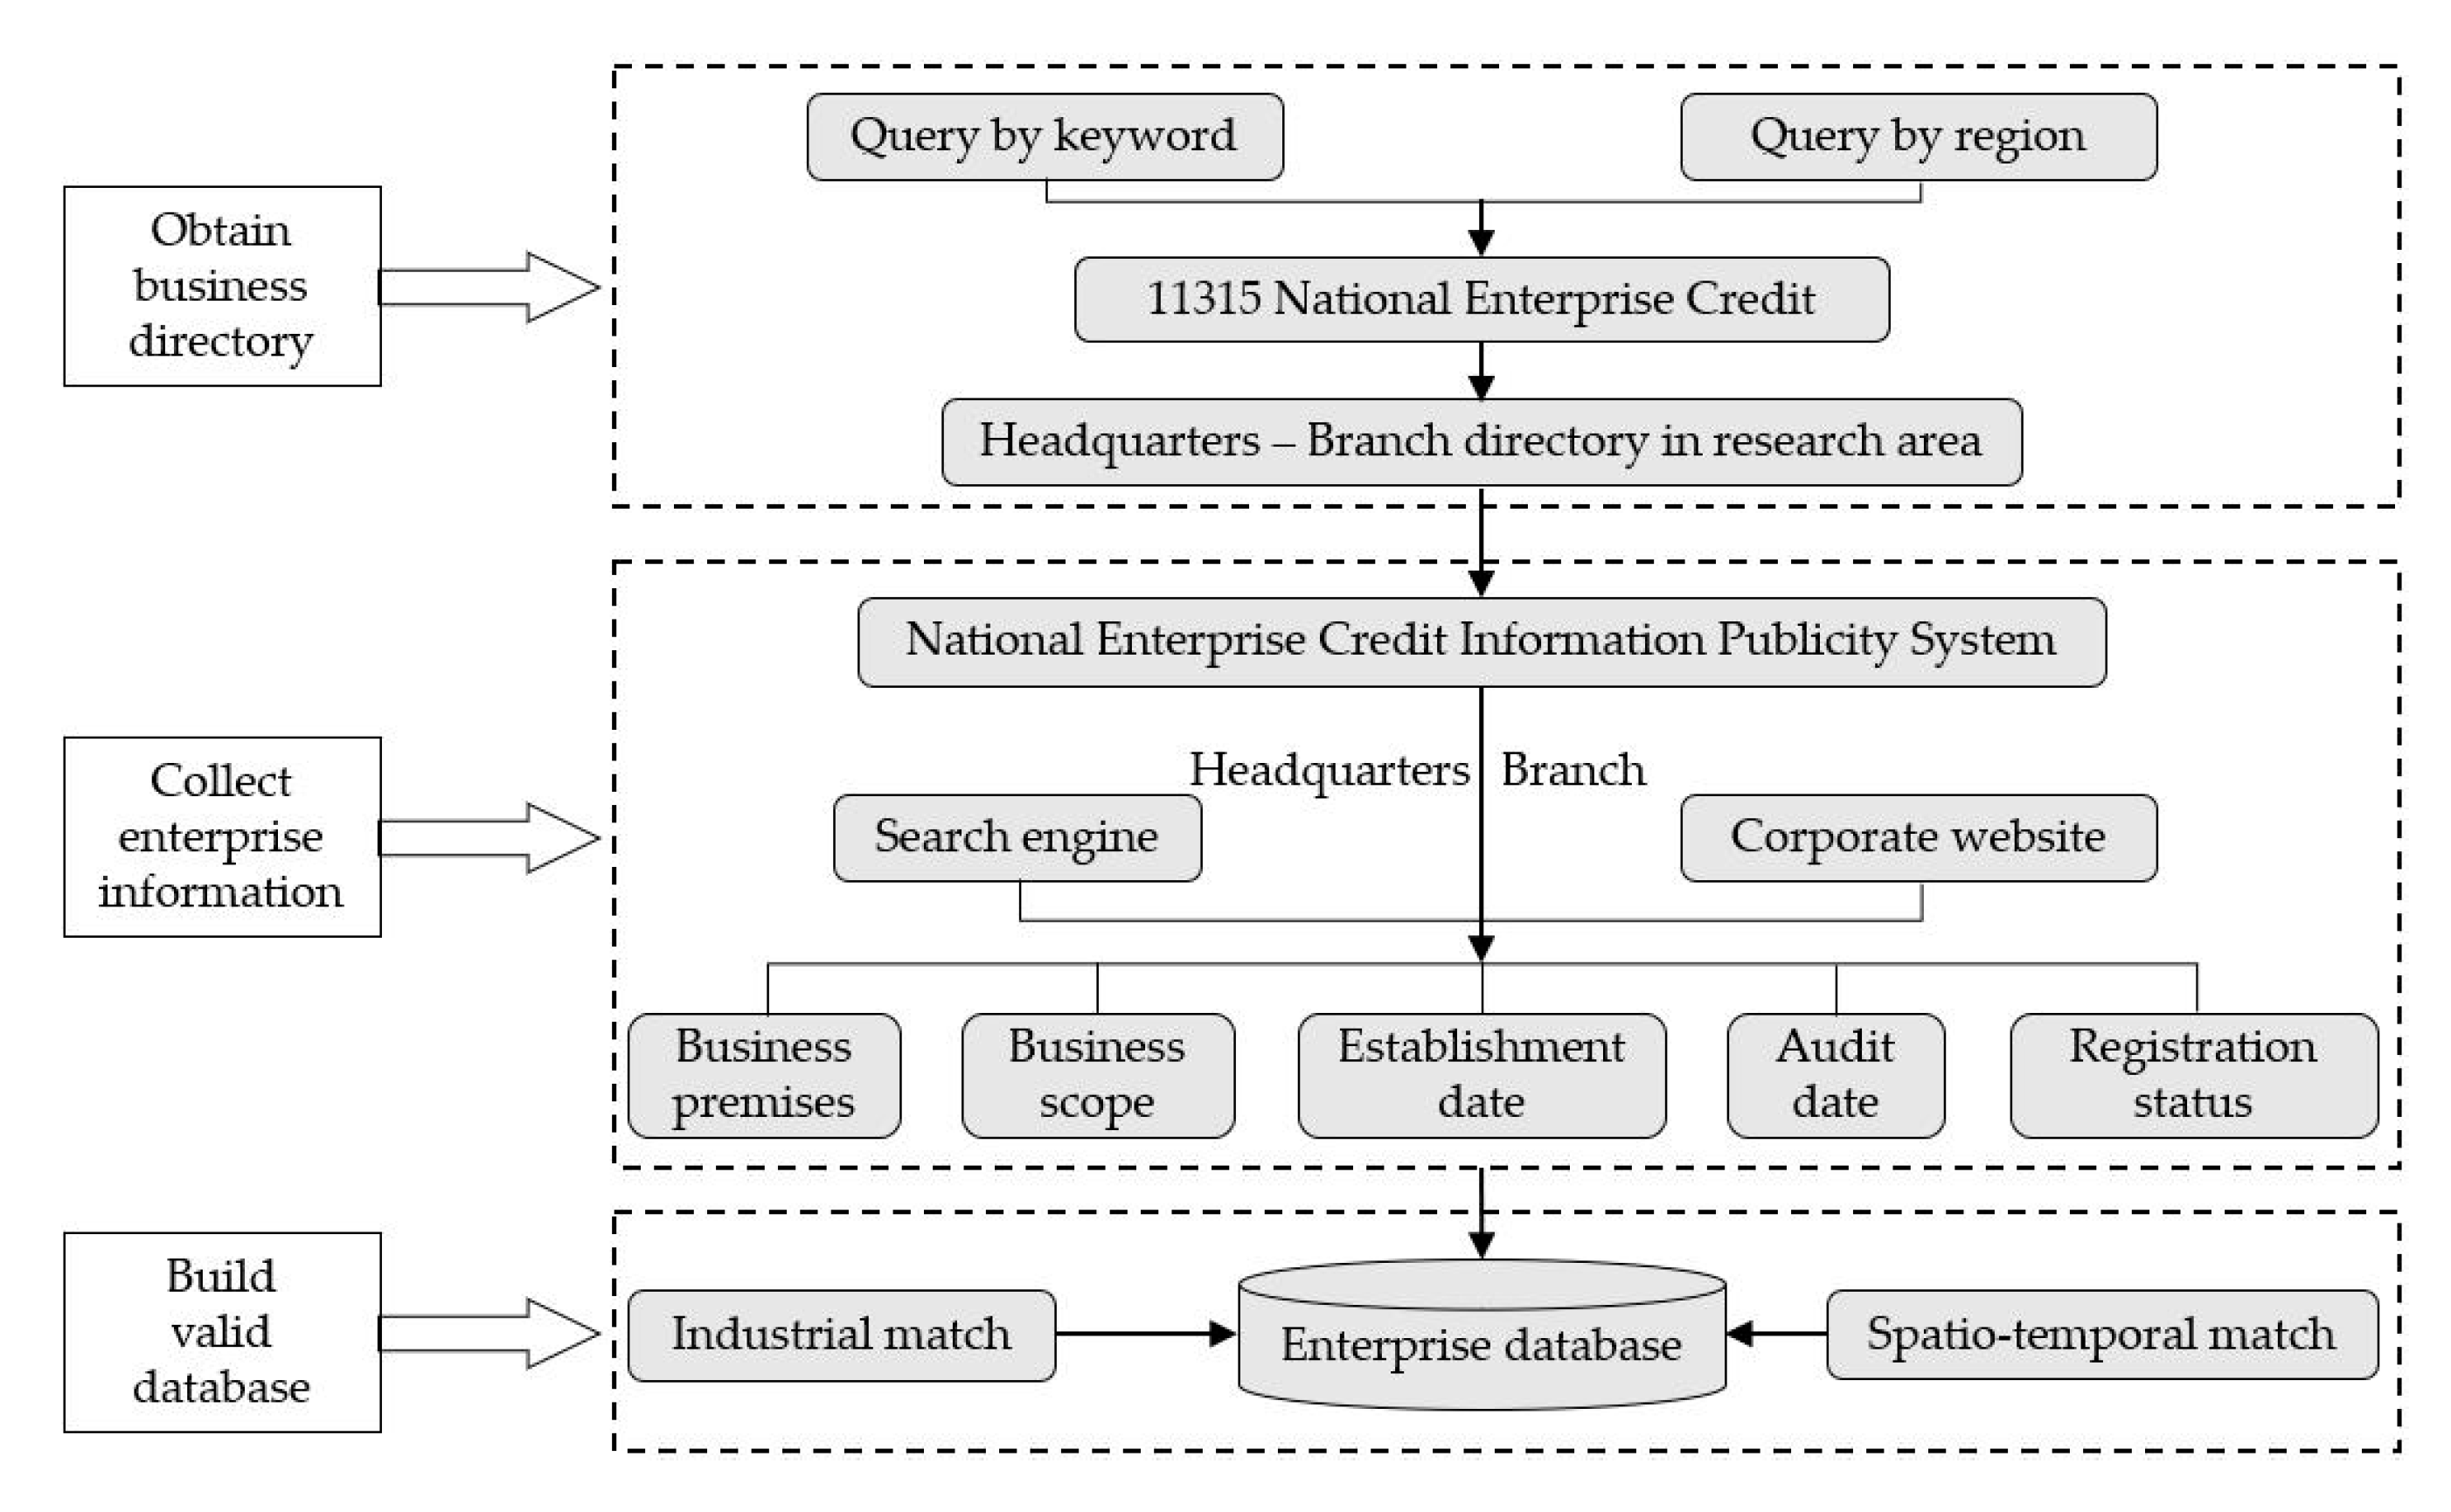
3.2. Data Collection

Figure 2 illustrates the database building process used to collect the data on the enterprises. For the first query, we used the regional keyword query function of the 11315 National Enterprise Credit System [41] and entered a few keywords, including ‘subsidiary’, ‘branch’, and ‘office’ to access entities’ branch names in the study areas, and the business directories of the entities’ headquarters were simultaneously obtained. Second, we registered with the National Enterprise Credit Evaluation Information Publicity System [42] to access the enterprise directory, which we obtained for the second query to confirm and supplement the required information on each entity. Finally, according to the Classification Standard of National Economy Industry (GB/T 4754-2011) published by the National Bureau of Statistics, the business scopes of the sampled enterprises were classified. For the analysis, we retained the data on the headquarters with branches located in different counties and filtered out the redundant data. Then, we classified the units chronologically to screen out the sampled enterprises of 2000, 2007 and 2014. Ultimately, a sample of 11,564 valid cases (enterprises) was collected.
Furthermore, the analysis was supplemented by related data, that is, per capita gross domestic product (GDP), per capita retail sales of consumer goods, per capita fixed asset investments, and urban land information. The data on the socioeconomic characteristics of counties were originally collected from the Statistical Yearbooks of Hubei, Hunan, and Jiangxi provinces and some counties in the study area. Urban land information for the calculation of traffic time cost was extracted from the visual time series Landsat images (2000, 2007, and 2014).

3.3. Analysis Measurement

To analyze the integration development of megaregions, we constructed a network-based framework. By assigning enterprises’ offices to the county-level administrative units where they were located, the data on headquarters-branch connections of the enterprises in all industrial sectors were transformed into one-mode city-by-city directed matrices. In contrast to conventional case studies on urban networks, this methodology facilitated discussion on the role of transportation as a policy tool in urban networks instead of limiting it to network locations and structures using the proxies of centrality, density, linkage intensity, coreness, and so on.

3.3.1. Network Construction and Representation

To analyze the intercity collaborative network of the 178 county-level administrative units, this study used a three-step approach of network analysis to identify the urban linkages from different perspectives. First, six indicators (degree centrality, out-degree centrality, in-degree centrality, betweenness centrality, connection intensity, and network density) were selected to assess the hierarchical structure (Table 1). Second, a core-periphery model was estimated to describe the central cities of the 178 units over 14 years. Drawing on the algorithms for detecting continuous versions of core-periphery structures in networks proposed by Borgatti and Everett [43], every node in the CYRM was assigned a ‘coreness’ value using UCINET 6.0 to reveal the way that the core nodes acquired well-known positions in the network. Generally, a ‘core’ is a densely connected nucleus of a network surrounded by sparsely connected periphery nodes. Third, a cohesive subgroup analysis was conducted to reveal the presence of subgroups in a network, the closeness among subgroups, and the closeness of nodes within subgroups [44]. Members with relatively strong, close, direct, or positive relationships were grouped as a component. Generally, regional networks can be divided into several components. Identifying the internal sub-structural status of an urban network was useful for a clear understanding of the relationships among cities and to reveal the spatial structure of the CYRM cities. In this study, the convergent correlation (CONCOR) algorithm in UCINET 6.0 was used to obtain the specific composition of all the cohesive subgroups.

3.3.2. Accessibility Measurement and Panel Data Model

Transportation infrastructure is believed to stimulate and guide urban growth via the improvements it makes to accessibility [45]. This assumption is demonstrated in a long tradition of policies aimed at channeling urban growth by investing in the infrastructure [46]. Accordingly, transportation accessibility is considered an important driver of urban growth and a key to sustainable urban development. It can particularly change the spatial organization patterns of urban networks based on the internal linkages among enterprises. Considering the indisputable leading role of central cities, we assumed that cities in megaregions benefit from economic advantages stemming not only from their own dimension but also from the transportation linkage with core nodes in the network. Therefore, this paper investigates relationships between the development of collaboration networks and transportation accessibility, by using a panel dataset consisting of grid cells measured at three time points from 2000 to 2014.
To begin with, we conducted a longitudinal study to spatially examine transportation accessibility to specific destinations (i.e., the municipal government of three central cities in the CYRM). There have developed various measures of accessibility, including distance-based accessibility, gravity-based accessibility, GIS based modeling of accessibility, and modeling of transportation access [47]. In this research, a raster-based approach was chosen because the output of this model was to be applied into the panel data model, as an explanatory variable. The objective of the current research project has been to develop a raster-based accessibility model for public transport to serve the assessment of the impact of regional strategies on economic integration and hereby contribute to the efforts on developing models and scenarios for sustainable megaregion development. Therefore, we have adopted distance-based accessibility constructed through cost distance analysis in GIS terms. The cost distance (or cost-weighted distance) tool modifies the Euclidean distance by equating the distance to the cost factor [48].
To obtain the cost distance, a source and a cost layer must first be created. In this paper, the source layer is the raster dataset converted from the government locations of three central cities, Wuhan, Changsha, and Nanchang. The cost layer is defined by the time cost surface of the megaregion area considering a travelling speed of various transportation modes. Suffering from limited information regarding the impact of road junctions and other sources of traffic congestion, the travelling speed of various transportation modes were generated based on the maximum design speed (Table 2). We selected 0.3 km as the grid size to cover a defined surface of given area. This was the optimum grid size to do this analysis as reducing or increasing the grid size was not convenient to do this analysis. Moreover, the cost raster in this paper was derived from the combination of multiple cost surfaces (composite cost). The minimum time cost of the raster datasets (grids) among multiple travel modes was selected as an input of the cost layer. Having defined the composite cost, the cost distance of each cell was then computed as the time cost required to arrive at the single cell in which municipal government of the three central cities. Finally, the value of cost distance was obtained through cost distance tool in ArcGIS toolbox. The average accessibility of each county-level unit to the three central cities was generated according to Equation (1).
A c c i t = j = 1 n T j t n ,
where A c c i t is the average landside accessibility of county i in time t, in which the lower the value, the better the regional accessibility; T j is the average time cost between grid j and the central cities; and n is the number of grids in county i.
Furthermore, using A c c i t obtained above as the explanatory variable, a quantitative method was used to test the influence of regional transportation on urban network development. Given the study’s objectives, the panel data methodology seemed to be the most appropriate option for at least two reasons. First, invariant heterogeneity could be controlled [49], and, second, the dynamic character of panel data enhances longitudinal testing adjusting for processes and determining the network position changes when the explanatory variables change. For the basic estimated model, degree centrality was the dependent variable, and a group of typical social and economic variables (per capita GDP (PGDP), per capita retail sales of consumer goods (PRSCG), and per capita fixed asset investment (PFAI)) was selected as control variables in the model to improve the ability to clearly interpret the results. These variables somewhat represented the potential degree of market capacity and marketization. The estimated model is specified in Equation (2)
D C i t = α + β A c c i t + θ 1 P G D P i t + θ 2 P R S C G i t + θ 3 P F A I i t + μ i t ,
where D C i t denotes the degree centrality of county i in time t, α is the total average intercept term, β and θ are parameter vectors to be estimated, and μ i t is the random disturbance term. A c c i t is the average landside accessibility of county i as elaborated in Equation (1).
There are several types of analytical models appropriate to panel data, including pooled models, fixed effects models, and random effects models. This study used the F-value to identify effects, which corroborates the appropriateness of a panel data approach. The Hausman test [50] compares the fixed to the random effects under the null hypothesis that the individual effects are uncorrelated with the other regressors in the model.

4. Evolution of Internal Collaboration Network

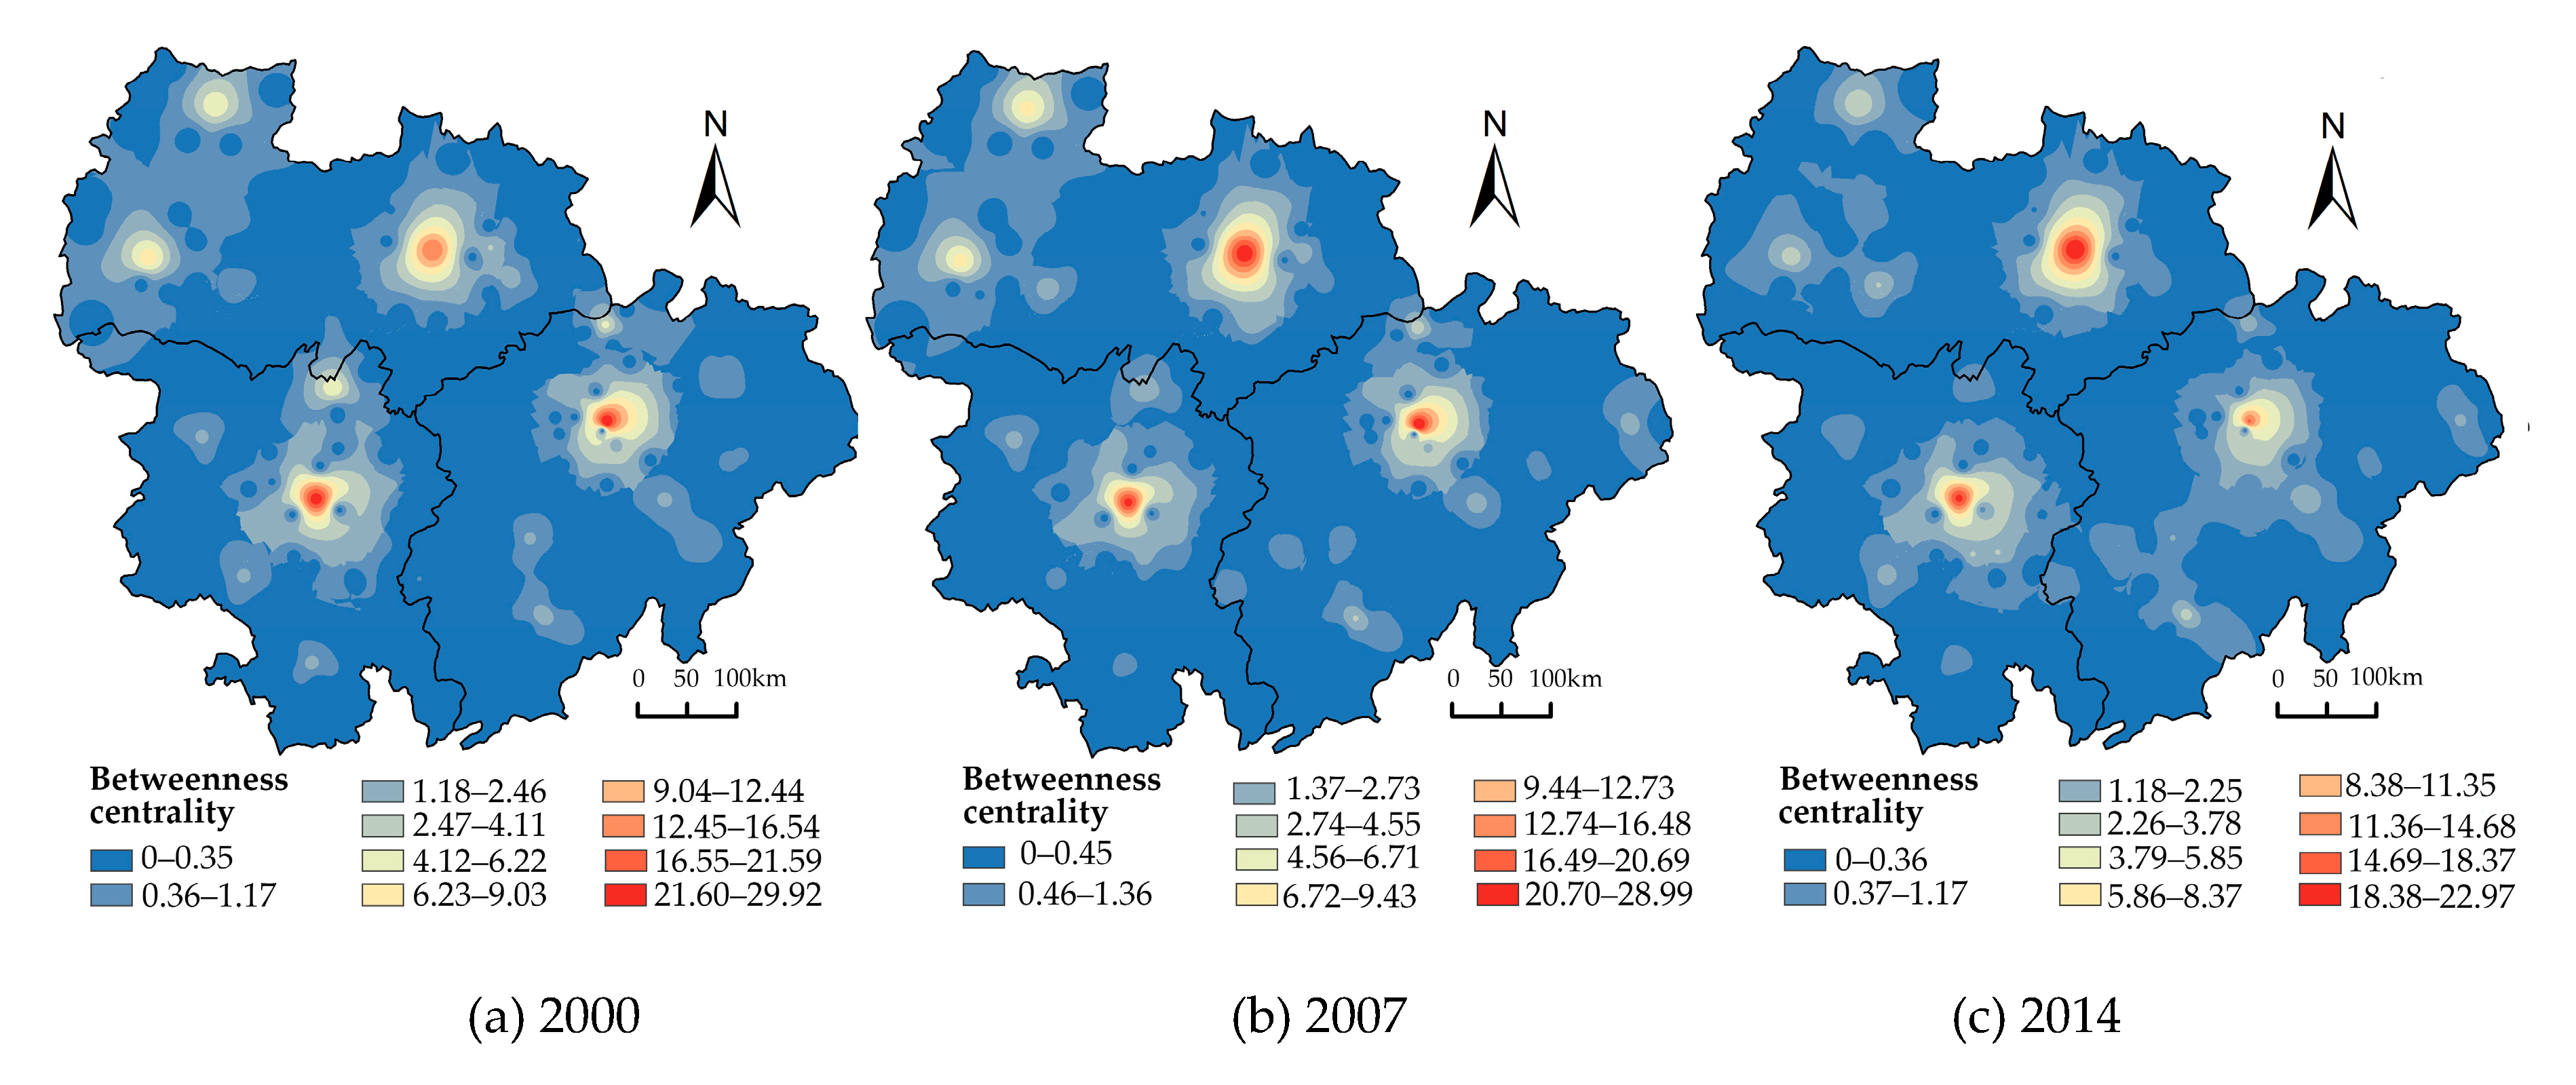
4.1. Nodal Centrality Analysis

In 2000, 2007, and 2014, the average degree centrality values were 3.104, 5.085, and 9.033, respectively. This ever-increasing average value meant that the nodal connections’ heterogeneity based on all the industrial sectors was continuously strengthening. The in-depth analysis of high-value city nodes revealed that the percentage of the total degree value of the three central cities (Wuhan, Changsha, and Nanchang) decreased from 20.86% in 2000 to 11.42% in 2014, indicating that connections with other municipal nodes started to increase. Additionally, the degree rankings of the three central cities constantly fluctuated and adjusted, increasingly illustrating features of a polycentric urban system in the CYRM. This polycentric structure largely reflected a strong political and administrative–bureaucratic imprint on the spatial economic system [14]. In this context, provincial capitals have resource allocation priority over other cities. Regarding the spatial distribution of degree centrality, there was a pattern characterized as a ‘core-periphery’ and ‘island-like’ combination (Figure 3). Specifically, the three central cities served as regional nuclei around which the values gradually decreased moving toward the periphery, clearly demonstrating a distance decay law. Therefore, depressed degree centrality mainly concentrated in the border zones of the three provinces. It is worth noting that some prominent nodes with high values sprang up in the border regions, including Yichang, Yueyang, Changde, and so on. This finding has a policy implication for the marginal regions’ abilities to avoid further marginalization, that is, crossing the provincial administrative boundaries under the megaregional policy platform. Based on the spatial pattern of degree centrality, Jiangxi Province greatly improved its inter-provincial relations with Hubei and Hunan provinces.
Regarding the directed network, out-degree centrality and in-degree centrality more effectively revealed the status of the megaregions’ cities. As Figure 4 and Figure 5 show, a comparison of the two centralities presents a thought-provoking phenomenon. Specifically, the out-degree centrality’s spatial patterns show an enhanced heterogeneity, with three ‘island-like’ peaks, that is, Wuhan, Changsha, and Nanchang. Contrariwise, the in-degree centrality spatial distribution is typical of homogeneity. In 2014, the total value of the in-degree centrality of the three central cities accounted for 11.95%, far less than that of the out-degree centrality (58.79%). Additionally, the betweenness centrality was similar to that of out-degree centrality, both of which demonstrated heterogeneity (Figure 6). The three central cities had a greater intermediary role in the network. To be precise, they possessed obvious structural hole advantages, indicating that other cities highly depended on them to create external connections. Moreover, these advantages were constantly strengthening across the study period, which led to more improvements in the ability to obtain information interests and control interests, and, thus, competitive advantages over other members of the network.

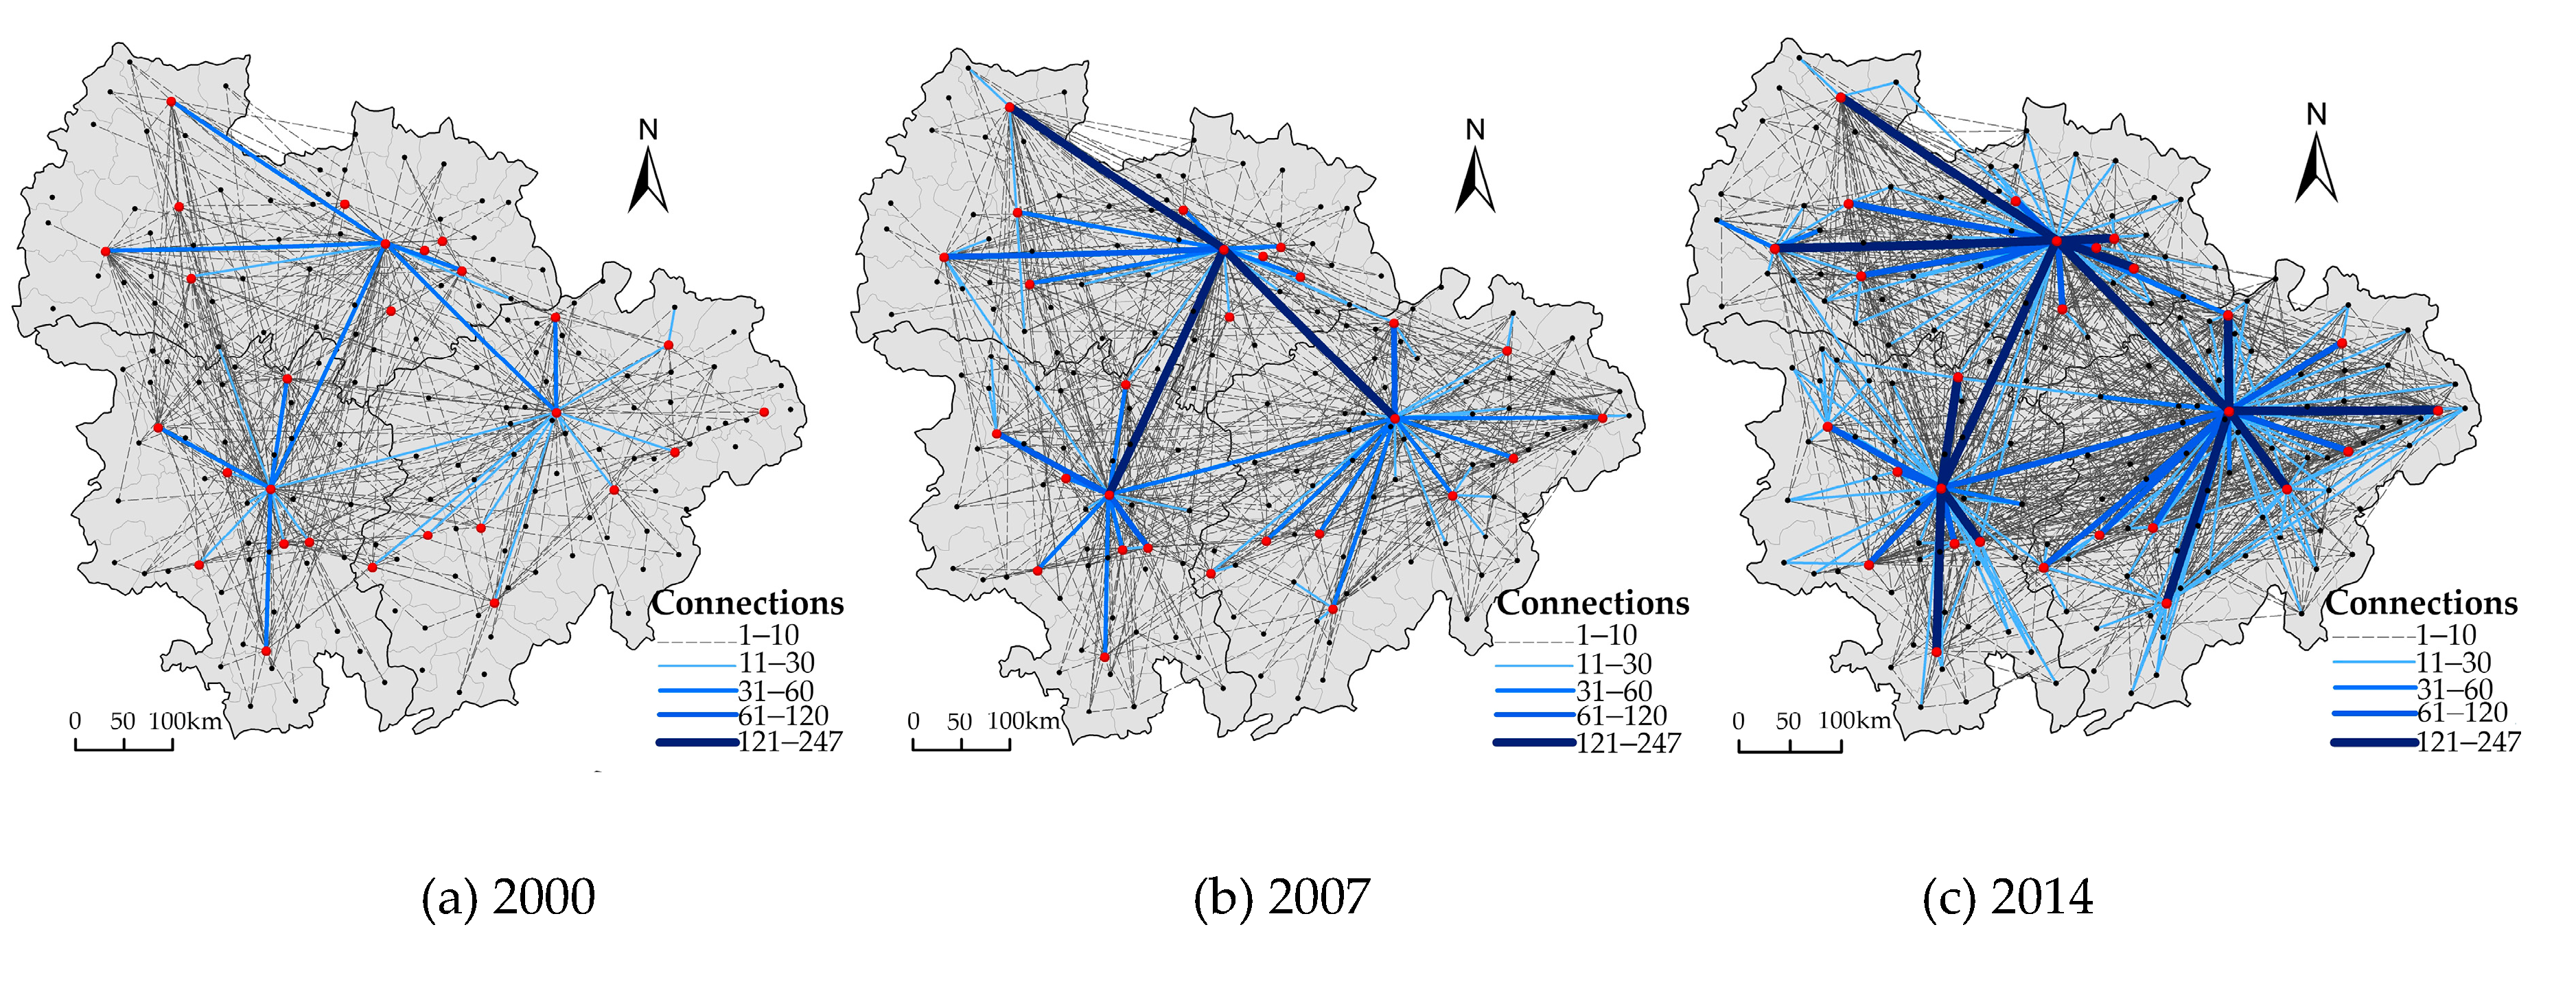
4.2. Spatial Connection Identification

The intra-firm network approach simulates many more actual intercity linkages than the classic gravity model based on the product of pairwise cities’ populations and squared geographic proximity. The network density in the CYRM increased from 0.129 in 2000 to 0.030 in 2014, and economic relations among the county-level units strengthened in this process. However, the overall network connections were weak, and they were obviously smaller than Tang et al.’s [51] corresponding findings on the CYRM using the gravity model. The CYRM has a long way to go to realize equalization and integration development.
Figure 7 shows the spatial evolution of intercity connections based on the headquarters–branch locations in the CYRM. It clearly reveals the stages and patterns of network generation among the administrative units. Generally, the spatial organization from 2000 to 2014 had three characteristics: Polycentrism, hierarchicalness, and boundedness. First, polycentric structures were increasingly prominent in the process. As the central city of central China, Wuhan initially (in 2000) maintained close interactions with Xiangyang, Yichang, and Changsha. Inter-provincial connections within the CYRM were confined to the Wuhan–Changsha dyad. As veritable sub-centers of Hubei Province, Xiangyang and Yichang developed intense economic ties with Wuhan, the CYRM’s mono-centre. In 2012, the three provinces entered into the Strategic Cooperation Framework Agreement on Industrial and Commercial Administration (SCFA-ICA), symbolizing a new period of market integration in the CYRM. The SCFA-ICA encourages the enterprises in the three provinces to invest across provincial administrative boundaries. Nanchang already was a rising star in the network evolution and reinforced the radiating power in Jiangxi Province while increasing its number of contacts with Wuhan and Changsha. Figure 7 indicates that the strengthening interprovincial linkages led to a progressively obvious polycentric structure by the end of the study period in 2014 (when Wuhan, Changsha, and Nanchang were considered the centers). Furthermore, the CYRM’s intercity network had a hierarchical nature with Wuhan, Changsha, and Nanchang as central nodes, other prefecture-level cities as sub-central nodes and county-level cities as subordinate nodes. Factors of administrative division were significant influences in the hierarchical network. Despite the implementation of the SCFA-ICA, the external linkages of the three central cities were mainly within their provincial administrative boundaries, except for those that existed among them. This finding could be interpreted as an ‘administrative regional economy’ phenomenon with a strong boundary effect [51]. Therefore, regional functional divisions and factor flows were severely restrained by administrative boundaries, which was not conducive to improving the efficiency of the spatial allocation of resources, reflected in non-optimal output allocation structures and non-optimal factor allocation structures. The central cities were more likely than the other cities to be the immediate beneficiaries of the implementation of the integration policy.

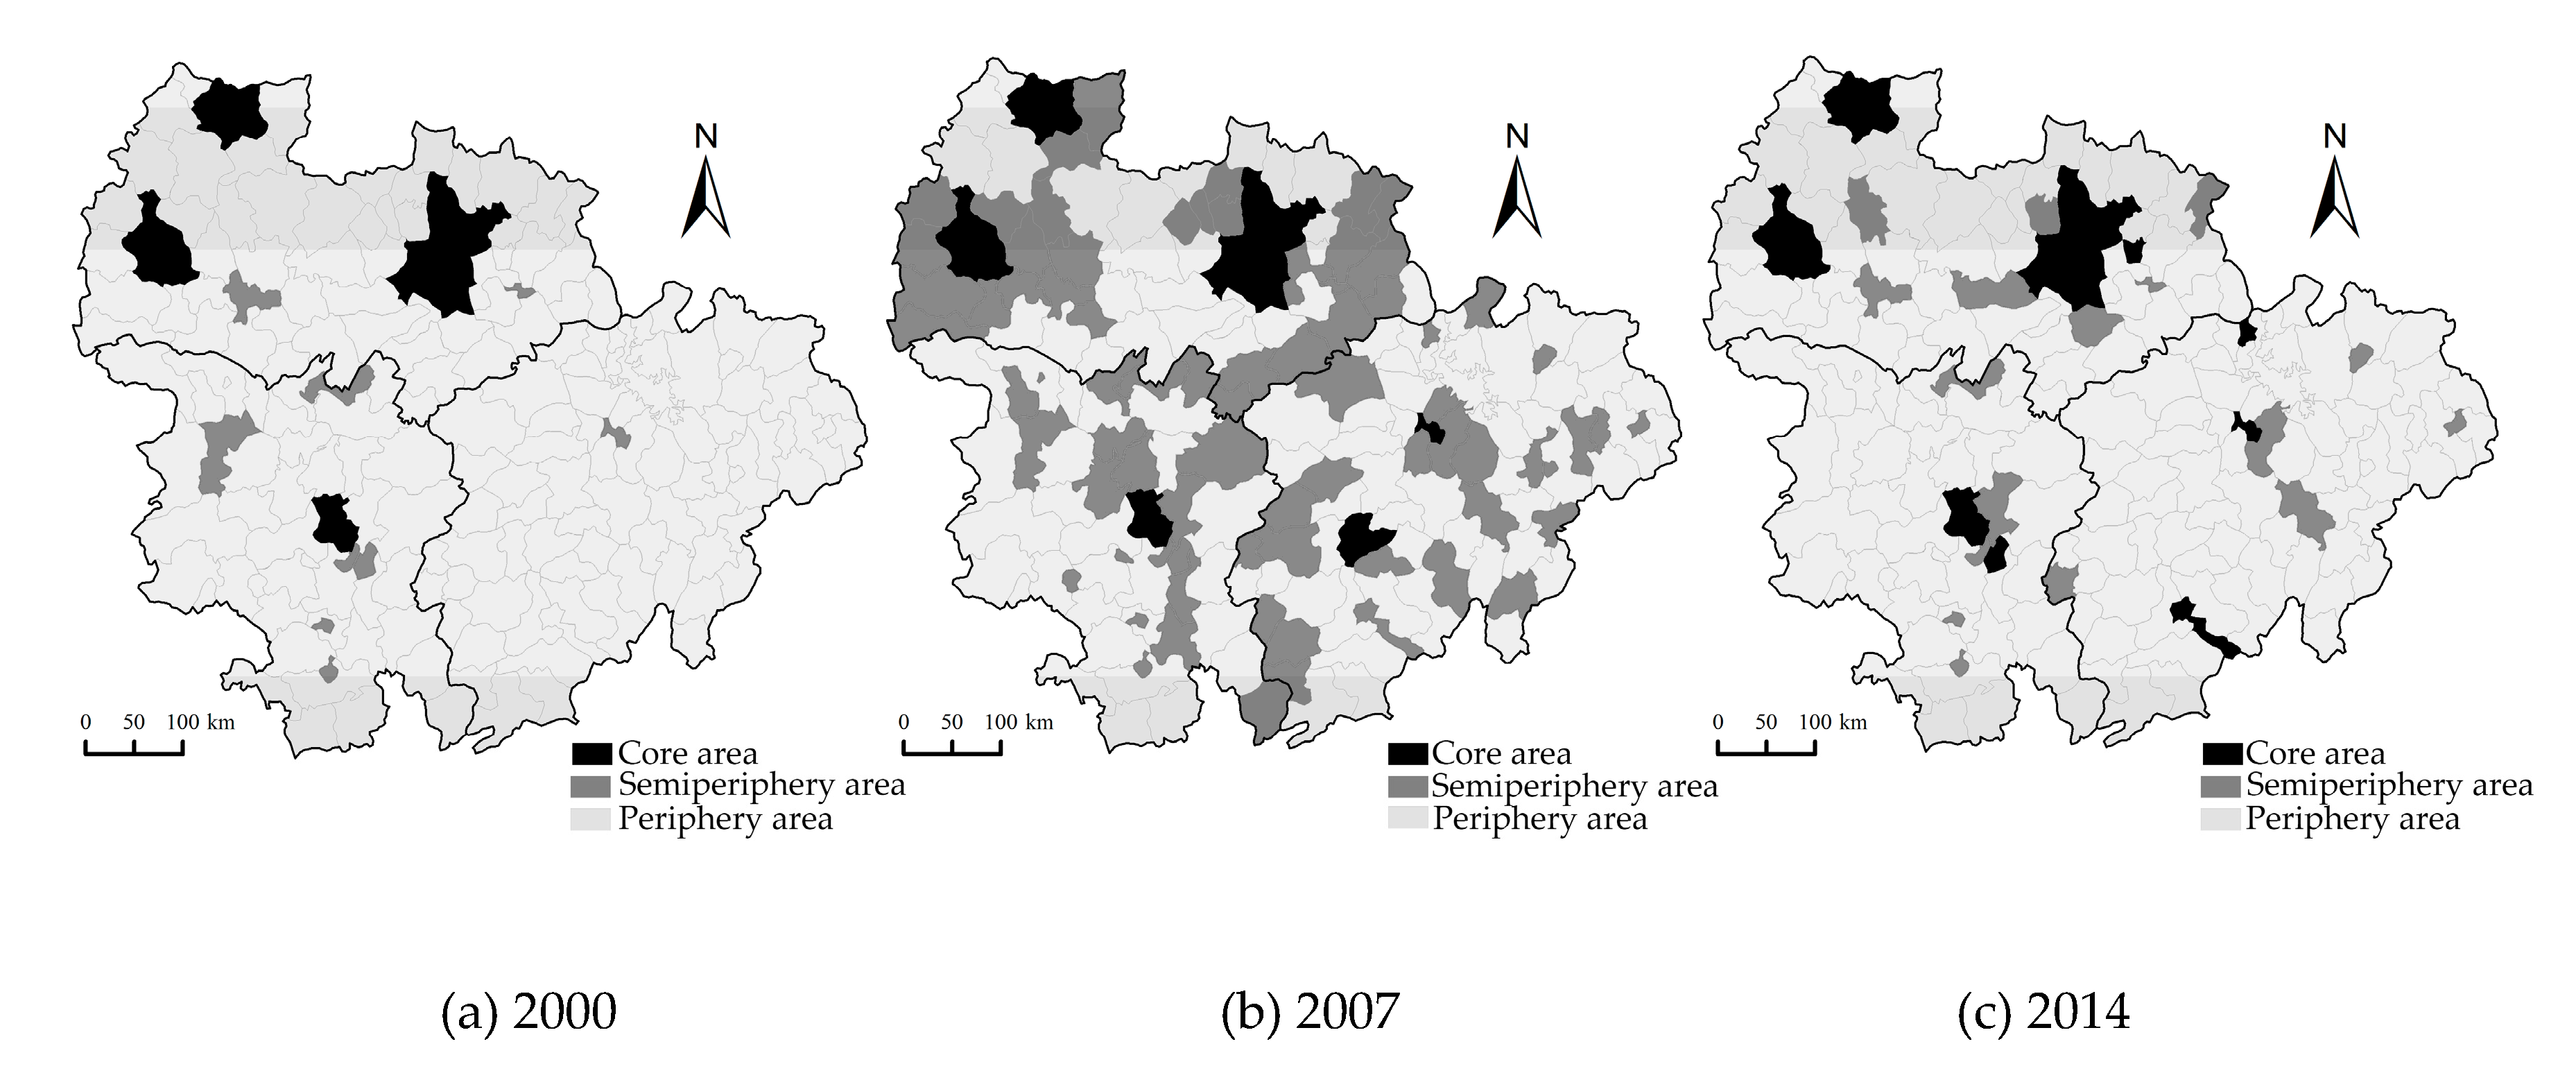
4.3. Hierarchical Structure Partition

Despite the prevailing regional economic integration process occurring under globalization, we must admit that the core-periphery structure of the global and/or regional economy is becoming more prominent. In the case of urban network integration, megaregions display not only hierarchical core-periphery relations, but also criss-cross relations among cities within the core and/or among cities within the periphery [52]. We introduced a three-class structure consisting of a core, semi-periphery, and periphery, as world systems theorists have done, to better depict the core–periphery structure in the CYRM. As shown in Figure 8, four core cities existed in 2000: Wuhan, Yichang, Xiangyang in Hubei and Changsha in Hunan. Almost all of Jiangxi Province is at the periphery. As the key industrial city in the automobile industry’s corridor, Xiangyang has been the tactic pivot for Hubei to join the regional and international competition. The prominent multiplier effect in the automobile industry partly explains the high degree of Xiangyang’s coreness. Moreover, just a few cities, with dispersed spatial distribution, displayed the semi-periphery structure, indicating a lack of strong interaction with the core areas.
However, this picture was different in 2007. Nanchang and Xinyu in Jiangxi Province rose into the core area, and many of the administrative units had close connections with the core cities and had developed to the semi-periphery stage. By embracing the urban network concept, municipal policymakers and urban planners are actively attempting to develop suburban and adjacent areas with the objective of spreading economic prosperity and enhancing the urban regions’ territorial competitiveness. Therefore, it is intriguing that polarization returned in 2014, with a few new cores emerging in Jiangxi Province. The intercity network structure in the CYRM underwent a ‘polarization–equilibrium–repolarization’ evolutionary stage. In fact, functional polycentrism could be described as a balance in the relative importance (centrality) of the constituent centers [52]. When a regional plan or policy is in place for these urban regions, even when that plan targets regional economic integration, the net result might be increased concentrated development in the core cities.
The hierarchical network organization yielded the cohesive subgroups that coexisted with the core-periphery structure. This reflects the importance of the associational benefits of cohesive subgroups [53]. To identify the subgroups, the CONCOR (the convergence of iterated correlations) method was performed in UCINET 6.0 to reveal changes. The results found that the 178 county-level units in the CYRM were divided into three subgroups at different scale levels. The first level was the megaregion, the second level contained four cohesive subgroups (subgroups A–D) and the third level contained eight subgroups (subgroups I–VIII). The subgroups are shown in Figure 9. During the study period, the evolution of the network subgroups in the CYRM for all industries had three major trends: Administrative boundary segmentation, structural solidification, and closing subgroup linkages. Geographically, in 2000, the spatial distributions of the second and third subgroup levels were relatively scattered, which was particularly evident for Subgroup C. During the following years, there was a convergence process resulting in four solidifying components in the second level. The spatial organization reflected the reinforcing role of the provincial administrative boundaries. Provincial borders seem to be a significant barrier to economic ties within CYRM due to the substantial autonomy of sub-national governments in policymaking and fiscal matters [54,55]. Concurrently, subgroups in the third level gradually developed into a pattern with closer linkage densities not only within the subgroups, but also among them. In 2000, two pairs of linkage were significantly close, that is, the linkage between subgroup VII and subgroup VIII and the linkage between subgroup VI and subgroup VIII. Most of the interactions occurred in Hubei Province because of the unparalleled economic status of the mono-centre, Wuhan. Subsequently, significant changes in the subgroups’ spatial patterns occurred in Hubei and Jiangxi provinces. Finally, four cohesive second level subgroups with relatively stable structures were observed, reflecting the influences of entrenched uneven development, fragmented geography, and economic and political policies.

5. Transportation Influences on Integrated Networks

This study used a panel data model to estimate the influences of transportation on the CYRM’s network structure. The sample includes 178 county-level units in CYRM for the 2000–2014 period. Combining the 178 cities at three time points (i.e., 2000, 2007, and 2014), we have formed a 534-observations balanced panel data, which will be dealt with by the appropriate panel data methodology. After generating descriptive statistics and correlation coefficients for descriptive analysis, an F-test, likelihood ratio (LR) test, and Hausman test were performed in EVIEWS 8.0 to select the optimal model for estimation. Table 3 shows the goodness-of-fit results of three regression models, that is, a pooled model (Model 1), fixed effects model (Model 2), and random effects model (Model 3). Based on the F-value (23.454) of the LR test and p-value (p < 0.05), Model 1 was rejected. Further, Model 3 was rejected based on the Hausman specification test results.
The Model 2 results shown in Table 3 indicate that the regression model with the dependent variable of degree centrality (DC) was a good fit to the independent variables because the adjusted R2 was significant (0.966). A large R2 value also indicates that the explanatory variables in the model explained most of the variation in the dependent variable. The empirical results supported all the hypotheses, and the explanatory variables’ coefficients’ signs were in the expected directions. Coefficients of Acc, PFA and PRSCG were statistically significant at p < 0.01 or p < 0.05, and PGDP as significant at p < 0.05, indicating that these factors were determinants of network position in this case. Moreover, positive coefficients indicate perfect synchronization between the independent variable and degree centrality and a negative coefficient means that the variable oppositely affected degree centrality. The negative coefficient sign on Acc means that a decreasing value in average accessibility attracted high degree centrality to the CYRM counties.
Stable fixed investments and marketization had marginal positive influences on the network positions because a 1% increase in the PFAI and PRSCG meant a 0.00017% and 0.00009% increase in DC, respectively. The market capacity also had a mild effect on the network structure because a 5% increase in the PGDP meant a 0.00013% increase in DC. These findings suggest that cities characterized by high socioeconomic performance have slight advantages in intercity interactions based on their intra-enterprise connections. Enterprises constantly adjust their strategic outlay to meet market demands and gain economies of scale and increasing returns. By contrast, the coefficient of Acc means that degree centrality was highly sensitive to the central cities’ accessibility because a 1% decrease in accessibility meant a 1.645% increase in degree centrality. This finding highlights the importance of transportation accessibility for economic development because it enables the movement of people and goods to support the functioning of the economy. Compared with those economic attributes, transportation accessibility to the three central cities plays a more determinant role in network participation for the peripheral cities. It confirms that cities in megaregions benefit from economic advantages stemming not only from their own dimension but also from the transportation linkage with core nodes in the network.
The CYRM, central China’s population and economic core, is similar to many other megaregions in that it has experienced significant urbanization, transportation network expansion, and implemented spatial policies intending to channel urban growth. Since the beginning of the 21st century, with the flourishing of the Yangtze River’s shipping business, land transportation in the CYRM has greatly developed. The Wuhan–Changsha–Nanchang (WCN) loop highways and loop railways around the three central cities particularly facilitated closer linkages among cities in the CYRM. The WCN loop highways pass through 22 county-level or higher cities, with an average distance of fewer than 50 kilometers among cities. Additionally, there have long been rail linkages among the three provinces. Since the bullet train began operating, travel among Wuhan, Changsha, and Nanchang takes about three hours. The transportation time cost has further decreased to about one hour in the era of high-speed rail. In 2009, the Wuhan–Guangzhou high-speed rail led to an economic boom in the Wuhan–Guangzhou economic beltway. The railway passes through the better developed regions in the CYRM, that is, Hunan and Hubei provinces. Similar to the internal collaboration observed in Section 4, Nanchang strengthened high-speed rail connections with Wuhan and Changsha in the last years of the research period, such as Nanchang–Jiujiang intercity rail operated in 2010 and Changsha–Nanchang section of the Shanghai–Kunming high-speed rail operated in 2014. Besides, a cooperate letter of intent on the demonstration area of comprehensive transportation in CYRM was signed in 2012 to realize the integration of multi-mode transportation. Large transportation infrastructure always launches in the provincial capitals because of the enormous demand for and financial support of it. The proximity to rail and road infrastructure and their provided access to centers of activities encourage business investment. Therefore, the easier it is for the peripheral regions to access the central regions, the higher the degree centrality of the network. Moreover, the improvement in counties’ abilities to access central cities might enhance the central cities’ economic radiation capacities, thereby further strengthening of core-periphery structure of intercity linkages.

6. Discussion

This study examined the development of economic integration in the CYRM from the perspective of intercity connections based on the intra-enterprise organization in all industrial sectors. The main contribution is its attempts to enrich the converging literature on intercity networks and regional transportation in China’s megaregions through a focus on inter-jurisdictional cooperation and integration. Specifically, it improves the analytical framework combining network approach, accessibility measurement, and panel data model, to longitudinally analyze the network-based economic integration progress of megaregions, and give accurate answers about how transportation accessibility affects the integration process. As Rivera et al. [56] found, conceptualizations of networks as static substrata of social interaction are giving way to an image of networks as continuously evolving over time. This longitudinal analysis over 14 years can uncover the dynamic process of economic integration in the CYRM. Besides, it selects local firms in all industrial sectors for network construction through big data mining, enriching our knowledge of region-building practices of the developing areas at local scale. Furthermore, the study firstly attempts to reveal the effect of transportation accessibility between core and periphery cities on network position. It is an effective supplement to comprehensive evaluations of integration with respect to megaregion policy. It may provide an implication on the importance of megaregional coordination of policies and remind policy-makers to consider inter-city connections in governance and planning of megaregions.
The case study on integration development in megaregions offers some interesting implications and ideas for rescaling development projects, particularly in developing countries and regions. Unlike the laissez-faire development pattern observed in Western countries, megaregion development in the CYRM is an outcome of carefully planned economic and administrative policies. The CYRM is in the development stage mainly characterized by within-province interactive networks evolving into a typical administrative-type structure. By 2014, the four detected subgroups correspond well with provincial administrative divisions as a result of the paucity of cross-jurisdictional connections. It is inconsistent with the key feature of developed megaregions, that is, the cities within megaregions are functionally networked beyond their administrative boundaries and are drawing enormous agglomeration externalities [19]. Simply assigning a name, such as ‘CYRM’, to a collection of towns and cities does not automatically meld them into a spatial and functional integrated city with economic complementarities and enterprises that benefit from region-wide agglomeration economies. Besides, the ‘polarization–equilibrium–repolarization’ evolutionary stage of the intercity network structure in the CYRM observed in the core–periphery analysis further implies that the net result of regional plans in the CYRM increased concentrated development in the core cities despite the integration target. The development of economic integration witnessed Wuhan, Changsha, and Nanchang’s reinforcement of primacy with respect to network position. Regional resources increasingly flowed to a handful of cities such as the three capital cities and Xiangyang, Yichang, and Changde. Therefore, the main policy focus should be that the CYRM’s provincial governments gradually abandon local protectionism and, to promote the flow of economic elements in a consolidated market, increase their concentration on public services, infrastructure development, and effective spatial decentralization policies.
In addition to fostering agglomeration externalities, regional plans/alliances also relate to a range of financial rights allocated by the central government and to massive infrastructure investments aimed at facilitating intercity interactions [57,58]. As shown by the panel data regression results, transportation accessibility to central cities significantly affected regional formations in the CYRM relative to socioeconomic performance. On the one hand, cities with relatively better physical infrastructure and transportation accessibility to central cities should benefit more from the lower transaction costs, larger market size, and a higher likelihood of attracting region-level development or investment. On the other hand, the evolution of spatial accessibility encourages further strengthening of the core–periphery structure of intercity linkages, which means a spatial mismatch between policy intentions and local economic development in CYRM’s region-building practices. Spatial inequality in transportation accessibility is regarded as the driver and the outcome of rising economic inequality. In addition to promoting local economic growth, transportation accessibility also depends on uneven economic development because improving physical connectivity requires substantial governmental financial support. For this reason, policymakers have a responsibility to recognize the vital relationships between economies and transportation accessibilities to central cities. It is imperative to avoid the siphoning effects that central cities can have on their peripheral areas by promoting equalization of basic public services and economic environments while rationally distributing transportation infrastructure.
This study has several limitations that suggest other methodological approaches for further research. One limitation relates to a concern about the representativeness of the intra-enterprise data. Although our data source is widely recognized as a valuable repository appropriate for detailed geographical research, the data only provide information on the headquarters–branch relationship. Some recent studies suggested that inter-enterprise linkages are essential contributors to the formation of intercity connections [59,60,61]. Thus, to gain better understandings of the mechanisms of megaregions, studies are needed about the linkages among various enterprises and economic sectors. Besides, quantitative analysis of institutional policy factors was not in our analytical framework. Finally, intercity flows of capital, information, and goods are not confined within regional boundaries; consequently, future research is expected to focus on comprehensive analyses of internal and external links among megaregions.

Author Contributions

Conceptualization, D.H. and Z.S.; methodology, software, and formal analysis, D.H. and P.G.; data curation, investigation, visualization, and writing original draft, Z.S. and P.G.; project administration and supervision, D.H.; writing review & editing, Z.S.

Funding

This research was funded by National Natural Science Foundation of China, Grant/Award Number: 41471138; the State Scholarship Fund of China Scholarship Council, Grant/Award Number: 201706145003; the Key Project of Chief Research Base of Humanities and Social Sciences of MOE, Grant/Award Number: 11JJDZH007 and 17JJD790007; ECNU Academic Innovation Promotion Program for Excellent Doctoral Students, Grant/Award Number: YBNLTS2019-032; and ECNU Scholarship Program for Graduate Students—Short-term overseas research scholarship, Grant/Award Number: 20190620014.

Conflicts of Interest

The authors declare no conflicts of interest.

References

  1. United Nations-Habitat (UN-Habitat). State of the World’s Cities 2010/2011: Bridging the Urban Divide; Earthscan: London, UK, 2010; pp. 8–10. [Google Scholar]
  2. Dewar, M.; Epstein, D. Planning for “megaregions” in the United States. J. Plan. Lit. 2007, 22, 108–124. [Google Scholar] [CrossRef]
  3. Regional Plan Association. Northeast Megaregion 2050: A Common Future; Regional Plan Association: New York, NY, USA, 2007. [Google Scholar]
  4. Bunnell, T.; Goh, D.P.S.; Lai, C.K.; Pow, C.P. Introduction: Global urban frontiers? Asian cities in theory, practice and imagination. Urban Stud. 2012, 49, 2785–2793. [Google Scholar] [CrossRef]
  5. Li, Y.; Wu, F. Understanding city-regionalism in China: Regional cooperation in the Yangtze River Delta. Reg. Stud. 2018, 52, 313–324. [Google Scholar] [CrossRef]
  6. Wachsmuth, D. Megaregions and the urban question: The new strategic terrain for US urban competitiveness. In Megaregions: Globalization’s New Urban Form; Harrison, J., Hoyler, M., Eds.; Edward Elgar: Cheltenham, UK, 2015; pp. 51–74. [Google Scholar]
  7. Harrison, J.; Hoyler, M. Megaregions: Globalizations new urban form? Edward Elgar Pub: Cheltenham, UK, 2015. [Google Scholar]
  8. Ye, L. Urban transformation and institutional policies: Case study of mega-region development in China’s Pearl River Delta. J. Urban Plan. Dev. 2013, 139, 292–300. [Google Scholar] [CrossRef]
  9. Li, Y.; Wu, F.; Hay, I. City-region integration policies and their incongruous outcomes: The case of Shantou-Chaozhou-Jieyang city-region in east Guangdong Province, China. Habitat Int. 2015, 46, 214–222. [Google Scholar] [CrossRef]
  10. Taylor, P.J.; Evans, D.M.; Pain, K. Application of the interlocking network model to mega-city-regions: Measuring polycentricity within and beyond city-regions. Reg. Stud. 2008, 42, 1079–1093. [Google Scholar] [CrossRef]
  11. Cheng, Y.; LeGates, R. China’s hybrid global city region pathway: Evidence from the Yangtze River Delta. Cities 2018, 77, 81–91. [Google Scholar] [CrossRef]
  12. Alderson, A.S.; Beckfield, J.; Sprague-Jones, J. Intercity relations and globalisation: The evolution of the global urban hierarchy, 1981—2007. Urban Stud. 2010, 47, 1899–1923. [Google Scholar] [CrossRef]
  13. Robinson, J. Global and world cities: A view from off the map. Int. J. Urban Reg. Res. 2002, 26, 531–554. [Google Scholar] [CrossRef]
  14. Marull, J.; Galletto, V.; Domene, E.; Trullén, J. Emerging megaregions: A new spatial scale to explore urban sustainability. Land Use Policy 2013, 34, 353–366. [Google Scholar] [CrossRef]
  15. Zhang, W.; Derudder, B.; Wang, J.; Witlox, F. An analysis of the determinants of the multiplex urban networks in the Yangtze River Delta. Tijdschr. Voor Econ. En Soc. Geogr. 2019. [Google Scholar] [CrossRef]
  16. Brenner, N. New State Spaces: Urban Governance and the Rescaling of Statehood; Oxford University Press: Oxford, UK, 2004. [Google Scholar]
  17. Scott, A.; Storper, M. Regions, globalization, development. Reg. Stud. 2003, 37, 579–593. [Google Scholar] [CrossRef]
  18. Jonas, A.E.G.; Ward, K. Introduction to a debate on city-regions: New geographies of governance, democracy and social reproduction. Int. J. Urban Reg. Res. 2007, 31, 169–178. [Google Scholar] [CrossRef]
  19. Gottmann, J. Megalopolis: The Urbanized Northeastern Seaboard of the United States; Twentieth Century Fund: New York, NY, USA, 1961. [Google Scholar]
  20. Su, S.; Liu, Z.; Xu, Y.; Li, J.; Pi, J.; Weng, M. China’s megaregion policy: Performance evaluation framework, empirical findings and implications for spatial polycentric governance. Land Use Policy 2017, 63, 19. [Google Scholar] [CrossRef]
  21. Florida, R.; Gulden, T.; Mellander, C. The rise of the mega-region. Camb. J. Reg. Econ. Soc. 2008, 1, 459–476. [Google Scholar] [CrossRef]
  22. Ross, C.L.; Woo, M. Megaregions and mobility. Bridge 2011, 41, 24–34. [Google Scholar]
  23. Meijers, E. From central place to network model: Theory and evidence of a paradigm change. Tijdschr. Voor Econ. En Soc. Geogr. 2007, 98, 245–259. [Google Scholar] [CrossRef]
  24. Neal, Z.P. From central places to network bases: A transition in the U.S. urban hierarchy, 1900–2000. City Community 2011, 10, 49–75. [Google Scholar] [CrossRef]
  25. Dematteis, G. Globalisation and regional integration: The case of the Italian urban system. GeoJournal 1997, 43, 331–338. [Google Scholar] [CrossRef]
  26. Ortega, A.A.; Acielo, J.M.A.E.; Hermida, M.C.H. Mega-regions in the Philippines: Accounting for special economic zones and global-local dynamics. Cities 2015, 48, 130–139. [Google Scholar] [CrossRef]
  27. Roy, A. The 21st-century metropolis: New geographies of theory. Reg. Stud. 2009, 43, 819–830. [Google Scholar] [CrossRef]
  28. Friedmann, J. China’s Urban Transition; University of Minnesota Press: Minneapolis, MN, USA, 2005; pp. 111–116. [Google Scholar]
  29. He, J.; Zong, Y.; Gebhardt, H. New spatial strategy in China: Major function zoning of Beijing-Tianjin metropolitan area with perspective from ecological economics. J. Urban Plan. Dev. 2011, 137, 484–494. [Google Scholar] [CrossRef]
  30. Kiggundu, M.N.; Deghetto, K. Regional integration: Review of the management literature and implications for theory, policy, and practice. Afr. J. Manag. 2015, 1, 303–332. [Google Scholar] [CrossRef]
  31. Paluzie, E.; Pons, J.; Tirado, D.A. Regional integration and specialization patterns in Spain. Reg. Stud. 2001, 35, 285–296. [Google Scholar] [CrossRef]
  32. Chung, H. Unequal regionalism: Regional planning in China and England. Plann. Pract. Res. 2015, 30, 570–586. [Google Scholar] [CrossRef]
  33. Duan, D.; Zhang, Y.; Chen, Y.; Du, D. Regional integration in the inter-city technology transfer system of the Yangtze River Delta, China. Sustainability 2019, 11, 2941. [Google Scholar] [CrossRef]
  34. Li, Y.; Wu, F. The transformation of regional governance in China: The rescaling of statehood. Prog. Plan. 2012, 78, 55–99. [Google Scholar] [CrossRef]
  35. Augustin-Jean, L. Urban planning in Hong Kong and integration with the Pearl River Delta: A historical account of local development. GeoJournal 2005, 62, 1–13. [Google Scholar] [CrossRef]
  36. Oizumi, K. The emergence of the Pearl River Delta Economic Zone—Challenges on the path to megaregion status and sustainable growth. Pac. Bus. Ind. 2011, 11, 2–20. [Google Scholar]
  37. Wang, L. High-speed rail services development and regional accessibility restructuring in megaregions: A case of the Yangtze River Delta, China. Transp. Policy 2018, 72, 34–44. [Google Scholar] [CrossRef]
  38. Yu, W.; Zhou, W. Spatial pattern of urban change in two Chinese megaregions: Contrasting responses to national policy and economic mode. Sci. Total Environ. 2018, 634, 1362–1371. [Google Scholar] [CrossRef] [PubMed]
  39. Wang, L.; Yang, W.; Yuan, Y.; Liu, C. Interurban consumption flows of urban agglomeration in the middle reaches of the Yangtze River: A network approach. Sustainability 2019, 11, 268. [Google Scholar] [CrossRef]
  40. Yu, Y.; Han, Q.; Tang, W.; Yuan, Y.; Tong, Y. Exploration of the industrial spatial linkages in urban agglomerations: A case of urban agglomeration in the middle reaches of the Yangtze River, China. Sustainability 2018, 10, 1469. [Google Scholar] [CrossRef]
  41. 11315 National Enterprise Credit System Home Page. Available online: https://admin.11315.com (accessed on 26 November 2015).
  42. National Enterprise Credit Evaluation Information Publicity System Home Page. Available online: https://www.zhengxinju.org.cn (accessed on 26 November 2015).
  43. Sun, Q.; Tang, F.; Tang, Y. An economic tie network-structure analysis of urban agglomeration in the middle reaches of Changjiang River based on SNA. J. Geogr. Sci. 2015, 25, 739–755. [Google Scholar] [CrossRef] [Green Version]
  44. Borgatti, S.P.; Everett, M.G. Models of core/periphery structures. Soc. Netw. 2000, 21, 375–395. [Google Scholar] [CrossRef]
  45. Zhang, X.; Guo, Q.E.; Cheung, D.M.W.; Zhang, T. Evaluating the institutional performance of the Pearl River Delta integration policy through intercity cooperation network analysis. Cities 2018, 81, 131–144. [Google Scholar] [CrossRef]
  46. Anas, A.; Arnott, R.; Small, K.A. Urban spatial structure. J. Econ. Lit. 1998, 36, 1426–1464. [Google Scholar]
  47. Fuglsang, M.; Hansen, H.S.; Münier, B. Accessibility analysis and modelling in public transport networks—A raster based approach. In Proceedings of the International Conference on Computational Science and Its Applications, Santander, Spain, 20–23 June 2011; Springer: Berlin/Heidelberg, Germany, 2011; pp. 207–224. [Google Scholar]
  48. Bono, F.; Gutiérrez, E. A network-based analysis of the impact of structural damage on urban accessibility following a disaster: The case of the seismically damaged Port Au Prince and Carrefour urban road networks. J. Transp. Geogr. 2011, 19, 1443–1455. [Google Scholar] [CrossRef]
  49. He, D.; Sun, Z.; Gao, P.; Lau, Y.Y. Spatial–temporal evolution of the port–hinterland relationship: A case study of the Midstream Yangtze River, China. Growth Chang. 2019. [Google Scholar] [CrossRef]
  50. Hausman, J.A. Specification tests in econometrics. Econometrica 1978, 46, 1251–1271. [Google Scholar] [CrossRef]
  51. Tang, F.H.; Tang, H.; Sun, Q.; Tang, D. Analysis of the economic network structure of urban agglomerations in the middle Yangtze River. Acta. Geogr. Sin. 2013, 68, 1357–1366. (In Chinese) [Google Scholar]
  52. Junde, L. Perspective of the ‘administrative region economy’ phenomenon in China’s transitional period—An introduction of human-economic geography with Chinese characteristic. Econ. Geogr. 2006, 26, 897–901. (In Chinese) [Google Scholar]
  53. Hanssens, H.; Derudder, B.; Van Aelst, S.; Witlox, F. Assessing the functional polycentricity of the mega-city-region of central Belgium based on advanced producer service transaction links. Reg. Stud. 2014, 48, 1939–1953. [Google Scholar] [CrossRef]
  54. Lee, P.K. Local economic protectionism in China’s economic reform. Dev. Policy Rev. 1998, 16, 281–303. [Google Scholar] [CrossRef]
  55. Batisse, C.; Poncet, S. Protectionism and industry location in Chinese provinces. J Chin. Econ. Bus. Stud. 2004, 2, 133–154. [Google Scholar] [CrossRef]
  56. Rivera, M.T.; Soderstrom, S.B.; Uzzi, B. Dynamics of dyads in social networks: Assortative, relational, and proximity mechanisms. Annu. Rev. Sociol. 2010, 36, 91–115. [Google Scholar] [CrossRef]
  57. Andrew, S.A. Regional integration through contracting networks. Urban Aff. Rev. 2009, 44, 378–402. [Google Scholar] [CrossRef]
  58. He, D.; Yin, Q.; Zheng, M.; Gao, P. Transport and regional economic integration: Evidence from the Chang-Zhu-Tan region in China. Transp. Policy 2019, 79, 193–203. [Google Scholar] [CrossRef]
  59. He, D.; Gao, P.; Sun, Z.; Lau, Y.Y. Measuring water transport efficiency in the Yangtze River economic Zone, China. Sustainability 2017, 9, 2278. [Google Scholar] [CrossRef]
  60. Lãœthi, S.; Thierstein, A.; Goebel, V. Intra- firm and extra-firm linkages in the knowledge economy: The case of the emerging mega-city region of Munich. Glob. Netw. 2010, 10, 114–137. [Google Scholar] [CrossRef]
  61. Yeh, A.G.O.; Yang, F.F.; Wang, J. Producer service linkages and city connectivity in the mega-city region of China: A case study of the Pearl River Delta. Urban Stud. 2015, 52, 2458–2482. [Google Scholar] [CrossRef]
Figure 1. Maps of the Central Yangtze River Megaregion (CYRM).
Sustainability 11 05401 g001
Figure 2. Building process for the producer services database.
Sustainability 11 05401 g002
Figure 3. Spatial distribution patterns of degree centrality in the CYRM (2000–2014).
Sustainability 11 05401 g003
Figure 4. Spatial distribution patterns of out-degree centrality in the CYRM (2000–2014).
Sustainability 11 05401 g004
Figure 5. Spatial distribution patterns of in-degree centrality in the CYRM (2000–2014).
Sustainability 11 05401 g005
Figure 6. Spatial distribution patterns of betweenness centrality in the CYRM (2000–2014).
Sustainability 11 05401 g006
Figure 7. Spatial evolution of intercity connections in the CYRM (2000–2014).
Sustainability 11 05401 g007
Figure 8. Core-periphery structure in the CYRM (2000–2014).
Sustainability 11 05401 g008
Figure 9. Cohesive subgroup locations in the CYRM (2000–2014).
Sustainability 11 05401 g009
Table 1. Six variables in the network analysis.
VariableEquationMeaning
Degree centrality/out-degree centrality/in-degree centrality D C i = j = 1 X i j / ( k 1 )
where D C i represents out-degree centrality or in-degree centrality of city i in the directed network while it indicates degree centrality in the undirected network. Analogously ,   X i j represents the directed connection value of city i and city j in the directed network, and it represents the undirected connection value of city i and city j in the undirected network; k is the number of nodes.
It represents the central position of a single city in an urban network; specifically, out-degree centrality indicates a city’s radiation capacity in a directed network whereas in-degree centrality indicates a city’s absorptive capacity in a directed network.
Betweenness centrality B C i = i j k g j k ( i ) / g j k
where   B C i denotes betweenness centrality of city i, g j k   is   the   number   of   the   shortest   paths   between   two   cities   j and   k ,   and   g j k ( i ) is the number of the shortest paths that pass through city i between j and k.
It indicates a strong brokering role, that is, controlling connections with others.
Connection intensity C I i = j = 1 C i j
where   C I i represents the connection intensity of city i, and C i j is the total number of headquarters–branch linkages between city i and j.
In contrast to degree centrality, it can be used to explicitly describe the spatial evolution of intercity connections.
Network density D = i = 1 j = 1 X i j n ( n 1 ) / 2
where D is network density, X i j indicates the directed connection is the number of existing connections, and n is the number of nodes in the network.
It measures the degree of linkages among nodes. The value of D should be between zero and one. When D = 0, there is no contact among nodes and all nodes are isolated from each other. When D = 1, all nodes are directly connected to all other nodes in the network.
Table 2. Speed of the main transportation modes.
Transportation ModeMaximum Design Speed (km/h)Grid Crossing Time (Minutes/0.3 km)
High-speed railway3000.06
Railway900.20
Expressway1200.15
National highway800.23
Provincial highway600.30
County road400.45
Land200.90
Lake118.00
Main stream of Yangtze River250.72
Tributary stream of Yangtze River200.90
Note: Land speeds were obtained from the Highway Engineering Technical Standard of the People’s Republic of China (JTGB01-2003).
Table 3. The regression results of panel data model.
Explanatory VariablesModel 1Model 2Model 3
Constant4.76670 ***
(5.620)
4.45997 ***
(9.202)
6.75049 ***
(26.088)
Acc−1.96248 ***
(−5.830)
−1.699246 ***
(−5.166)
−1.64511 ***
(−15.528)
PGDP0.00049 **
(3.442)
0.00018
(2.198)
0.00013 **
(2.957)
PRSCG0.00001
(0.273)
0.00006 **
(2.666)
0.00009 ***
(9.691)
PFAI0.00067
(9.883)
0.00027 ***
(6.246)
0.00017 ***
(8.683)
Adjusted R20.5320.5310.966
F-value84.102 ***83.690 ***83.934 ***
LR test 23.454 ***
Hausman test 170.545 ***
Number of observations534534534
Note: * = p < 0.10, ** = p < 0.05, *** = p < 0.01; numbers in brackets are t-values.

