Article

The Rediscovery of Brand Experience Dimensions with Big Data Analysis: Building for a Sustainable Brand

1
Seoul Business School, aSSIST, Seoul 03767, Korea
2
Business School Lausanne (BSL), CH-1022 Chavannes (VD), Switzerland
*
Author to whom correspondence should be addressed.
Sustainability 2019, 11(19), 5438; https://doi.org/10.3390/su11195438
Submission received: 12 August 2019 / Revised: 17 September 2019 / Accepted: 27 September 2019 / Published: 30 September 2019
(This article belongs to the Special Issue Marketing Strategies for Sustainable Product and Business Development)

Abstract

:
The brand experience research of Brakus et al. has provided new momentum in marketing literature with the concept of brand experience and predicting consumer behavior in 2009. Since then, brand experience has emerged as one of the solid academic constructs for branding and marketing scholars and practitioners who pursue this competitive strategy for sustainable growth in corporate management. The authors explore the new dimensions of brand experience with big data analytics for the first time in academic research. We propose a possible sixth dimension (“External”) of brand experience which includes sensory, affective, intellectual, behavioral, and social aspects drawn from previous studies. A new methodology for combining topic modeling and conjoint analysis is tested with big data-based multi-level compositions that overcome the limits of the traditional survey-based analysis. Moreover, the study reveals the decision-making frame which combines conjoint analysis and the dimensions of brand experience for practical implications. The novelty of this data-driven research and results contribute to new approaches in academia from the perspectives of brand experience dimensions, topic modeling, and conjoint analysis methodology development. Building sustainable brands, this study contributes to the ways of reading consumer behavior, evaluating the current status of the market and deciding the stimuli to affect consumer behavior.

1. Introduction

“Experience Is the New Brand” [1]. We are now in an era of new experiences. Two decades since Pine & Gilmore’s “Welcome to the Experience Economy” in 1998, we have reached a turning point [2]. In May 2019, the $2 trillion Star Wars: Galaxy’s Edge theme park opened in Anaheim, California, USA. The Star Wars theme park offers never-before-seen experiences as products with new technology [3]. The achievements and significance of experience-driven business, which builds the memorable experiences of consumers and is applicable to all entities and fields including Small Medium Enterprises, big corporations, Business-to-Consumer, Business-to-Business, manufacturing, technology companies, the entertainment industry, and the hospitality industry, can be found in a 2018 project by Forrest Consulting Group commissioned by Adobe [4]. Sustainable products, services, and business development, ultimately, stem from the demand to establish strategies to provide new experience-driven impact to consumers [5,6]. This study seeks to rediscover brand experience dimensions to complete the basic framework of such strategies.
The review of past research on brand experience pieces of literature indicates that customer satisfaction, loyalty, trust, word of mouth, and purchasing intention is the mediation effect of brand experience through the stimulation of antecedents [7]. In practice, however, firms face difficulties in building brand experience strategies due to the time gap in applying these research results to their business strategies. In particular, when new products and services must be launched during times of transition to a new change, shared economy, or platform business environment, firms must alter their perception and strategies towards consumer behavior under a digital transformation [8,9]. There are few studies on successful cases of brand experience as a strategy for sustainable product and business development that require the concurrent participation of consumers and economical utility. Thus, new approaches and methodologies suitable for this era of experiences and data-driven results are needed.
Research on brand experience reached a turning point in 2009 through the work of Brakus, Schmitt, and Zarantonello. The concept of brand experience proposed by these researchers refers to the subjective and intrinsic senses, emotions, perceptions, and behavioral responses experienced by the consumer as stimuli associated with the brand, including the brand’s design and identity, packaging, communications, and the environment [10]. Brand experience is embodied in four dimensions: sensory, affective, intellectual, and behavioral. Sensory brand experiences manifest through visual, auditory, olfactory, taste, and tactile senses; affective brand experience refers to the consumer’s emotional response; intellectual brand experience refers to cognitive stimulation, and behavioral refers to how the brand experience induces certain behaviors. Moreover, brand experience directly affects customer satisfaction and loyalty and has been empirically demonstrated to, directly and indirectly, induce consumer purchase behavior [10] (p.65).
In 1999, Schmitt presented the difference between experiential marketing and traditional marketing as “Brand = ID” versus “Brand = EX”. He proposed the “Sense, Feel, Think, Act, and Relate” dimensions of experience [11] (p. 60). While related dimensions are not included in the scale of Brakus et al. (2009) for inducing and measuring brand experiences, Nysveen et al. included social (relation) dimensions in their study on brand experiences within service organizations [12].
Since 2009, researchers have conducted numerous empirical studies on the antecedents of brand experience that directly and indirectly cause brand experiences, such as event marketing, brand contact, and brand-related stimuli, including design and identity, packaging, communication, environment, storytelling, and perceived usefulness and trust [13,14,15,16,17,18,19,20,21,22,23]. Studies have also investigated the direct and indirect effects of brand experience and its consequences, including customer satisfaction, brand loyalty, brand attitude, brand credibility, brand equity, purchase intention, and word of mouth [24,25,26,27,28,29,30,31,32,33,34]. The construct of brand experience has become a major area of research that forms, maintains, and describes the relationship between brands and consumers.
In the modern era, digital transformation demands that technologies are integrated and utilized with the products, processes, and organizations that form the basis of the experiences in product and consumer relationships [35]. Firms and brands are exploring strategies to discover and nurture consumers and continuously provide experiences to them throughout the consumer journey, retaining them for long periods. Firms are acquiring experts and constructing infrastructure systems to read and analyze customer responses in real-time. This trend resembles the shift from traditional brand identity strategies that simply communicate messages to brand experience-centered strategies predicted by Schmitt (1999). In this trend, firms seek to simultaneously establish and implement strategies that integrally align brand experiential factors. Numerous global firms are already building integrated experience strategies that share design, services, product, and consumer experiences among internal employees and partners.
As a strategic decision-making framework that can be applied practically, the four dimensions of the brand experience model proposed by Brakus and his colleagues in 2009 can be used to establish the experience strategies needed to develop products, services, and businesses. Since 2013, however, there has been little research on the dimensions of this model. Additionally, there is a current lack of research on frameworks that can observe and reflect consumer behavior from the perspective of brands. The brand experience dimension model presented by Brakus et al. requires innovative reinvention [36].
Accordingly, we conducted a study on brand experience dimensions as part of a decision-making framework for the sustainable management of firms and brands. This study employed big data to investigate methods of observing consumer behavior, thereby extending beyond the confines of existing survey-based methods in research. To establish brand experience dimensions, we observed consumer behavior and constructed a methodology for discovering the brand experience dimensions, which we compared with existing brand experience dimensions to explore new dimensions possibility. After analyzing a vast number of texts processed through natural language processing, this study derived keywords on consumers’ experiences of specific brands through topic modeling. The derived keywords were compared with previous research on dimensions to confirm the proposed methodology’s validity and the possibility of new dimensions. Subsequently, through conjoint analysis, we investigated the composition and relationship of the brand experience dimension of each brand. We hope that the proposed method will be utilized in the early stages of sustainable product and sustainable business development and in solving marketing issues, thereby facilitating decision-making and the establishment of brand experience strategies. Furthermore, this study provides new perspectives for the methodology for researching constructs of consumer behavior and brand experience dimensions.
Our goal is researching brand experience dimensions by reading consumer experience through big data analysis. For that, we build up new methodology combined topic modeling and conjoint analysis with data with collected open data. This study will provide academic achievements as the origin of new methodology and finding of the brand experience dimensions. Simultaneously, this approach provides practical implications for strategic decision-making.

2. Literature Review

Through the literature review, we examined research on brand experience dimensions. We also conducted a literature review of consumer behavior research methods. Since the proposal of the brand experience dimension model in 2009, most studies adopted a survey-based research methodology and empirical methodology. However, we required new research methods to examine modern consumer responses from an exploratory perspective [37]. Thus, we investigated the construction of a methodology for observing consumer behavior using big data.

2.1. Brand Experience Dimensions

In the study of Brakus, Schmitt, and Zarantonello (2009), based on philosopher John Dewey’s (1922,1925) perspective that “an intellectual experience from knowledge,” the origin of brand experience dimensions in the literature can be linked; that is, experience “includes perception, senses, and behavior through awareness” [10,38,39,40]. After considering the “pleasure dimensions” distinguished by Dubé and Lebel (2003) into intellectual, emotional, social, and physical pleasure, we reviewed the four mental modules of Pinker (1997), a cognitive scientist, in response to the experiences assumed by Dewey: sensory perception, feeling and emotions, creativity and reasoning, and social [41,42]. Moreover, regarding experienced marketing and management literature, we can confirm the dimensions of sensory/aesthetic, intellectual/educational, and emotional/entertaining of “staged experience” in retail environments and events proposed by Pine and Gilmore (1999) [2]. We also discovered the five experiences proposed by Schmitt (1999) (sense, feel, think, act, and relate) to build the dimensions [11]. Jennifer L. Aaker’s Dimensions of Brand Personality (1997) notes that the Big Five Dimensions—sincerity, excitement, competence, sophistication, and ruggedness—are confined to the field of psychology, and brand experience stems from an integrated perspective from the backgrounds of various fields [33]. After reviewing several experiential brand survey techniques and selecting dimensions that reflect the literature and descriptions of consumer perception, thereby verifying the model fit through an empirical study, a novel brand experience conceptual model is proposed. Its dimensions include sensory, affective, behavioral, and intellectual [10].
We were able to find similar trends in consumer experience research. The 3F framework of fantasies, feelings, and fun, based on the subjective aspects of consumer experiences, were discovered from the multi-sensory, fantasy, and emotive aspects in product use proposed by Holbrook and Hirshman [43]. In addition, Pine and Gilmore (1999) presented the 4E framework of entertainment, esthetic, education, and escapist as the basis of the consumer experience construct, based on absorption, immersion, passive, and active participation through the degree of consumer behavior and participation in events [2].
Zalantonello and Schmitt conducted a consumer behavior prediction study using the 2010 brand experience scale. Based on an analysis of consumer type, while there is no direct impact on the dimensions, five types of consumers were presented: hedonistic, action-oriented, holistic, inner-directed, and utilitarian [44]. In a study on brand experience in service organizations, Nysveen, Pedersen, and Skard (2013) demonstrated the effectiveness of the relational dimension in a service context, thereby going one step further from the brand experience dimension research using product brands of Iglesias et al. [12,24].
Since then, there have been a few more studies on brand experience dimensions. In 2015, through a literature review of existing brand experience research, Khan and Rahman proposed a conceptual development of the brand experience model as a current and future topic for research on the antecedents and consequences of brand experience [7]. Santini et al. (2017) proposed a brand experience extended model through a study employing meta-analysis and showed direct relationships between brand experience and brand outcomes [45]. However, we found no studies on the dimensions of the existing model. In 2018, Andreini et al. proposed the expandability of the brand experience model to micro, meso, and macro levels through relationship theory, service-dominant logic, and consumer culture theory. They also expanded this perspective through brand meaning, marketplace interactions, and culture and marketplace formation [36].
Our review of trends in existing literature confirmed that to date, numerous studies have mainly cited the model presented by Brakus et al. on brand experience dimension. In that case, will the present study confirm this model again? Of course, the attempt would be meaningful. However, the business environment has drastically changed in many aspects from 2009 to 2019, with numerous developments still underway. Therefore, rather than reproducing current research methodologies that include the literature, research brands, and surveys reviewed by Brakus and his colleagues, we could devise a helpful solution for brand management regarding academia and practicality by exploring the changes in dimension attributes or discovering new dimensions in the existing contexts. Moreover, we paradoxically attempted to exclude research bias to construct a framework to apply the research methods to future studies. For now, we have put aside the existing brand experience dimensions model and attempted to discover the brand experience dimensions from an exploratory research perspective, as proposed by Stebbins [46].

2.2. Research Method for Consumer Behavior

Researchers have studied brand experience as the basis for dimensions regarding consumers’ subjective responses. For the model of Brakus et al., the main dimensions extracted from the literature review and the selected experiential brands were subjected to several stages of surveys to introduce new dimensions; factor analysis and structural equation modeling were additionally conducted, thereby verifying the effectiveness of the research model. In Zarantonello’s brand experience and consumer type research, the survey results were classified via clustering, and consumer types were proposed using the existing experience dimensions [44].
The recent big data research method is a data mining research technique that utilizes vast amounts of data, going one step further than theory-based research [47]. As information technology constantly evolves, Internet speed increases and smart mobile devices spread and increase in usage, the vast amounts of data produced by consumers are accumulating exponentially, especially texts, images, and videos that become data for research on consumer behavior. Sicular, the research director of Gartner Inc., stated in a 2013 Forbes magazine column on big data that while the 3V attributes of big data (high-volume: vast amounts of data; velocity: the rate of change of data through various links; and variety: the variety of data) are important, processing big data requires innovative and cost-effective solutions that enhance insights and aid decision-making [48]. Through these solutions, big data can now overcome the hurdles of data acquisition in management activities such as academic research, marketing, and branding; it has enabled the analysis of numerous types of data in large quantities. Moreover, it has played a role in facilitating strategic decision-making through patterns, trends, insights, and predictions that were difficult to uncover through existing survey and interview-based methods [49,50,51].
Hofacker, Malthouse, and Sultan (2016) proposed the feasibility of studying consumer behavior through big data at each stage of the consumer decision-making process, which is a component of the consumer behavior model: problem recognition, search, alternative evaluation, consumption, post-purchase evaluation, and post-purchase engagement [47]. The mutual psychological model of consumer behavior constructed by Blackwell, Miniard, and Engel (2005) suggested that consumers’ various problem-solving activities arising from exchanges between customers and businesses form the basis for understanding consumer behavior [52]. Ginsberg, Mohebbi, and Patel (Google Inc.) and Brammer, Smolinski, and Brilliant (Centers for Disease Control and Prevention, USA) analyzed users’ Google search results to predict the spread of influenza, while Goel, Hofman, Lahaie, Pennock, and Watts used search data to predict box office sales before a movie’s release [53,54]. Choi and Varian’s research, employing Google’s trends and search queries, has emerged as a solution for consumer behavior research methods that had difficulty explaining observations in existing surveys or labs [55]. Lorigo, Pan, Hembrooke, Joachims, Granka, and Gay (2005) conducted an observational study that showed different patterns by task and gender in consumer behavior exhibited through simple information searches, the movement to specific brand webpages, and product purchasing. Through this, they proposed the importance of analyzing search results [56].
In “Social Science in the Era of Big Data,” (2013) González-Bailón emphasized the importance of researchers understanding interpretations and context in contemporary social science research when utilizing big data [35]. Hofacker, Malthouse, and Sultan have been increasing their utilization of consumer behavior research through big data. However, they noted that both researchers and marketers must fundamentally adhere to ethical considerations and approaches to consumer privacy related to data collection [49].
Text mining, also referred to as text data mining and equivalent to text analytics, is the process of extracting advanced information from sentences using special patterns or statistical methods from unstructured data; that is, text data [57]. Text mining consists of information extraction, text categorization, text clustering, concept/entity extraction, production of granular taxonomies, sentiment analysis, document summarization, and entity relation modeling (for example, learning relations between named entities) [58,59]. Text mining is generally used for parsing or extracting desired information in a certain pattern or order from a document while removing other information, as well as substituting data into a database, finding patterns in structured data, and evaluating and analyzing results [57]. Text mining requires a remarkable combination of relevance, novelty, and interest. It can be divided into two processes: data processing and data analysis. The processing and analysis functions of preprocessing, association, clustering, summarization, and categorization can be generally performed [58]. Preprocessing is a series of processes for refining the prepared data using natural language processing. Association searches for associations based on the frequency of co-occurring words. Clustering is the process of clustering similar objects into the same group. Summarization summarizes important concepts in the text, while categorization classifies text into predefined categories [60]. Through opinion mining and sentiment analysis, Pang and Lee (2008) showed that it is possible to predict, evaluate, classify, cluster, and summarize data on consumer behavior by analyzing the context of text recorded and shared on social media platforms such as Twitter and Facebook [61]. A study evaluating users’ experiences through an online review analysis for Amazon Echo (Hwang, Shim, and Choi, 2016) and a recent study for analyzing online car reviews (Kim, Chun, 2019) showed that text data could be used to infer user experience and consumer behavior [62,63].

3. Research Design

We designed the scope and targets of research, data collection, processing, and analysis.

3.1. Background

For the brand experience dimension study, Brakus et al. (2009) used approximately 70 brands and numerous surveys and literature to complete the corresponding dimension descriptions. This study utilizes big data rather than reproducing the same methods of these researchers. Thus, using smartphone brands with ample data on consumer life and interactions of the digital environment, the research sample that was selected had the highest rate of smartphone usage; thus, the results could be generalized through the consumer behavior analysis while considering the market share of specific markets. Since the keywords become the data of research, to smoothly derive cultural and contextual insights from the meaning of the keywords during processing after extraction, the study was conducted in the language of the country in question. However, when describing the results, we chose to translate the content into English, which is a widely understood language. In this section, while there is room for the subjective interpretation by the researchers, this method has been used in numerous existing studies on meaning and context analysis and is appropriate for conveying the results of this study [64].
We configured the research subjects to obtain the raw data for reviewing the validity of the research method. The Pew Research Center’s February 2019 research report states that half of the world population of five billion own smartphones and have varying degrees of service and experience, though this varies by region and speed of economic development. The country with the highest proportion of ownership, in terms of population, is South Korea [36]. This study was conducted using Korean consumers, who reside in the world’s first market commercialized for 5G service and a testbed for new communication technologies ripe with competition. It would also serve as a reference to global companies and brands considering entering the Asian market through the Korean market [37].
Thus, to uncover the brand experience dimensions, we preprocessed and classified the keyword data by morpheme, constructed the final data set for research, and performed topic modeling to derive the keywords for each brand. Next, we analyzed the brand experience dimensions using each keyword and conducted a semantic comparison with the existing literature. Finally, through conjoint analysis, we analyzed the characteristics of the brand experience dimensions of the individual brands and confirmed the validity of the research model. Accordingly, this study built a framework connected through big data, collection-topic, and modeling-conjoint analysis for brand experience strategic decision-making.

3.2. Brand Selection

Since the launch of Apple’s iPhone in 2009, the global smartphone market has rapidly made people’s daily lives digital-focused [65]. Global smartphone penetration is approximately 2.5 billion, with Korea holding the highest smartphone penetration rate at 95% [66].
As of April 2019, the total population of Korea, which launched the world’s first 5G service in 2019, was approximately 51,709,000. A 2018 Pew Research survey found a mobile phone penetration rate of 100% and a smartphone penetration rate of 95%. A social media usage rate of adults 18 and older was at 76%. In the first quarter of 2019, Samsung accounted for 65% of the smartphone market, followed by Apple (18%), LG electronics (16%) and others (2%) [66,67,68].
For the brand experience dimension study, in addition to the top brands in the Korean smartphone market as of 2019 (Samsung, Apple, and LG), we also selected other global players: Huawei and Xiaomi [69]. All five brands conduct business in Korea and offer various sub-brand products for each brand in the market. Their offerings include high-end premium phones to low-end mass-produced ones, and each brand is competing for Korean consumers. Figure 1 shows our research process.

3.3. Data Collection

The first thing noticed with regards to data collection is the vast amount of search results recorded in consumer digital environments. Smartphone brands have become the base of modern consumers’ digital lives; the brand-related stimuli experienced by consumers are represented by the variety of text that encompasses their smartphone product information, purchasing experiences, product use, and anticipation for new products. At the same time, these stimuli are the direct and indirect responses that consumers produce. Moreover, consumers’ search behavior to find such content is the result of their current interests and a direct projection of their thoughts [36].
Thus, to efficiently perform the keyword semantic analysis, we must solve complex tasks regarding context, big data, text mining, and brand experience to analyze consumers’ detailed linguistic characteristics. Hence, we decided to collect data from the portal site Naver, which is a search site in Korea with the largest database of consumers in their 30s and 40s and an extensive review functionality [70].
Services provided by Naver include search, blog, post, map, and shopping, which can all be accessed via PC and mobile. The data collection was performed through the Naver blog and posts. Regarding the data, the search terms were selected for all blog content before the day of research (June 9th, 2019). In the data collection stage, we confirmed that some commercial content derived from the search results were classified as images; as a result, they were not searched by keyword but affected filtering.
We combined the core keywords of each brand with the combination of the representative brand and the product model, as well as 5G, a special connection term, with smartphone use. For certain smartphone models, we included the English brand name in the search term. Table 1 lists the search terms by brand. The open-source program python (version 3.7.3) was used to crawl the raw data for blog post collection. We deleted the duplicate data after reviewing the articles within the entire set of collected data, as well as content written in Chinese or English and content without text. Meaningless data that only contained lists of smartphone names was also deleted, e.g., Note 2, S10, S10 Plus, S10 Edge, S9, and S9 Plus.

3.4. Data Preprocessing

An open program of Ulsan University Korean language institute was used to analyze the morphemes. As a result of the morpheme analysis, ‘NNG’ (common noun), ‘NNP’ (proper noun), ‘VV’ (verb), and ‘VA’ (adjective) were selected. To clarify the meanings of the words, the nouns of the smallest units were converted to compound nouns and processed, as shown in Table 2; thus, the meanings could be conveyed.
Words that were not meaningful were deleted through stop word processing, as well as duplicate data. The raw data was then transformed through a document-term matrix, producing the final data set for analysis containing only words mentioned at least 30 times by the tf-idf (term frequency-inverse document frequency) function: LG (keyword: 304, 4618), Huawei (keyword: 266, 3654), Xiaomi (keyword: 212, 3215), Samsung (keyword: 249, 3645), and Apple (keyword: 355, 7132).

3.5. Methodology

3.5.1. Topic Modeling

Topic Modeling assumes that one document is a mixture of topics [58,59]. Latent Dirichlet Allocation (LDA) is a typical statistical technique for inferring the topic of a document [58]. The LDA algorithm assumes that the words that appear in the document are related to each other and posteriorly infers the conditions that form the polynomial distribution of words. In LDA, the subject can be defined as a polynomial distribution of words [60]. As LDA can automatically identify topics in unstructured data and identify words associated with them, it is frequently adopted in text mining studies or research involving review [60]. Jo, Oh (2011) conducted a study using the LDA algorithm to uncover the sub-factors of lens, zoom, and the like in Amazon reviews on cameras, demonstrating the feasibility of finding necessary marketing and user experience insights [61]. It is easier to interpret the results of LDA than those of other topic modeling methods, such as Latent Semantic Analysis (LSA) [60]. In computations in qualitative research, the ability to discover various topics by reducing the dimensions of unstructured data shortens the researcher’s time and effort, making this method suitable for big data studies [61]. As research on experiential aspects often involves finding the sub-factors of consumer responses, topic modeling is applicable to these studies.
By applying LDA based on the algorithm proposed by Blei, we used the open-source program R (version 3.6.1), slam package and topic models. We classified the 20 topics and 15 terms based on the extracted keywords with similar meanings for each brand.

3.5.2. Brand Experience Dimension Analysis

The topics were classified in terms of similar meaning, and matching was attempted with the brand experience dimensions of the previous literature to present semantic explanations [71]. Proposals of the existing and new dimensions based on the topic and brand experience dimensions can be confirmed.

3.5.3. Conjoint Analysis

Conjoint analysis is a methodology that facilitates the information processing and decision-making required for market research by performing measurements of consumer choice in marketing [58,59]. This method assumes that consumers collect the value of each attribute of a product or service and make a comprehensive assessment [60]. The conjoint analysis provides a series of valuable information on the attributes of a potential product or service to be provided to the consumer. Therefore, most marketing practitioners and researchers use conjoint analysis for new product market discovery, market segmentation, appropriate pricing, and advertising strategies [61]. Moreover, firms can make efficient decisions from the characteristics of various products and revenue. Product developers can also optimize product planning to maximize profits and respond to competition in the marketplace [62]. This method, which has been widely adopted by academics and practitioners since the 1970s, has also been used in consumer goods, industrial materials, and public and financial services [63]. Of course, conjoint analysis suffers from several difficulties in developing new ideas when compared to Delphi, Roadmapping, and Scenario. These include the problem of a large number of alternatives to consider when accounting for many attributes; the fact that surveys of customer preference take place before product development, forcing the surveys to consider both a hypothetical reality and realistic concerns; and the technical problem in which the survey itself differs with the participants’ responses [64]. Nevertheless, conjoint analysis can consider various markets through an experimental approach combining many attributes. It induces realistic decision-making through comprehensive evaluations of product characteristics and allows for uncorrelated attributes, thereby avoiding problems with multicollinearity that plague observational studies. Moreover, the method does not make any assumptions about the nature of the relationship between the attributes and dependent variables and considers unknown variables as potential predictors of the dependent variable [65,66].

4. Results

Using the sample text extracted for five smartphone brands in Korea, we conducted the following: 1. Semantically group the results of topic modeling and classify as one keyword, 2. Perform a comparison with existing brand experience dimension literature and extract attribute and level, and 3. Perform a conjoint analysis for each brand.

4.1. Topic Modeling Result

Table 3 shows the derived topic and clustering results. We assigned comprehensive descriptions to the characteristics of the cluster shown on the left side of the table after a topic analysis. In the case of the same English word, “Price” was assigned to “Event” when the meaning was providing a discount on the device, and when the meaning was price competition among products, it was classified as “Review.” “Feature” encompasses keywords related to the functions of each brand. “Event” comprises product launch events, promotions, and discount policies. “Service & Partner” relates to partners who provide services and benefits such as subscriptions, plans, and post-service for smartphone use. “Review” contains descriptions of the product and keywords that include information and judgments to inform others. Negative expressions were separated from the other keywords and classified as “Negative Expressions.” Finally, references to other brands and national and global terms were classified as “Other Brand” & “External.”
By examining the keywords of “Feature” by brand, the terms “Spec,” “Screen,” “Photo,” “Model,” and “Tech” were derived for LG. The word “Model” was assumed to refer to the recent television commercial model (Peggy Gou), which is predicted to be the result of communication using a famous model, the only case out of the brands. “Folding,” “Screen,” and “Security” were derived for Huawei, which can be attributed to consumers’ interest in the folding phone introduced at the 2019 World Mobile Congress (WMC). In addition, keywords related to 5G security issues were derived as well. The keywords “Color”, “White”, “Red”, “Gaming”, “Battery”, “Camera”, and “WiFi” were derived for Xiaomi. These include specific references to color, game-specific products, Xiaomi’s portable battery, and the use of wireless communications. For Samsung, “Fold,” “Movie,” “Camera,” “Screen,” “Spec,” and “Display” were derived. Keywords related to display, image quality, new products, and OLED technology were derived. Finally, “Screen,” “Camera,” “Photo” and “Case” were derived for Apple, in addition to “Notch,” Apple’s screen design, “Design,” “Patent,” and “Case,” a phone accessory.
Huawei did not have a keyword mentioned in “Event,” while Xiaomi had “Launch,” LG and Apple had “Launch,” “Price,” and “Experience,” and Samsung had “Unpack” and “Reservation.” Conversely, “Experience” was not derived.
In “Service & Partner”, Samsung and Apple did not derive any keywords. In contrast, “After Service,” “Fee,” “Google Play,” and “U Plus” were derived for LG. (“U Plus” is a domestic wireless service provider, a family company under the LG parent group.) Additionally, Google Play is an app and “U Plus” is a service purchasing payment agency in Korea. “U Plus” and “Hardware” were derived for Huawei, where “Hardware” refers to equipment, which includes issues related to the delivery of Huawei equipment to major Korean telecom companies. “Qualcomm” and “Market” were derived for Xiaomi, where “Market” was classified as Partner in the sense that other products coexist with Xiaomi in the Korean market.
In “Review,” “Premium,” and “Possible” were derived for LG. For Huawei, “Big”, “First”, and “Price”; for Xiaomi, “Bang for the Buck”, “New Style”, and “First”; for Samsung, “Big”, “New Style”, “First”, “Fast”, “Good”, and “Multiple”; and for Apple, “Big”, “New Style”, “Fast”, “Good”, “Multiple”, and “Same”. The review contains keywords that relate to consumer responses to the latest products from each brand, as well as comparisons of the features of flagship products and recent product trends. These keywords are also valuable as they extend beyond individual evaluations and influence their surroundings as well.
For “Negative Expression,” “None Exist” was derived for all brands. The meaning slightly differs by brand (such as absence, lack, reason, after service, and plan.). Therefore, rather than individually distinguish their meanings, we determined that it would be suitable to classify them as negative feedback as a whole. For Huawei, “Expelled” is inferred to refer to negative news generated by security issues in the first half of 2019. For Xiaomi, “Not working” refers to product malfunction, while Samsung’s “Problem” can be attributed to anomalies in new Galaxy products.
“Other Brands” refer to the competitive or related brand, and “Outside” refers to the unexpected keywords that come from outside of the brand. Although this study is limited to the Korean market, it is evident that globally connected news and issues are also linked to consumer responses. Additionally, these are not internal factors but the external factors of a brand. We can infer that consumers are responding in relation to comparisons with other brands and social interest. For LG, “Samsung,” “Galaxy” and “iPhone” were derived, while Huawei showed “Samsung,” “Galaxy,” “Apple,” “Xiaomi,” “USA,” “China,” “Government,” “Global,” and “Market.” These show us that President Donald Trump’s ban on Huawei is judged to have influenced the derivation of those keywords. “Hong mi,” “mi,” “Samsung,” “Galaxy,” and “Huawei” were derived for Xiaomi, “iPhone,” and “USA” for Samsung, and “Galaxy,” “Foldable Phone,” and “Samsung” for Apple.
To derive the keywords, it is necessary to understand the context surrounding the topic that includes the keyword. When the meaning is ambiguous, we attempted to figure out the meaning and context to the extent possible by re-searching the search history. These are limitations to the generalization of subjective keyword clustering, which is a unique feature of exploratory semantic analysis.

4.2. Brand Experience Dimension Analysis

As also mentioned in the study by Brakus et al. (2009), not all brand experience dimensions (Sensory, Affective, Intellectual, and Behavioral) can be accurately matched one-to-one with consumers’ responses. For example, sensory responses may cause behavior, and two or more responses can be expressed in a complex manner. However, this study required the assumption of one-to-one matching of a topic with a particularly strongly expressed dimension. Thus, to minimize researcher bias and facilitate neutral descriptions, we found it preferable to match the topic with the corresponding model of a previous study and review the feasibility of adopting a new dimension for the remaining keywords. This is summarized in Figure 2.
  • The topic corresponding to “Sensory” is “Feature,” a keyword relating to the product’s functionality. The color, image, screen, camera, and the case of the product can be considered similar to the consumer’s sensory responses.
  • Meanwhile, “Negative Expression” can be considered to correspond to “Affective.” While the causative stimuli will likely vary, we can infer that negative expressions already contain emotions.
  • The topics corresponding to “Intellectual” include certain “Feature” keywords (Gaming, Camera) and “Service & Partner.” These keywords can be classified as behavioral dimensions and responses that impact consumers’ purchasing behavior. However, they can also be classified under Schmitt’s “Think” as part of the purchase decision-making process.
  • “Event” corresponds to “Behavioral,” reflecting the consumer’s response to product launch, price, and reservation leading to actual purchasing behavior.
  • Meanwhile, “Review” can be considered to correspond to “Social.” While “Review” can be classified as “Intellectual” due to the objective information and assessments of various consumers, as most keywords contain standards for comparison in the market, they can be assigned to “Relate to.” Here, “Good” has the meaning of “Like,” which is an “Affective” aspect; however, its contextual meaning is interpreted as “Better” in the overall social standard and assessment of the product.
  • The premise to consider here is that the topic and aforementioned experience dimensions cannot be accurately matched by brand. Thus, “Feature” for LG may contain more “Social Dimension” characteristics. However, for this study, we validated the methodology through conjoint analysis based on the premise of one-to-one matching of the dimensions for each brand.
  • Finally, for the new dimensions, “External” has some possibility. Brand experience stems from brand-related stimuli. Of course, while there is no explicit statement that everything originates from within the brand, we generally recognize that stimuli stem from the brand or the company to which the brand belongs. Nonetheless, as the global economy grows more interconnected, the same products become consumed worldwide, and the speed of information dissemination accelerates, it is evident that even issues not directly related to the Korean market also affect consumers’ responses. Moreover, the benchmark brand for comparison now has a natural association in the market and affects consumer behavior.

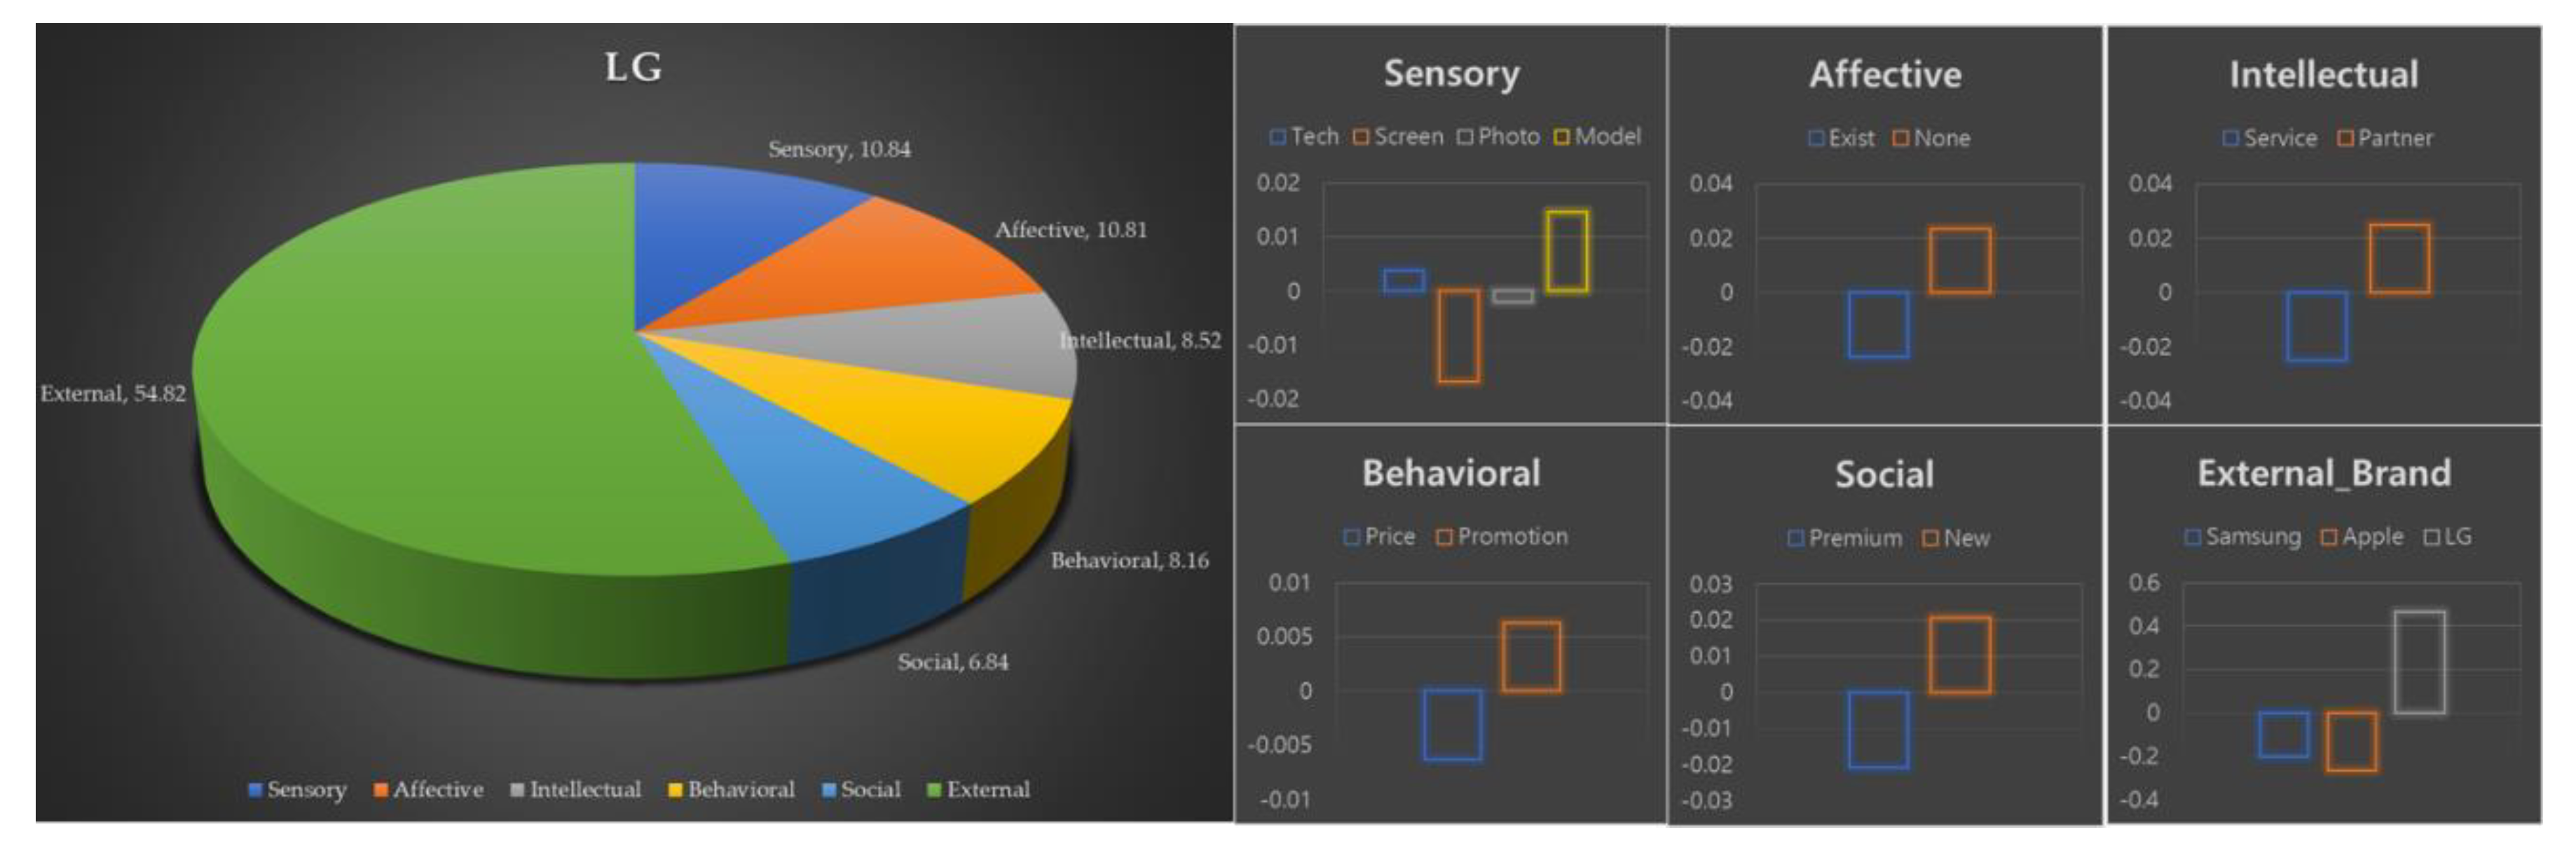
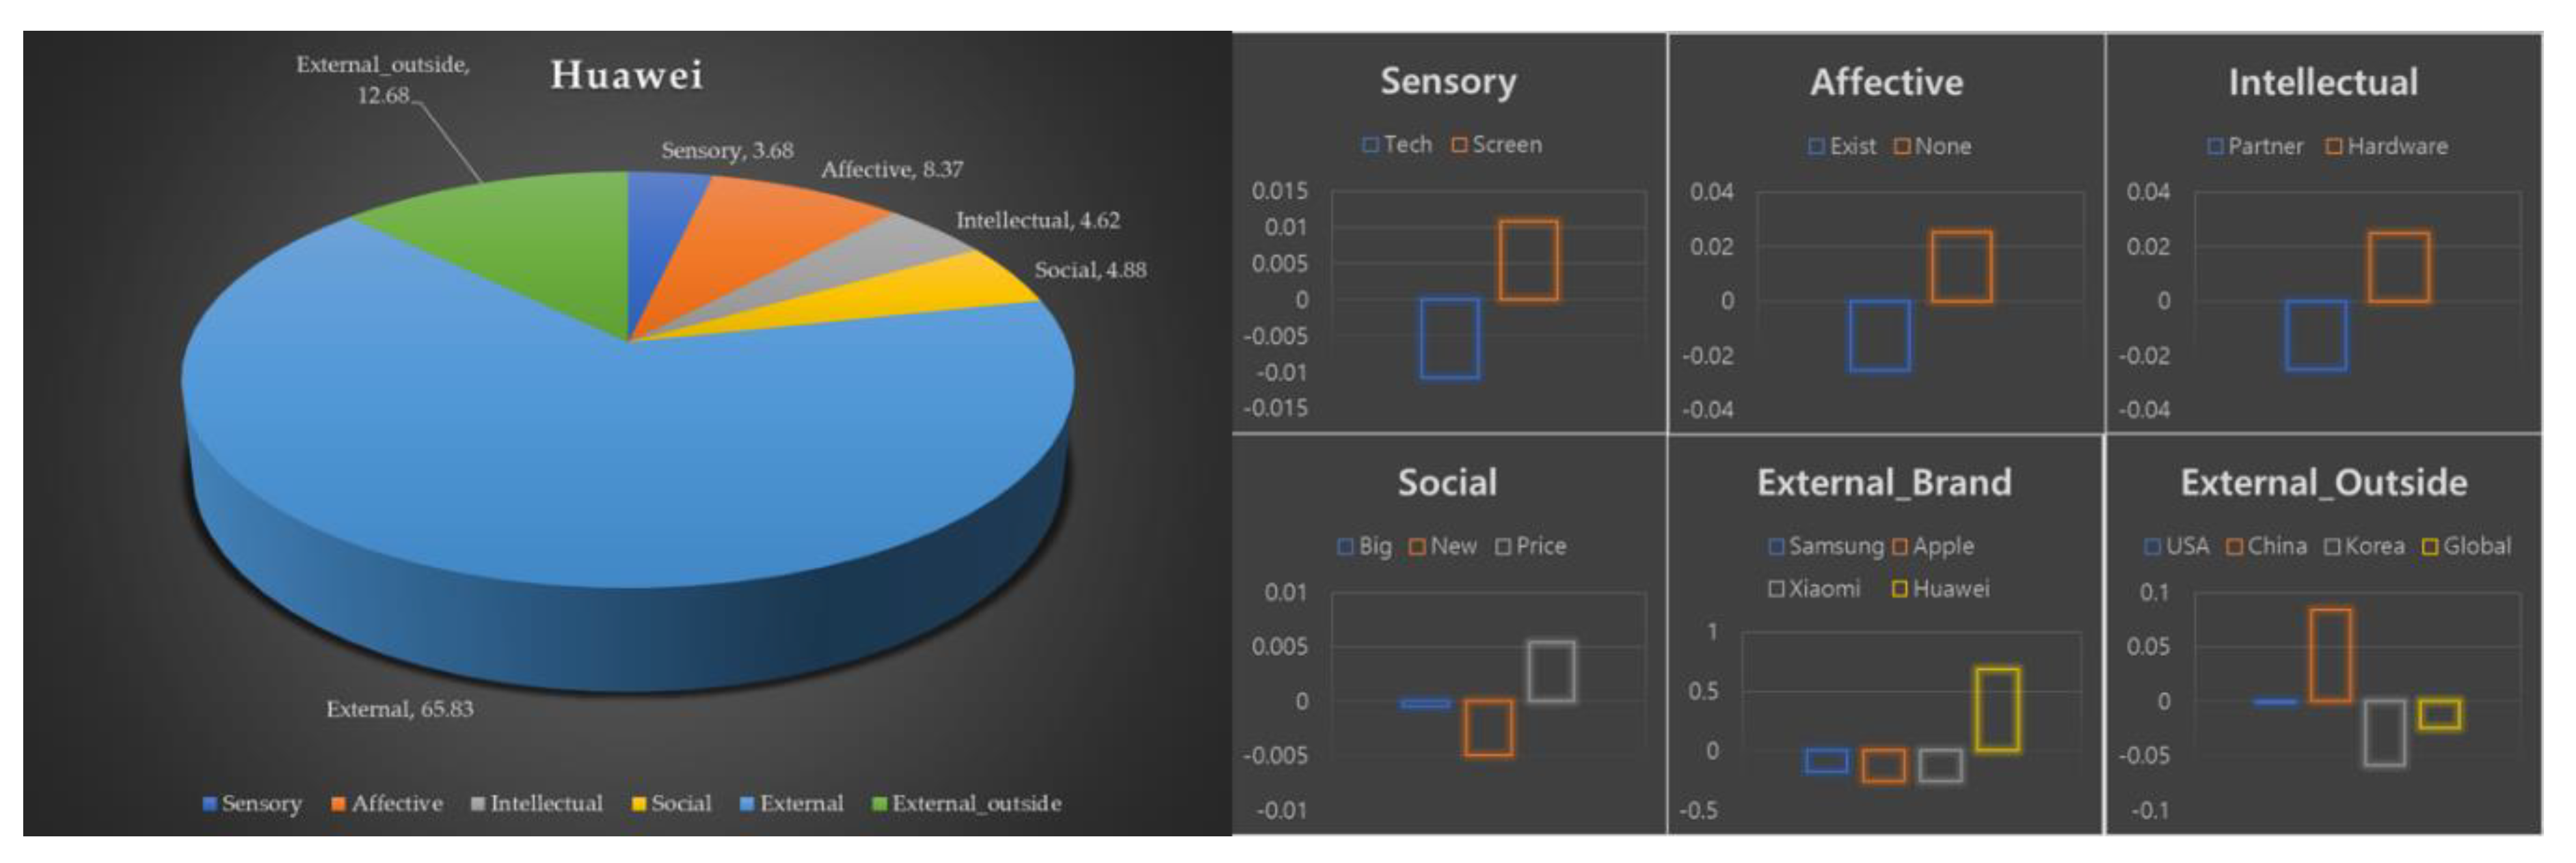
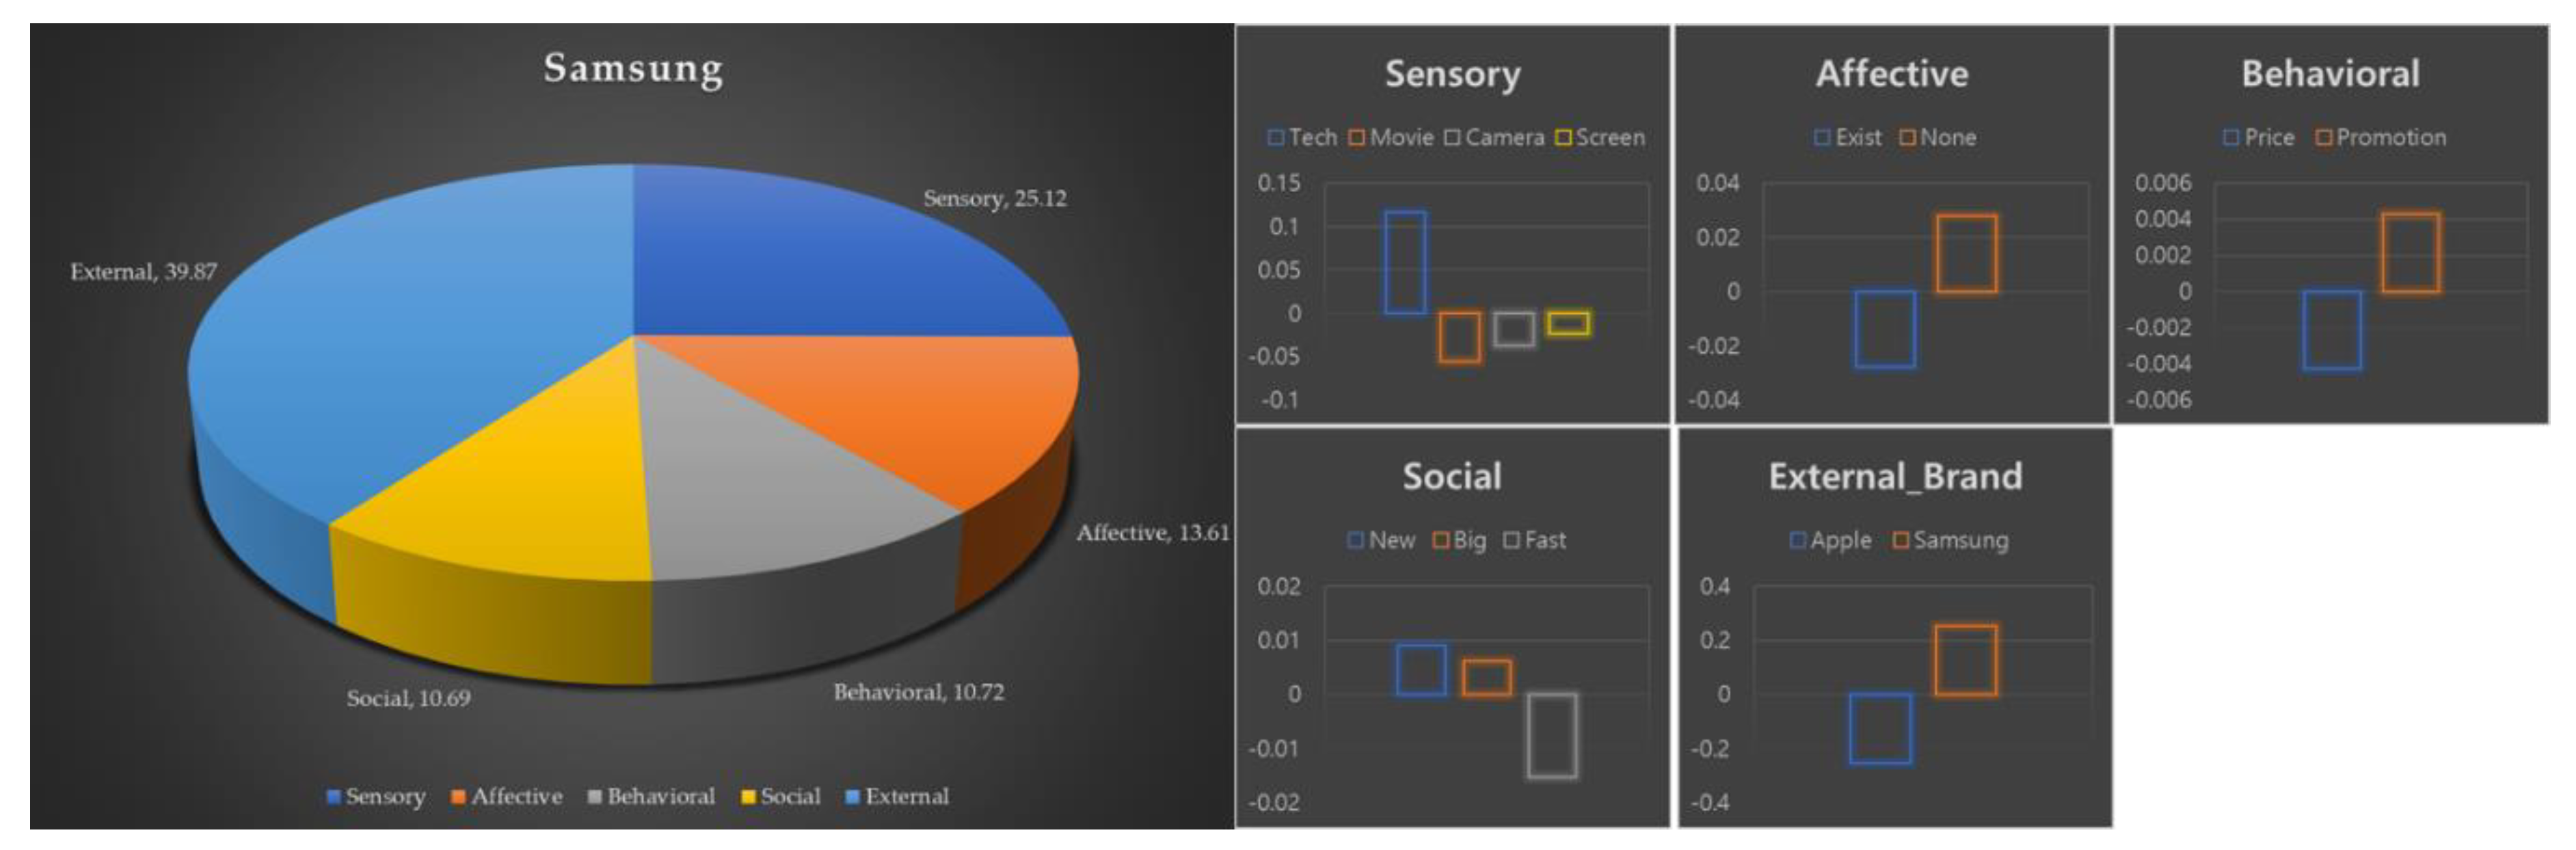
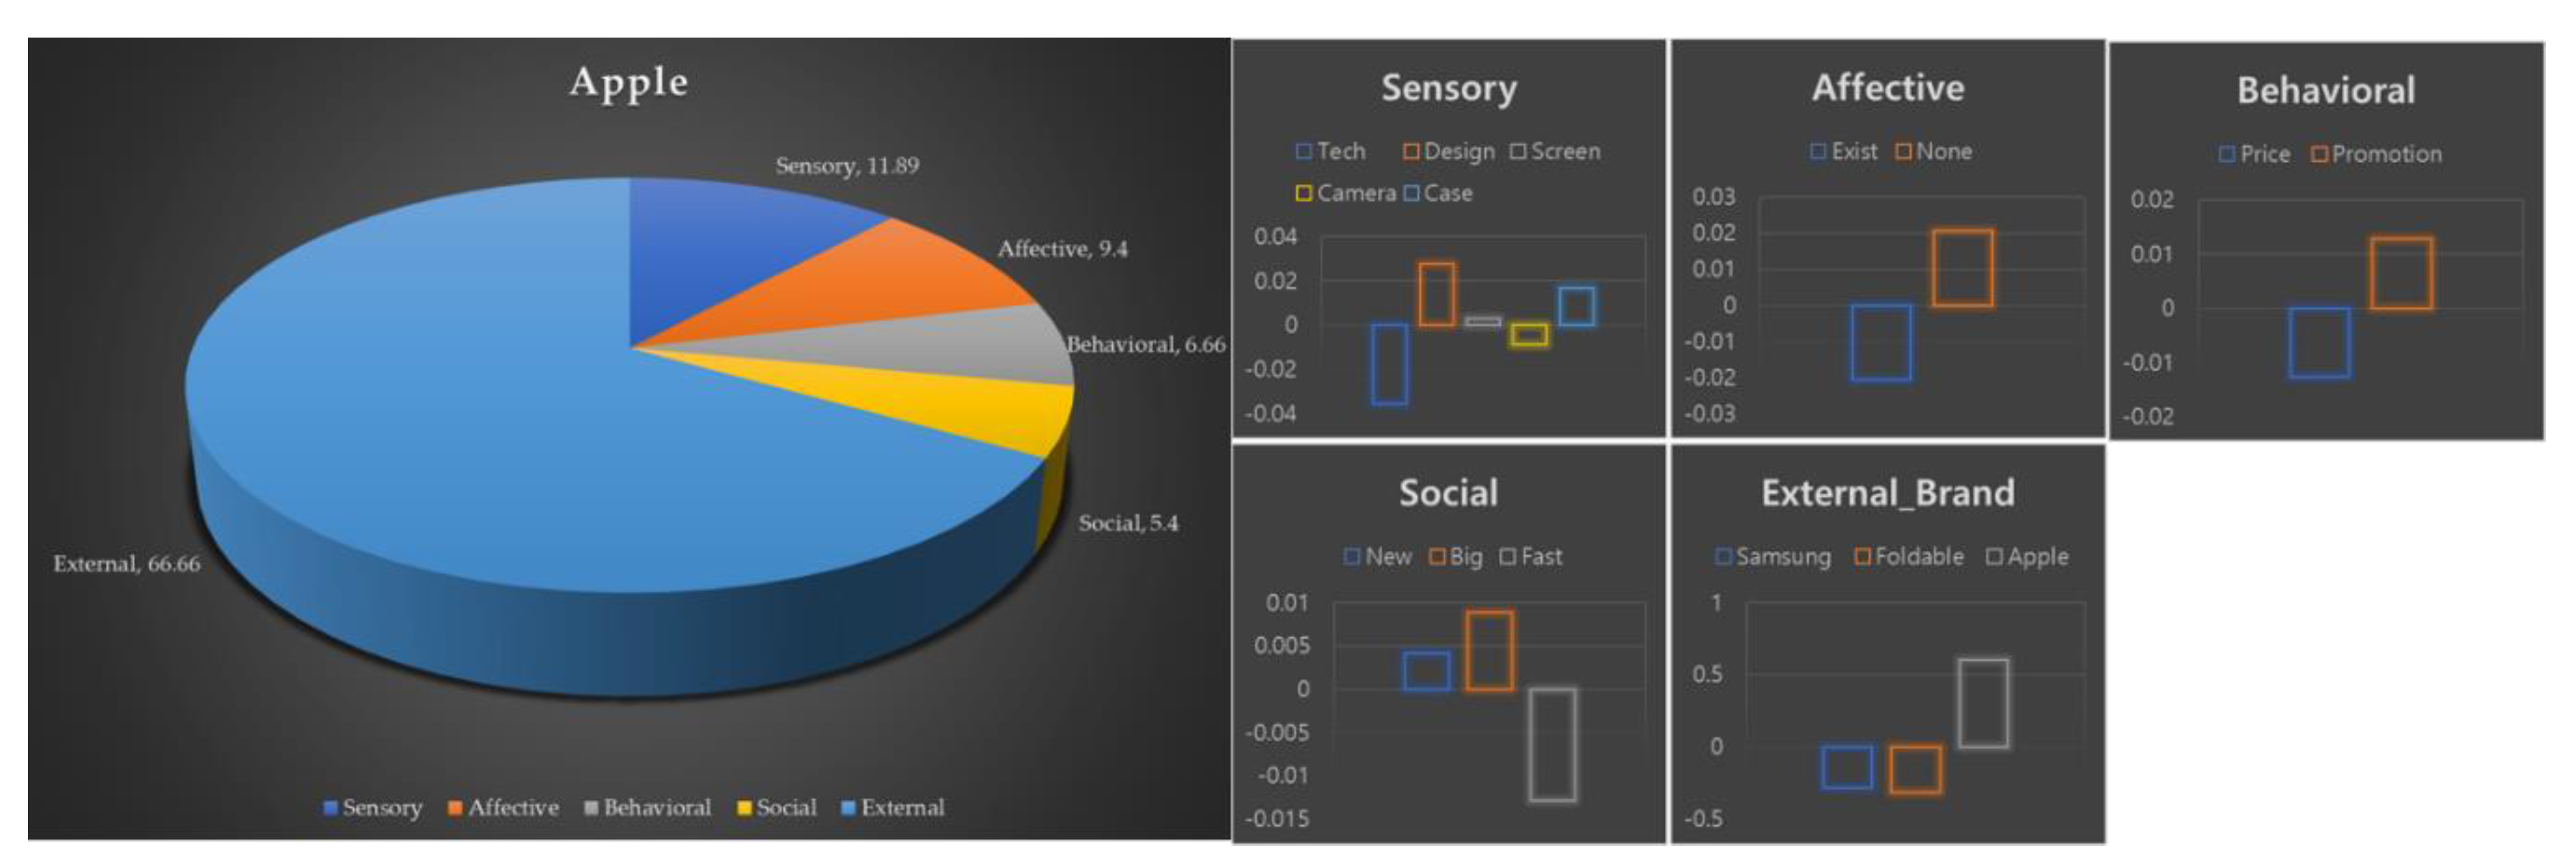
4.3. Conjoint Analysis

4.3.1. Conjoint Attributes

Generally in conjoint analysis, the attributes are selected through experts or taken from existing literature. However, Yoon & Park’s research (2007) utilized the Patent Information Citation as the validation data of attribute and level for conjoint analysis [72]. We also tried to extract keywords from customer’s brand experiences using big data analytics which differs from traditional methodologies. The keywords extracted through probabilistic topic modeling considering the frequency and association of each brand are matched with the brand experience dimensions. We selected the levels from the sub-factors which extracted by topic modeling. Through this process, the attributes of each brand can be used for identifying the mechanism of consumers’ decision-making. Also, brand strategy for the near future can also be made by utilizing the results of the brand experience dimensions.
We summarized the extracted topics and sub-factors by attributes, considering the level and the performed conjoint analysis for each brand, using open source Program R (version 3.6.1), in Table 4. A table was constructed by means of the sub-content mentioned in the existing topics using the results of topic modeling, through which we analyzed the existing data and re-processed it based on the number of mentions for the level of the attribute.
In the level composition of Negative Expression, which corresponds to the Affective dimension, “Exist” values are included as negative expression, “None” values as the absence of negative expression. In External, the sixth dimension, the corresponding brand value was assigned with brands of other company. Huawei needs to add attributes for the outside factors which were derived from the Topic modeling Analysis. The attributes matched by each dimension and the levels constructed through the sub-topic were modeled through orthogonal combination, after which the data set (the number of times the keywords of the item corresponding to the orthogonal combination are mentioned) was reconstructed for each brand. We then used the R program to validate the model.

4.3.2. Conjoint Analysis Results

For LG, the comparison was in the following order: External (54.82) > Sensory (10.84) > Affective (10.81) > Intellectual (8.52) > Behavioral (8.16) > Social (6.84). The results are as shown in Figure 3. In the Sensory dimension, preference was high based on the effect of the model, which was featured in a TV commercial, while Spec played the next most important role. In contrast, there is a high possibility that the low importance of screen is because LG’s brand recognition regarding its display capabilities has already been reflected. This analysis result cannot be derived without understanding LG’s products and features; thus, it is crucial to understand the brand’s internal situation and strategies before analysis. In the Affective dimension, negative expressions played an important role in lowering brand choice. In the Intellectual dimension, the role of the partners, U Plus, or Google Play is more important than After Service or Fee. In the Behavioral Dimension, new product launches and promotions showed relatively high responses. In the Social dimension, the preference for New Style was higher than that for Premium, which reflects consumers’ opinions of LG. Thus, we can infer that consumers are expecting a new style and innovation rather than a premium device and that there was some lack of connectivity between a premium image and the brand. In the External dimension, we can infer that brand is an important selection factor for consumers who mention LG compared to other factors. The higher preference for LG over mentions of Samsung or Apple can be attributed to LG’s marketing activities or to the fact that consumer responses to branding activities may be more immediate. It is more likely that Samsung will be selected compared to Apple; we can also infer that LG will likely become the preferred replacement for Samsung. Moreover, we can draw the practical conclusion that LG’s branding is important regardless of Samsung and Apple’s influence.
Huawei’s comparison produced the following results: External (65.83) > External_outside (12.68) > Affective (8.37) > Social (4.83) > Sensory (3.68). Figure 4 shows the results. In the Sensory dimension, Screen is the obvious factor for consumers to expect in Huawei, comparing advanced technology. It is possibly caused by the news about the foldable screen launching at the 2019 Mobile World Congress. The same results from other brands were shown in the Affective dimension, confirming that controlling negative news about one’s brand is an important activity. In the Intellectual Dimension, the link with Korean telecommunication companies who provide equipment was an important factor in stimulating consumers’ interest and thoughts. Compared to other brands, the keyword “Hardware(=equipment)” was also uniquely derived in the same context. In the Social dimension, price review and preference ranked highly, comparing to large screens or new styles. In other words, we can conclude that cost-effectiveness as a social value is more important than the screen or style for Huawei. The selection attributes for the brand were highest. Examining all of the brands, the selection of Huawei was highest, followed by Samsung, Apple, and Xiaomi. We believe that Huawei’s customers have high loyalty and consider Huawei an alternative to Samsung products. If Huawei strengthens its branding in the Korean market and actively promotes competition with Samsung, it will be able to establish its position as a powerful player for the new foldable devices. The two External dimensions (Brand, Outside) score uniquely for Huawei; we can infer that the news and current issues influenced the information as perceived by consumers. In the case of external factors (country influence), which are highly impactful, they are ranked in the reverse order of Korea, Global, and the US for its China-related attributes. Thus, the international issues highlighted in this study can be considered to have an impact on brand experience. The side effect of the US ban on Huawei products appears to be reflected more in Korea due to the political and economic ties between the US and South Korea, as well as the negative opinions stemming from components competition with Samsung.
The dimension comparison of Xiaomi is as follows: External (56.16) > Sensory (17.90) > Affective (16.00) > Social (5.66) > Intellectual (4.29). Figure 5 summarizes the results. In the Sensory dimension, the order of Game > Camera > WiFi > Battery > Color proved to be relevant. This reflects the expected attributes of the products desired by Xiaomi’s main customer base. Moreover, while keywords related to color were derived by other brands as well, Xiaomi best reflects the market penetration strategy of game-specific phones and accessories. In the Affective dimension, avoiding negative news was shown as important to the emotional experience of consumers. In the Intellectual dimension, compared to the role of the partner Qualcomm, consumers showed more interest in Xiaomi’s app market strategy, which benchmarks the ecosystem built by Apple. This keyword indicates the existence of such an experience area when consumers make a selection regarding Xiaomi’s brand and development strategy. In the Social Dimension, the price was selected as a more important value than novelty. In the External dimension, consumers showed a stronger preference for Xiaomi than for Samsung and Huawei due to the influence of the Xiaomi brand on its diverse lineup, including portable batteries and game-specific phones, and the cost-effectiveness of its devices. However, in future brand competition, the cognitive effect of these adjacent brands may pose an obstacle to introducing a premium product to the market. Thus, an additional study is needed for Xiaomi’s future brand strategies.
For Samsung, the dimension comparison was in the following order: External (39.87) > Sensory (25.12) > Affective (13.61) > Behavioral (10.72) > Social (10.69). Figure 6 represents the results. In the Sensory dimension, it is obvious the technology of the product is the key value for the preference of the Samsung brand and Screen > Camera > Movie is the order of preference for features. We can infer that this is the result of Samsung’s brand experience strategy, which has been focusing to appeal as a tech & advanced brand image to counter Apple’s emotional approach to branding. In the Affective dimension, avoiding negative impression and news was shown to be as important to the reaction of these consumers as for those of other brands. In the Behavioral dimension, Samsung’s launching event, Unpacked Event, has gained in general consumer perception as Samsung’s unique brand event. It is a powerful stimulus to make consumers act to search and compare to purchase the product and is an even stronger factor than price. This means the ritual of events causes consumers to have their own behavioral response to brand new products. Related to this result, the New > Big > Fast order is indicative of consumers considering values in the Social dimension. We can infer that consumers respond by focusing on new products in comparing the size and speed of Samsung’s products. We can assume that in the External dimension, Samsung has strong sustainable brand power and customer loyalty to compete with Apple. Also, consumers are split between these two big brands as the main choices in the market.
Apple’s dimension comparison was derived as follows: External (66.66) > Sensory (11.89) > Affective (9.40) > Behavioral (6.66) > Social (5.40). This result is summarized in Figure 7. In the Sensory dimension, the highest preference was shown for design items, followed by Smartphone Cases, Screen, Camera, and Specifications. This finding is likely due to the impact of the brand experience stimuli steadily promoted by Apple, reflecting consumers’ interest in design and their expectations for the brand. Moreover, future expectations for Apple are predicted to stem from design-related issues rather than expectations for specifications. In the Affective dimension, as negative references lowered brand preference, the company should consider the management of positive issues and stimuli. In the Behavior dimension, consumers are shown to prioritize events and promotions rather than price. Thus, we can infer that consumers do not carry high expectations regarding pricing for Apple. In the Social dimension, product or screen size can be considered important attributes. This consideration is likely a reflection of the attributes of the current smartphone market and is a factor that should be considered in future product development and marketing communications. The next prioritized factor was a new style, which can be attributed to consumers’ behavior partly reflecting anticipation for new products. Conversely, consumers do not highly anticipate the speed of the Apple product. Finally, in the External dimension, Apple’s brand was shown to have a higher priority than other brands, such as Samsung or foldable devices. This observation can be attributed to the high loyalty of consumers who prefer Apple over competitors and have a high level of interest.

5. Discussion

We verify the feasibility of a new research methodology which combines brand experience dimensions with topic modeling, a Big data-based technique, and conjoint analysis. This study demonstrated a method without unintentional bias due to limited data and question items from the existing survey or interview-based methods; it can observe consumer behavior in vast amounts of data, derive keywords statistically, and utilize the dataset to uncover answers to original research questions. Data-driven research methods that derive new insights through inductive explanations rather than traditional deductive hypotheses testing can uncover practical alternatives. As demonstrated in this study, in academic research and business management, it is possible to construct a decision-making framework by combining this methodology for data analysis. This method can become a unique model that provides practical assistance to researchers as well as businesses. Furthermore, conjoint analysis-based modeling can be developed in various ways according to the topics and usage methods with Big data. Traditional conjoint analysis faces challenges in testing many combinations of attribute levels. Today, inexpensive and effective software that supports analytical methods has enabled researchers and practitioners to consider creative techniques for research. For this study, we reconstruct dataset for the composition of level and frequency from the original data source which used in topic modeling. Hence, each brand uses a single data source for topic modeling and conjoint analysis in effective way.
We proposed the External Dimension of brand experience as a considerable factor within the academic research construct associated with reading consumer behavior. We explore the feasibility of the dimension and discover the factor affects academic and practical scenarios. For researchers, to define the exact range of the external dimension reflects consumer behavior will be the next task. The context and culture dimensions of experiences have received attention as subjects for academicians to seek solutions for understanding and studying the influence of consumer experience [36]. By the integration of the global market economy, the importance of external factors brought by digital transformation is enormous. Thus, it is necessary to understand and identify the new definitions of data and continuous changes in context and culture. There are chances some theoretical developments will occur when considering the dimensions activities in those perspectives. That would be the topics for future research from the academic perspectives. For practitioners, the aim of this dimension study is to build the decision-making framework to read and predict consumer behavior to develop sustainable growth in experience-driven and data-driven business environments.
Even though this study expanded the horizons of brand experience dimensions, its limitation is that the methodology was tested on the assumption of one-to-one matching with the new dimensions. Future research should seek to find more accurate and additional methods to quantify the results of the dimensional analysis. We suggest attempting different approaches in future research or experiments through comparative studies using other products or brand groups. Furthermore, we will be able to conduct in-depth semantic analysis through semantic network analysis, which is similar to topic modeling. Moreover, we can explain some case studies with this method combined holistically.
Now, researchers must establish dynamic brand experience studies and marketing strategies considering various forms of Big data produced real-time, in addition to small data containing special contexts and insights. In the era when numerous changes affect brands even with ongoing research, to solve the present issues, we must identify the problems and build solutions with a data-driven approach centered around technology. This method will be one of solid options to combine technology and wisdom gained through intuition.
Finally, sustainable branding should ultimately provide consumers with special experiences using products and services. These experiences begin with products and services that have special features. Ultimately, products and services themselves are the starting point of experiences and will form the foundation of various brand experiences. Brand experience and sustainable behavior may have many links in stimuli such as design, package, and message. [73]. To build a sustainable brand, reading and predicting consumer behavior is the first step [74]. This research method will thus serve as a starting point to facilitate decision-making in building sustainable branding strategies.

Author Contributions

Conceptualization, J.O. and H.-J.K.; methodology, H.-J.K.; software, H.-J.K.; validation, J.O., H.-J.K. and T.P.C.; formal analysis, J.O.; investigation, H.-J.K.; resources, J.O.; data curation, H.-J.K.; writing—original draft preparation, J.O.; writing—review and editing, H.-J.K. and T.P.C.; visualization, J.O.; supervision, H.-J.K. and T.P.C.

Funding

This research received no external funding.

Conflicts of Interest

The authors declare no conflict of interests.

References

  1. Lewnes, A.; Keller, K.L. 10 principles of modern marketing. MIT Sloan Management Review, 3 April 2019. [Google Scholar]
  2. Pine, B.J.; Gilmore, J.H. Welcome to the experience economy. Harv. Bus. Rev. 1998, 76, 97–105. [Google Scholar] [PubMed]
  3. Channel News Asia. Starwars Galaxy Theme Park. Available online: https://www.channelnewsasia.com/news/world/star-wars-theme-park-opens-at-disneyland-11587246 (accessed on 29 June 2019).
  4. Adobe. The Business Impact of Investing in Experience; Forrester Research Inc.: New York, NY, USA, 2018. [Google Scholar]
  5. Bhamra, T.; Lilley, D.; Tang, T. Design for sustainable behaviour: Using products to change consumer behaviour. Des. J. 2011, 14, 427–445. [Google Scholar] [CrossRef]
  6. Gordon, R.; Carrigan, M.; Hastings, G. A framework for sustainable marketing. Mark. Theory 2011, 11, 143–163. [Google Scholar] [CrossRef]
  7. Khan, I.; Rahman, Z. A review and future directions of brand experience research. Int. Strateg. Manag. Rev. 2015, 3, 1–14. [Google Scholar] [CrossRef] [Green Version]
  8. Hamari, J.; Sjöklint, M.; Ukkonen, A. The sharing economy: Why people participate in collaborative consumption. J. Assoc. Inf. Sci. Technol. 2016, 67, 2047–2059. [Google Scholar] [CrossRef]
  9. Richard, B.; Cleveland, S. The future of hotel chains: Branded marketplaces driven by the sharing economy. J. Vacat. Mark. 2016, 22, 239–248. [Google Scholar] [CrossRef]
  10. Brakus, J.J.; Schmitt, B.H.; Zarantonello, L. Brand experience: What is it? How is it measured? Does it affect loyalty? J. Mark. 2009, 73, 52–68. [Google Scholar] [CrossRef]
  11. Schmitt, B. Experiential marketing. J. Mark. Manag. 1999, 15, 53–67. [Google Scholar] [CrossRef]
  12. Nysveen, H.; Pedersen, P.E.; Skard, S. Brand experiences in service organizations: Exploring the individual effects of brand experience dimensions. J. Brand Manag. 2013, 20, 404–423. [Google Scholar] [CrossRef]
  13. Zarantonello, L.; Schmitt, B.H. The impact of event marketing on brand equity: The mediating roles of brand experience and brand attitude. Int. J. Advert. 2013, 32, 255–280. [Google Scholar] [CrossRef]
  14. Chattopadhyay, A.; Laborie, J.-L. Managing brand experience: The market contact audit™. J. Advert. Res. 2005, 45, 9–16. [Google Scholar] [CrossRef]
  15. Fransen, M.L.; van Rompay, T.J.L.; Muntinga, D.G. Increasing sponsorship effectiveness through brand experience. Int. J. Sports Mark. Spons. 2013, 14, 37–50. [Google Scholar] [CrossRef]
  16. Morrison, S.; Crane, F.G. Building the service brand by creating and managing an emotional brand experience. J. Brand Manag. 2007, 14, 410–421. [Google Scholar] [CrossRef]
  17. Srinivasan, S.S.; Till, B.D. Evaluation of search, experience and credence attributes: Role of brand name and product trial. J. Prod. Brand Manag. 2002, 11, 417–431. [Google Scholar] [CrossRef]
  18. Coomber, L.; Poore, J. From good to branded: Using immersive design to deliver a positive brand experience for British Gas. J. Brand Strategy 2012, 1, 318–326. [Google Scholar]
  19. Hanna, S.; Rowley, J. A practitioner-led strategic place brand-management model. J. Mark. Manag. 2013, 29, 1782–1815. [Google Scholar] [CrossRef]
  20. Berry, L.L.; Carbone, L.P.; Haeckel, S.H. Managing the total customer experience. Mit Sloan Manag. Rev. 2002, 43, 85–89. [Google Scholar]
  21. Kaufman, B. Stories that sell, stories that tell. J. Bus. Strategy 2003, 24, 11–15. [Google Scholar] [CrossRef]
  22. Lundqvist, A.; Liljander, V.; Gummerus, J.; Van Riel, A. The impact of storytelling on the consumer brand experience: The case of a firm-originated story. J. Brand Manag. 2013, 20, 283–297. [Google Scholar] [CrossRef]
  23. Wiedmann, K.-P.; Labenz, F.; Haase, J.; Hennigs, N. The power of experiential marketing: Exploring the causal relationships among multisensory marketing, brand experience, customer perceived value and brand strength. J. Brand Manag. 2018, 25, 101–118. [Google Scholar] [CrossRef]
  24. Iglesias, O.; Singh, J.J.; Batista-Foguet, J.M. The role of brand experience and affective commitment in determining brand loyalty. J. Brand Manag. 2011, 18, 570–582. [Google Scholar] [CrossRef]
  25. Ha, H.Y.; Perks, H. Effects of consumer perceptions of brand experience on the web: Brand familiarity, satisfaction and brand trust. J. Consum. Behav. Int. Res. Rev. 2005, 4, 438–452. [Google Scholar] [CrossRef]
  26. Delgado-Ballester, E.; Luis Munuera-Alemán, J. Brand trust in the context of consumer loyalty. Eur. J. Mark. 2001, 35, 1238–1258. [Google Scholar] [CrossRef]
  27. Brown, T.J.; Barry, T.E.; Dacin, P.A.; Gunst, R.F. Spreading the word: Investigating antecedents of consumers’ positive word-of-mouth intentions and behaviors in a retailing context. J. Acad. Mark. Sci. 2005, 33, 123–138. [Google Scholar] [CrossRef]
  28. Oliver, R.L. Cognitive, affective, and attribute bases of the satisfaction response. J. Consum. Res. 1993, 20, 418–430. [Google Scholar] [CrossRef]
  29. Oliver, R.L.; Rust, R.T.; Varki, S. Customer delight: Foundations, findings, and managerial insight. J. Retail. 1997, 73, 311–336. [Google Scholar] [CrossRef]
  30. Chaudhuri, A.; Holbrook, M.B. The chain of effects from brand trust and brand affect to brand performance: The role of brand loyalty. J. Mark. 2001, 65, 81–93. [Google Scholar] [CrossRef]
  31. Aaker, D.A.; Equity, M.B. Capitalizing on the Value of a Brand Name; Free Press: New York, NY, USA, 1991; Volume 28, pp. 35–37. [Google Scholar]
  32. Mitchell, A.A.; Olson, J.C. Are product attribute beliefs the only mediator of advertising effects on brand attitude? J. Mark. Res. 1981, 18, 318–332. [Google Scholar] [CrossRef]
  33. Aaker, J.L. Dimensions of brand personality. J. Mark. Res. 1997, 34, 347–356. [Google Scholar] [CrossRef]
  34. Lee, H.J.; Kang, M.S. The effect of brand experience on brand relationship quality. Acad. Mark. Stud. J. 2012, 16, 87–98. [Google Scholar]
  35. Matt, C.; Hess, T.; Benlian, A. Digital transformation strategies. Bus. Inf. Syst. Eng. 2015, 57, 339–343. [Google Scholar] [CrossRef]
  36. Andreini, D.; Pedeliento, G.; Zarantonello, L.; Solerio, C. Reprint of “A renaissance of brand experience: Advancing the concept through a multi-perspective analysis”. J. Bus. Res. 2019, 96, 355–365. [Google Scholar] [CrossRef]
  37. González-Bailón, S. Social science in the era of big data. Policy Internet 2013, 5, 147–160. [Google Scholar] [CrossRef]
  38. Biesta, G. Pragmatising the curriculum: Bringing knowledge back into the curriculum conversation, but via pragmatism. Curric. J. 2014, 25, 29–49. [Google Scholar] [CrossRef]
  39. Dewey, J. Human Nature and Conduct; Courier Corporation: North Chelmsford, MA, USA, 2002. [Google Scholar]
  40. Dewey, J. Experience and Nature; Courier Corporation: North Chelmsford, MA, USA, 1958; Volume 471. [Google Scholar]
  41. Dubé, L.; Le Bel, J. The content and structure of laypeople’s concept of pleasure. Cogn. Emot. 2003, 17, 263–295. [Google Scholar] [CrossRef] [PubMed]
  42. Pinker, S. How the mind works. Ann. N. Y. Acad. Sci. 1999, 882, 119–127. [Google Scholar] [CrossRef]
  43. Holbrook, M.B.; Hirschman, E.C. The experiential aspects of consumption: Consumer fantasies, feelings, and fun. J. Consum. Res. 1982, 9, 132–140. [Google Scholar] [CrossRef]
  44. Zarantonello, L.; Schmitt, B.H. Using the brand experience scale to profile consumers and predict consumer behaviour. J. Brand Manag. 2010, 17, 532–540. [Google Scholar] [CrossRef]
  45. De Oliveira Santini, F.; Ladeira, W.J.; Sampaio, C.H.; Pinto, D.C. The brand experience extended model: A meta-analysis. J. Brand Manag. 2018, 25, 519–535. [Google Scholar] [CrossRef]
  46. Stebbins, R.A. Exploratory Research in the Social Sciences; Sage: New York, NY, USA, 2001; Volume 48. [Google Scholar]
  47. Hofacker, C.F.; Malthouse, E.C.; Sultan, F. Big data and consumer behavior: Imminent opportunities. J. Consum. Mark. 2016, 33, 89–97. [Google Scholar] [CrossRef]
  48. Gartner Inc. Gartner’s Big Data Definition Consists of Three Parts, Not to Be Confused with Three “V”s. Available online: https://www.forbes.com/sites/gartnergroup/2013/03/27/gartners-big-data-definition-consists-of-three-parts-not-to-be-confused-with-three-vs/#484071e842f6 (accessed on 17 July 2019).
  49. Janssen, M.; van der Voort, H.; Wahyudi, A. Factors influencing big data decision-making quality. J. Bus. Res. 2017, 70, 338–345. [Google Scholar] [CrossRef]
  50. LaValle, S.; Lesser, E.; Shockley, R.; Hopkins, M.S.; Kruschwitz, N. Big data, analytics and the path from insights to value. MIT Sloan Manag. Rev. 2011, 52, 21–32. [Google Scholar]
  51. Provost, F.; Fawcett, T. Data science and its relationship to big data and data-driven decision making. Big Data 2013, 1, 51–59. [Google Scholar] [CrossRef] [PubMed]
  52. Blackwell, R.D.; Miniard, P.W.; Engel, J.F. Consumer Behavior; Thomson/South-Western: Mason, OH, USA, 2006. [Google Scholar]
  53. Ginsberg, J.; Mohebbi, M.H.; Patel, R.S.; Brammer, L.; Smolinski, M.S.; Brilliant, L. Detecting influenza epidemics using search engine query data. Nature 2009, 457, 1012. [Google Scholar] [CrossRef] [PubMed]
  54. Goel, S.; Hofman, J.M.; Lahaie, S.; Pennock, D.M.; Watts, D.J. Predicting consumer behavior with Web search. Proc. Natl. Acad. Sci. USA 2010, 107, 17486–17490. [Google Scholar] [CrossRef] [PubMed] [Green Version]
  55. Choi, H.; Varian, H. Predicting the present with Google trends. Econ. Rec. 2012, 88, 2–9. [Google Scholar] [CrossRef]
  56. Lorigo, L.; Pan, B.; Hembrooke, H.; Joachims, T.; Granka, L.; Gay, G. The influence of task and gender on search and evaluation behavior using Google. Inf. Process. Manag. 2006, 42, 1123–1131. [Google Scholar] [CrossRef]
  57. Feldman, R.; Sanger, J. The Text Mining Handbook: Advanced Approaches in Analyzing Unstructured Data; Cambridge University Press: Cambridge, UK, 2007. [Google Scholar]
  58. Hotho, A.; Nürnberger, A.; Paaß, G. A brief survey of text mining. LDV Forum. 2005, 20, 19–62. [Google Scholar]
  59. Gupta, V.; Lehal, G.S. A survey of text mining techniques and applications. J. Emerg. Technol. Web Intell. 2009, 1, 60–76. [Google Scholar] [CrossRef]
  60. Meyer, D.; Hornik, K.; Feinerer, I. Text mining infrastructure in R. J. Stat. Softw. 2008, 25, 1–54. [Google Scholar]
  61. Pang, B.; Lee, L. Opinion mining and sentiment analysis. Found. Trends Inf. Retr. 2008, 2, 1–135. [Google Scholar] [CrossRef]
  62. Hwang, H.J.; Shim, H.R.; Choi, J. Exploration of user experience research method with big data analysis: Focusing on the online review analysis of echo. J. Korea Contents Assoc. 2016, 16, 517–528. [Google Scholar] [CrossRef]
  63. Kim, E.-G.; Chun, S.-H. Analyzing online car reviews using text mining. Sustainability 2019, 11, 1611. [Google Scholar] [CrossRef]
  64. Kim, L.; Kim, N. Connecting opinion, belief and value: Semantic network analysis of a UK public survey on embryonic stem cell research. J. Sci. Commun. 2015, 14, A01. [Google Scholar] [CrossRef]
  65. Molla, R. How Apple’s iPhone Changed the World: 10 Years in 10 Charts. Available online: https://www.vox.com/2017/6/26/15821652/iphone-apple-10-year-anniversary-launch-mobile-stats-smart-phone-steve-jobs (accessed on 19 July 2019).
  66. Silver, K.T.A.L. Pew-Research-Center_Global-Technology-Use-2018_2019-02-05.Pdf; Pew Research Center: Washington, DC, USA, 2019; p. 33. [Google Scholar]
  67. Statistics Korea. Population of Korean. Available online: http://www.index.go.kr/potal/main/EachDtlPageDetail.do?idx_cd=1009 (accessed on 19 July 2019).
  68. Kim, S.H. Samsung, No 1. Smartphone Market in Korea. Available online: https://www.mk.co.kr/news/business/view/2019/06/438070/ (accessed on 20 July 2019).
  69. Counterpoint. Global Smartphone Market Share: By Quarter. Available online: https://www.counterpointresearch.com/global-smartphone-share/ (accessed on 20 July 2019).
  70. Open Survey. Social Media and Search Portal in Korea; Opensurvey: Seoul, Korea, 2018; p. 24. Available online: https://docs.opensurvey.co.kr/opensurvey_socialmedia_report_2018.pdf?mkt_tok=eyJpIjoiWW1FNE5HUTJZV05oTldSayIsInQiOiJwekhVellPMXUwN3RSeTdtQTBMb2thWldvWU1JUFpxeUdkM0FLSjVoUFhoNWJkT2hEMWRpQ3FueU5ubzNmVEx2dUFIMmxoNDFPRFcwdVVvd0UzTzR1akFwMkZ4OXVzV3NONmFtNllkMkRsdytVajlkVHAyMFV1b1wvQWg0aFhLRDgifQ%3D%3D (accessed on 25 May 2019).
  71. Blei, D.M. Probabilistic topic models. Commun. Acm 2012, 55, 77–84. [Google Scholar] [CrossRef] [Green Version]
  72. Yoon, B.; Park, Y. Development of new technology forecasting algorithm: Hybrid approach for morphology analysis and conjoint analysis of patent information. IEEE Trans. Eng. Manag. 2007, 54, 588–599. [Google Scholar] [CrossRef]
  73. Wever, R.; Van Kuijk, J.; Boks, C. User-centred design for sustainable behaviour. Int. J. Sustain. Eng. 2008, 1, 9–20. [Google Scholar] [CrossRef]
  74. Lilley, D. Design for sustainable behaviour: Strategies and perceptions. Des. Stud. 2009, 30, 704–720. [Google Scholar] [CrossRef]
Figure 1. Research Process.
Sustainability 11 05438 g001
Figure 2. Brand Experience Dimension Analysis.
Sustainability 11 05438 g002
Figure 3. Average Importance_LG.
Sustainability 11 05438 g003
Figure 4. Average Importance_Huawei.
Sustainability 11 05438 g004
Figure 5. Average Importance_Xiaomi.
Sustainability 11 05438 g005
Figure 6. Average Importance_Samsung.
Sustainability 11 05438 g006
Figure 7. Average Importance_Apple.
Sustainability 11 05438 g007
Table 1. List of Search Terms by Brand *.
LGHuaweiXiaomiSamsungApple
LG V50
LG q9
LG Smartphone
LG 5G
Huawei Smartphone
Huawei foldable phone
Huawei Mate X
Huawei 5G
Xiaomi Blackshark2
Xiaomi mi9
Xiaomi 5G
Galaxy
Galaxy Fold
Galaxy 5G
Samsung Galaxy S10 5G
iPhone XI
iPhone XI notch
iPhone 2020
iPhone Foldable
iPhone 5G
iPhone XS Max
iPhone XR
* The search terms were entered in both Korean and English but summarized in English.
Table 2. Compound Noun Processing list.
NNG1NNG2NNG(NNG1+NNG2)
FoldablePhoneFoldable phone
DarkModeDark mode 1
SmartPhoneSmartphone
AugmentedRealityAugmented Reality
CellPhoneCell phone
AirPodAir pod
TripleCameraTriple Camera
DualCameraDual Camera
Dual ScreenDual Screen
BlackSharkBlack Shark
HoleDisplayHole Display
1 Only in iPhone.
Table 3. Topic and Keywords List.
TopicLGHuaweiXiaomiSamsungApple
FeatureSpec
Screen
Photo
Model
Tech
Folding
Screen
Security
Color
White
Red
Gaming
Battery
Camera
WiFi
Spec
Screen
Fold
Camera
Movie
Display
Screen
Notch
Design
Camera
Photo
Display
Case
Patent
EventLaunch
Price
Experience
Launch
Launch
Unpack
Price
Reservation
Launch
Price
Experience
Service &
Partner
A/S
Fee
Google play
U Plus 1
U Plus
Hardware
Qualcomm
Market
ReviewPremium
Possible
Big
First
Price
Bang for the Buck
New Style
First
Big
New Style
First
Fast
Good
Multiple
Big
New Style
Same
Multiple
Good
Fast
Negative ExpressionNone ExistNone Exist
Expelled
None Exist
Not Working
None Exist
Problem
None Exist
Other Brand
&
Outside
Samsung
Galaxy
iPhone
Samsung
Galaxy
Apple
Xiaomi
USA
China
Government
Global Market
Hong mi
mi
Samsung
Galaxy
Huawei
iPhone
USA
Galaxy
Foldable Phone
Samsung
* All words were translated from Korean to English. 1 Service Provider in Korea.
Table 4. Conjoint Profiles of Each Brand.
Dimension
Attribute
Level
LG
(192) *
Huawei
(384) *
Xiaomi
(120) *
Samsung
(96) *
Apple
(180) *
Sensory
Feature
Tech
Screen
Photo
Model
Tech
Screen
Color
Game
Battery
Camera
WiFi
Tech
Camera
Movie
Screen
Tech
Design
Camera
Screen
Case
Behavioral
Event
Price
Promotion
Price
Promotion
Price
Promotion
Intellectual
Service & Partner
Service
Partner
Partner
Hardware
Qualcomm
Market
Social
Review
Premium
New
Big
First
Price
Price
New
Big
New
Fast
Big
New
Fast
Affective
Negative Expression
Exist
None
Exist
None
Exist
None
Exist
None
Exist
None
External
Other Brand
Samsung
Apple
LG 1
Samsung
Apple
Xiaomi
Huawei 1
Hong mi
Xiaomi 1
Samsung
Huawei
Apple
Samsung 1
Foldable
Samsung
Apple 1
& OutsideUSA
China
Korea
Global
* Number of conjoint combinations for each brand, 1 Own brand.

