Article

Different Effects of Contractual Form on Public Transport Satisfaction: Evidence from Large- and Medium-Sized Cities in China

1
School of Civil Engineering and Architecture, Zhejiang Sci-Tech University, Hangzhou 310018, China
2
School of Naval Architecture, Ocean & Civil Engineering, Shanghai Jiao Tong University, Shanghai 200240, China
3
College of Economics & Management, Shanghai Maritime University, Shanghai 201306, China
*
Authors to whom correspondence should be addressed.
Sustainability 2019, 11(19), 5453; https://doi.org/10.3390/su11195453
Submission received: 2 September 2019 / Revised: 26 September 2019 / Accepted: 28 September 2019 / Published: 1 October 2019
(This article belongs to the Section Sustainable Transportation)

Abstract

:
This paper discusses and explores the different effects of contractual forms on the satisfaction with public transport (PT) at different urban scales. Using public transport systems in 12cities in China as the focus (four large-I-sized cities, four large-II-sized cities, and four medium-sized cities), a measurement model of the passenger satisfaction index (PSI) is constructed and estimated on the basic of the adjusted European Customer Satisfaction Index (ECSI) and Partial least square-structural equation model (PLS-SEM), respectively. Then, a two-stage truncation regression bootstrap model is proposed to assess the different effects between them. The major findings of this study are summarized as follows: (1) different effects of contractual forms on PT satisfaction in large- and medium-sized cities are confirmed. (2) In large-I-sized cities and lager II sized cities, operators supervised by management contracts incite higher PT satisfaction levels than those supervised by gross and net cost contracts. (3) In medium-sized cities, operators supervised by gross cost contracts provide incentives to be the satisfaction compared to those of management and net cost contracts. According to different urban scales, different and appropriate contractual forms and supervision mechanisms should be chosen to regulate public transport services.

1. Introduction

The report of the 19th National Congress of the Communist Party of China repeatedly mentioned "green travel" actions, implementing the strategy of green development, and adhering to sustainable development [1]. In December 2017, the “Opinions on Comprehensively Promoting the Development of Green Transport” was issued by the Ministry of Transport, which was put forward to comprehensively carry out "green travel" actions, deeply implement priority strategies for public transport (PT), and realize sustainable development in transport industry [2]. Public transport is an integral part of public services, which is a type of public welfare related to people’s welfare and livelihood [3]. In China, government administrators regard improving the service quality of PT as an important responsibility. In recent years, reforms to public transport service systems have been launched to vigorously develop and support PT. The purpose of these reforms is to increase the number of people who take PT and improve the service quality of PT by changing the currently split model of PT (mainly including supervision mechanism and ownership structure) [4,5]. Nevertheless, in the first half of 2017, the ratio of public transport to private car trips in large- and medium-sized cities in China was generally lower than 40%, far below the ideal level of 60% [6]. The lower travel proportion and lower satisfaction of public transport services was not good enough to meet the people’s travel needs [7].
In the past 40 years of reform and opening-up, PT in China has achieved a complete cycle, experiencing a development process from a “government-led” mode to a “market-led” mode, and back again [8] (see Figure 1). This is in line with the reduced focus on market approaches in the world. Now, many problems have arisen in PT reforms, such as the serious profit loss, poor service quality, and so on. In order to solve these problems, many private capital and operation enterprises have withdrawn from the PT market and returned to the “government-led” mode [8,9]. From experience at home and abroad, the government’s arbitrary behavior is facing a dilemma: the “government-led” mode will inevitably lead to a decline in the efficiency of PT. Once deregulated, PT will face inadequate supervision and public dissatisfaction [10,11]. In many cities of China, PT reforms have not been successful, and the satisfaction and efficiency have not reached expected goals. The main reason for this phenomenon is that PT supervision mechanisms in China are imperfect or not even in place. Thus, establishing a sound supervision mechanism is an important way to improve the satisfaction and efficiency of PT.
Most scholars have mainly researched supervision mechanisms by studying the contractual form. As PT is a quasi-public good, which simultaneously produces the satisfaction and the efficiency. In the public transport service system, most of the existing literature in this field has focused on the effects of the contractual form on the efficiency of PT from the operator’s perspective. Results in the existing literature have shown that the correlation between efficiency and contractual forms is significant, that is, different contractual forms may incite different efficiencies [3,4,5,12,13,14,15]. So far, the literature [9] and [10] has only addressed the effects of the degree of supervision on the PT satisfaction from the public’s perspective. In particular, research results in the literature [9] have shown that different degrees of supervision may produce different levels of passenger satisfaction in China. However, urban development in China varies greatly. On the basis of the permanent resident population in urban areas, the sized of urban scale is divided into seven categories: small I sized city, small II sized city, medium-sized city, large-I-sized city, large-II-sized city, mega sized city and super sized city. Thus, it would be beneficial to explore whether the contractual forms have different effects on the PT satisfaction at different urban scales. In small cities of China, multiple modes of passenger transport system coexist, but the service system of PT is usually regarded as imperfect. While in mega cities and super cities of China, the development of PT is electronic and three-dimensional, with rail transit as the main part, and conventional ground public transport and taxi as supplemental parts. Therefore, in reference to the literature [9] and [10], taking conventional ground public transport systems in medium-sized cities and large sized cities (including large-I-sized cities and large-II-sized cities) as the research focus, we explored the different effects of contractual forms on PT satisfaction.
To explore the different effects of contractual forms on the satisfaction at different urban scales, data of the contractual forms and PT satisfaction were collected, which covered four large-I-sized cities, four large-II-sized cities and four medium-sized cities, for a total of 12 cities in China. In addition, data on the socioeconomic status, travel characteristics, and city characteristics of the respondents in these 12 cities were also collected. The data set used is one of the contributions of this paper. In the field of PT satisfaction, most studies usually have built and measured the satisfaction on the basic of customer satisfaction index (CSI) and structural equation model (SEM) [3,16,17,18]. Thus, in this paper, a model of the passenger satisfaction index (PSI) was constructed on the basis of the modified European Customer Satisfaction Index (ECSI), and it was measured by a partial least squares-structural equation model (PLS-SEM). Then, the association between PT satisfaction and contractual form was proposed, and estimated by a two-stage truncated regression model. This is the methodology contributed by this paper.
The remainder of this paper is structured as follow: The measurement of PT satisfaction is introduced in Section 2. Section 3 proposes the association between contractual practices and PT satisfaction. The data source and variable selection are presented in Section 4. Section 5 elaborates an empirical analysis, which explores the different effects of contractual forms on passenger satisfaction in different cities of China. Section 6 summarizes the significant findings and an outlook for future research. Section 2, Section 3 and Section 5 are all the cores content of this paper.

2. Measurement of PT Satisfaction

Our goal of this study is to address the different effects of contractual forms on PT satisfaction at China’s different urban scales. However, the true level of the satisfaction for each service is not known. Therefore, the level of PT satisfaction is firstly measured.

2.1. Structural Model and Measurement Model

The satisfaction with PT stems from the psychological or sensory state of pleasure or disappointment formed by comparing the passenger’s expectations with the reality of PT, which can be determined in a post-evaluation of the overall public transport service. In this paper, the level of the satisfaction with PT was measured by PSI. When the passengers take a bus (for example), they are accepting a public transport service. These passengers can be regarded as customer to the public transport operator. Therefore, the theory of CSI has usually been used to construct PSI in the existing literature [3,9,18]. The theory of CSI mainly includes five components, namely customer expectation, perceived value, perceived quality, customer satisfaction and customer loyalty [19]. In the theory of ECSI, corporate image is also a component. Customer satisfaction is essential to the enterprise’s success. The better the corporate’s reputation among the public is, the higher customer satisfaction, and the more benefits the enterprise can gain [20,21]. However, to our knowledge, research results on the relationship between corporate image and PT satisfaction are almost absent. In an environment of constant public travel, if the public transport enterprises can improve corporate image and seize their characteristics to attract passengers, the enterprises can increase passenger numbers and revenue. It is particularly important to study the relationship between corporate image and PT satisfaction. In addition, considering that it takes a period of time for the public to realize the difference between the expected service level and the quality of the actual service, customer loyalty will still need to be further verified. Moreover, the influence of corporate image on passenger satisfaction for public transport needs to be further verified. Therefore, according to ECSI, we removed customer expectation and customer loyalty from our model to obtain a more stable service evaluation. Combined with the characteristics of China’s public transport services, this paper constructed a passenger satisfaction index model from four aspects: corporate image, perceived quality, perceived value, and passenger satisfaction (see Figure 2). The positive sign indicates a positive effect.
As we can see from Figure 2, corporate image was the only external latent variable, while there were three endogenous latent variables: perceived value, perceived quality, and passenger satisfaction. In addition, corporate image, perceived quality, and perceived value were antecedent variables, while passenger satisfaction was the outcome variable. Perceived quality was divided into five dimensions: security, convenience, reliability, comfort and operation service, and all comprise a comprehensive frame of different dimensions that affect PT satisfaction. Therefore, there were nine latent variables in the structural model of public transport service satisfaction. The positive sign indicates a positive correlation.
As multiple potential variables in the structural model of PSI were not directly measured, so they must be quantified by manifest variables. Thus, the measurement model of PSI consisted of all the potential variables and their manifest variables. Examining the former research [9,16,22,23,24,25,26], the manifest variables and potential variables of PT satisfaction were summarized, for a total of twenty-one measurement questions. In the measurement model of PSI in this paper, corporate image was quantified by three measurement indices: public transport operation and service image, commercial morality and social responsibility. Perceived quality was subdivided into five dimensions: security, convenience, reliability, comfort, and operation service. On the one hand, the perceived value was measured based on the service provided by price, on the other hand, it was evaluated based on the ticket price. Passenger satisfaction was composed of two measurement items: overall satisfaction and the gap between the ideal and real public transport service. Specific measurement indicators are shown in Table 1.
Since the potential variables such as corporate image, perceived value, perceived quality, and passenger satisfaction could not be directly measured, some manifest variables were constructed to quantify these potential variables. Since many measurement errors exist, if we use a conventional regression model to estimate PSI, then this could lead to a large number of estimation errors. However, SEM can not only establish the relationship between multiple causes and multiple potential variables, but it can also process these measurement errors [16,26]. However, in SEM, it is assumed that the manifest variables obey a normal distribution. PSL can not only effectively solve measurement error problems, but it can also allow the manifest variables to obey a non-normal distribution so as to obtain more accurate and reliable fitting results. Thus, the PSL-SEM method was used to explore the relationship between multiple causes and multiple potential variables in this paper.

2.2. Survey Design

Our purpose in this study was to explore the different effects of contractual forms on the satisfaction with PT in China’s large- and medium-sized cities. Therefore, one city alone could not be chosen as the survey scope. Based on our objectives and data availability, 12 large- and medium-sized cities in China, including Shenyang, Changchun, Jinan, Hangzhou, Qingdao, Suzhou, Fuzhou, Huai’an, Quanzhou, Zhenjiang, Shaoxing and Guilin, were selected as the survey scope. According to the Standards of Urban Scale issued by the Chinese State Council, the urban scales of these 12 cities are shown in Table 2.
According to Table 2, the 12 cities could be divided into four large-I-sized cities, four large-II-sized cities and four medium-sized cities. People who travel frequently by bus in these 12 cities were chosen as the subjects. A stratified sampling method was adopted to stratify the passengers in these 12 cities according to bus routes. The sample bus routes covered the urban area as much as possible and could be divided into ordinary bus routes and special bus routes (including express lines, tour lines, and night lines), which could thoroughly cover the operation lines of bus enterprises and reflect the overall feeling of the citizens of these 12 cities on the public transport services. For each class of the bus lines, the sampling rate was set at 15%. In stratified sampling, suppose J was the number of the bus line strata, and was equal to 4 in this study. N j was the number of the bus line sampling stratum j, j = 1 , 2 , , J . N was the number of sampling units in the bus lines, where N = N 1 + N 2 + + N J . To obtain the full benefit from stratification, the values of N j must be known. When the bus line strata had been determined, a sample set was drawn from each bus line stratum, the drawings being made independently in different bus line strata. The sample sizes within the bus line strata were denoted by n 1 , n 2 , , n J , respectively, where n 1 + n 2 + + n J = n , and n was the total sample size of bus lines. In this paper, the sampling rate σ was also known, and was equal to 15%. Thus, σ = n 1 N 1 = n 2 N 2 = = n J N J = n N = 15 % . The sample sizes n 1 , n 2 , , n J could be obtained.
Based on the literature [9], a questionnaire was designed to investigate passengers’ opinions of PT. The questionnaire consisted of two parts: individual information and passenger satisfaction information. The first part was designed to collect socioeconomic and travel characteristics, for example, gender, age, education level, occupation, travel time, and usage frequency of PT. The second part aimed to investigate the passengers’ overall satisfaction and the influence of each component on the passenger satisfaction with PT. A total of 21 questions in this part were scored with a five-point scale where 1 indicated serious dissatisfaction and 5 indicated great satisfaction with PT.
The data distribution process to measure PSI was divided into two stages. Before the formal investigation, we organized a small-scale investigation to check whether the language of the questionnaire was concise and easy to understand and whether there were errors in the content, more importantly, to verify the reliability. After ensuring that there were no structural deviations in the design, the second phase of the survey was started. We selected college students as investigators. Pre-investigation training was conducted with them to ensure the sample’s integrity and questionnaire’s quality. A total of 500 questionnaires were distributed in each city, for a total of 6000 questionnaires in the 12 cities. In the end, we collected a total of 4549 questionnaires. In order to ensure the integrity and accuracy of the survey data, we had checked the integrity and accuracy of the questionnaires. The integrity check was mainly to check whether the items of the questionnaire were completed and whether there were any omissions in the survey, so as to exclude those who fill in incompletely. The accuracy check mainly from the following two aspects: on the one hand was to check whether the content of the survey was consistent with the actual situation, whether the survey data could truly reflect the actual situation; the other hand was to check whether the data is wrong. Excluding the unqualified and incorrect questionnaires, we got 3,826 valid questionnaires. The effective rate of this survey was 84.4%, which indicated that this survey was a statistical significance (see Table 3).

2.3. Data processing and Analyzing

2.3.1. Reliability Analysis

In this paper, C r o n b a c h s α was used as the reliability index. Generally speaking, values greater than 0.8 imply that the reliability of the sample is good, and values greater than 0.7 means it is acceptable [27]. C r o n b a c h s α coefficient tests for the reliability of these survey data were shown in Table 4. Table 4 showed that, only the reliability coefficient of the potential variable, operation service was 0.789, which was close to the standard value 0.8. For the other potential variables, their reliability coefficients were all greater than 0.8. Therefore, it was reasonable to believe that the sample was reliable.

2.3.2. Validity Analysis

Validity verification was divided into validity of content and validity of convergence. The survey items were selected from the previous test items and assessment indicators of urban public transport in china, so the content of the questionnaire was trustworthy. LISREL 8.70, a software for dealing with structural equation model, was used to conduct confirmatory factor analyses and to test the convergence. The indicators of average variance extracted (AVE), factor load, and composite reliability (CR) were often tested in validating convergence. In academic circles, standard factor loads > 0.5, A V E > 0.5, and C R > 0.7 meet the levels of convergent validity test. The results of Table 4 show that, for all the manifest variables the values of standard factor load, AVE, CR are all greater than 0.6, greater than 0.5, and greater than 0.7, respectively. This indicated that this scale reached valid convergence requirements. Additionally, all parameters of the measurement model were statistically significant at the 0.00l probability level, as shown in Table 4. Thus, the SEM was suitable for these data.
In this paper, we estimated PSI based on the PLS-SEM. LISREL 8.70 was used to calibrate the model. Table 5 presents the fitting results.
According to the literature [28,29], the following indices were applied to determine the model fit, which included the absolute fit indices and the incremental fit indices. Absolute fit indices such as the χ2/df, the goodness-of-fit indices (GFI), Root Mean Square Error of Approximation (RMSEA), which indicate how well the a priori model fits the sample data. Incremental fit indices such as the normed fit index (NFI) and comparative fit index (CFI). As shown in Table 5, the χ2/df of all the cities is all less than 5, the absolute fit indices was as follow: the values of GFI are within the range of 0.88 and 0.95, the values of RMRSEA were all less than the recommended value 0.08, demonstrating a good fit; the incremental fit indices, the values of NFI were within the range of 0.86 and 0.95, the values of and CFI are all greater than the recommended value 0.9, indicating good fit. It was thus appropriate to conclude that the models have a good degree of fit and is acceptable. Therefore, further analysis could be carried out.
We measure and calculate PT satisfaction in the 12 cities of China (see Figure 3, Figure 4 and Table 6). As can be seen from Figure 3, the average value of PT satisfaction in these 12 cities is 68.65%. The satisfaction with PT is not high, which means that the service quality needs to be further improved to better meet passengers’ travel needs. Among them, Shenyang, Jinan and Suzhou have higher passenger satisfaction, reaching more than 75%, while Guilin, Shaoxing, Quanzhou, Huai’an, and Changchun have lower passenger satisfaction, only about 60%, and there is still much room for improvement. Besides, the satisfaction with PT in large-I-sized cities is the highest, with an average of 70.02%, followed by large-II-sized cities, with an average of 68.96%, and that in medium-sized cities is the lowest, with an average of 66.98%.
Figure 4 and Table 6 show the ratios (Pi values) of satisfied passengers (those who answered either “great satisfaction” or “satisfaction”) and unsatisfied passengers (those who answered either “dissatisfaction” or “serious dissatisfaction”) for the 12 cities. According to the value of Pi, these 12 cities could be divided into three categories. The cities Shenyang, Suzhou and Jinan were the first category, where the passenger satisfaction ratios Pi of these three cities were all more than 3. The cities Zhenjiang, Qingdao, Hangzhou and Fuzhou, whose passenger satisfaction ratios Pi were between 2 and 3, were the second category. The cities Guilin, Quanzhou, Shaoxing, Huai’an and Changchun, whose passenger satisfaction ratios Pi were less than 2, were in the third category. The data in Figure 3 shows clearly the huge gap between the highest satisfaction of Shenyang and the lowest satisfaction of Changchun.

3. Association between Contractual Forms and Passenger Satisfaction

Our objective of this paper was to explore the difference effects of contractual forms on PT satisfaction in China’s large- and medium-sized cities. That is, we want to assess the difference relationships between them. However, the true level of the satisfaction with PT is unknown. The true level of the satisfaction, Si is generated by:
S i = β 0 + θ C o n t r a c t i + X j i β j + ε i
where, C o n t r a c t i denote the contractual form received by the ith passenger, i = 1 , 2 , , N , N is the whole samples.   x i j β j = β 1 x 1 i + β 2 x 2 i + + β k x k i   ,     x j i = ( x 1 i   , x 2 i , , x k i ) denotes the other factors impacting the satisfaction with PT. These are the control variables. In examining public transport satisfaction literature, we found the factors that impacted PT satisfaction were divided into the city’s characteristics [30,31,32], the firm’s characteristics [33,34], the travel characteristics [17,35,36], and the socioeconomic characteristics of the passenger [36,37]. Based on our objectives and data availability, we chose city characteristics (i.e., city size, GDP, road area, private car, etc.), travel characteristics (i.e., travel time, usage frequency, etc.), and the passenger’s socioeconomic characteristics (i.e., age, gender, educational level, occupation, etc.) as the control variables in this paper. θ and β j = ( β 1 , β 2 , , β k ) are the unknown parameters.
In this paper, PSI was used to assess the level of PT satisfaction. The values of PSI were continuous, with a range of 0 and 1, and some values were concentrated at 1. In this situation, the dependent variable was limited. If we used directly the ordinary least squares method (OLS) to estimate the model, this lead to serious deviations and inconsistencies with the estimated parameters [38]. On the basis of Monte Carlo simulation, the literature [39] proposed that some of the values are concentrated at 1, where the sample size is a set property of limited samples, which is a small part of the sample. In this situation, the model used a Tobit regression model for estimations, which led to inconsistencies in the estimated parameters. At any rate, the value of PSI measured by empirical analysis is a measured value, not a true value. Thus, there may be a serial correlation between each satisfaction value, and there may be a serial correlation between the variables C o n t r a c t i ,   x j i = ( x 1 i   , x 2 i , , x k i ) and the random disturbance variable ε i , Bootstrap methods can overcome this problem. Therefore, in referencing the research literature [39], a two-stage truncation regression bootstrap model was used to estimate the association between contractual form and passenger satisfaction, as shown in formula (2).
S i = β 0   + θ C o n t r a c t i + X j i β j + ε i     ε i ~ N ( 0 , σ 2 ) S i = S i * ,     f o r   M i n S i * M a x
where S i denotes the value of PSI of the ith passenger, which is measured by PLS-SEM method according to European Customer Satisfaction Index (ECSI). β 0 denotes the constant parameter. ε i is assumed to obey normal distribution N ( 0 , σ 2 ) , and denotes a stochastic term error [39].

4. Data Source and Variable Selection

4.1. Data Source

According to our purpose, we carried out a field study on the PT in large- and medium-sized cities of China. Through previous field interviews and data availability, four large-I-sized cities, four large-II-sized cities and four medium-sized cities were selected as the survey scope, which included Shenyang, Changchun, Jinan, Hangzhou, Qingdao, Suzhou, Fuzhou, Huai’an, Quanzhou, Zhenjiang, Shaoxing and Guilin, for a total of 12 cities. We conducted interviews and surveys with managers of the public transport management departments and enterprises, and we obtained data on contractual form of PT in the 12 cities. In addition, a questionnaire was conducted to the passenger satisfaction in these 12 cities. The data set of the passenger satisfaction index in these 12 cities was collected, as well as the data sets of the individual travel characteristic variables and the socioeconomic characteristic. Furthermore, based on China’s City Statistical Yearbook and Urban Construction Statistical Yearbook, we collected data set on the characteristics of these 12 cities.

4.2. Variable Selection

We divided the factors that affected the satisfaction with PT into four group variables. These four group variables specifically included the contractual form, the individual socioeconomic status, travel characteristics, and city characteristics. The last three groups were control variables. Each group of variables is described as follows.

4.2.1. Contractual Form

In China’s many cities, the satisfaction and efficiency of PT has not reached the ideal goal. The main reason is that supervision of PT is lacking, or is not even in place. In order to improve the satisfaction and efficiency of PT, thorough supervision in the public transport system needs to be established. After determining the operation enterprises in public transport service systems, the government needs to consider what kind of the contractual forms will be used to supervise the operation enterprises. Most of scholars mainly have researched supervision mechanism by studying the form of contractual practices. There are two kinds of risks in providing PT, namely revenue risk and production risk [4,40]. Revenue risk is closely dependent on the passenger numbers, which refers to the risk related to the scale of PT. However, production risk is not associated with passenger numbers, and instead refers to the risk related to the production cost to reach a fixed passenger number. According to the different proportions of revenue and production risks borne by each contracting party, and referring to the literature [4,5,40], the contractual forms of PT were divided into three kinds: the management contract, gross cost contract and net cost contract.
Detailed definitions of these three contractual forms are seen in the literature [5]. Table 7 presents a comparative analysis of these three contractual forms. From Table 7, according to the different proportions of revenue and production risks borne by each contracting party, the government can choose which form of the contractual practices to use in order to supervise PT in China.
Under the background of the current PT in China, we referred to the literature [5], and defined the variables of the contractual form as follow:
M a n a g = { 1 , t h e o p e r a t o r s u p e r v i s e d b y t h e m a n a g e m e n t c o n t r a c t 0 , o t h e r s
N e t = { 1 , t h e o p e r a t o r s u p e r v i s e d b y t h e n e t c o s t c o n t r a c t 0 , o t h e r s
G r o s s = { 1 , t h e o p e r a t o r s u p e r v i s e d b y t h e g r o s s c o s t c o n t r a c t 0 , o t h e r s
where, M a n a g , N e t and G r o s s denoted the management, net cost and gross cost contract, respectively. We used the binary coding (yes = 1, no = 0) to identify these three variables. We conducted the interviews and surveys on the managers and operators of PT, and obtained the data on contractual forms in 12 cities, as shown in Figure 5.
As can be seen from Figure 5, about half (44.6%) of the operators were regulated by management contracts, which accounted for the largest proportion. Second, the proportion of the operators supervised by gross cost contracts was close to 40% (36.3%), and the proportion of the operators supervised by net cost contracts was the smallest, less than 20% (19.1%). Since the revenue and production risks in the management contract are shouldered by the government management department, the pressure on the financial subsidies in the public transport industry has become more and more serious in recent years, and the financial subsidies in many cities of China are in an unsustainable state.

4.2.2. Socioeconomic Characteristics Group

In referring to the literature [36,37], the variables of age, gender, income, educational level, and occupation were chosen as the socioeconomic variables. In the survey of passenger satisfaction, data on the respondents’ socioeconomic characteristics were also collected. In the passenger satisfaction survey, we set two items, one was the city where the respondents were located, and the other was the highest frequency of bus routes that the respondents often take. In this data set, we added two tags, namely a bus route tag and a location tag. Therefore, these two tags connected the contractual form, the city characteristics and socioeconomic characteristics. Table 8 presents the statistical results of the socioeconomic data observed in the 12 cities.

4.2.3. Travel Characteristics Group

Referring to the research literature [17,35,36], two variables of travel time and usage frequency of PT were chosen as the travel characteristics variables. In the survey of passenger satisfaction, data on the respondents’ travel characteristics were also collected. The results of travel time and usage frequency of PT are shown in Figure 6 and Figure 7.

4.2.4. City Characteristics Group

Examining to the research literature [30,31,32], we chose the variables of the GDP, road area and private car as the city characteristics variables. We looked up China’s City Statistical Yearbook and Urban Construction Statistical Yearbook, and collected the data set of the city characteristic group (see Table 9).

5. Empirical Analyses

Referring to the factors that impacted PT satisfaction, we construct the model as follows:
S i * = β 0 + θ C o n t r a c t i + X i β + ε i = β 0 + θ C o n t r a c t i + β j p P a s s e n g e r _ c h a r a c t e r i s t i c s i + β m T T r a v e l _ c h a r a c t e r i s t i c s i + β n C C i t y _ c h a r a c t e r i s t i c s i + ε i
where, S i * denotes the PSI of the ith passenger, which is measured by PLS-SEM method according to European Customer Satisfaction Index (ECSI). C o n t r a c t i denotes contractual forms received by the ith passenger, which includes M a n a g i , G r o s s i and N e t i . P e r s o n _ c h a r a c t e r i s t i c s i is the socioeconomic characteristics group of the ith passenger, which includes age, gender, income, education, and occupation. T r a v e l _ c h a r a c t e r i s t i c s i includes the usage frequency of PT and travel time. C i t y _ c h a r a c t e r i s t i c s i represents the city-specific characteristics group, which includes GDP, road area and private car. β 0 , θ , β j P , β m T , β n C denote the unknown parameters of contractual forms, the socioeconomic, travel characteristics, and city characteristics, respectively.
Based on the two-stage truncation regression bootstrap model, we establish the association between PT satisfaction and contractual form, then discuss the different relationships between them in China’s large- and medium-sized cities. Table 10, Table 11 and Table 12 present the results of the association model. The results in Table 10, Table 11 and Table 12 denote the effects of contractual forms on PT satisfaction in large-I-sized cities, large-II-sized cities and medium-sized cities, respectively. The positive and negative signs denote the positive and negative effects of the variables on PT satisfaction, respectively. When three control variables, P a s s e n g e r _ c h a r a c t e r i s t i c s i , T r a v e l _ c h a r a c t e r i s t i c s i and C i t y _ c h a r a c t e r i s t i c s i , are added to the two-stage truncation regression bootstrap model in turn, the significant relationship between PT satisfaction and contractual forms is enhanced.
Model (1) of Table 10 and Table 11 shows the significant relationship between PT satisfaction and contractual forms in large-I-sized cities and large-II-sized cities, respectively. As can be seen from Table 10 and Table 11, in comparing the public transport enterprises supervised by net cost contracts, the coefficients θ M a g and θ G r o s s were all positive and statistically significant at the 0.05 probability level. This implied that both management and gross cost contracts had a significant positive effect on PT satisfaction in large-I-sized cities and large-II-sized cities. The coefficient θ M a g was larger than that θ G r o s s . This showed that in large-I-sized cities and large-II-sized cities, the operators supervised by management contracts produced the highest PT satisfaction, followed by those supervised by gross cost contracts. Those supervised by net cost contracts incited the lowest satisfaction. Table 7 presents that the management and net cost contracts had the highest degree and lowest degree of government supervision, respectively. Comparing the satisfaction of the operators with the three contractual forms, we can see that the higher the degree of government supervision, the higher the satisfaction of PT. The reason for this result is that: in large-I-sized cities and large-II-sized cities, not only the public transport infrastructure is ideal, but the government’s supervision is also relatively high, and the subsidy mechanisms are relatively thorough, and in place. Although local departments bears both the revenue and production risks of the operators supervised by management contracts, the government still guarantees sufficient financial subsides for these public transport enterprises. However, at the same time, higher service quality requirements for these public transport enterprises are put forward, which provides a basis for higher passenger satisfaction. The results showed that in large-I-sized cities and large-II-sized cities, if improving PT satisfaction is the goal, then choosing management contracts to regulate PT may be the best.
Model (1) of Table 12 presents the relationship between PT satisfaction and contractual forms in medium-sized cities. As can be seen from Table 13, in comparing the enterprises supervised by net cost contracts, the coefficients θ M a g was negative and statistically significant at the 0.01 probability level, and the coefficient θ G r o s s was positive and statistically significant at the 0.05 probability level. This implied that in medium-sized cities, compared to management and net cost contracts, operators supervised by gross cost contracts produced the highest satisfaction with PT. An explanation for this result is that: the revenue and production risks of the operators supervised by management contracts are shouldered by the government. Compared with the operators supervised by gross and net cost contracts, the operators supervised by management contracts rely heavily on financial subsidies from the government. However, in medium-sized cities of China, the subsidy mechanisms for PT are imperfect, and financial subsidies are not in place. The deficiency and insufficiency of financial subsidies lead to serious operation losses of public transport enterprises regulated by management contracts. In order to compensate for the operating pressure, the service quality of PT is reduced. The results showed that in medium-sized cities, if improving the satisfaction of PT is the goal, choosing gross cost contracts to supervise PT may be the best, while choosing management contracts may be the worst.
Model (2), Model (3) and Model (4) of Table 10, Table 11 and Table 12 present the effects of the P a s s e n g e r _ c h a r a c t e r i s t i c s i , T r a v e l _ c h a r a c t e r i s t i c s i , and C i t y _ c h a r a c t e r i s t i c s i on the satisfaction in large-I-sized cities, large-II-sized cities and medium-sized cities, respectively. Because our objective in this paper was to explore different effects of contractual forms on PT satisfaction in China’s large- and medium-sized cities, we only discussed the impact of these group variables on the satisfaction in medium-sized cities, while we did not analyzed the results in large-I-sized cities and large-II-sized cities. The results of Table 12 show that: for P a s s e n g e r _ c h a r a c t e r i s t i c s i , the variables including age, occupation and education level were statistically significant in affecting the satisfaction of PT, while gender and income were not statistically significant at the 0.10 probability level, which is in line with previous studies [9,37]. For T r a v e l _ c h a r a c t e r i s t i c s i , the sign of the travel time was negative, and its coefficient β T i m e T was statistically significant at the 0.05 probability level, which is consistent with the results obtained in the literature [17,36]. The sign of the usage frequency of PT was positive, and its coefficient β F r e T was statistically significant at the 0.01 probability level, which implied that the travel time and the usage frequency had statistically significant negative and positive effects on PT satisfaction, respectively. For C i t y _ c h a r a c t e r i s t i c s i , there is a significant negative relationship between PT satisfaction and the private car use, which is in line with the previous studies [9,30]. The coefficient β R o a d C was negative, and statistically significant at the 0.05 probability level. In addition, the absolute value of β R o a d C was very large. That is, road area had a large, statistically significant, and negative impact on PT satisfaction, which is in line with the previous studies [9,30,32]. The possible reason for this phenomenon is that when the road area is relatively large, the resources for road are very sufficient, which leads to more people choosing private cars to travel and results in a lower sharing rate of public transport and higher requirements for public transport services.
Table 13 presents the results of difference effects of contractual forms on PT satisfaction in large- and medium-sized cities of China. As we can see from Table 13, in large sized cities (including large-I-sized cities and large-II-sized cities), the PT operators regulated by management contracts saw the highest levels of PT satisfaction, and those regulated by net cost contracts have the lowest satisfaction levels. However, in medium-sized cities, the PT operators regulated by management contracts saw the lowest satisfaction, and those regulated by gross cost contracts have the highest satisfaction levels. In contrast, results in the literature [9,10] show that PT satisfaction is highest when operators are regulated by management contracts, and PT satisfaction is lowest when operators are regulated by net cost contracts. However, the literature studies [9,10] did not take into account the impact of urban scale. Because of the great differences in urban scale in China, this paper explored the different effects of contractual forms on PT satisfaction at different urban scales. The results found that the different effects of contractual forms on PT satisfaction were significant. This indicated that, under the background of current PT in China, a contractual form is not suitable for all urban scales. Different and appropriate contractual forms and supervision mechanisms should be chosen to regulate public transport services according to different urban scales.

6. Conclusions

Our goal of this paper explored the different effects of contractual forms on PT satisfaction in China’s large- and medium-sized cities from the public’s perspective. First, a PSI measurement model was constructed on the basic of ECSI and PSL-SEM. According to the total 3826 samples in the satisfaction survey, the values of PSI in four large-I-sized cities, four large-II-sized cities and four medium-sized cities, (a total of 12) were measured. Then, the association between PT satisfaction and contractual form was proposed based on a two-stage truncation regression bootstrap model. Finally, this paper applied an empirical analysis. The major findings can be summarized as follows:
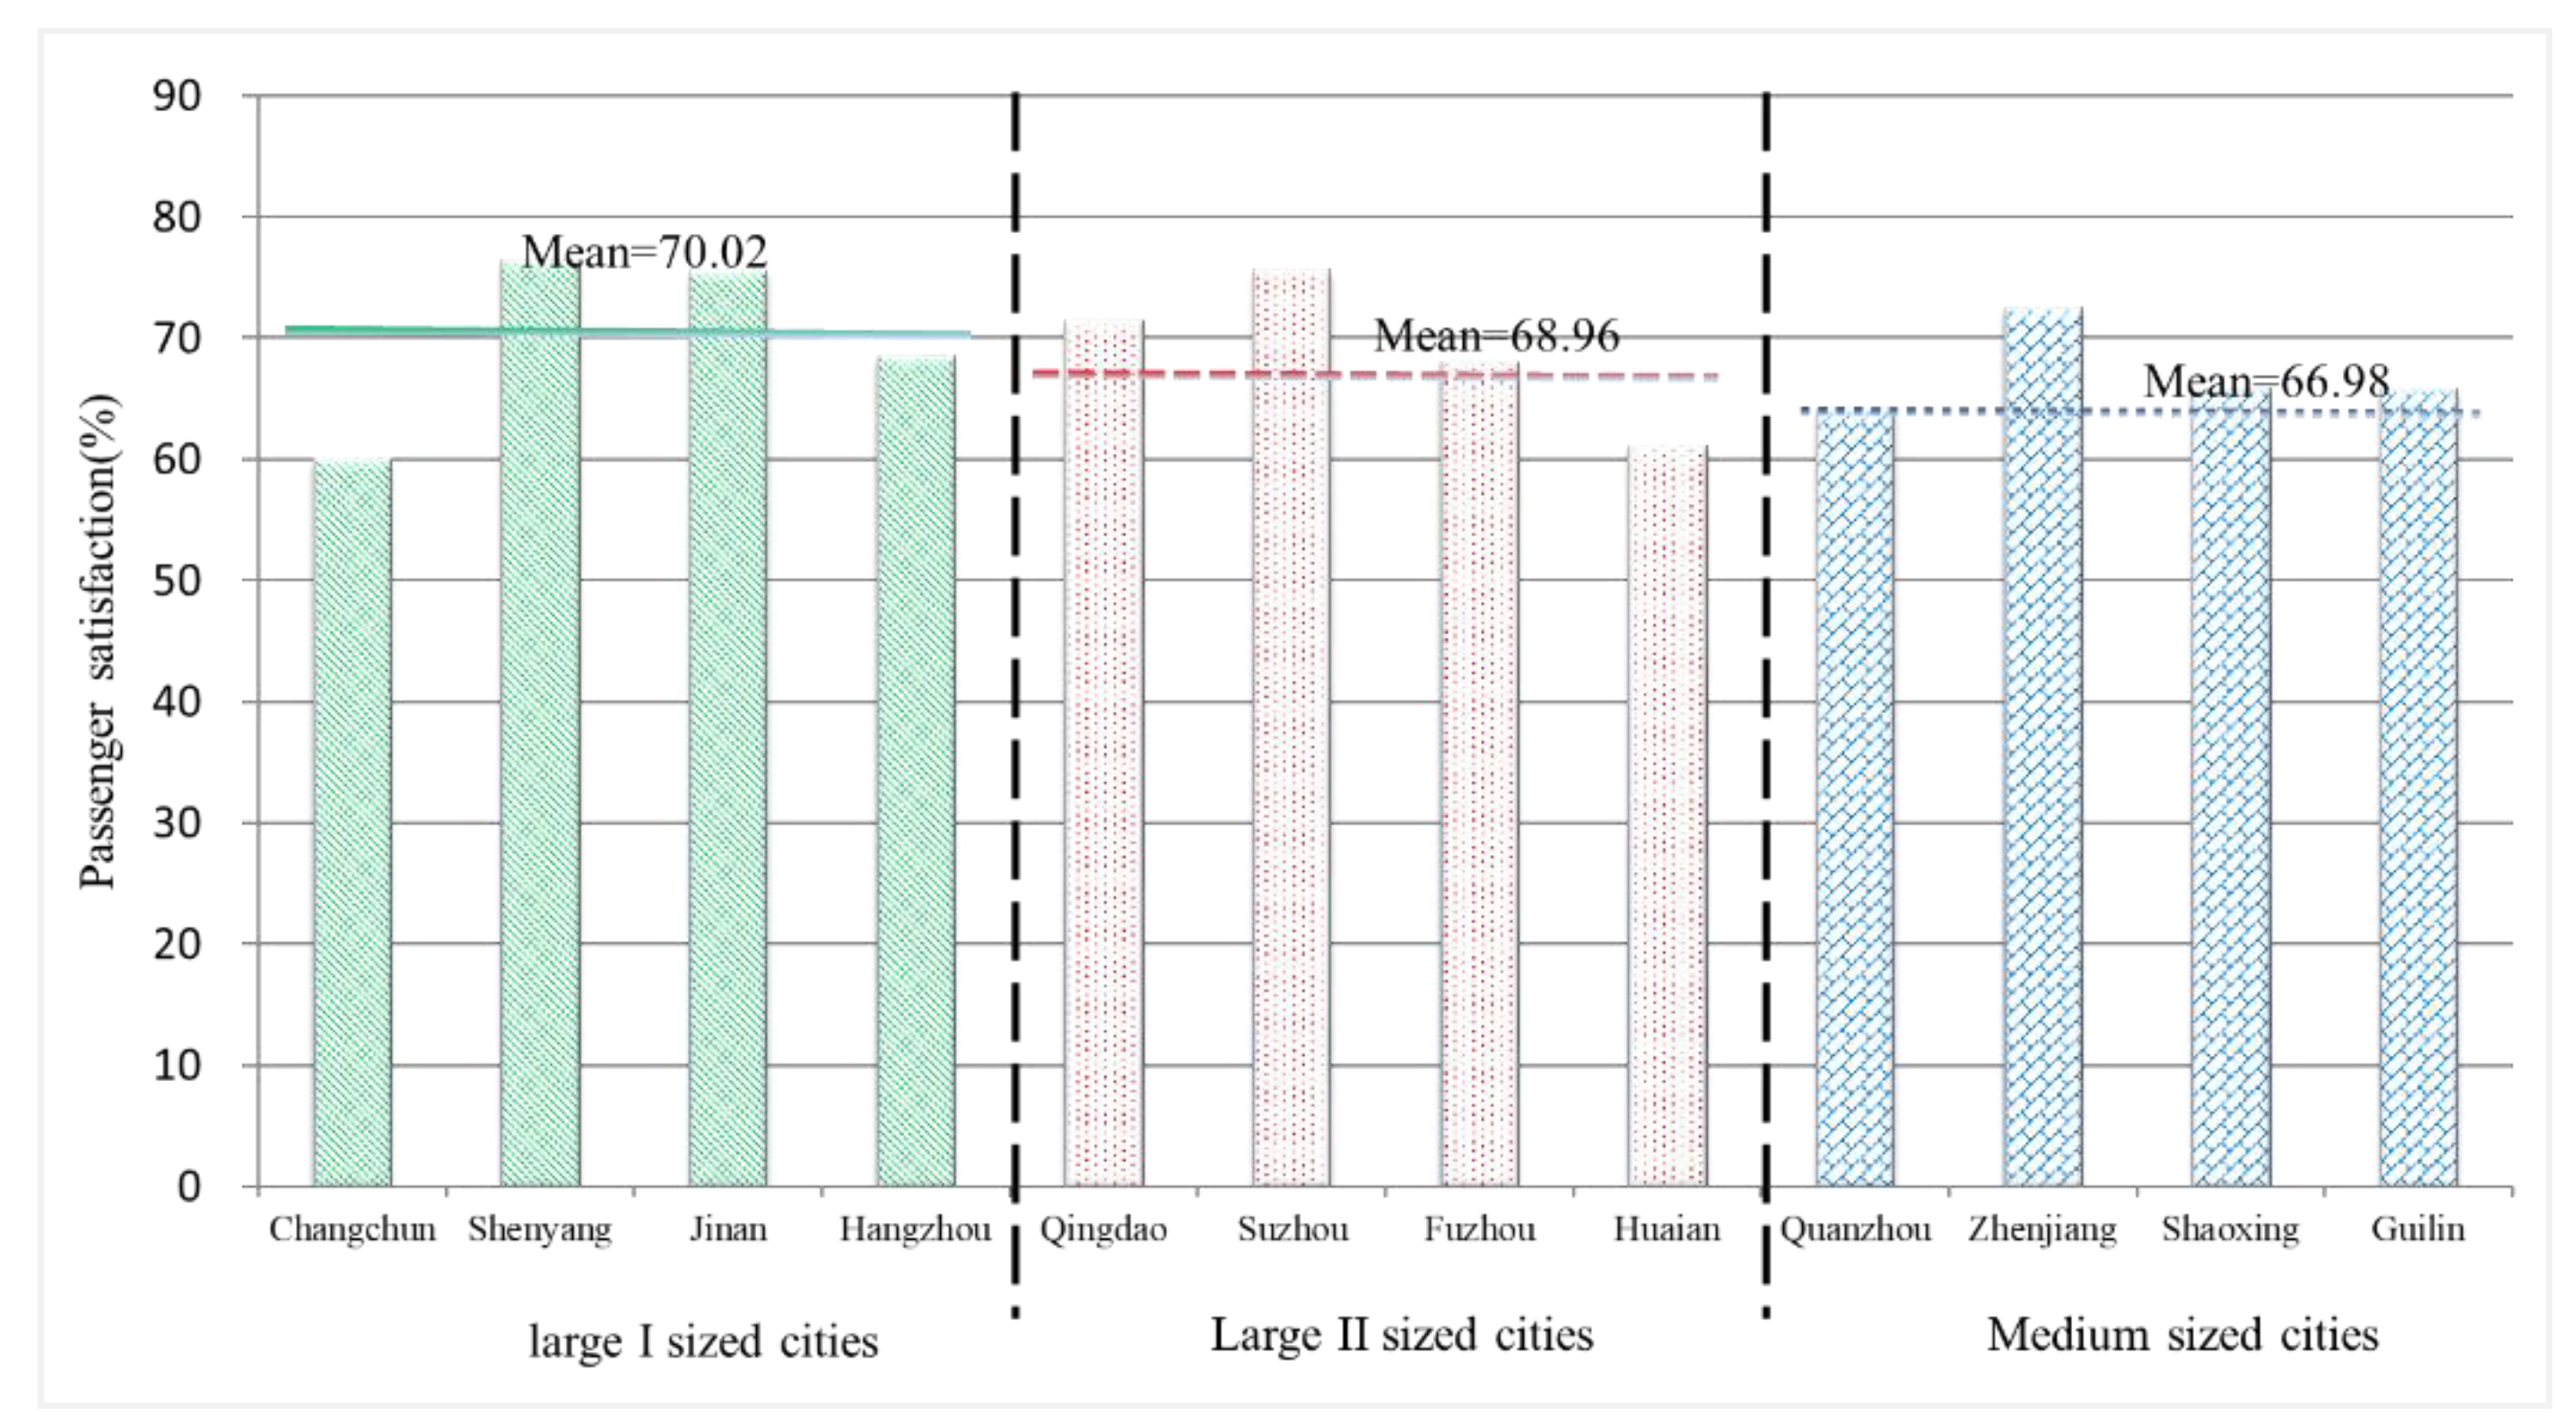
The average value of PSI with PT in 12 large- and medium-sized cities is 68.65%, PT satisfaction in large-I-sized cities is the highest, with an average value of 70.02%, followed by large-II-sized cities, with an average value of 68.96%, and that in medium-sized cities is the lowest, with an average value of 66.98%. The passenger satisfaction is not high. The service quality of PT need to be improved to better meet the public’s travel needs.
Different contractual forms incite different PT satisfaction levels, which is in line with previous studies [9,10]. However, in large sized cities (including large-I-sized cities and large-II-sized cities) and medium-sized cities, the different effects of contractual forms on PT satisfaction is significant, which is not in line with the results obtained in the literature [9,10]. In addition, the impacts of the passenger’s socioeconomic status as well as travel characteristics and city characteristics on PT satisfaction were also discussed. Most of the results were consistent with the results obtained in the literature [9,17,30,32,36].
These research findings have the following implications in regard to policy-making: Under the background of the current PT in China, establishing sound supervision and strengthening the government’s supervision for PT are two important ways to improve the service quality of PT. It is best to avoid leaving public transport companies to bear both production risk and revenue risk in medium cities. To improve PT satisfaction, in large sized cities (including large-I-sized cities and large-II-sized cities), choosing the management contracts to regulate PT may be the best. However, in medium-sized cities, choosing gross cost contracts to supervise PT may be the best, while choosing management contracts may be the worst. Thus, according to different urban scales, different and appropriate contractual form and supervision mechanisms should be chosen to regulate public transport services.
The findings in this paper will contribute to exploring the effect mechanism of contractual forms on PT satisfaction and providing theoretical basis for choosing contractual forms according to urban scale and improvement strategies in PT. In further, the comprehensive performance containing the efficiency and satisfaction needs to be further discussed. In addition, the different effects of supervision mechanism on comprehensive performance in different cities are another possible area of future research.

Author Contributions

C.Z. proposed and designed the research ideas and framework, written and revised the manuscript; D.W. designed the survey, collected and analyzed the data; A.N. proposed the research framework, conducted discussions and proofread the manuscript; X.N. and G.X. provided some comments and helped to edit the manuscript. All authors reviewed and approved the final manuscript.

Funding

The research described in this paper is largely supported by Philosophy and Social Science Project of Zhejiang Province, China (Grant No. 19NDQN361YB), MOE (Ministry of Education in China) Project of Humanities and Social Sciences (Grant No. 19YJCZH238), Natural Science Foundation of China (Grant No. 71901196, 71601118), Natural Science Foundation of Zhejiang Province, China (Grant No. LQ18E080010) and Fundamental Research Funds of Zhejiang Sci-Tech University (Grant No. 2019Q056).

Acknowledgments

The authors thank the managers and respondents at the sector of PT in China for providing data and information that were essential for this work. The authors would like to thank the anonymous referees for their helpful comments and valuable suggestions that have helped improve the content and composition substantially.

Conflicts of Interest

The authors declare no conflict of interest.

References

  1. Xi, J. Secure a Decisive Victory in Building a Moderately Prosperous Society in All Respects and Strive for the Great Success of Socialism with Chinese Characteristics for a New Era. Available online: http://www.xinhuanet.com//politics/19cpcnc/2017-10/27/c_1121867529.htm/ (accessed on 27 October 2017).
  2. Ministry of Transport. Available online: http://www.mot.gov.cn/zhengcejiedu/quanmiansrtjlsjtfz/xiangguanzhengce/ (accessed on 27 November 2017).
  3. Zhang, C.; Xiao, G.; Liu, Y.; Yu, F. The relationship between organizational forms and comprehensive effectiveness for public transport services in China? Transp. Res. Part A Policy Pract. 2018, 118, 783–802. [Google Scholar] [CrossRef]
  4. Roy, W.; Yvrande-Billon, A. Ownership, contractual practices and technical efficiency: The case of urban public transport in France. J. Transp. Econ. Policy 2007, 41, 257–282. [Google Scholar]
  5. Zhang, C.; Juan, Z.; Xiao, G.; Luo, Q. Do contractual practices affect technical efficiency? Evidence from public transport operators in China. Transp. Res. Part E Logist. Transp. Rev. 2015, 80, 39–55. [Google Scholar] [CrossRef]
  6. Gould Map. Available online: http://www.199it.com/archives/644861.html/ (accessed on 20 October 2017).
  7. Xiao, G.; Cheng, Q.; Zhang, C. Detecting travel modes from smartphone-based travel surveys with continuous hidden Markov models. Int. J. Distrib. Sens. Netw. 2019, 15, 1–15. [Google Scholar] [CrossRef]
  8. Wang, H.; Xiong, W.; Wu, G.; Zhu, D. Public–private partnership in Public Administration discipline: A literature review. Public Manag. Rev. 2017, 20, 293–316. [Google Scholar] [CrossRef]
  9. Zhang, C.; Juan, Z.; Lu, W.; Xiao, G. Do the organizational forms affect passenger satisfaction? Evidence from Chinese public transport service. Transp. Res. Part A Policy Pract. 2016, 94, 129–148. [Google Scholar] [CrossRef]
  10. Fiorio, C.V.; Florio, M.; Perucca, G. User satisfaction and the organization of local public transport: Evidence from European cities. Transp. Policy 2013, 29, 209–218. [Google Scholar] [CrossRef]
  11. Wang, H.; Mu, R.; Liu, S. The effects of privatisation on the equity of public services: Evidence from China. Policy Politics 2018, 46, 427–443. [Google Scholar] [CrossRef]
  12. Albalate, D.; Bel, G.; Joan, C. Governance and regulation of urban bus transportation: Using partial privatization to achieve the better of two worlds. Regul. Gov. 2012, 6, 83–100. [Google Scholar] [CrossRef]
  13. Smirnova, O.V.; Leland, S.M. The Role of Power and Competition in Contracting Out: An Analysis of Public Transportation Markets. Adm. Soc. 2013, 48, 421–443. [Google Scholar] [CrossRef]
  14. Arrigo, U.; Foggia, G.D. The scope of public organisations with productive functions: Insights from the inefficiency of Italian local public transport. Eur. J. Gov. Econ. 2016, 4, 134–154. [Google Scholar]
  15. Rosell, J.; Hayashi, Y.X. Urban bus contractual regimes in small- and medium-sized municipalities: Competitive tendering or negotiation? Transp. Policy 2016, 60, 54–62. [Google Scholar] [CrossRef]
  16. De Oña, J.; De Oña, R.; Eboli, L.; Mazzulla, G. Perceived service quality in bus transit service: A structural equation approach. Transp. Policy 2013, 29, 219–226. [Google Scholar] [CrossRef]
  17. Ratanavaraha, V.; Jomnonkwao, S.; Khampirat, B.; Watthanaklang, D.; Iamtrakul, P. The complex relationship between school policy, service quality, satisfaction, and loyalty for educational tour bus services: A multilevel modeling approach. Transp. Policy 2016, 45, 116–126. [Google Scholar] [CrossRef]
  18. Shen, W.; Xiao, W.; Wang, X. Passenger satisfaction evaluation model for Urban rail transit: A structural equation modeling based on partial least squares. Transp. Policy 2016, 46, 20–31. [Google Scholar] [CrossRef]
  19. Fornell, C.; Johnson, M.D.; Anderson, E.W.; Cha, J.; Bryant, B.E. The American customer satisfaction index: Nature, purpose, and findings. J. Mark. 1996, 60, 7–18. [Google Scholar] [CrossRef]
  20. Chang, Y.-H.; Yeh, C.-H. Corporate social responsibility and customer loyalty in intercity bus services. Transp. Policy 2017, 59, 38–45. [Google Scholar] [CrossRef]
  21. Rahman, M.S.; Mannan, M.; Hossain, M.A.; Hossain, M.H. Patient’s behavioral intention: Public and private hospitals context. Mark. Intell. Plan. 2018, 36, 349–364. [Google Scholar] [CrossRef]
  22. Yao, D.; Xu, L.; Li, J. Evaluating the Performance of Public Transit Systems: A Case Study of Eleven Cities in China. Sustainability 2019, 11, 3555. [Google Scholar] [CrossRef]
  23. Del Castillo, J.M.; Benitez, F.G. Determining a public transport satisfaction index from user surveys. Transp. A Transp. Sci. 2013, 9, 713–741. [Google Scholar] [CrossRef]
  24. Hensher, D.A. The relationship between bus contract costs, user perceived service quality and performance assessment. Int. J. Sustain. Transp. 2014, 8, 5–27. [Google Scholar] [CrossRef]
  25. Blaž, J.; Zajc, K.; Zupan, S.; Ambrož, M. Evaluation System for the Implementation of Public Passenger Transport as a Public Service Obligation. Sustainability 2019, 11, 3294. [Google Scholar] [CrossRef]
  26. Zhang, C.; Liu, Y.; Lu, W.; Xiao, G. Evaluating passenger satisfaction index based on PLS-SEM model: Evidence from Chinese public transport service. Transp. Res. Part A Policy Pract. 2019, 120, 149–164. [Google Scholar] [CrossRef]
  27. DeVellis, R.F. Scale Development: Theory and Applications; SAGE Publications: London, UK, 2016. [Google Scholar]
  28. Mcdonald, R.P.; Ho, M.H. Principles and practice in reporting structural equation analyses. Psychol. Methods 2002, 7, 64–82. [Google Scholar] [CrossRef] [PubMed]
  29. Miles, J.; Shevlin, M. A time and a place for incremental fit indices. Personal. Individ. Differ. 2007, 42, 869–874. [Google Scholar] [CrossRef]
  30. Diana, M. Measuring the satisfaction of multimodal travelers for local transit services in different urban contexts. Transp. Res. Part A Policy Pract. 2012, 46, 1–11. [Google Scholar] [CrossRef] [Green Version]
  31. Nkurunziza, A.; Zuidgeest, M.; Brussel, M.; Van den Bosch, F. Spatial variation of transit service quality preferences in Dar-es-Salaam. J. Transp. Geogr. 2012, 24, 12–21. [Google Scholar] [CrossRef]
  32. Le-Klähn, D.-T.; Hall, C.M.; Gerike, R. Analysis of Visitor Satisfaction with Public Transport in Munich. J. Public Transp. 2014, 17, 68–85. [Google Scholar] [CrossRef] [Green Version]
  33. Tyrinopoulos, Y.; Antoniou, C. Public transit user satisfaction: Variability and policy implications. Transp. Policy 2008, 15, 260–272. [Google Scholar] [CrossRef]
  34. Mouwen, A.; Rietveld, P. Does competitive tendering improve customer satisfaction with public transport? A case study for the Netherlands. Transp. Res. Part A Policy Pract. 2013, 51, 29–45. [Google Scholar] [CrossRef]
  35. Dell’Olio, L.; Ibeas, A.; Cecin, P. The quality of service desired by public transport users. Transp. Policy 2011, 18, 217–227. [Google Scholar] [CrossRef]
  36. Mouwen, A. Drivers of customer satisfaction with public transport services. Transp. Res. Part A Policy Pract. 2015, 78, 1–20. [Google Scholar] [CrossRef]
  37. Ji, J.; Gao, X. Analysis of people’s satisfaction with public transportation in Beijing. Habitat Int. 2010, 34, 464–470. [Google Scholar] [CrossRef]
  38. Barros, C.P.; Dieke, P.U. Measuring the economic efficiency of airports: A Simar-Wilson methodology analysis. Transport. Res. E Logist. Transport. Rev. 2008, 44, 1039–1051. [Google Scholar] [CrossRef]
  39. Simar, L.; Wilson, P.W. Estimation and inference in two-stage, semi-parametric models of production processes. J. Econom. 2007, 136, 31–64. [Google Scholar] [CrossRef]
  40. Quinet, E.; Vickerman, R. Principles of Transport Economics; Edward Elgar: Cheltenham, UK, 2004. [Google Scholar]
Figure 1. Reform course of public transport in China.
Sustainability 11 05453 g001
Figure 2. Structural model of passenger satisfaction index.
Sustainability 11 05453 g002
Figure 3. Satisfaction of different urban scale.
Sustainability 11 05453 g003
Figure 4. Ratio of passenger satisfaction to passenger dissatisfaction.
Sustainability 11 05453 g004
Figure 5. Statistical analysis of the contractual forms in 12 cities.
Sustainability 11 05453 g005
Figure 6. Travel time of the respondents.
Sustainability 11 05453 g006
Figure 7. Usage frequency of the respondents.
Sustainability 11 05453 g007
Table 1. Potential variables and their manifest variables.
Potential VariableManifest VariableSymbol
Corporate image
(CI)
Image on the service and operationCI1
Image of commercial moralityCI2
Image of social responsibilityCI3
Perceived quality
(PQ)
Security
(SE)
Smoothly drivingSE1
Normally operatingSE2
Public safetySE3
Convenience (CO)Convenient transferCO1
Convenient and reasonable bus stationsCO2
Waiting timeCO3
Reliability (RE)Reliability of departure schedulesRE1
Reliability of arrival stationRE2
Reliability of driving routesRE3
Comfort (CO)Bus appearanceCO1
Waiting environmentCO2
Crowded situationCO3
Operation service (OS)Information serviceOS1
Clarity of station announcementOS2
Perceived value
(PV)
Evaluation of the service quality of PT relative to its farePV1
Evaluation of the fares of PT relative to its service qualityPV2
Passenger satisfaction (PS)Overall level of PT satisfactionPS1
The gap between the reality and ideal service qualityPS2
Table 2. Urban Scale.
CityUrban Area
(Square Kilometer)
Urban Population
(10,000 persons)
Urban Scale
Changchun522.99340.52large-I-sized cities
Shenyang3471.00467.45
Jinan1210.00300.00
Hangzhou1484.96332.09
Qingdao1963.20298.76large-II-sized cities
Suzhou1523.88256.77
Fuzhou1043.00191.58
Huai’an227.00124.88
Quanzhou539.0098.70Medium-sized cities
Zhenjiang555.4379.38
Shaoxing497.0497.05
Guilin612.6385.48
Note: Data is from the Statistical Yearbook of China’s Urban Construction.
Table 3. Size of the questionnaire.
Urban ScaleCollected QuestionnaireBlank QuestionnaireUnqualified QuestionnaireValid Questionnaire
I large cities14901111351244
II large cities1586801581348
Medium cities1473831561234
Sum45492744493826
Table 4. Results of reliability and validity analysis.
Latent VariableManifest VariableStandard Factor Load P C R A V E C r o n b a c h s α
CICI10.74***0.7520.5590.834
CI20.82***
CI30.78***
SESE10.90***0.7860.5670.838
SE20.92***
SE30.77***
COCO10.76***0.8020.6760.865
CO20.67***
CO30.72***
REREL10.86***0.8080.6810.873
REL20.84***
REL30.73***
COCOM10.80***0.7750.5740.800
COM20.73***
COM30.81***
OSOS10.76***0.7610.6020.789
OS20.72***
PVPV10.83***0.7780.6350.822
PV20.81***
PSPS10.93***0.7810.6410.838
PS20.92***
Note: *** means P < 0.001.
Table 5. Goodness-of-fit indices.
Indexesχ2/dfGFINFICFIRMRSEA
Changchun0.3590.890.860.900.072
Shenyang0.3290.910.950.950.049
Jinan0.3250.900.931.000.048
Hangzhou0.3430.910.931.000.034
Qingdao0.2920.880.920.930.076
Suzhou0.3320.940.931.000.022
Fuzhou0.3220.910.980.980.042
Huai’an0.2590.940.910.990.028
Quanzhou0.3230.910.890.900.062
Zhenjiang0.3900.880.921.000.068
Shaoxing0.2970.950.960.960.029
Guilin0.3250.910.900.910.039
Recommended Value<5>0.9>0.9>0.9<0.08
Table 6. Classification of 12 cities according to their passenger satisfaction ratios.
CategoryCitiesPassenger Satisfaction Ratio
First categoryShenyang, Suzhou, JinanPi > 3
Second categoryZhenjiang, Qingdao, Hangzhou, Fuzhou2 ≤ Pi 3
Third categoryGuilin, Quanzhou, Shaoxing, Huai’an, ChangchunPi < 2
Note: Pi denotes the ratio of satisfied respondents and unsatisfied respondents for the ith city.
Table 7. Comparative analysis of the forms of contractual practices.
Contractual FormProduction Risk Shouldered byRevenue Risk Shouldered byDegree of SupervisionPayment Received by the Operators
management contractGovernment sectorGovernment sectorHigh S M = S e + ( R e R ) ( C e C )
net cost contractOperatorOperatorLow S N = S e
gross cost contractOperatorGovernment sectorMiddle S G = S e + ( R e R )
Note: S M , S G and S N represent the actual amount of payment received by the operators signed the management, net cost and gross cost contract, respectively. R and C are the realized revenues and the effective operating costs, respectively. S e represents the standard amount of subsidies provided by the local departments to the PT operators. R e and C e are the expected commercial revenues and operating costs, respectively.
Table 8. Socioeconomic characteristics group of observations.
Socioeconomic CharacteristicsSymbolPercentage (%)
GenderMaleMale58.56
FemaleFemale41.44
Age group<30AGE140.78
31–60AGE248.65
60+AGE310.57
Monthly income (¥)<4000INC137.52
4001–6000INC232.9
>6000INC329.58
Education levelHigh school and belowEDU141.03
College and UniversityEDU235.89
Post graduateEDU323.08
OccupationStudentOCC119.45
EmployeeOCC225.67
Civil servant, teacher or doctorOCC322.55
Self-employedOCC417.45
othersOCC514.88
Table 9. City characteristics group of observations.
City CharacteristicsSymbolMeanS. D.MaximumMinimum
GDP (Ten thousand ¥/person)City_GDP8.4122.72612.3494.137
Road area (km2/person)City_Road1.9240.5402.8131.106
Private car (car/person)City_Car0.3390.1980.8480.086
Note: S.D. denotes the standard deviation.
Table 10. Effect of contractual forms on PT satisfaction in large-I-sized cities: management, gross cost versus net cost contract.
VariablesCoef.Model(1)Model(2)Model(3)Model(4)
C o n t r a c t i Manag θ M a g 11.345***11.899***12.908***4.370***
(10.110)(10.440)(11.230)(11.750)
Gross θ G r o s s 2.009**1.714**2.222***2.353***
(2.160)(2.380)(2.810)(2.950)
P a s s e n g e r _ c h a r a c t e r i s t i c s i Male β M a l e P –0.042–0.0661.213
(–0.040)(–0.070)(1.200)
Age β A g e P 10.516*11.601*7.604*
(1.680)(1.830)(1.940)
Occ1 β O c c 1 P 2.693*2.559**3.494**
(1.890)(2.120)(2.470)
Occ2 β O c c 2 P –0.746**–0.952**–0.623***
(–2.310)(–2.870)(–3.260)
Occ3 β O c c 3 P –2.745–2.358*2.729**
(–1.350)(–1.860)(–2.140)
Occ4 β O c c 4 P 1.7871.413*2.150*
(1.250)(1.710)(1.800)
Edu β E d u P –3.971**–3.864**–2.477**
(–2.370)(-2.350)(–2.460)
Inc β I n c P –4.805***–4.554***–4.066***
(–3.760)(–3.610)(–3.260)
T r a v e l _ c h a r a c t e r i s t i c s i Travel_Time β T i m e T –2.860***–2.738***
(–3.500)(–3.400)
Bus_Fre β F r e T 1.904***1.959***
(3.240)(3.410)
C i t y _ c h a r a c t e r i s t i c s i City_Road β R o a d C –2.805***
(–3.300)
City_GDP β G d p C –8.619
(–1.670)
City_Car β C a r C –73.414**
(–2.150)
_cons β 0 59.350***45.517***44.356***33.710***
(9.840)(5.210)(5.160)(3.120)
Number of obs1244124412441244
Log-likelihood–2695.143–2679.963–2670.083–2656.561
Prob>chi20.0000.0000.0000.000
Notes: The values in parentheses represent T values. *, **, ***Coefficients are statistically significant at the 0.10, 0.05 and 0.01 probability level, respectively.
Table 11. Effect of contractual forms on PT satisfaction in large-II-sized cities: management, gross cost versus net cost contract.
VariablesCoef.Model(1)Model(2)Model(3)Model(4)
C o n t r a c t i Manag θ M a g 1.331**1.741**2.655***3.116***
(2.330)(2.450)(2.630)(2.780)
Gross θ G r o s s 0.860**1.297**1.903***2.290***
(2.260)(2.610)(2.870)(3.360)
P a s s e n g e r _ c h a r a c t e r i s t i c s i Male β M a l e P –1.100–1.238–1.415*
(–1.390)(–1.560)(–1.740)
Age β A g e P 0.7310.6200.916
(0.660)(0.560)(0.840)
Occ1 β O c c 1 P 1.7671.632*2.495**
(1.000)(1.930)(2.440)
Occ2 β O c c 2 P 2.399**2.119**2.227**
(1.870)(2.180)(2.250)
Occ3 β O c c 3 P –1.665*–1.332*1.273**
(–1.840)(–1.940)(2.160)
Occ4 β O c c 4 P 2.1121.8102.429*
(0.780)(0.670)(1.920)
Edu β E d u P –0.147**–0.418**–0.504**
(–2.120)(–2.330)(–2.400)
Inc β I n c P –0.783–0.809–0.795
(–0.660)(–0.680)(–0.680)
T r a v e l _ c h a r a c t e r i s t i c s i Travel_Time β T i m e T –0.826*–0.074**
(–1.660)(–2.120)
Bus_Fre β F r e T 0.465**0.067**
(2.180)(2.170)
C i t y _ c h a r a c t e r i s t i c s i City_Road β R o a d C –3.005**
(–2.400)
City_GDP β G d p C –0.734*
(–1.770)
City_Car β C a r C –8.380**
(–2.140)
_cons β 0 66.693***67.360***64.719***51.279***
(76.460)(20.400)(18.260)(6.420)
Number of obs1348134813481348
Log-likelihood–3319.848–3311.720–3309.687–3293.549
Prob>chi20.00220.00080.00000.0000
Table 12. Effect of contractual forms on PT satisfaction in medium-sized cities: management, gross cost versus net cost contract.
VariablesCoef.Model(1)Model(2)Model(3)Model(4)
C o n t r a c t i Manag θ M a g –8.242***–5.386***–5.325***–4.527***
(–7.650)(–4.270)(–4.220)(–3.500)
Gross θ G r o s s 2.869**1.524***1.511***1.830***
(2.160)(2.640)(2.840)(2.780)
P a s s e n g e r _ c h a r a c t e r i s t i c s i Male β M a l e P –0.991–0.893–0.463
(–1.160)(–1.040)(–0.470)
Age β A g e P –0.233**–0.189**–0.480***
(–2.030)(–2.170)(–3.440)
Occ1 β O c c 1 P 4.106***3.831**3.683**
(2.620)(2.440)(2.360)
Occ2 β O c c 2 P 6.438***6.164***6.188***
(2.950)(2.820)(2.840)
Occ3 β O c c 3 P 1.270*1.775**4.390*
(1.710)(1.970)(1.910)
Occ4 β O c c 4 P 3.404*3.135*2.649**
(1.770)(1.860)(2.150)
Edu β E d u P –6.054***–5.761***–5.184***
(–5.890)(–5.540)(–4.910)
Inc β I n c P –0.645–0.544–0.926
(–0.590)(–0.500)(–0.840)
T r a v e l _ c h a r a c t e r i s t i c s i Travel_Time β T i m e T –1.196**–0.589***
(–2.130)(–3.260)
Bus_Fre β F r e T 0.288***0.335***
(3.190)(3.720)
C i t y _ c h a r a c t e r i s t i c s i City_Road β R o a d C –13.342**
(–2.130)
City_GDP β G d p C 2.754
(1.270)
City_Car β C a r C –14.165**
(–2.270)
_cons β 0 77.94085.68283.32489.372
(80.700)(28.690)(24.770)(6.940)
Number of obs1234123412341234
Log-likelihood–2750.486–2721.879–2720.196–2716.260
Prob>chi20.0000.0000.0000.000
Table 13. Different effects of contractual forms on PT satisfaction in large- and medium-sized cities.
Contractual FormLarge-I-sized CitiesLarge-II-sized CitiesMedium-sized Cities
HighMediumLowHighMediumLowHighMediumLow
Manag
Gross
Net

