Abstract
Built-up land sprawl is the most intuitive manifestation and main cause of cultivated land pattern change. Understanding spatiotemporal change and its driving factors in the impact of built-up land sprawl on cultivated landscape eco-security under the urbanization gradient can reveal the nature of cultivated landscape ecological risk caused by urban sprawl and promote the scientific implementation of urban planning and cultivated land protection policies. Taking Yangzhou, a medium-sized city with rapid urbanization, as an example, we used multi-sources data (30 m resolution Landsat images in 1998, 2008, and 2018) to analyze the sprawl intensity and direction of built-up land and cultivated landscape ecological risk areas under the urbanization gradient and the spatiotemporal characteristics of the relationship between them. Further, we employed the boosted regression tree (BRT) model to quantify the effects of geographic, social, and economic factors on the impact of built-up land sprawl on cultivated landscape eco-security under different urbanization gradients. Results showed that built-up land sprawl rate increased first and then decreased from 1998 to 2018, forming the sprawl gradients of no. 1–8, no. 8–16, and no. 16–30 urban circle. Its sprawl direction is mainly 20°–90°, 190°–240°, and 305°–355°, whereas cultivated landscape ecological risk area is a continuous sprawl, and the sprawl gradient and direction of the main risk area are consistent with the built-up land. In 1998–2008, the main areas where built-up land sprawl affects cultivated landscape eco-security are located in no. 1–16 urban circle, 20°–55°. From 2008 to 2018, it was located in no. 16–26 urban circle, 305°–355°. In this process, the influence of geospatial factors decreases gradually over time but increases outwardly with the urbanization gradient. The influence of social factors decreases first with time and then increases with the urbanization gradient outward in space. Economic factors increase with time but decrease with the urbanization gradient. The influence of each factor varies greatly over time and with the urbanization gradient.
1. Introduction
The protection of cultivated land is related to national food security, sustainable economic development, social harmony and stability, and a country’s long-term peace and stability [1]. Since 2006, when China first put forward the “red line of 1.8 billion mu of cultivated land” protection policy [2], it has reiterated its importance many times [3,4]. However, with the overall deepening of reform in China and the increasing downward pressure on the economy, whether this policy will hinder economic development and urbanization has become an urgent research topic [5]. According to the research, built-up land sprawl, as the most drastic and intuitive manifestation of urbanization, blindly occupies cultivated land resources due to lack of rational planning and guidance, leading to an increasingly broken cultivated land pattern and a serious threat to production efficiency [6]. Therefore, understanding spatiotemporal change and its driving factors in the impact of built-up land sprawl on cultivated landscape eco-security under the urbanization gradient can reveal the nature of cultivated landscape ecological risk caused by urban sprawl. It will provide technical support and a decision-making basis for the implementation of the protection policy of “red line of 1.8 billion mu of cultivated land”, which is of great practical significance for realizing the sustainable utilization of land resources.
At present, scholars worldwide have made fruitful achievements in the research of built-up land sprawl and cultivated land protection but have mainly focused on their own unilateral research [7,8,9]. Although some scholars have analyzed the correlation between them, it mainly includes three aspects: planning [10,11,12], utilization mode [13,14], and management system [15,16,17]. However, there is no research on the key driving factors and the change characteristics of quantifying the impact of built-up land sprawl on cultivated land pattern under urbanization gradient. In addition, built-up land sprawl and cultivated land pattern are affected by multiple factors, including geospatial (topography, rivers, etc.) and socioeconomic (population, fiscal revenue, etc.) [18]. Moreover, research methods are often limited by data types (such as classified data and continuous data), quantitative relations (linear relations and nonlinear relations), normal distribution, and so on [19], which will have a great impact on the accuracy and comprehensiveness of the evaluation of driving factors. At present, the emergence of machine-learning technology has broken through the limitations of traditional statistical methods [20]. Therefore, combining the data of the impact of built-up land sprawl on cultivated land and machine-learning technology, as well as quantitatively identifying the key driving factors of the impact of built-up land sprawl on cultivated land will provide an effective approach for its research.
The integration of a boosted regression tree (BRT) model and graph theory provides a scientific basis for quantifying the driving mechanisms of the influence relationship between built-up land sprawl and cultivated land pattern [21]. The BRT model is a representative technique to solve regression and classification problems. This model has the advantages of simultaneously dealing with different data types, quantitative relations, inter-relationship between variables, missing data, and so on and has been successfully used to quantitatively study the influence of multiple factors [22,23,24,25]. Graph theory can construct comprehensive indexes for built-up land sprawl and cultivated land pattern, such as urbanization intensity index (UII) and cultivated landscape eco-security index (LSES), which have important application value for research on the influence relationship between them. Therefore, the combination of different methods and technologies can comprehensively consider different variables and make a more comprehensive and accurate evaluation of built-up land sprawl and cultivated land pattern [26].
At present, the research on urban sprawl in China mainly focuses on large cities but lacks enough attention to small and medium-sized cities [27], and this includes research on cultivated land in plain areas [28]. Yangzhou city, in the center of Jiangsu province, is located in the Yangtze river delta city cluster and the lower plain area of the Yangtze river. Its development is not only essential to comprehensively promoting urbanization but also facing an important period of first-class farmland quality protection [29]. The research on the spatial interaction between built-up land sprawl and the protection of cultivated landscape pattern in Yangzhou has a very important guiding significance for the implementation of the “1.8 billion mu of cultivated land” policy.
The purpose of this study is to examine the spatiotemporal change and its driving factors in the impact of built-up land sprawl on cultivated landscape eco-security under the urbanization gradient in Yangzhou. Through the combination of Fragstats4.2 software and RStudio software, we simulated the spatial relationship between built-up land patches and cultivated land patches, and revealed the main factors affecting the spatiotemporal change characteristics of them. Our hypothesis is that built-up land sprawl leads to different degrees of cultivated landscape ecological risks under different urbanization gradients and that there will therefore be an extreme value to reflect the specific spatial position of cultivated land protection in the process of spatial interaction between them. Our specific research questions were as follows: (1) what is the intensity and spatial location of urban expansion? (2) Where are the risk areas of cultivated landscape ecology? (3) Where are the main impact areas of built-up land sprawl on cultivated landscape eco-security? (4) Which factors play a leading role in the process of urban sprawl affecting cultivated landscape eco-security?
2. Materials and Methods
2.1. Data Source and Processing
Remote sensing image data, road vector data, and rural residential vector data are obtained from Geographical Data Cloud, National Earth System Science Data Sharing Infrastructure, and Lake-Watershed Science Data Center, respectively, for free. In addition, all kinds of socioeconomic data are freely available from the relevant statistical yearbook.
According to the classification template of the national standard definition of land use classification, we used the maximum likelihood classification in ArcGIS 10.2 software to classify the land use types of remote sensing images of the research area in 1998, 2008, and 2018, which were divided into 6 categories: cultivated land, forest land, water, road land, built-up land, and utilized land. Then, according to the historical map data of Google Earth, we used the kappa coefficient method to verify the land type classification results of the third phase. The results showed that kappa coefficients of remote sensing classification in 1998, 2008, and 2018 were 0.85, 0.87, and 0.88, respectively, with an accuracy of 85.75%, 87.62%, and 88.51%, meeting the research needs.
2.2. Research Methods
2.2.1. Analysis of Urbanization Gradient and Sprawl Intensity
The urban circle is usually divided from the city center to make a series of equidistant buffer zones outwards at a certain buffer distance. Then, we take it as a basic analysis unit to understand the spatiotemporal change of urban sprawl [30]. We regard the most densely built area in the center of Yangzhou city as the urban center area, which is designated as the 1st circle. Through the Arcgis10.2 “buffer wizard” tool, we built several buffer zones with a width of 1 km, and gradually buffered outwards to cover the main urban area and contiguous built-up areas, eventually forming a total of 30 circles.
The urbanization intensity index (UII) is used to characterize the sprawl speed and intensity of built-up land, and it is essentially a standardized treatment of the sprawl speed of built-up land of each urban circle in each period [30]. Based on the urban land use sprawl center, the index model compares the urban sprawl speed among urban circle units. It can not only analyze and compare the differences of urban sprawl speed in different spatial directions but also visually outline the overall spatial form of urban sprawl. The formula is
where is the index of urban sprawl intensity of the ith circle in t–t+n period, is the built-up land area of the ith circle in the t year; is the total land area of the ith circle.
2.2.2. Analysis of Cultivated Landscape Eco-Security under Urbanization Gradient
Landscape eco-security evaluation model is an organic combination of ecological risk and ecological health [31]. The state and trend of its index can not only reflect the quantity of cultivated land, the demand of cultivated land investment, and the utilization efficiency of cultivated land but also can better reflect the structure and function of cultivated landscape, the integrity of ecosystem, the dynamics and ecological succession of landscape patches, and the resistance and restoration ability of the system to disturbance [32]. It is an important landscape ecological basis for the protection and promotion of cultivated land quality. The formula is:
where is the index of landscape ecological security, is the index of patch density, is the index of edge density. The above indexes can mainly reflect the fragmentation of cultivated land and the complexity of shape, which are all patch type indexes. is the index of landscape fragility, which can comprehensively reflect the stability, risk resistance, and resilience of cultivated landscape. The formula is as follows:
where is the index of area weighted mean shape, is the index of mean patch fractal dimension, is the index of landscape division. In the formula, a, b, and c are factor weights. Based on analytic hierarchy process (AHP) and expert opinions, it is concluded that a, b, and c are 0.54, 0.27, and 0.19 respectively.
According to the related research [33,34], we use the moving window method with a radius of 500 m in Fragstats4.2 software to calculate the landscape pattern indexes of cultivated land in 1998, 2008, and 2018. Then, combined with the landscape eco-security index model, we use Zonal Statistic as a table tool in ArcGIS 10.2 software to calculate the average value of the cultivated landscape eco-security index in each circle. Finally, according to the Jenks Nature Breaks Classification method, we divide the calculation results into four levels: dangerous state (LSES value is greater than or equal to 0 and less than or equal to 0.2), low dangerous state (LSES value is greater than 0.2 and less than or equal to 0.55), low safe state (LSES value is greater than 0.55 and less than or equal to 0.7), and safe state (LSES value is greater than or equal to 1).
2.2.3. Analysis of Driving Factors Based on BRT
According to the land use data of 1998, 2008, and 2018, we calculate the cultivated landscape eco-security index under the urbanization gradient. We assign the cultivated landscape eco-security index to the corresponding cultivated land vector layer and convert it into raster data with a spatial resolution of 30 m. Then, we assign the acquired geospatial and socioeconomic data to the corresponding township vector layer and convert it into raster data with a spatial resolution of 30 m. Finally, 2712 sample points were extracted from 30 urban circles at a fixed distance of 1 km, and the values of cultivated landscape eco-security and various influencing factors were extracted from these points.
In RStudio software, we use the BRT method of “gbm” package to quantitatively reveal the key driving forces and rules of the impact of built-up land sprawl on cultivated landscape eco-security under the gradient of urbanization. It can intuitively identify the relative effects of multiple factors. According to relevant research [35], we set a learning rate of 0.005 and a tree complexity of 4.
3. Results and Discussion
3.1. Spatiotemporal Characteristics of Built-Up Land Sprawl and Cultivated Land Area Change
The built-up land area in 30 urban circles increased continuously from 11502.4 ha in 1998 to 44478.5 ha in 2018. The proportion of it in the total area of urban circle increased from 6.7% to 17.8%. The vast majority of the expanding built-up land has been converted from cultivated land (Figure 1).
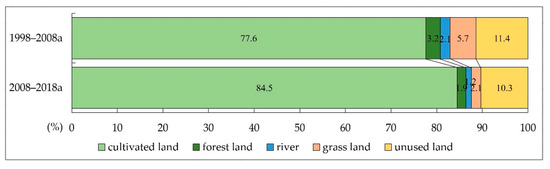
Figure 1.
Relative proportion of land use types occupied by built-up land sprawl.
From a numerical value point of view (Figure 2), the urban sprawl and cultivated land reduction was mainly concentrated in the no. 1–8 urban circle (UII greater than 10%) from 1998 to 2008. Its maximum value was 36.1% in the no. 3 urban circle. During 2008–2018, built-up land sprawl and cultivated land reduction were more extensive and intensive, mainly concentrated in no. 2–13 urban circle. The maximum value was 40.4% in no. 6 urban circle. From 1998 to 2018, the intensity of built-up land sprawl in no. 2–9 urban circle was the highest, higher than 30%. This indicates that the stock land within the main urban area of Yangzhou and the surrounding area near the main urban area are the key areas of built-up land sprawl.
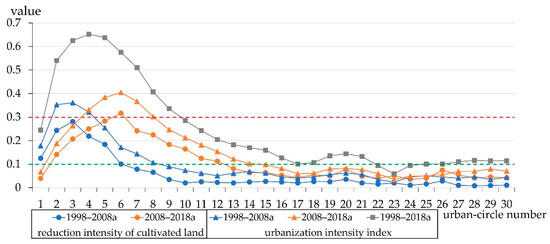
Figure 2.
Built-up land sprawl intensity and cultivated land area change.
From the perspective of space (Figure 3), the sprawl intensity and direction of built-up land in Yangzhou are very obvious. In 1998, 2008, and 2018, the main areas of built-up land sprawl reached no. 8, 16, and 30 urban circle, respectively. From 1998 to 2008, the main sprawl directions of built-up land were 30°–90° and 270°–300°.
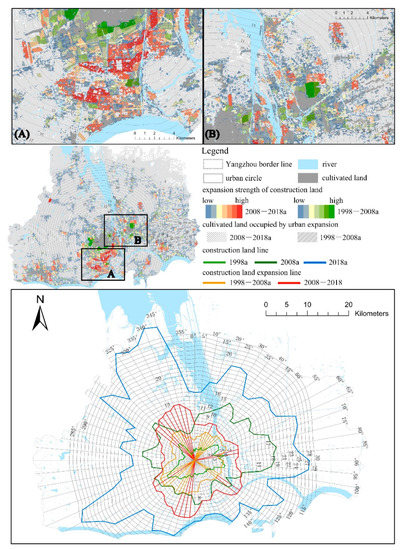
Figure 3.
Spatiotemporal change characteristics of built-up land sprawl intensity and direction. Zones A and B are zoomed-in views of the regions with significant changes.
3.2. Spatiotemporal Characteristics of Cultivated Landscape Eco-Security under Urbanization Gradient
From a numerical value point of view (Figure 4), the cultivated landscape eco-security index in Yangzhou increased outwards with urban circles and began to stabilize in no. 16 urban circle. In 1998 and 2008, the cultivated land eco-security index reached relatively safe levels (LSES value is greater than or equal to 0.55) outwards from no. 3 and no. 16 urban circle, respectively, but it was always in danger and reached relatively dangerous levels in 2018.
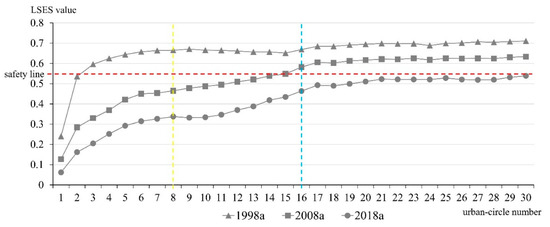
Figure 4.
Cultivated landscape eco-security index under urbanization gradient.
From the perspective of space (Figure 5), the area of cultivated landscape ecological risk (LSES value is less than 0.55) in Yangzhou has been sprawling year by year. Its main sprawl directions are 80°–100°, 190°–240°, and 300°–355°, which are basically the same as the sprawl direction of built-up land. In terms of sprawl intensity, the ecological risk lines of cultivated landscape (LSES value is less than 0.55) in 1998, 2008, and 2018 were extended to no. 16, no. 25, and no. 30 urban circle, respectively. Among them, the main area of landscape ecological risk was located in no. 8 and no. 16 urban circle, which is also consistent with the urban circle of built-up land sprawl intensity.
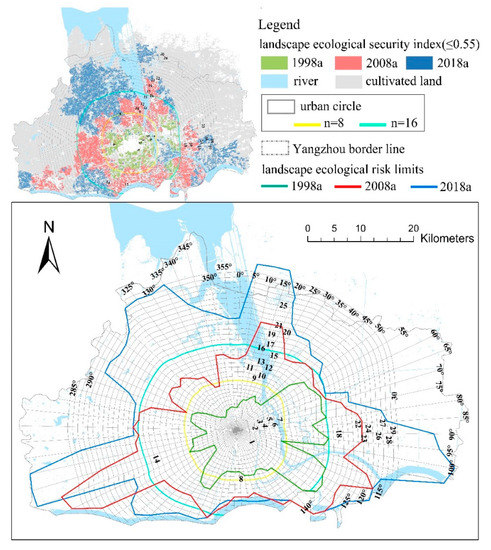
Figure 5.
Spatiotemporal characteristics of cultivated landscape ecological risk.
3.3. Driving Factors of Cultivated Landscape Eco-Security Influenced by Built-Up Land Sprawl under Urbanization Gradient
We used the BRT method to analyze the role of 12 driving factors, of which built-up land sprawl affected cultivated landscape eco-security in 1998, 2008, and 2018 (Figure 6). Results show that the 12 factors we selected could well explain the relationship between them. The BRT method’s ability to interpret cultivated landscape eco-security in the third phase was 90.4% (RMSE = 0.15), 88.3% (RMSE = 0.17), and 86.5% (RMSE = 0.19). Further, according to the analysis results of built-up land sprawl intensity and cultivated landscape ecological risk area, we separately carried out correlation analysis of driving factors for no. 0–8, no. 8–16, and no. 16–30 urban circle. The results are shown in Table 1.
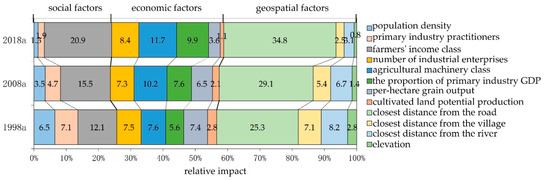
Figure 6.
Relative role of geospatial, social, and economic factors in the impact of built-up land on cultivated landscape eco-security.

Table 1.
Relative influence of social, economic, and geospatial factors on cultivated landscape eco-security under urbanization gradient.
From an overall perspective (Figure 6), among the relative influences of various driving factors, the geospatial spatial factors are all higher than the socioeconomic factors. Their relative influences were 43.4%, 42.6%, and 41.2% in 1998, 2008, and 2018, respectively, showing a decreasing trend. Among these geospatial factors, the closest distance to the road has the highest relative influence (25.3%–34.8%), which increases year by year. The closer the road, the greater the effect (Figure 7). The relative effect of elevation was the least (0.8%–2.8%) (Figure 6). With the increase of elevation, this factor changed from no obvious effect to 40 m after the promotion effect (Figure 7). The influence of the closest distance to the river and the closest distance from the village showed a decreasing trend (Figure 7). This shows that the farther the distance from the river and the village, the smaller the impact of built-up land sprawl on cultivated landscape eco-security pattern.
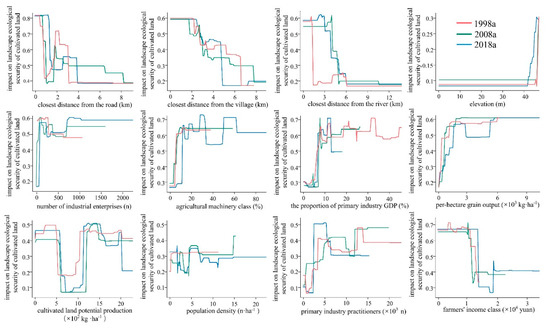
Figure 7.
Role of geospatial, social, and economic factors in the impact of built-up land on cultivated landscape eco-security in different periods.
The economic impact increased from 30.9% in 1998 to 34.7% in 2018 (Figure 6). Among them, the impact of the number of industrial enterprises, agricultural machinery class, the proportion of primary industry GDP, and per-hectare grain output (PHGO) had no obvious effect after promoting (Figure 7). However, the effect of cultivated land potential production is to inhibit it first, then promote it, and ultimately has no obvious effect (Figure 7).
Compared with geospatial and economic factors, social factors’ effect is minimal (23.7%–26.8%) (Figure 6). Among them, the relative influence of population density is the least (1.3%–6.5%). With the increase of population density, the effect of 0–10 people per hectare changed from slight to no obvious effect (Figure 7). The influence of farmers’ income level was the highest (14.1%–23.8%), and the farmers’ income level showed an inhibitory effect when it was 10,000–20,000 yuan (Figure 7). The relative influence of primary industry practitioners was 1.9%–7.1%. With the increase of the number of people, the cultivated landscape eco-security presents a trend of first promoting and then suppressing and finally having no obvious effect (Figure 7).
From the perspective of urbanization gradient, according to the analysis results, we arranged the relative influence values of different years from large to small, and screened the influencing factors whose sum reached 50% (Figure 8). Among them, in no. 1–8 urban circle with the largest built-up land sprawl intensity and the highest cultivated landscape ecological risk, the main driving factors were geospatial (44.3%) and social (9.6%) in 1998, social (18.3%) and economic (31.7%) in 2008, and geospatial (18.7%) and social (40.9%) in 2018. The most influential factors were the closest distance from the road (25.6%, 1998) and farmers’ income class (18.2%, 2008 and 25.3%, 2018).
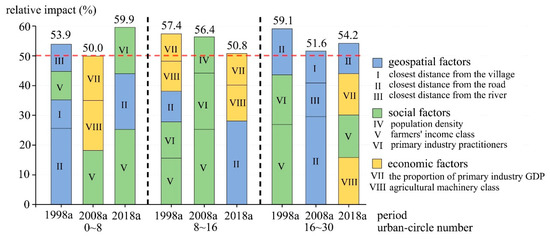
Figure 8.
Dominant factors of landscape eco-security under urbanization gradient.
In no. 8–16 urban circle with relatively high built-up land sprawl intensity and cultivated landscape ecological risk, the main driving factors were geospatial (10.3%), social (27.8%), and economic (19.3%) factors in 1998, social factors dominated (56.4%) in 2008, and geospatial (28.1%) and economic factors (22.7%) in 2018. The most influential factors were farmers’ income class (15.6, 1998 and 25.3, 2008) and the closest distance from the road (28.1%, 2018).
In no. 16–30 urban circle with relatively weak built-up land sprawl intensity and cultivated landscape ecological risk, the major driving factors in 1998 were geospatial (15.5%) and social (43.6%), which were dominated by geospatial factors (51.6%) in 2008 and geospatial (10.2%), social (14.3), and economic factors (29.7%) in 2018. Among them, the most influential factors are farmers’ income class (26.9%, 1998), the closest distance from the road (29.6%, 2008), and the agricultural machinery class (15.8%, 2018).
3.4. Discussion
3.4.1. Landscape Pattern and Process of Cultivated Land Based on Urbanization Gradient Analysis
Some scholars believe that only remote sensing images can effectively explain the relationship between landscape pattern and process [36]. However, remote sensing images can only reflect changes in the plaque area but not changes in structure and function [37], thus losing important information related to plaques. Moreover, the current research on cultivated landscape pattern often relies on the interpretation of remote sensing images and does not identify each independent patch [38]. Furthermore, image resolution and mapping methods affect the accuracy of landscape pattern simulation analysis [39]. Therefore, when using a cultivated landscape eco-security index to describe its landscape pattern, it is necessary to consider the sensitivity of measurement data and the index changing with spatial resolution [40]. We integrated a variety of ground observation data and detailed survey data (cultivated land data, socioeconomic data, and geographical data), consistency based on spatiotemporal scales, using spatial interpolation technology to generate the strength of the built-up land sprawl, cultivated landscape eco-security pattern, and socioeconomic and geospatial factors of spatiotemporal distribution. This method has been proved to be effective, and it can study the effects of various factors on cultivated landscape pattern under urbanization gradient, so as to promote the scientific implementation of various cultivated land protection policies.
3.4.2. Spatiotemporal Heterogeneity of Cultivated Landscape Ecological Risk under Urbanization Gradient
From 1998 to 2018, built-up land sprawl intensity and its main areas were basically consistent with cultivated land area decrease and its landscape ecological risk areas in Yangzhou (Figure 2). These results show that urban sprawl has a great impact on cultivated landscape eco-security at different stages. In addition, through superposition analysis (Figure 9), it can be seen that, from 1998 to 2008, there were 5 common directions of built-up land sprawl and cultivated landscape ecological risk evolution trend, among which the main direction was 20°–55°. From 2008 to 2018, there were 4, with the main direction being 305°–355°. This result shows that, at present, the main areas of urban sprawl and its impact on cultivated land are further extended from the urban suburbs to the township areas around the city. The trend shifted from the northeast to the northwest, where cultivated land was more widely distributed. A large number of research results show that China’s current urbanization has entered the stage of urban-rural integration, and the main areas of cultivated land occupied by built-up land have developed into township areas, which is consistent with our research results [41]. Therefore, spatiotemporal characteristics of built-up land sprawl intensity and impact on cultivated landscape eco-security obtained in this study provide a scientific basis for implementing cultivated land protection policy.
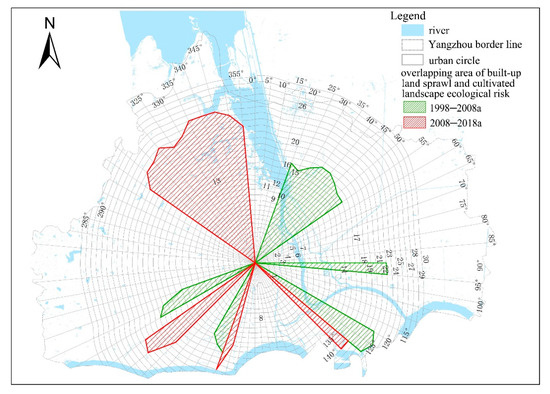
Figure 9.
Area, intensity, and direction of the influence of built-up land sprawl on cultivated landscape eco-security under urbanization gradient.
3.4.3. Interaction among Various Factors Affecting Cultivated Landscape Eco-Security under Urbanization Gradient
At present, scholars worldwide have made fruitful achievements in the research of built-up land sprawl and cultivated land protection but mainly focused on their own unilateral research [42]. After summarizing a large number of research results, we finally selected 12 types of driving factors that have a common impact on built-up land sprawl and cultivated land protection, and then conducted correlation analysis of these factors based on different urbanization gradients.
We found that the relative geospatial influence was the greatest in each period. Among them, the factor of the closest distance from the road plays a leading role in different urbanization gradients, with the largest relative impact in no. 16–30 urban circle in 2008 (29.6%). However, geospatial influence decreases with the development of the city, whereas socioeconomic influence gradually increases. Especially in the later stage of urban development, the role of economy is more obvious. This is largely because the influence of the built-up land gradually increasing in the urban center and suburbs on the cultivated land began to shift to the township area [43].
Although the relative influence of socioeconomic factors gradually increases, the influence of different socioeconomic factors varies greatly under different urbanization gradients. From 1998 to 2018, the influence of population density and primary industry employees decreased gradually overall, but the influence of population density and primary industry practitioners generally increased gradually in no. 0–8 urban circle. This phenomenon is partly due to the significant reduction of the relative effect of geospatial action in areas close to urban centers. On the other hand, due to the rapid increase of population in the urban center and the upheaval of the population structure, many agricultural conversion phenomena have occurred [44]. However, farmers’ income class, as the dominant social factor, increased significantly from 1998 to 2018 but still decreased in no. 8–30 urban circle. This phenomenon is mainly due to the shift of urbanization development focus from suburbs to towns in 1998–2018, accompanied by the rapid growth of farmers’ income. In addition, this phenomenon of regional transfer of urbanization development is also the main reason for the change in economic factors, for example, the number of industrial enterprises, agricultural machinery class, and proportion of primary industry GDP.
As economic development promotes built-up land sprawl, the overall influence of economic factors will gradually increase with time. However, economic factors related to agriculture, such as PHGO and cultivated land potential production, decreased year by year. This is mainly because, since 1998, the deepening of agricultural reform and the strategic implementation of the adjustment of the agricultural structure in Yangzhou changed the traditional agricultural type, resulting in the decline of the proportion of traditional agricultural economy in the primary industry GDP [45].
In conclusion, the interaction between built-up land sprawl and geospatial and socioeconomic factors increases cultivated landscape ecological risk nonlinearly. Previous studies mainly used multivariate statistical analysis combined with graph theory to focus on the driving factors of cultivated landscape eco-security pattern but did not combine these factors with urbanization gradient. No one has studied the interaction between these factors and built-up land sprawl. In the process of urban sprawl affecting cultivated landscape eco-security, these factors not only act on cultivated landscape pattern but also have a great impact on built-up land sprawl. Therefore, by analyzing the influence of urban sprawl on cultivated landscape eco-security under urbanization gradient and its driving mechanism, this study can fully reveal the functional relationship between urban development and cultivated land.
4. Conclusions
Considering the geospatial and socioeconomic factors, we studied spatiotemporal characteristics, impact intensity, form, and direction of built-up land sprawl on cultivated landscape eco-security under the urbanization gradient in Yangzhou city from 1998 to 2018. Then, we used machine-learning technology (BRT method) to quantitatively analyze the key driving forces and evolution rules of cultivated landscape eco-security affected by built-up land sprawl under the overall and urbanization gradient. The conclusions are as follows:
(1) From 1998 to 2018, the sprawl rate of Yangzhou city first increased and then decreased, forming the sprawl gradient of no. 1–8, no. 8–16, and no. 16–30 urban circles. From 1998 to 2008, the sprawl intensity in no. 3 urban circle was the largest (28.1%), with the main direction being 20°–90°. From 2008 to 2018, the sprawl intensity was the largest (40.4%) in no. 6 urban circle, with the main directions being 190°–240° and 305°–355°.
(2) From 1998 to 2018, the area of cultivated landscape ecological risk in Yangzhou has been expanding continuously. The main risk area forms an urban circle gradient consistent with the built-up land sprawl gradient, that is, no. 1–8, no. 8–16, and no. 16–30 urban circle. The sprawl direction is basically the same as that of built-up land (20°–90° and 305°–355°).
(3) From 1998 to 2008, the main areas where built-up land sprawl affected cultivated landscape eco-security were located in no. 1–16 urban circle, with a direction of 20°–55°. From 2008 to 2018, they were located in no. 16–26 urban circle, with a direction of 305°–355°.
(4) In the process of cultivated landscape eco-security affected by urban sprawl, the influence of geospatial factors decreases gradually over time but increases outwardly with the urbanization gradient. The influence of social factors decreases first with time and then increases with urbanization gradient outwards in space. Economic factors increase with time but decrease with urbanization gradient. The influence of each factor varies greatly over time and with urbanization gradient.
In addition, the BRT method based on multi-source data analysis is very effective for quantitatively describing the main driving factors and rules of cultivated landscape eco-security affected by built-up land sprawl under urbanization gradient. This new method is not only useful for the study of urban landscape ecology but also helpful in providing a scientific basis for future urban planning and regulation as well as the implementation of farmland protection policy.
Author Contributions
Conceptualization, H.C.; project administration, Y.L.; data curation, K.M.; software, K.M.; writing—original draft, H.C.; writing—review and editing, Y.L.
Funding
This research is supported by the National Natural Science Foundation of China: 31500388, 71533005; Open Foundation of State Key Laboratory of Urban and Regional Ecology of China: SKLURE 2016-2-3; and Postgraduate Research & Practice Innovation Program of Jiangsu Province: KYCX18_0979.
Acknowledgments
We thank MDPI (www.mdpi.com) for its linguistic assistance during the preparation of this manuscript.
Conflicts of Interest
The authors declare no conflicts of interest.
References
- Song, X.Q.; Ou, Y.Z. Route of Multifunctional Cultivated Land Management in China. J. Nat. Resour. 2012, 27, 540–551. [Google Scholar] [CrossRef]
- Meng, Y. Summary of the Seminar on “Standing on the Red Line of 1.8 Billion Mu of Cultivated Land”. J. China Agric. Univ. 2007, 12, 25–26. [Google Scholar]
- Yang, G.; Xie, H.Z. Agricultural land transfer in the process of urbanization. Urban Probl. 2010, 56–62. [Google Scholar] [CrossRef]
- Standardization Administration of China. No. 1 Document of the Central Government in 2019: Strictly Observe the Red Line of 1.8 Billion Mu of Farmland and Ensure the Construction of 800 Million Mu of High-Standard Farmland by 2020; China Standardization: Beijing, China, 2019; p. 24. [Google Scholar]
- Wang, W.L. Comments on the related theories of rural land system reform in China. Southeast Acad. Res. 2012, 19–28. [Google Scholar] [CrossRef]
- Zhao, X.L.; Zhang, Z.X.; Wang, X.; Zuo, L.J.; Liu, B.; Yi, L.; Xu, J.Y.; Wen, Q.K. Analysis of Chinese cultivated land′s spatial temporal changes and causes in recent 30 years. Trans. Chin. Soc. Agric. Eng. 2014, 30, 1–11. [Google Scholar] [CrossRef]
- Dahal, K.R.; Benner, S.; Lindquist, E. Urban hypotheses and spatiotemporal characterization of urban growth in the Treasure Valley of Idaho, USA. Appl. Geogr. 2017, 79, 11–25. [Google Scholar] [CrossRef]
- Yushanjiang, A.; Fei, Z.; Yu, H.; Kung, H.T. Quantifying the spatial correlations between landscape pattern and ecosystem service value: A case study in Ebinur Lake Basin, Xinjiang, China. Ecol. Eng. 2018, 113, 94–104. [Google Scholar] [CrossRef]
- Fjellstad, W.; Dramstad, W. Landscape monitoring as a tool in improving environmental security. In Use of Landscape Sciences for the Assessment of Environmental Security; Springer: Dordrecht, The Netherlands, 2008. [Google Scholar] [CrossRef]
- Li, D.; Liu, Y.Z. Research on the relationship between urbanization development and farmland change in China. Econ. Rev. 2003, 13–15. [Google Scholar] [CrossRef]
- Chen, Z.G.; Wang, Q. A Positive Study on China’s Farmland Conversion and Land Degradation in Transition. China Popul. Resour. Environ. 2005, 47–50. [Google Scholar] [CrossRef]
- Zhou, Y.H.; Cheng, J.M.; Fei, L.C.; Xu, Y.T. Research of cultivated land change in the process of rapid urbanization of Wuhu city. Chin. J. Agric. Resour. Reg. Plan. 2016, 37, 57–62. [Google Scholar] [CrossRef]
- Yang, R.H. Protection of cultivated land in urbanization—A case study of Wuxi city, Jiangsu province. Areal Res. Dev. 1998, 17, 53–57. [Google Scholar]
- Wu, Y.; Zhang, H. Analysis of coordination between farm land protection, food security, and urbanization of Dalian City. Territory Nat. Resour. Study 2017, 24–29. [Google Scholar] [CrossRef]
- Alterman, R. The Challenge of Farmland Preservation: Lessons from a Six-Nation Comparison. J. Am. Plan. Assoc. 1997, 63, 220–243. [Google Scholar] [CrossRef]
- Lichtenberg, E.; Ding, C. Chapter 5: Assessing Farmland Protection Policy in China. Land Use Policy 2008, 25, 59–68. [Google Scholar] [CrossRef]
- Cai, J.M.; Chen, Y.R.; Xiong, C. Urbanization and cultivated land protection. Econ. Perspect. 2015, 44, 78–86. [Google Scholar]
- Estoque, R.C.; Murayama, Y. Landscape pattern and ecosystem service value changes: Implications for environmental sustainability planning for the rapidly urbanizing summer capital of the Philippines. Landsc. Urban Plan. 2013, 116, 60–72. [Google Scholar] [CrossRef]
- Hastie, T.; Friedman, J.; Tibshirani, R. The Elements of Statistical Learning. Technometrics 2010, 45, 267–268. [Google Scholar] [CrossRef]
- Guo, L.; Xue, D.Y.; Yu, S.X.; Cai, L. Assessment and Dynamic Analysis of Landscape Ecological Security of Taishan Mountain. J. Mt. Sci. 2008, 331–338. [Google Scholar] [CrossRef]
- Ou, Q.X.; Li, H.K.; Lei, X.D.; Ying, Y. Difference analysis in estimating biomass conversion and expansion factors of Masson Pine in Fujian Province, China based on national forest inventory data: A comparison of three decision tree models of ensemble learning. Chin. J. Appl. Ecol. 2018, 29, 2007–2016. [Google Scholar] [CrossRef]
- Martin, M.P.; Wattenbach, M.; Smith, P.; Meersmans, J.; Jolivet, C.; Boulonne, L.; Arrouays, D. Spatial distribution of soil organic carbon stocks in France. Biogeosciences 2011, 8, 1053–1065. [Google Scholar] [CrossRef]
- Müller, D.; Leitão, P.J.; Sikor, T. Comparing the determinants of cropland abandonment in Albania and Romania using boosted regression trees. Agric. Syst. 2013, 117, 66–77. [Google Scholar] [CrossRef]
- Li, C.L.; Liu, M.; Hu, Y.M.; Xu, Y.Y.; Sun, F.Y. Driving forces analysis of urban expansion based on boosted regression trees and Logistic regression. Acta Ecol. Sin. 2014, 34, 727–737. [Google Scholar] [CrossRef]
- Jiao, L.L.; Chang, Y.; Shen, D.; Hu, Y.M.; Li, C.L.; Ma, J. Using boosted regression trees to analyze the factors affecting the spatial distribution pattern of wildfire in China. Chin. J. Ecol. 2015, 34, 2288–2296. [Google Scholar] [CrossRef]
- Galpern, P.; Manseau, M.; Fall, A. Patch-based graphs of landscape connectivity: A guide to construction, analysis and application for conservation. Biol. Conserv. 2011, 144, 44–55. [Google Scholar] [CrossRef]
- Chen, Y.; Shao, L.; Zhu, H.C.; Li, W. Rethinking Spatial Model of Small and Medium-sized City Clusters in the Transformative Period:A Study on Weifang Area. Urban Plan. Forum 2017, 86–91. [Google Scholar] [CrossRef]
- Zhong, B.X.; He, T.R.; Zhang, Z.; Wu, Y.Q. Spatial-temporal pattern evolution of cultivated land area and its driving forces of agricultural areas in Huaibei plain. J. South. Agric. 2017, 48, 174–180. [Google Scholar] [CrossRef]
- Li, X.; Ou, M.H.; Ma, X.L. Analysis on Impact of Fragmentation Based on Landscape Index to Cultivated Land Use Efficiency: A Case on Lixiahe District in Yangzhou City. J. Nat. Resour. 2011, 26, 1758–1767. [Google Scholar] [CrossRef]
- Li, X.W.; Fang, J.Y.; Piao, S.L. The comparison of spatial characteristics in urban landuse growth among the central and sub-cities in Shanghai Region. Geogr. Res. 2003, 6, 72–75. [Google Scholar] [CrossRef]
- Yu, X.; Wu, K.N.; Yun, W.J.; Wei, H.B.; Liu, L.; Song, Y.H.; Gao, X. Analysis on temporal and spatial variation of landscape ecological security in modern agricultural area. Trans. Chin. Soc. Agric. Eng. 2016, 32, 253–259. [Google Scholar] [CrossRef]
- Yang, Q.S.; Qiao, J.G.; Ai, B. Landscape ecological security dynamics in a fast growing urban district: The case of Dongguan City. Acta Ecol. Sin. 2013, 33, 1230–1239. [Google Scholar] [CrossRef][Green Version]
- Li, D.K.; Ding, S.Y.; Liang, G.F.; Zhao, Q.H.; Tang, Q.; Kong, L.B. Landscape heterogeneity of mountainous and hilly area in the western Henan Province based on moving window method. Acta Ecol. Sin. 2014, 34, 3414–3424. [Google Scholar] [CrossRef]
- Zhang, L.L.; Zhao, Y.H.; Yin, S.; Fang, S.; Liu, X.J.; Pu, M.M. Gradient analysis of dry valley of Minjiang River landscape pattern, based on moving window method. Acta Ecol. Sin. 2014, 34, 3276–3284. [Google Scholar] [CrossRef]
- Elith, J.; Leathwick, J.R.; Hastie, T. A working guide to boosted regression trees. J. Anim. Ecol. 2008, 77, 802–813. [Google Scholar] [CrossRef] [PubMed]
- Baggio, J.A.; Salau, K.; Janssen, M.A.; Schoon, M.L.; Bodin, Ö. Landscape connectivity and predator–prey population dynamics. Landsc. Ecol. 2011, 26, 33–45. [Google Scholar] [CrossRef]
- Cushman, S.A.; Raphael, M.G.; Ruggiero, L.F.; Shirk, A.S.; Wasserman, T.N.; O’Doherty, E.C. Limiting factors and landscape connectivity: The American marten in the Rocky Mountains. Landsc. Ecol. 2011, 26, 1137–1149. [Google Scholar] [CrossRef]
- Li, X.Z. The temporal and spatial changes of cultivated land landscape ecological security in Beidaihe new district. Chin. J. Agric. Resour. Reg. Plan. 2017, 38, 59–64. [Google Scholar] [CrossRef]
- Yin, R.; Wei, X.; Li, Z.; Cui, S.; Feng, C.; Xiong, Y.; Xie, P. Potential for forest vegetation carbon storage in Fujian Province, China, determined from forest inventories. Plant Soil 2011, 345, 125–140. [Google Scholar] [CrossRef]
- Yin, R.; Jin, Y.; Wei, X.; Wang, Y.; Yang, Y.; Hua, L.; Xiong, Y.; Xiang, N.; Song, X. Effects of rapid urban sprawl on urban forest carbon stocks: Integrating remotely sensed, GIS and forest inventory data. J. Environ. Manag. 2012, 113, 447–455. [Google Scholar] [CrossRef]
- Li, X. Urban-rural Integration and Rethinking of Small Towns Theory. J. South China Agric. Univ. (Soc. Sci. Ed.) 2019, 18, 131–140. [Google Scholar] [CrossRef]
- Gartaula, H.; Patel, K.; Johnson, D.; Devkota, R.; Khadka, K.; Chaudhary, P. From food security to food wellbeing: Examining food security through the lens of food wellbeing in Nepal’s rapidly changing agrarian landscape. Agric. Hum. Values 2016, 34, 1–17. [Google Scholar] [CrossRef]
- Gao, J.L.; Chen, J.L.; Su, X. Urban expansion and its driving mechanism in China: From three main schools’ perspectives. Prog. Geogr. 2013, 32, 743–754. [Google Scholar] [CrossRef]
- Jiang, H.C. Urbanization and Poverty Reduction of Rural to Urban Residents. J. South China Agric. Univ. (Soc. Sci. Ed.) 2017, 16, 75–95. [Google Scholar] [CrossRef]
- Fu, Y. Implication of Land Transfer Policy in Shenzhen Urbanization for Land System Reform in New-type Urbanization. J. Shenzhen Univ. (Hum. Soc. Sci.) 2018, 35, 28–36. [Google Scholar] [CrossRef]


© 2019 by the authors. Licensee MDPI, Basel, Switzerland. This article is an open access article distributed under the terms and conditions of the Creative Commons Attribution (CC BY) license (http://creativecommons.org/licenses/by/4.0/).