Architectural and Management Strategies for the Design, Construction and Operation of Energy Efficient and Intelligent Primary Care Centers in Chile

 ,
,
Abstract
:1. Introduction
2. Materials and Methods
3. Architectural Characterization
3.1. Clinical Care
3.2. Technical Support
3.3. Administration
3.4. General Services
3.5. Public and Private Circulation
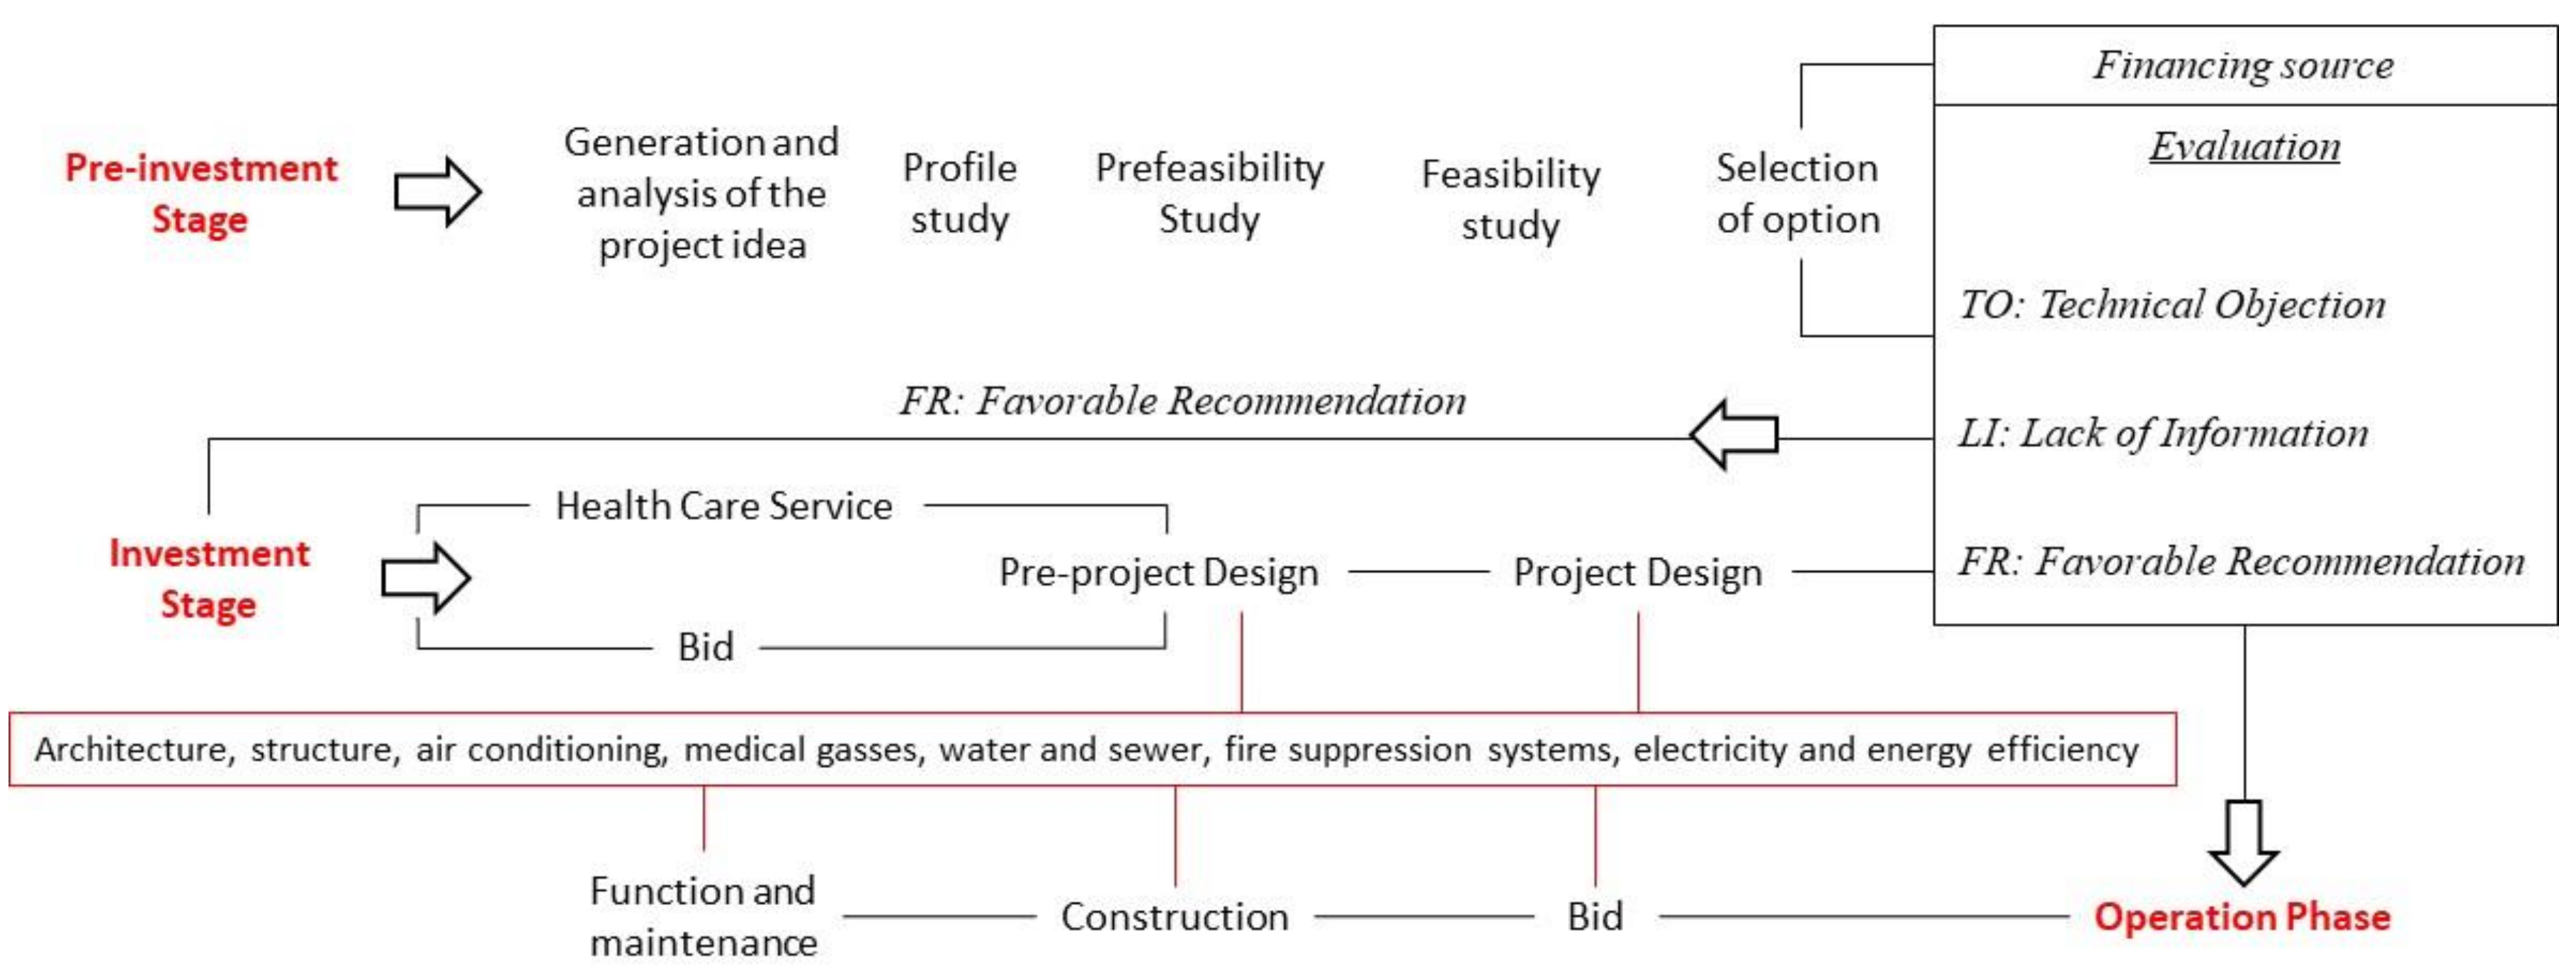
4. Project Cycle and Investment Process
4.1. Pre-Investment Stage
4.1.1. Generation and Analysis of the Project Idea
4.1.2. Profile Study
4.1.3. Prefeasibility and Feasibility Study
4.1.4. Financing Source
4.1.5. Pre-Investment Evaluation
4.2. Investment Stage
4.2.1. Design Elaboration (Pre-Project and Project)
4.2.2. Investment Evaluation
4.3. Operation Phase
4.3.1. Public Tender Process for Construction—Tender Terms of Reference
4.3.2. Tender Adjudication (Bid)
4.3.3. Construction
4.3.4. Operation: Function and Maintenance
5. Energy Characterization
6. Energy Evaluation
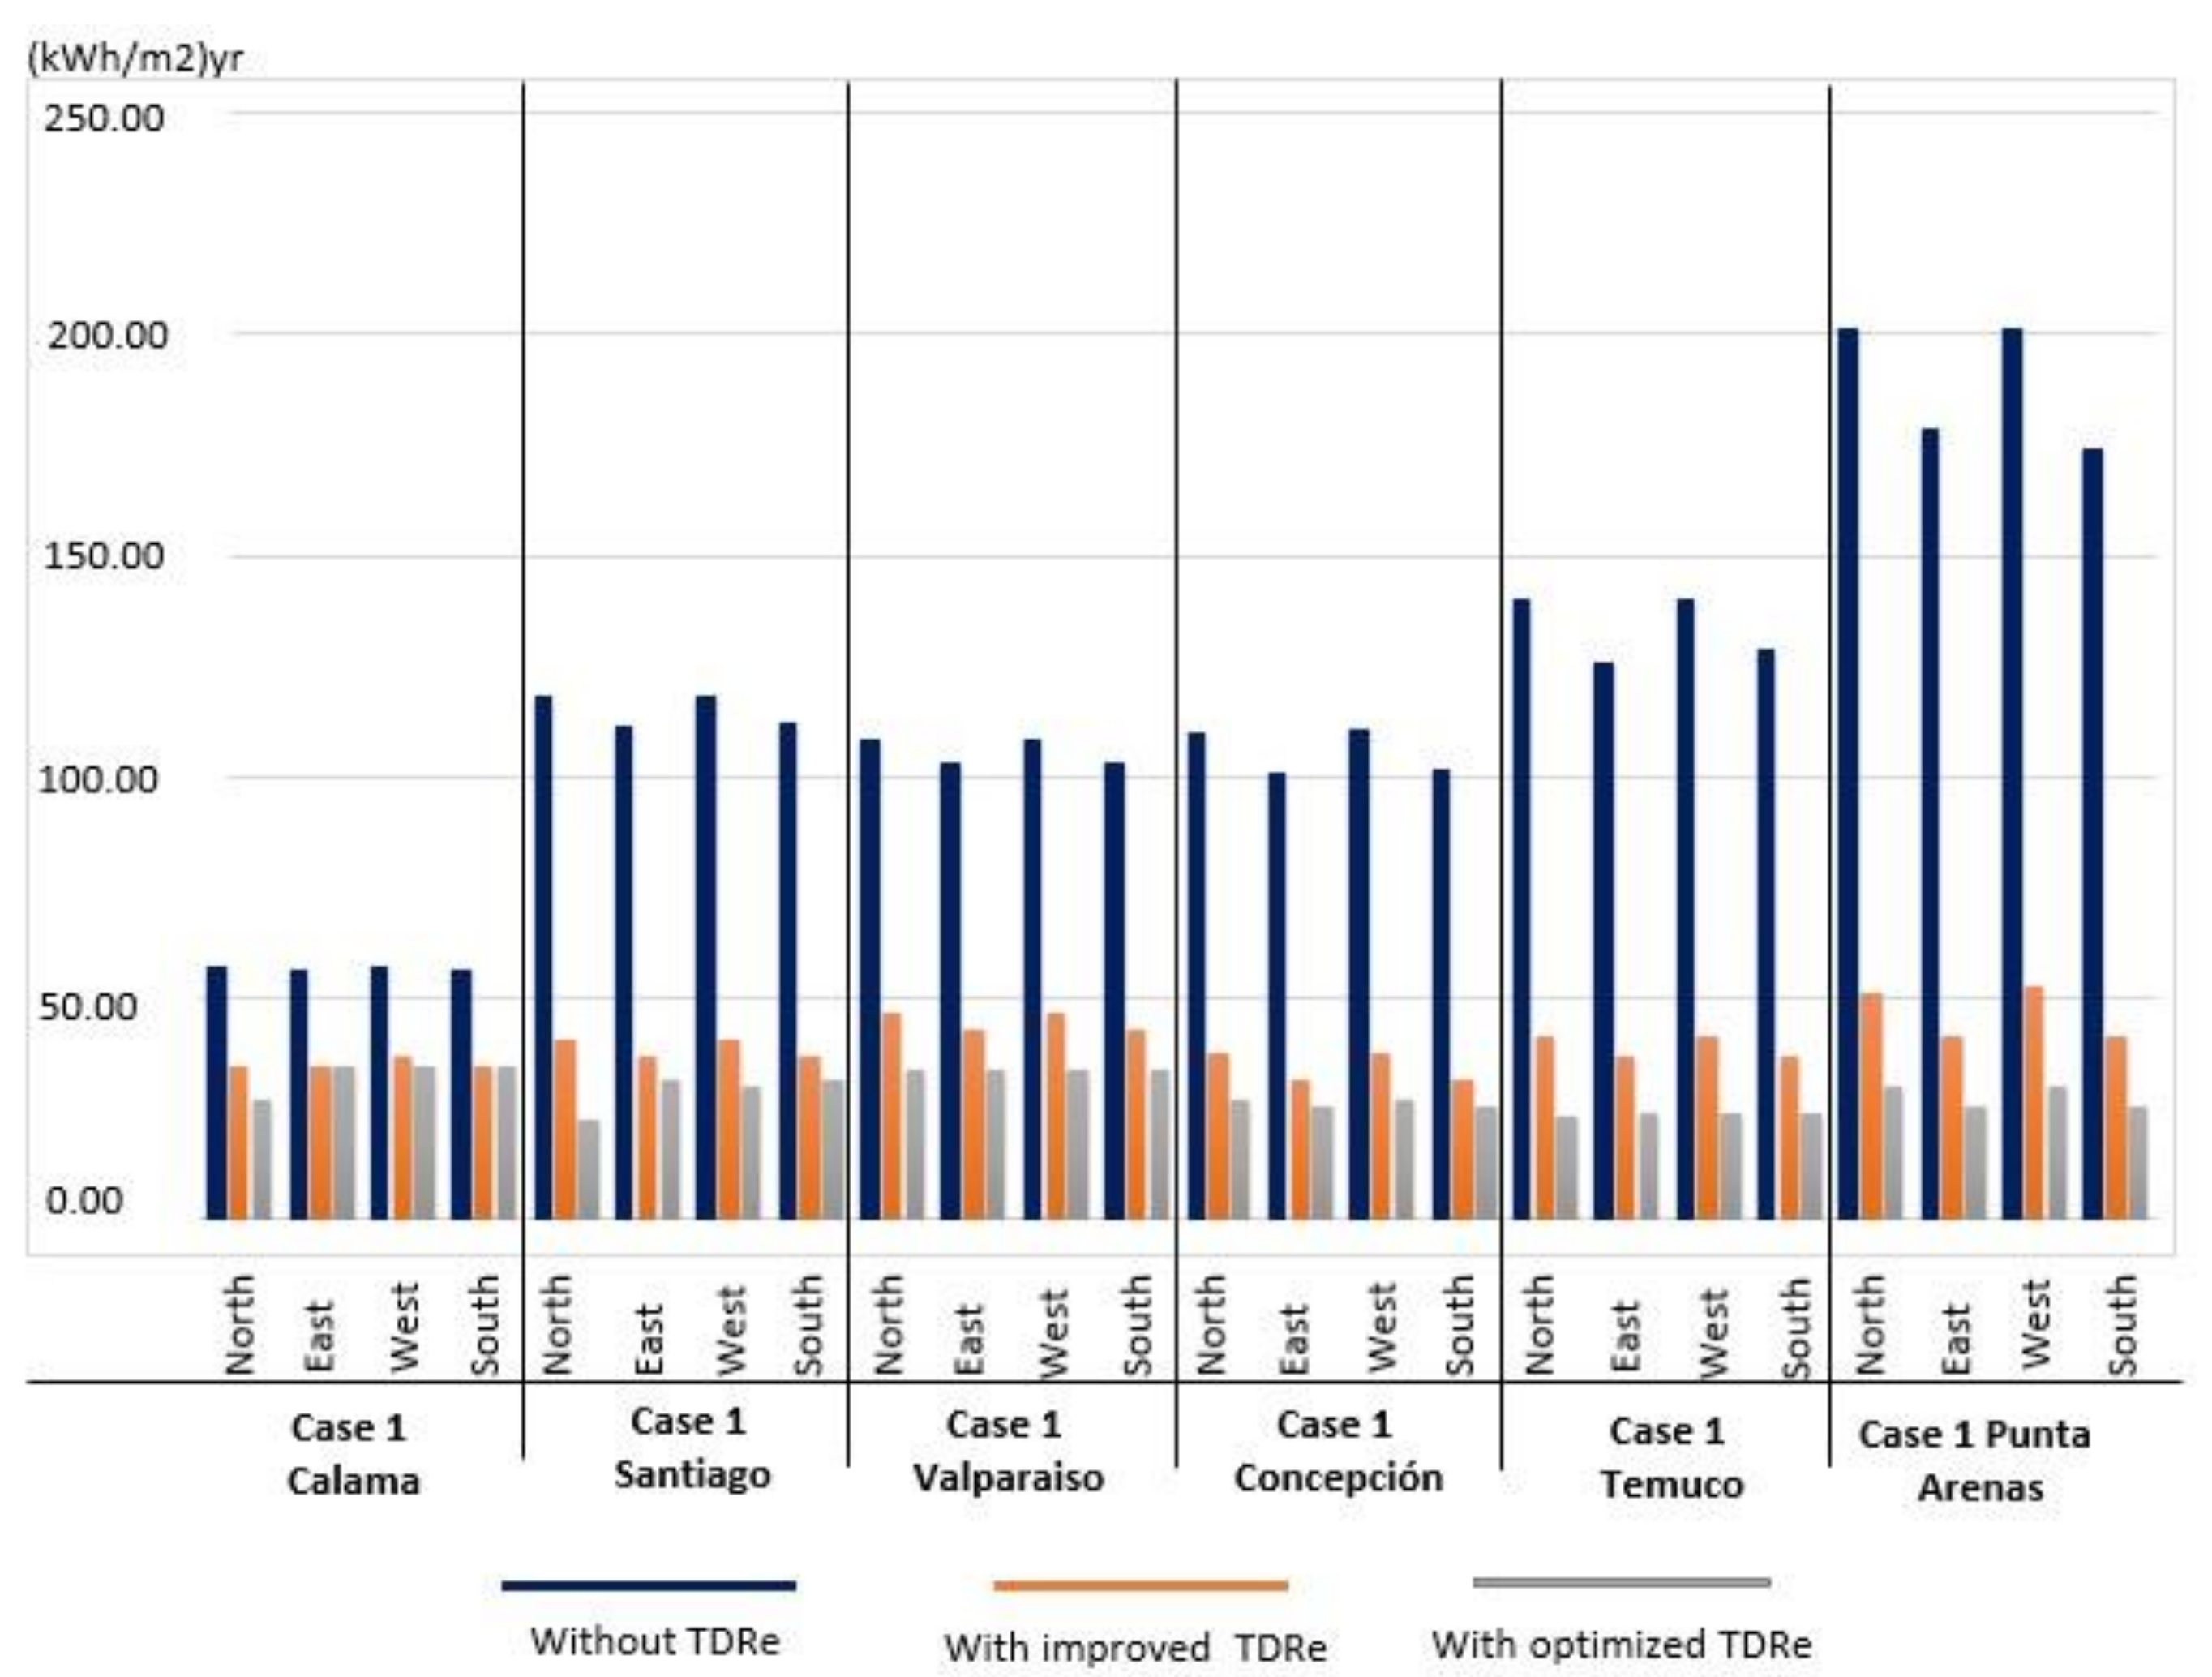
6.1. Case 1

| Case Studies and City | Orientation | Without TDRe kWh/m2/yr | TDRe IMPROVED kWh/m2/yr | TDRe OPTIMIZED kWh/m2/yr |
|---|---|---|---|---|
| Case 1 CALAMA | North | 57.08 | 34.16 | 26.76 |
| East | 56.50 | 34.60 | 34.80 | |
| South | 57.17 | 36.90 | 34.24 | |
| West | 56.09 | 34.56 | 34.84 | |
| Case 1 SANTIAGO | North | 118.52 | 40.47 | 22.20 |
| East | 111.80 | 36.79 | 31.37 | |
| South | 118.56 | 40.72 | 30.27 | |
| West | 112.13 | 37.09 | 31.37 | |
| Case 1 VALPARAISO | North | 108.47 | 46.50 | 33.90 |
| East | 102.91 | 43.02 | 33.49 | |
| South | 108.52 | 46.58 | 33.90 | |
| West | 103.16 | 42.67 | 33.51 | |
| Case 1 CONCEPCIÓN | North | 110.35 | 37.17 | 26.92 |
| East | 100.87 | 31.45 | 25.39 | |
| South | 110.58 | 37.58 | 26.96 | |
| West | 101.39 | 31.70 | 25.39 | |
| Case 1 TEMUCO | North | 139.96 | 41.03 | 23.41 |
| East | 125.97 | 36.92 | 23.81 | |
| South | 140.43 | 41.54 | 23.59 | |
| West | 128.59 | 36.46 | 23.81 | |
| Case 1 PUNTA ARENAS | North | 201.40 | 51.35 | 30.06 |
| East | 178.54 | 40.98 | 25.59 | |
| South | 201.10 | 52.33 | 30.27 | |
| West | 174.42 | 41.13 | 25.30 |
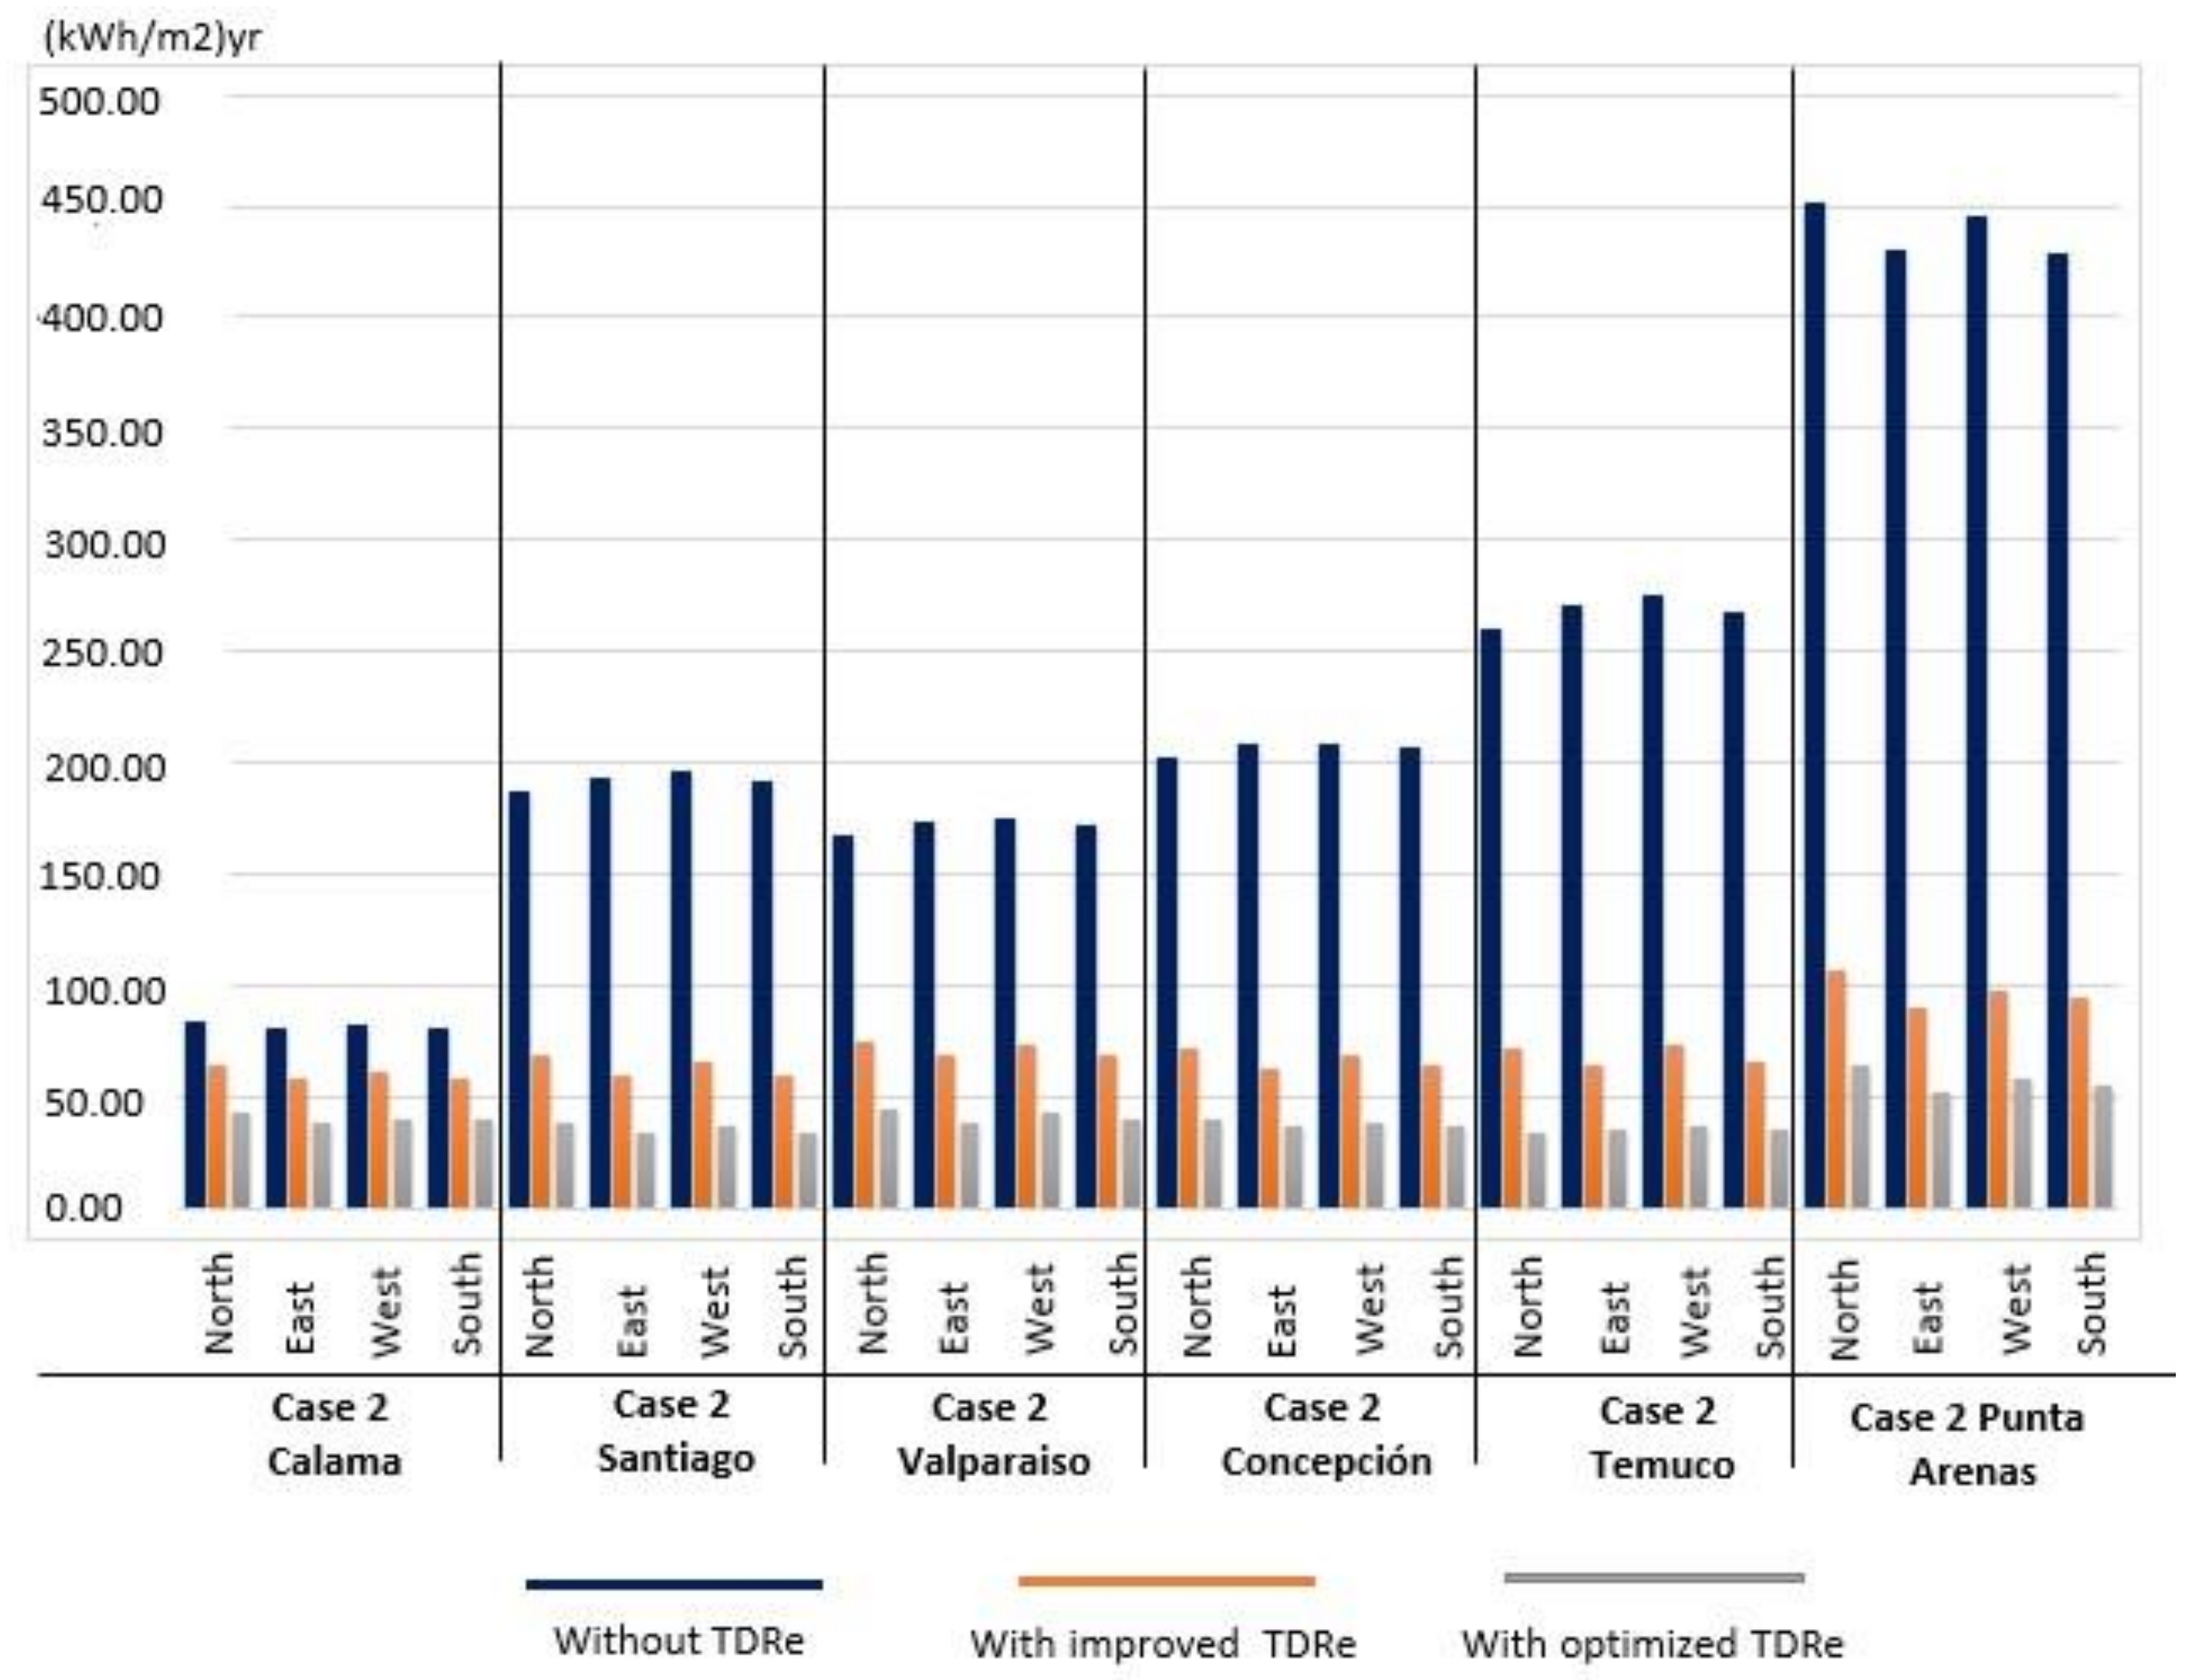
6.2. Case 2
| Case Study and City | Orientation | Without TDRe kWh/m2/yr | TDRe IMPROVED kWh/m2/yr | TDRe OPTIMIZED kWh/m2/yr |
|---|---|---|---|---|
| Case 2 CALAMA | North | 83.22 | 64.24 | 41.91 |
| East | 81.10 | 58.28 | 37.98 | |
| South | 81.49 | 61.20 | 39.74 | |
| West | 80.00 | 58.44 | 38.99 | |
| Case 2 SANTIAGO | North | 187.13 | 67.92 | 37.66 |
| East | 193.55 | 59.86 | 34.03 | |
| South | 196.40 | 65.09 | 35.87 | |
| West | 192.01 | 60.05 | 34.10 | |
| Case 2 VALPARAISO | North | 167.62 | 74.75 | 43.79 |
| East | 173.24 | 67.84 | 38.42 | |
| South | 174.39 | 72.74 | 42.32 | |
| West | 171.60 | 68.37 | 39.75 | |
| Case 2 CONCEPCIÓN | North | 201.51 | 71.31 | 39.84 |
| East | 208.54 | 63.04 | 36.06 | |
| South | 208.98 | 68.26 | 37.74 | |
| West | 206.63 | 63.30 | 36.09 | |
| Case 2 TEMUCO | North | 260.24 | 71.00 | 34.20 |
| East | 270.41 | 63.99 | 35.11 | |
| South | 275.99 | 73.23 | 36.20 | |
| West | 268.34 | 64.89 | 35.06 | |
| Case 2 PUNTA ARENAS | North | 451.52 | 105.79 | 63.75 |
| East | 430.23 | 90.37 | 52.09 | |
| South | 445.59 | 97.24 | 57.30 | |
| West | 428.66 | 93.76 | 54.51 |
6.3. Case 3
| Case Study and City | Orientation | Without TDRe kWh/m2/yr | TDRe IMPROVED kWh/m2/yr | TDRe OPTIMIZED kWh/m2/yr |
|---|---|---|---|---|
| Case 3 CALAMA | North | 104.14 | 80.85 | 67.10 |
| East | 101.81 | 78.81 | 66.18 | |
| South | 104.15 | 81.22 | 67.68 | |
| West | 104.20 | 80.77 | 67.26 | |
| Case 3 SANTIAGO | North | 212.27 | 94.58 | 67.82 |
| East | 209.44 | 92.36 | 66.19 | |
| South | 210.07 | 93.18 | 65.73 | |
| West | 211.01 | 93.68 | 66.08 | |
| Case 3 VALPARAISO | North | 192.84 | 100.23 | 73.01 |
| East | 190.16 | 97.70 | 71.12 | |
| South | 190.32 | 98.36 | 71.40 | |
| West | 190.79 | 98.53 | 71.23 | |
| Case 3 CONCEPCIÓN | North | 223.57 | 94.60 | 60.22 |
| East | 221.90 | 93.35 | 59.96 | |
| South | 222.78 | 94.09 | 60.18 | |
| West | 224.75 | 95.25 | 60.65 | |
| Case 3 TEMUCO | North | 291.10 | 102.87 | 61.90 |
| East | 288.93 | 101.57 | 60.85 | |
| South | 289.71 | 103.20 | 61.21 | |
| West | 291.86 | 104.09 | 61.65 | |
| Case 3 PUNTA ARENAS | North | 494.04 | 170.60 | 92.20 |
| East | 494.75 | 171.98 | 95.12 | |
| South | 492.58 | 170.57 | 93.91 | |
| West | 497.61 | 173.66 | 96.66 |

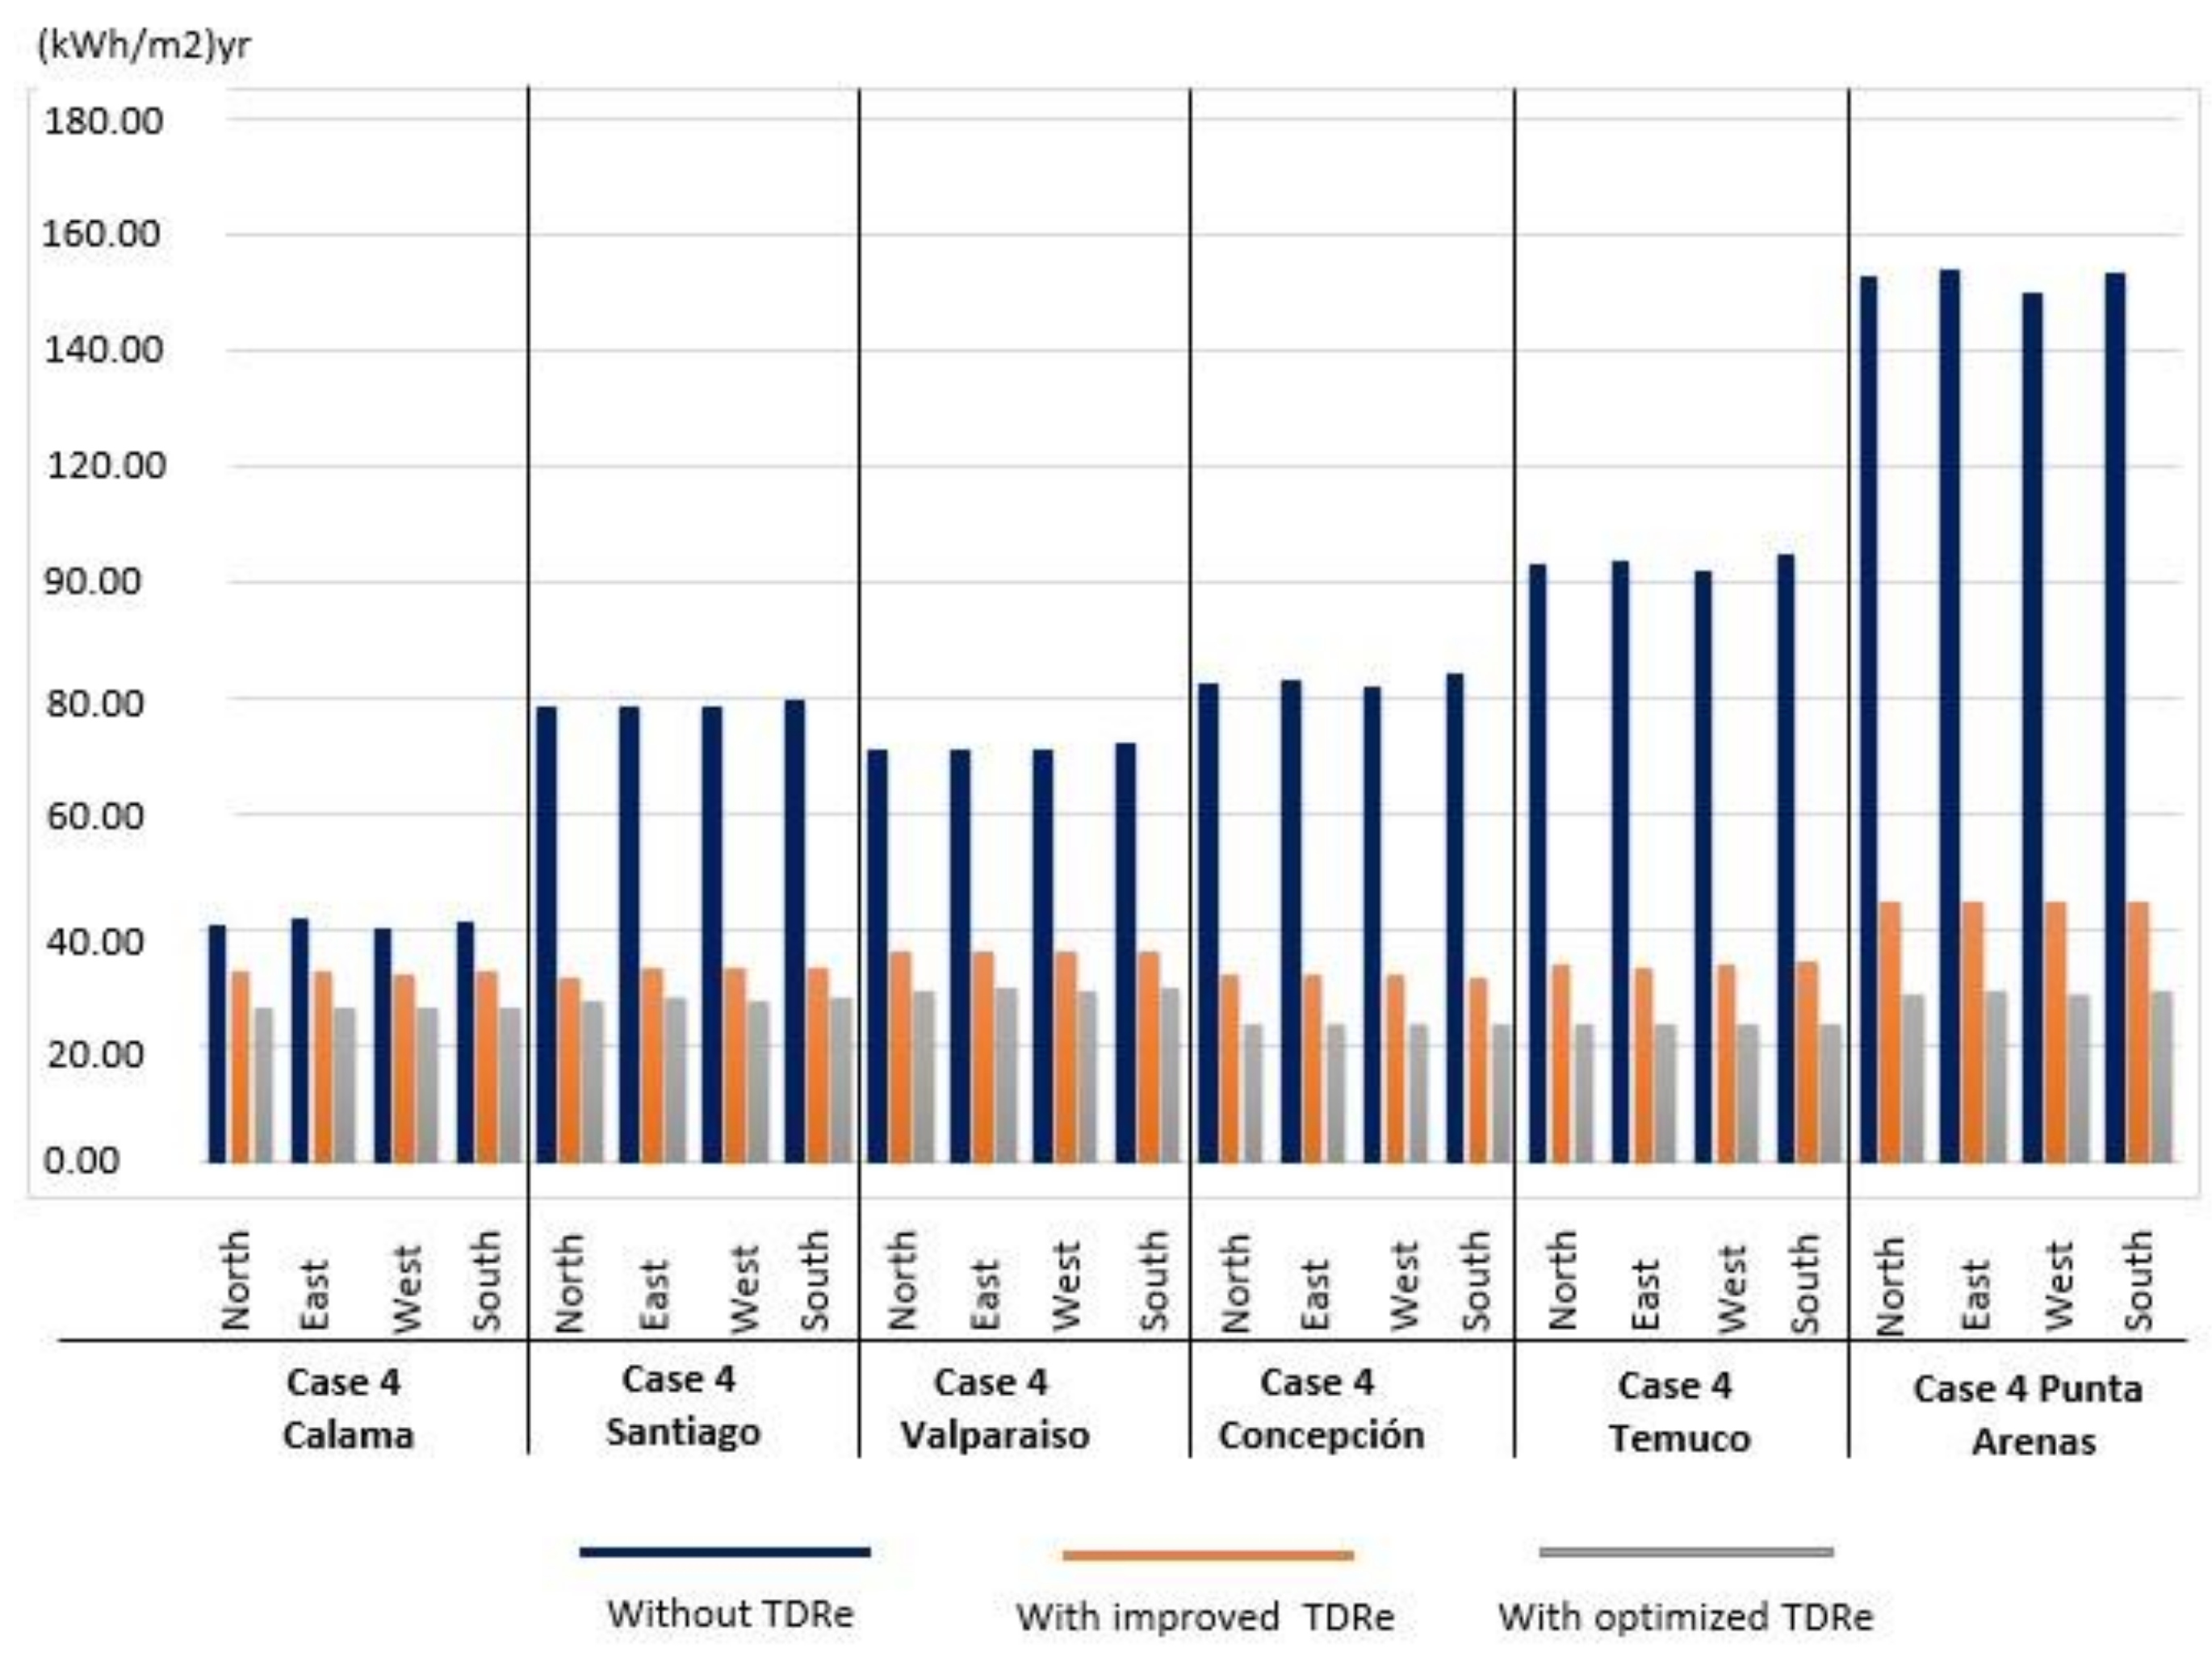
6.4. Case 4
| Case Study and City | Orientation | Without TDRe kWh/m2/yr | TDRe IMPROVED kWh/m2/yr | TDRe OPTIMIZED kWh/m2/yr |
|---|---|---|---|---|
| Case 4 CALAMA | North | 41.08 | 32.88 | 26.72 |
| East | 42.16 | 33.21 | 26.79 | |
| South | 40.78 | 32.65 | 26.72 | |
| West | 41.94 | 33.03 | 26.82 | |
| Case 4 SANTIAGO | North | 78.68 | 32.00 | 27.81 |
| East | 78.70 | 33.53 | 28.28 | |
| South | 78.57 | 33.91 | 27.81 | |
| West | 79.87 | 33.66 | 28.29 | |
| Case 4 VALPARAISO | North | 71.55 | 36.30 | 29.84 |
| East | 71.38 | 36.48 | 30.47 | |
| South | 71.56 | 36.39 | 29.84 | |
| West | 72.58 | 36.73 | 30.38 | |
| Case 4 CONCEPCIÓN | North | 82.64 | 32.81 | 23.74 |
| East | 83.12 | 32.57 | 24.16 | |
| South | 82.25 | 32.62 | 23.74 | |
| West | 84.27 | 32.15 | 24.11 | |
| Case 4 TEMUCO | North | 103.22 | 34.26 | 23.96 |
| East | 104.12 | 33.53 | 23.98 | |
| South | 102.48 | 34.34 | 23.96 | |
| West | 105.01 | 34.58 | 23.89 | |
| Case 4 PUNTA ARENAS | North | 153.17 | 45.26 | 29.31 |
| East | 154.34 | 45.06 | 29.95 | |
| South | 150.40 | 44.99 | 29.31 | |
| West | 153.60 | 44.93 | 29.47 |
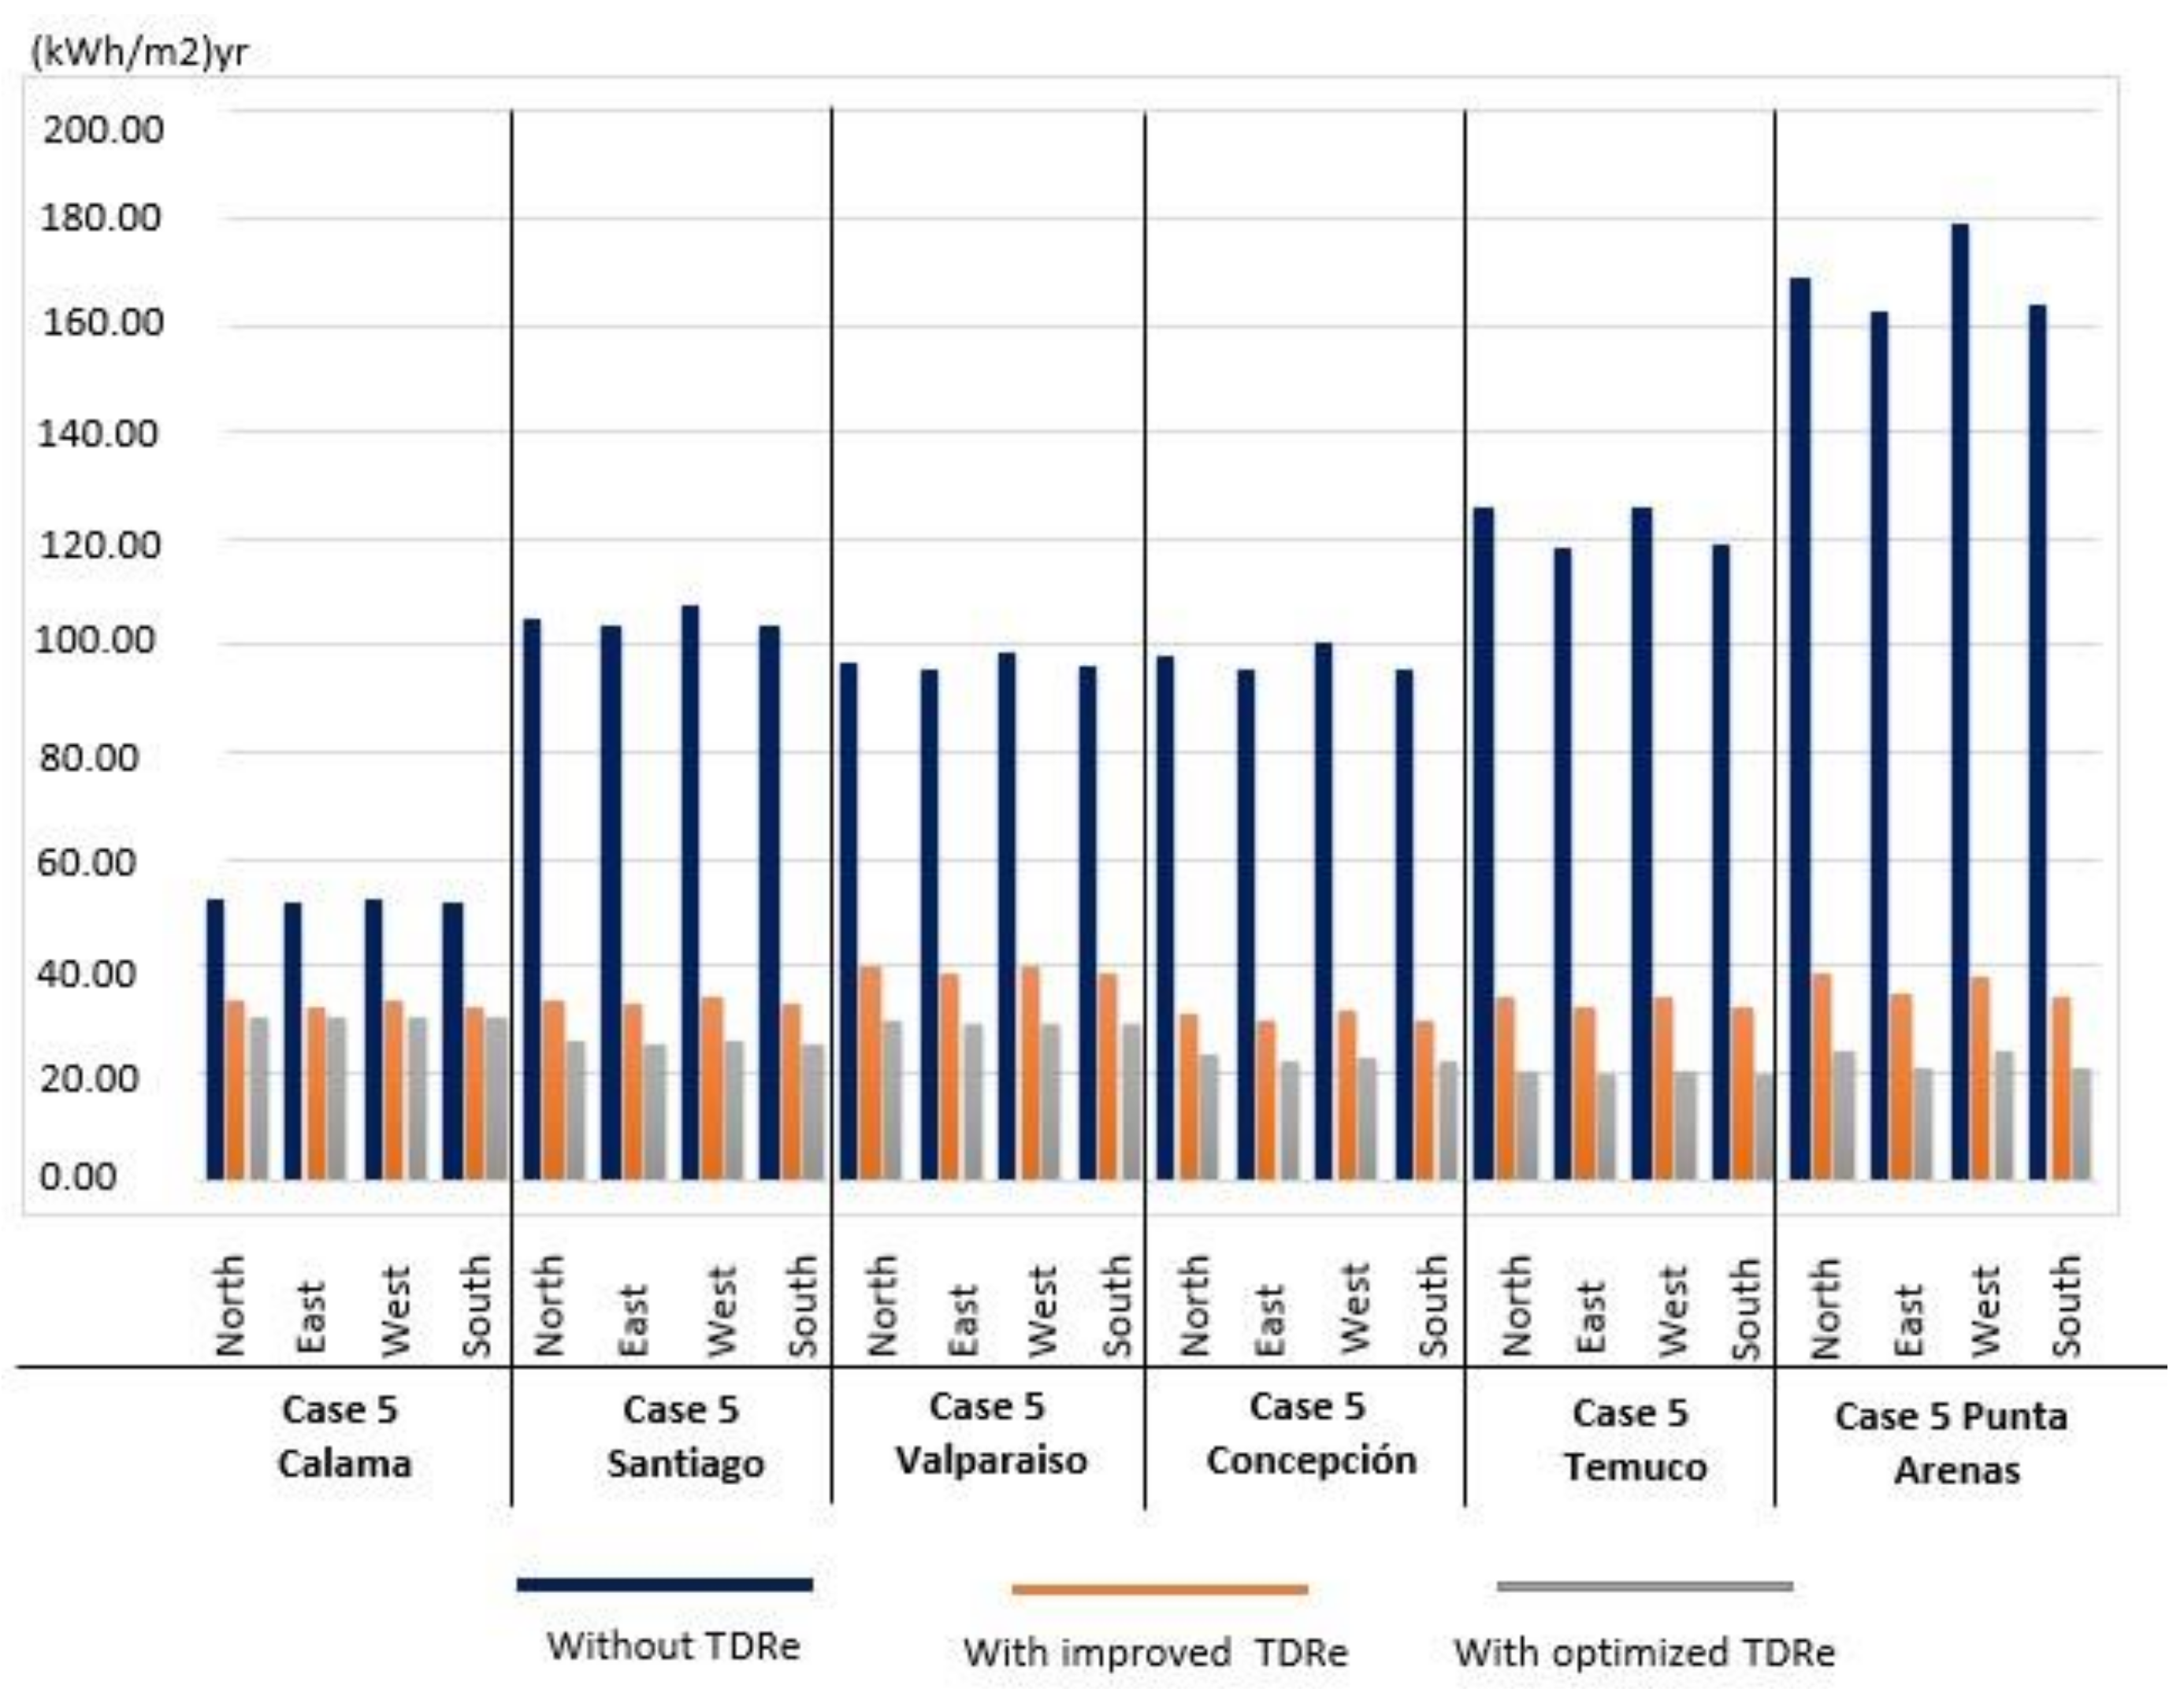
6.5. Case 5
| Case Study and City | Orientation | Without TDRe kWh/m2/yr | TDRe IMPROVED kWh/m2/yr | TDRe OPTIMIZED kWh/m2/yr |
|---|---|---|---|---|
| Case 5 CALAMA | North | 52.42 | 33.57 | 30.35 |
| East | 52.00 | 32.61 | 30.43 | |
| South | 52.46 | 33.47 | 30.27 | |
| West | 51.86 | 32.25 | 30.40 | |
| Case 5 SANTIAGO | North | 105.15 | 33.62 | 26.12 |
| East | 103.63 | 33.15 | 25.61 | |
| South | 107.46 | 34.13 | 26.10 | |
| West | 103.91 | 32.95 | 25.69 | |
| Case 5 VALPARAISO | North | 97.07 | 39.70 | 29.56 |
| East | 95.75 | 38.56 | 28.96 | |
| South | 98.94 | 39.85 | 29.42 | |
| West | 95.97 | 38.44 | 28.88 | |
| Case 5 CONCEPCIÓN | North | 97.98 | 30.90 | 23.24 |
| East | 95.48 | 29.97 | 22.32 | |
| South | 100.52 | 31.59 | 23.05 | |
| West | 95.67 | 29.76 | 22.14 | |
| Case 5 TEMUCO | North | 125.85 | 34.53 | 20.31 |
| East | 118.23 | 32.60 | 19.93 | |
| South | 125.81 | 34.42 | 20.21 | |
| West | 118.66 | 32.38 | 19.94 | |
| Case 5 PUNTA ARENAS | North | 168.90 | 38.60 | 24.03 |
| East | 162.41 | 35.02 | 20.90 | |
| South | 178.69 | 38.34 | 24.10 | |
| West | 163.59 | 34.34 | 20.84 |
| Case 1 | Case 2 | Case 3 | Case 4 | Case 5 | |
|---|---|---|---|---|---|
| Built Surface Area | 1.970 m2 | 1.146 m2 | 2.687 m2 | 3.789 m2 | 2.346 m2 |
| Form Factor– FF (enclosure surface area/volume) | 0.47 | 0.51 | 0.39 | 0.36 | 0.44 |
| Relative geometric efficiency (RGE) (Envelope surface area/built surface area) | 1.05 | 1.37 | 1.62 | 2.39 | 1.73 |
| Factor of Enclosure surface area per occupation surface area (Enclosure surface area/occupation surface area) | 1.28 | 1.47 | 1.05 | 1.47 | 1.04 |
| % Windows (Fenestration) | 30 | 13 | 35 | 12 | 16 |
| Demand without TDRe [kWh/m2]/Calama/North Orientation | 57.08 | 83.22 | 104.14 | 41.08 | 52.42 |
| % reduction TDRe IMPROVED | 40% | 24% | 23% | 23% | 36% |
| % reduction TDRe OPTIMIZED | 53% | 50% | 35% | 35% | 40% |
| Demand without TDRe [kWh/m2]/Santiago/North Orientation | 118.52 | 187.13 | 212.27 | 78.68 | 105.15 |
| % reduction TDRe IMPROVED | 64% | 65% | 55% | 57% | 68% |
| % reduction TDRe OPTIMIZED | 80% | 80% | 68% | 65% | 74% |
| Demand without TDRe [kWh/m2]/Concepción/North Orientation | 110.35 | 201.51 | 223.57 | 82.64 | 97.98 |
| % reduction TDRe IMPROVED | 63% | 65% | 57% | 61% | 68% |
| % reduction TDRe OPTIMIZED | 74% | 81% | 72% | 72% | 76% |
| Demand without TDRe [kWh/m2]/Punta Arenas/North Orientation | 201.4 | 451.52 | 494.04 | 153.17 | 168.9 |
| % reduction TDRe IMPROVED | 71% | 75% | 65% | 70% | 76% |
| % reduction TDRe OPTIMIZED | 83% | 85% | 82% | 81% | 85% |
| % reduction in different climates considering TDRe OPTIMIZED and Punta Arenas as a base location | |||||
| % reduction compared to Concepción | 8% | 9% | 15% | 0% | 0% |
| % reduction compared to Santiago | 15% | 5% | 15% | 0% | 0% |
| % reduction compared to Calama | 33% | 39% | 53% | 28% | 14% |
7. Results
8. Discussion and Conclusions
Author Contributions
Funding
Acknowledgments
Conflicts of Interest
References
- OPS, Organización Panamericana de la Salud. Guías Para El Desarrollo Del Recurso Físico En Salud; OPS: Washington, DC, USA, 1990. [Google Scholar]
- Navarro López, V.; Martín-Zurro, A. La Atención Primaria de Salud En España y Sus Comunidades Autónomas. Concepció Violán Fors, Ed.; Universitat Autònoma de Barcelona: Barcelona, Spain, 2009. [Google Scholar]
- Giliam, S.; Abbott, S. Can Primary Care Groups and Trusts Improve Health? BMJ 2001, 323, 89–92. [Google Scholar] [CrossRef]
- Starfield, B.; Sevilla, F.; Aube, D.; Bergeron, P.; De, J.M.; Hjortdahl, P.; Lumpkin, J.R.; Martínez, J.O.; Sarria-Santamera, A. Primary Health Care and Responsibilities of Public Health in 6 Countries of Europe and North America: A Pilot Study. Rev. Esp. Salud Publ. 2004, 78, 17–26. [Google Scholar]
- Muench, J.; Hoffman, K.; Ponce, J.; Calderón, M.; Meenan, R.T.; Fiestas, F. La Atención Primaria En Los Estados Unidos y La Experiencia Peruana En Perspectiva. Rev. Peru Med. Exp. Salud Publica 2013, 30, 297–302. [Google Scholar] [CrossRef] [PubMed]
- Alcázar, V.R.H.; María, C.P.L.; Julia, M.T.E.; Ivonne, E.F.D.; Daisy, A.M.D.; María del Carmen, M.L. General Considerations on the Evolution of Family Medicine and Primary Health Care in Cuba and Other Countries. Rev. Cuba. Med. Gen. Integral 2014, 30, 364–374. [Google Scholar]
- Montero, J.; Alvaro, T.; Cristian, H. Reforma Sanitaria Chilena y La Atención Primaria de Salud. Algunos Aspectos Críticos. Temas De Agenda Pública U.C. 2010, 5, 13. [Google Scholar]
- De Salud, M. Listado de Establecimientos DEIS Información Del Departamento de Estadísticas e Información de Salud (DEIS); Chilean Ministry of Health: Santiago, Chile, 2018.
- Benavides Paula, S.; Castro Rubén, L.; Jones Ingrid, J. Sistema Público de Salud, Situación Actual y Proyecciones Fiscales 2013-2050; Dirección de Presupuestos: Santiago, Chile, 2013. [Google Scholar]
- Lesley, C. Unit Costs of Health and Social Care. Unit Costs of Health and Social Care; Personal Social Services Research Unit, Ed.; Unit Costs of Health and Social Care: Canterbury, UK, 2009. [Google Scholar]
- Ministerio de Desarrollo Social MIDESO. Metodología de Preparación, Evaluación y Priorización de Proyectos Atención Primaria Del Sector Salud; Ministerio de Desarrollo Social MIDESO: Santiago, Chile, 2013.
- Guerras, J.J.S. Verticalidad versus Horizontalidad. Historia de La Construcción de Hospitales En El Siglo Xx. Inf. De La Construcción 2003, 55, 13. [Google Scholar]
- Facility Guidelines Institute. Guidelines for Design and Construction of Health Care Facilities; Facility Guidelines Institute, Ed.; Facility Guidelines Institute: Washington, DC, USA, 2006. [Google Scholar]
- Halverson, M.; Rosenberg, M. ANSI/ASHRAE/IES Standard 90.1-2013; Determination of Energy Savings; Quantitative Analysis: Washington, DC, USA, 2014. [Google Scholar]
- García, S. Diseño de Centros Sanitarios Eficientes; Agencia Extremeña de la Energía, Ed.; Agencia Extremeña de la Energía: Madrid, Spain, 2014. [Google Scholar]
- Mickaityte, A.; Zavadskas, E.K.; Kaklauskas, A.; Tupenaite, L. The Concept Model of Sustainable Buildings Refurbishment. Int. J. Strateg. Prop. Manag. 2008, 12, 53–68. [Google Scholar] [CrossRef]
- Oliver-Solà, J.; Armero, M.; de Foix, B.M.; Rieradevall, J. Energy and Environmental Evaluation of Municipal Facilities: Case Study in the Province of Barcelona. Energy Policy 2013, 61, 920–930. [Google Scholar] [CrossRef]
- Rajagopalan, P.; Hisham, E. Energy Performance of Medium-Sized Healthcare Buildings in Victoria, Australia—A Case Study. J. Healthc. Eng. 2014, 5, 247–260. [Google Scholar] [CrossRef] [PubMed]
- Bonnema, E.; Doebber, I.; Pless, S.; Torcellini, P. Technical Support Document: Development of the Advanced Energy Design Guide for Small Hospitals and Healthcare Facilities-30% Guide; National Renewable Energy Laboratory, Ed.; National Renewable Energy Laboratory: Golden, CO, USA, 2010. [Google Scholar]
- Moreno, C.M. Diseño y Monitorización a Través de Sensores de Diferentes Aspectos Ambientales y de Confort En Un Edificio; Universidad de Jaén: Jaén, Spain, 2016. [Google Scholar]
- Olgyay, V.; Josefina, F.; Luis, C. Arquitectura y Clima: Manual de Diseño Bioclimático Para Arquitectos y Urbanistas; Gustavo Gili: Barcelona, Spain, 1998. [Google Scholar]
- Hermelink, A.; Schimschar, S.; Boermans, T.; Pagliano, L.; Zangheri, P.; Armani, R.; Voss, K.; Musall, E. Towards Nearly Zero-Energy Buildings Definition of Common Principles under the EPBD—Final Report. In Proceedings of the 2013 European Council for an Energy Efficient Economy, Brussels, Belgium, 17 December 2013. [Google Scholar]
- Premrov, M.; Leskovar, V.Z.; Mihalič, K. Influence of the Building Shape on the Energy Performance of Timber-Glass Buildings in Different Climatic Conditions. Energy 2016, 108, 201–211. [Google Scholar] [CrossRef]
- Binaee, R. The Correlation between Building Shape and Building Energy. Int. J. Adv. Res. 2017, 5, 552–561. [Google Scholar]
- Kaewunruen, S.; Rungskunroch, P.; Welsh, J. A Digital-Twin Evaluation of Net Zero Energy Building for Existing Buildings. Sustainability 2019, 11, 159. [Google Scholar] [CrossRef]
- Menezes, A.C.; Cripps, A.; Bouchlaghem, D.; Buswell, R. Predicted vs. Actual Energy Performance of Non-Domestic Buildings: Using Post-Occupancy Evaluation Data to Reduce the Performance Gap. Appl. Energy 2012, 97, 355–364. [Google Scholar] [CrossRef]
- Moos, R.H.; Schaefer, J.A. Evaluating Health Care Work Settings: A Holistic Conceptual Framework. Psychol. Health 1987, 1, 97–122. [Google Scholar] [CrossRef]
- De Energía, M. Energía-2050, Política Energética de Chile; Ministerio de Energía, Ed.; Ministerio de Energía: Santiago, Chile, 2016.
- Mideplan. Preparación y Presentación de Proyectos de Inversión; Ministerio de planificaión y cooperación, Ed.; Ministerio de planificaión y cooperación: Santiago, Chile, 1998. [Google Scholar]
- Citectubb; Deconuc. TDRe1 Términos de Referencia Estandarizado Con Parámetros de Eficiencia Energética y Confort Ambiental, Para Licitaciones de Diseño y Obra de La Dirección de Arquitectura, Según Zonas Geográficas Del País y Según Tipología de Edificios; Concepciòn, Chile; 2004. Available online: http://construccionsustentable.uc.cl/images/Documentos/TDRe_MOP-DA.pdf (accessed on 15 January 2019).
- Rey-hern, J.M.; Velasco-g, E.; San, J.F.; Tejero-gonz, A.; Rey-mart, F.J. Energy Analysis at a Near Zero Energy Building. Available online: https://www.mdpi.com/1996-1073/11/4/857 (accessed on 15 January 2019).
- Instituto Nacional de Normalización. NCH 1079 Arquitectura y Construcción- Zonificación Climático Habitacional Para Chile y Recomendaciones Para El Diseño Arquitectónico; Instituto Nacional de Normalización: Santiago, Chile, 2008. [Google Scholar]
- Servicio andaluz de Salud. Guía de Diseño de Centros de Atención Primaria; Servicio andaluz de Salud: Sevilla, Spain, 2008. [Google Scholar]
- Nirit, P.P.; Kalay, Y.E. Open Architecture for Healthcare: Case Study of Hospital Change in Practice. 2017. Available online: http://www.uia2017seoul.org/P/papers/Full_paper/Special_Session/Oral/O-0631.pdf (accessed on 15 January 2019).

Case 1  | Case 2  | Case 3  | Case 4  | Case 5  | |
|---|---|---|---|---|---|
| Location | Region of Valparaíso Latitude-33.36/Longitude-71.67 Algarrobo. | Region of Maule Latitude-35.09/Longitude-72.02 Curepto. | Metropolitan Region Latitude-33.46/Longitude-70.64 Santiago. | Region of Bío-Bío Latitude-36.82/Longitude-73.04 Concepción. | Region of Los Lagos Latitude-42.37/Longitude-73.65 Dalcahue. |
| Climate zone | 4CL Central Coast | 5CI Central Interior | 5CI Central Interior | 6SL Coastal South | 8SE Extreme South |
| Parcel Area | 22.000 m2 | 53.162 m2 | 2.500 m2 | 4.500 m2 | 4.333 m2 |
| Users | 10.000/Year. | 5.000/Year. | 30.000/Year | 30.000/Year | 20.000/Year |
| Number of Floors | 2 | 1 | 2 | 3 | 2 |
| Headroom | 2.6 | 2.90 | 2.75 | 3.15 | 2.70 |
| Number of patios/courtyards | 0 | 3 | 2 | 1 | 1 |
| Built surface area | 1.970 m2 | 1.146 m2 | 2.687 m2 | 3.789 m2 | 2.346 m2 |
| Roof surface area | 1.163 m2 | 1.125 m2 | 1.552 m2 | 1.193 m2 | 1.338 m2 |
| Enclosure surface area | 2.500 m2 | 1.687 m2 | 2.834 m2 | 3.442 m2 | 2.336 m2 |
| Volume | 5.300 m3 | 3.307 m3 | 7.262 m3 | 9.469 m3 | 5.256 m3 |
| Wall materials | Reinforced concrete with exterior finish in stone and Litrofen (exterior finish with a base of cement, lime, gypsum and pigment) | Reinforced concrete with exterior finish in EIFS (Exterior Insulation Finish Systems) | Reinforced concrete with exterior finish in Fundermax panels (high pressure Wood laminate panels) | ||
| Windows | Thermopanel with PVC profiles | ||||
| Floors in contact with the ground | Concrete with expanded polystyrene insulation | ||||
| Roofing | Galvanized sheet metal with expanded polystyrene insulation. | ||||
| Roof pitch/slope | 5% | 35% | 10% | 15% | 5% |
| Pre Investment | Costs | Time |
|---|---|---|
| Generation and analysis of the project idea | ||
| Profile study | ||
| Prefeasibility study | ||
| Feasibility Study | US$ 130,000 to US$ 350,000. | 8 to 15 Months |
| Evaluation (MIDESO) | 3 to 5 Months | |
| Pre-project design | ||
| Project Design | US$ 70,000 to US$ 130,000 | 7 to 24 Months |
| Investment | Costs | Time |
| Evaluation (MIDESO) | 3 to 5 Months | |
| Public tender process | 6 to 8 Months | |
| Operation | ||
| Construction of the project | US$ 3,000,000 to US$ 6,000,000 | 36 to 48 Months |
| Total project costs and times | US$ 3,200,000 to US$ 6,480,000 | 63 to 105 Months/5.25 to 8.75 Years |
| Facility | Temperature Set Point for Heating °C | Temperature Set Point for Cooling °C | Lighting Level | Occupation Hours | Office Equipment/Gains (W/m2) | Normalized Power Density (W/m2–100 lux) |
|---|---|---|---|---|---|---|
| Waiting Room | 20 | 25 | 200 | Monday-Friday, from 8:00 to 17:00—Saturday, from 8:00 to 12:00 | 20 | 11 |
| Emergency Room | 20 | 25 | 500 | 20 | 16.3 | |
| Vaccination Clinic | 20 | 25 | 500 | 20 | 16.3 | |
| IRA Ward | 20 | 25 | 500 | 30 | 13 | |
| ERA Ward | 20 | 25 | 500 | 30 | 13 | |
| Pharmacist office | 20 | 25 | 500 | 30 | 13 | |
| Gynecology clinic | 20 | 25 | 400 | 20 | 16.3 | |
| Dental clinic 2 | 20 | 25 | 400 | 20 | 16.3 |
| Limit Values | |||||||
|---|---|---|---|---|---|---|---|
| Scenarios | Zone | U Value/Wall | U Value/Wall in Contact with Ground | U Value/Floor in Contact with Ground | U Value/Inclined Cover | Air Change Rate per Hour | U Value/Glazing |
| Without TDRe | Calama/ZC 2ND | 4.1 | 4.1 | 2.3 | 2.7 | 8.0 | 5.8 |
| Santiago/ZC 5CI | 4.1 | 4.1 | 2.3 | 2.7 | 8.0 | 5.8 | |
| Valparaíso/ZC 4CL | 4.1 | 4.1 | 2.3 | 2.7 | 8.0 | 5.8 | |
| Concepción/ZN 6SL | 4.1 | 4.1 | 2.3 | 2.7 | 8.0 | 5.8 | |
| Temuco/ZC 7SI | 4.1 | 4.1 | 2.3 | 2.7 | 8.0 | 5.8 | |
| Punta Arenas/ZC 8SE | 4.1 | 4.1 | 2.3 | 2.7 | 8.0 | 5.8 | |
| With TDRe IMPROVED | Calama/ZC 2ND | 0.5 | 0.5 | 0.5 | 0.4 | 6.0 | 2.9 |
| Santiago/ZC 5CI | 0.6 | 0.6 | 0.6 | 0.4 | 3.0 | 2.9 | |
| Valparaíso/ZC 4CL | 0.8 | 0.8 | 0.8 | 0.6 | 3.5 | 2.9 | |
| Concepción/ZN 6SL | 0.6 | 0.6 | 0.6 | 0.4 | 3.0 | 2.9 | |
| Temuco/ZC 7SI | 0.5 | 0.5 | 0.5 | 0.3 | 2.5 | 2.9 | |
| Punta Arenas/ZC 8SE | 0.4 | 0.4 | 0.4 | 0.3 | 2.5 | 2.9 | |
| With TDRe OPTIMIZIZED | Calama/ZC 2ND | 0.3 | 0.3 | 0.3 | 0.2 | 4.0 | 1.7 |
| Santiago/ZC 5CI | 0.3 | 0.3 | 0.3 | 0.2 | 1.5 | 1.7 | |
| Valparaíso/ZC 4CL | 0.4 | 0.4 | 0.4 | 0.4 | 2.0 | 1.7 | |
| Concepción/ZN 6SL | 0.3 | 0.3 | 0.3 | 0.2 | 1.5 | 1.7 | |
| Temuco/ZC 7SI | 0.3 | 0.3 | 0.3 | 0.1 | 1.3 | 1.7 | |
| Punta Arenas/ZC 8SE | 0.2 | 0.2 | 0.2 | 0.1 | 1.3 | 1.7 | |
© 2019 by the authors. Licensee MDPI, Basel, Switzerland. This article is an open access article distributed under the terms and conditions of the Creative Commons Attribution (CC BY) license (http://creativecommons.org/licenses/by/4.0/).
Share and Cite
Forcael, E.; Nope, A.; García-Alvarado, R.; Bobadilla, A.; Rubio-Bellido, C. Architectural and Management Strategies for the Design, Construction and Operation of Energy Efficient and Intelligent Primary Care Centers in Chile. Sustainability 2019, 11, 464. https://doi.org/10.3390/su11020464
Forcael E, Nope A, García-Alvarado R, Bobadilla A, Rubio-Bellido C. Architectural and Management Strategies for the Design, Construction and Operation of Energy Efficient and Intelligent Primary Care Centers in Chile. Sustainability. 2019; 11(2):464. https://doi.org/10.3390/su11020464
Chicago/Turabian StyleForcael, Eric, Alberto Nope, Rodrigo García-Alvarado, Ariel Bobadilla, and Carlos Rubio-Bellido. 2019. "Architectural and Management Strategies for the Design, Construction and Operation of Energy Efficient and Intelligent Primary Care Centers in Chile" Sustainability 11, no. 2: 464. https://doi.org/10.3390/su11020464