Abstract
Emerging industries bear great difference from traditional industries. It is valuable to explore the effectiveness of different resource management methods in the two industries. Based on this, the purposes of this paper are first to define and distinguish two core resource management methods (i.e., resource integration and resource reconfiguration), and second to research the different impact paths of resource integration and resource reconfiguration on the sustainable competitive advantages in different industries. Primarily, in order to achieve these purposes, this paper explores the generation path of resource integration and resource reconfiguration from the perspective of organizational learning; secondly, the empirical analysis method is applied to examine the different influences between resource integration and resource reconfiguration on sustainable competitive advantages. Based on 208 samples in traditional industries and 220 samples in emerging industries, the results show that resource integration and resource reconfiguration are the consequence of organizational learning. In traditional industries, resource integration and resource reconfiguration have a positive impact on sustainable competitive advantages, respectively, resulting in a “concerto effect” on sustainable competitive advantages. While, in emerging industries, though resource integration has a positive impact on sustainable competitive advantages, however, there is an inverted U-shaped relationship between resource reconfiguration and sustainable competitive advantages. In such a situation, the “concerto effect” disappeared. This paper not only reveals the uniqueness of different resource management methods in different industries but also enriches the applications of resource management theories in different situations.
1. Introduction
Industries can be categorized as emerging or traditional. Emerging industries include seven industries, including new generation of information technology, bio-medicine, energy saving and environmental protection, high-end equipment manufacturing, new energy, new materials, and new energy vehicles [1]. Traditional industries mainly refer to those labour-intensive, manufacturing, and processing industries (i.e., textile industry, shoe-making industry, petrochemical industry, paper products industry) [2,3]. Emerging industries are the key to determining a country's core competency, at the same time, they are also the core fields of national strategy implementation (i.e., U.S. industrial Internet, German Industry 4.0, Made in China 2025). Because of the characteristics of short technology upgrading cycle, unclear market structure and uncertain customer demand, enterprises in emerging industries have more challenges in resource input and integration, which is also fundamentally different from traditional industries with relatively stable technology and markets [4]. In addition, enterprises in emerging industries are facing more resource barriers, including the shortage of information resources, knowledge resources, technical resources, and human resources [5]. Therefore, industry turbulence and resource constraints have brought challenges to the traditional classical resource management theory—resource-based view (RBV).
As a classical resource management theory, RBV pays more attention to how to obtain sustainable competitive advantage (SCA) through effective resource management [6] in order to achieve the sustainability in economy, environment, and society [7]. However, due to the differences of external environment, enterprise strategy is dynamic and extroverted, just as the emergence of Porter’s industry strategy to cope with dynamic competition [8]. Therefore, enterprises’ resource management strategies have also begun to emphasize the importance of integrating resources from external environments [9]. So far, resource integration has become an important concern of RBV theory, and is also regarded as a critical skill for the sustainable development of enterprises.
However, resource integration will lead to the reconfiguration of resource structure which is complex and abstract; little existing research can explain the process and mechanism of reconfiguration clearly. Organizational theory also pays attention to change, and emphasizes shaping new resource structures to gain sustainable competitive advantages (SCAs), such as the transformation of dominant operation processes which lead to new international standards or the cultivation of implicit cultural atmospheres which lead to new behaviors by employees [10]. In the process of organizational change, organizational learning always affects the efficiency of resource integration and the effectiveness of new resource structure [11], so it is crucial to explore the relationship between organizational learning, resource integration, and resource reconfiguration. Therefore, the first purpose of this paper is to reveal the difference between resource integration and resource reconfiguration from the perspective of organizational learning; secondly, because traditional industries and emerging industries have different characteristics, it needs to reveal the differences between resource integration and resource reconfiguration under different industries and explore the “concerto effect” (interaction produces positive effect). Based on this, the second purpose of this paper is to distinguish and explore the different impact paths of resource integration and resource reconfiguration on the SCAs under different industries.
Based on 208 samples in traditional industries and 220 samples in emerging industries, the results show that resource integration and resource reconfiguration are both the consequence of organizational learning. In addition, the research yields that resource integration has a positive effect on SCAs in both emerging and traditional industries. However, though resource reconfiguration has a positive effect on SCAs and also has a “concerto effect” with resource integration on SCAs in traditional industries, there is an inverted U-shaped relationship between resource reconfiguration and SCAs in emerging industries. Thus, the “concerto effect” has disappeared in emerging industries. The theoretical significances of this paper are as follows: Firstly, the paper defines two core resource management methods (resource integration and resource reconfiguration) which have been measured from the perspective of organizational learning. Secondly, this paper compares the different impacts of resource integration and resource reconfiguration on SCAs between traditional industries and emerging industries. Finally, this study validates the “concerto effect” between resource integration and resource reconfiguration. The practical significance of this paper is to guide enterprises to rationally choose different resource management methods in different industries and provide practical guidance and suggestions.
2. Literature Review and Hypotheses
2.1. RBV and SCA
The resource-based view (RBV) originated from strategic management, which was proposed by Wernerfelt [12], and was enriched and perfected by Barney [13]. The RBV reached its peak in 1994, from which time on it has become the most classic and mature theory in the field of resource management. As a theory to explore the source of SCAs, the main feature of RBV is adopting internal resources and resource efficiency to explain the source of competitive advantage. Entirely different from structural analysis [14] and pair-level analysis [15], the perspective of RBV focuses on the inside of enterprises. The introduction of RBV theory also indicates that strategic management theory has a theoretical shift from the outside to the inside. The RBV theory accentuates that the source of competitive advantage is chiefly characterized by four key elements of resources, namely value, rarity, inimitability, and non-substitutability (VRIN). In addition, the RBV theory also provides a unique view on the efficiency of resource utilisation [16]. It emphasises the identification and acquisition of VRIN attributes resources, as well as the allocation and utilisation of resources, which is also the process of resource integration.
Competitive advantages, including short-term competitive advantages and sustainable competitive advantages, usually leads to high profits, but these profits always attract competitors, consequently limiting the duration of competitive advantage. However, if competitors cannot imitate the source of advantage, then the competitive advantage of the company is sustainable [17]. Such SCAs can bring long-term profits and avoid being overtaken by competitors through strategic replication or imitation [18]. As a long-term dynamic process, SCAs originated from the theory of competitive advantage, and is unique to enterprises. The SCA is the advantage, developing in an enterprise against and beyond its competitors continuously [19,20]. Resources are an important driving force for enterprises to gain competitive advantage and performance [21,22], and the process of selecting enterprise resources has an important impact on heterogeneity and SCAs [23]. Enterprises need to establish SCAs and obtain excess profits by effectively integrating resources and developing resources that meet the need for future development.
2.2. Organizational Learning, Resource Integration, and Resource Reconfiguration
2.2.1. Organizational Learning
Learning can be expressed as changes in beliefs, cognition or behaviour [24]. Organizational learning is a process in which an enterprise acquires new knowledge and insights from the common experience of people in the organization, and has the potential to influence behaviour and improve enterprise capacity [25]. In the development of organizational learning theory, March pioneered the theoretical model of “exploratory learning and exploitative learning”, revealing the internal mechanism and process of organizational learning [26]. Exploratory learning and exploitative learning are the basic learning mechanisms for organizations and other adaptive systems [27]. Exploratory learning refers to the learning of product and process development skills, which are new to the company's current experience [28]. Keys to exploratory learning are search, variability, adventure, experimentation, flexibility, discovery, and innovation [29].
Conversely, exploitative learning refers to learning from knowledge and skills that are familiar with the enterprise’s current experience. It emphasisesorganizational members seeking change and tends to focus on gathering knowledge from stakeholders and cultivating new capabilities to keep the competitive position [30]. It characteristics are perfection, selection, production, efficiency, selection, implementation, and execution. Based on existing knowledge, absorption and accumulation of new knowledge in a targeted manner are emphasized so as to reorganise the knowledge system and perfect the existing resource structure. Exploratory learning and exploitative learning need to promote each other and cannot be ignored by either side. In addition, from the perspective of the correspondent relationship between knowledge type and organizational learning, if the knowledge acquired by enterprises is unfamiliar, future, and foreign, that is exploratory learning. Instead, if it is already known, existing, and local knowledge, that is exploitative learning [31].
2.2.2. Resource Integration
Resource integration is an important bridge connecting the internal and external enterprise [32]. When resources are discovered and effectively utilised by the enterprise, the value of them will appear [33]. According to RBV, resource integration is the process of effectively identifying, acquiring, and allocating external resources. Enterprises need to keep searching and digging to identify external valuable resources and to gain further competitive advantage. Identifying means companies need to find valuable resources ahead of their competitors; surveillance stresses the need for companies to keep an eye on competitors or market conditions to learn about new industrial trends; learning requires companies to quickly understand and imitate the advanced business methods and models of competitors; and forecasting asks for a longer-term strategic vision. The company equipped with the ability to learn is more likely to perceive events and trends in the market, and the learning organizations are generally more flexible than their competitors [25]. Resource acquisition is the follow-up of resource identification and the process of obtaining resources through various relationship channels and operation methods. It stresses timeliness and the importance of accessing resources quickly and effectively.
Organizational learning is of great significance to access to resources, especially for new enterprises that often lack sufficient resources to underpin their growth [29]. Some enterprises employ various methods in order to get the resources they need. For scarce human resources, the main way is to give high reward and motivation; for some special intellectual property rights, enterprises are more likely to introduce or cooperate through capital purchase, capital transfer, and strategic alliance; certainly, enterprises can absorb and reuse through learning, such as knowledge resources. Due to the heterogeneity of resources and the great differences between different resources, it is necessary to understand the mutual matching of resources through organizational learning to make up for shortcomings, so as to maximise the efficiency of resource utilisation. At the same time, managers can also make full use of scarce resources through organizational learning, and pay attention to the realisation of scarce resources, and maximise the effectiveness of scarce resources. In addition, organizational learning is the process of acquiring new knowledge and capabilities, which strengthens organizational actions. Efficient knowledge sharing and transfer provide organizational members with opportunities of learning and collaboration [34,35].
Accordingly, this paper proposes the following hypothesis:
Hypothesis 1.
Organizational learning has a positive effect on resource integration.
Hypothesis 1a.
Exploratory learning has a positive effect on resource integration.
Hypothesis 1b.
Exploitative learning has a positive effect on resource integration.
2.2.3. Resource Reconfiguration
Undertaking resource integration, resource reconfiguration is the process of rebuilding the original resource structure when the enterprise integrates resources. According to RBV, obtaining differentiated resources helps enterprises gain competitive advantage, and ongoing resource reconfiguration can help enterprises overcome their weaknesses and maintain competitive advantage [36,37]. The reconfiguration of the resource structure is also the process of re-updating the inherent rules, which corresponds to the update of organizational routines. Regarding the organizational routines, it can be comprehended at both the behavioural and cognitive levels. On the one hand, routines refer to a series of behaviour patterns that are repeatedly followed at the behavioural level. On the other hand, routines are the rules of cognition and cognitive model at the cognitive level. Based on this perspective, Feldman and Pentland [38] pointed out that organizational routine is a stable source of organizations to respond to changes in the external environment and divided organizational routine into two aspects: representational interpretation and behavioural expression [38]. Hence, the routine is a combination of the participants’ subjective cognitive rules and behavioural implementation rules, which represents the results of organizational learning.
In fact, as a strategy, organizational learning is a new organizational method and procedure that can promote learning and changes [34]. In a dynamic environment, it is particularly crucial for resource management of new enterprises [39]. Efficient organizational learning can ensure enterprises acquire new information and knowledge in understanding and improving the process and mechanism of organizational routines [40]. It supports the creation, configuration, deployment, and update of resource bases within the organization to adapt to environmental changes [41]. The process of organizational learning is built by experience accumulation, knowledge connection and coding, and absorption processes, which can enhance the effectiveness of organizational routines [42,43]. In this process, objective elements such as panels, signs, and slogans from the organization, as the existence of explicit knowledge, play a pivotal role in the formation of the cognitive schema for the organization individual. It can be seen that no matter what kind of learning method an organization takes; it will have a corresponding impact on organizational routines. The logic of resource reconfiguration from the perspective of organizational routines is shown in Figure 1.
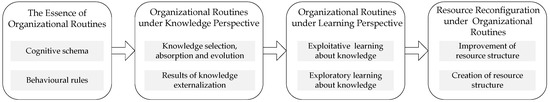
Figure 1.
The research logic of resource reconfiguration.
Based on this information, this paper proposes the following hypothesis:
Hypothesis 2.
Organizational learning has a positive effect on resource reconfiguration.
Hypothesis 2a.
Exploratory learning has a positive effect on resource reconfiguration.
Hypothesis 2b.
Exploitative learning has a positive effect on resource reconfiguration.
2.3. Resource Integration and Reconfiguration under Different Industries
Strategic management theory stresses more on how the enterprise’s strategic choice is interdependent with the external environment, and the enterprise needs to make constant changes to cope with the risks of the external environment [44]. Some scholars also classify environmental risks into technical risks and competitive risks, both designated as market risks. Enterprises need to choose strategic implementation plans by overcoming risks at both levels. The technical risk is manifested from the high frequency of technical updates, high technical cost, and uncontrollable benefits. By estimating technological risks, enterprises can choose different resource management methods, either by actively developing or introducing technology. Whereas, the competition risk is presented by the diversification of market competition, unreasonable market competition structure and profit-seeking behaviour of stakeholders. Especially for the immature market, the rules and norms are not perfect so that competitors can influence the interests of the enterprise through plagiarism and malicious competition. The strategic choice in attack or defence, first move or later move will determine the management mode of enterprise resources, and it is also an important guarantee for the enterprise to resist risks [45].
2.3.1. Traditional Industry
Traditional industry is moderate-dynamic, in which situation the market is still changing, but relatively perceptible and predictable [2]. Managers can formulate specific strategic implementation guidelines through insight into the competitive structure of the market; they can also choose the direction of resource allocation by predicting market demand boundaries, consumer spending habits, and future-leading technologies. Based on this, along with the predicted and perceived route, enterprises can identify the competitive structure and boundaries of the market, and explore the key resources and capabilities that affect the market competition. Moreover, they can carry out effective resource integration activities, including mastering key industry technology, grasping mainstream consumer habits and trends, and building strategic alliances with the companies with unique technologies. This kind of resource integration on each node of the supply chain has a positive impact on enterprise operation performance [46,47]. Besides, managers can also carry out activities of resource structural reorganization and renewal orderly, and update through their tacit knowledge and business rules, so as to develop new effective workflow and linear work steps. Especially in the link of structural reform and reorganization, the conclusion of the profound and perfect market analysis is trustworthy for enterprises.
In traditional industries, some information is easily perceived by enterprises due to the huge-scale, long-life and relatively mature technology [3]. For example, in the petrochemical industry which develops slowly, new workflow and steps are the result of continuous data collection, development of alternative solutions, and continuous attempts and improvements [48]. At this time, precisely subdivided, workflow and steps enhance the organization’s understanding of the original resource structure and further advance the efficiency of the new resource structure. However, in the dyestuff industry, the development of the industry is still slow, and the strategic decision is long-term and sustainable. The decision-making process is linear, including the type, specification of the dye, transformation and redesign of the dyeing process, and so on. This process can be repeated and overlapped, as well as repeated adjustments made [49]. Therefore, in traditional industries, enterprises can integrate resources by relying on the perception of the market. At this point, the structural resource reconfiguration and the update of routines is a linear process, which can be repeated and adjusted. Overall, resource integration and resource reconfiguration can help enterprises gain SCAs in the market due to the slow development and clear boundaries.
Accordingly, this paper proposes the following hypothesis:
Hypothesis 3.
In the traditional industry, resource integration has a positive effect on SCAs.
Hypothesis 4.
In the traditional industry, resource reconfiguration has a positive effect on SCAs.
Hypothesis 5.
In the traditional industry, there is a “concerto effect” between resource integration and resource reconfiguration on SCAs.
2.3.2. Emerging Industry
Emerging industry belonging to the high-velocity industry with vague market structure and boundary faces uncertainty competition [50]. For example, the means of competition has become more complex, the competition standards are not unified, and even the system and laws are one-sided and ineffective. In emerging markets, on account of the emergence of new technologies and the continual death of traditional technologies, the entire industry is facing a subversion and the market is highly risky and uncertain [51]. Consequently, enterprises would find it difficult to identify and predict critical technologies, and they would also take a risk in innovation. In such a rapidly developing and unpredictable market environment, it is not enough for the enterprises to have specific resources to maintain a competitive advantage [52], and it is necessary to use resource integration to make full use of resources [53]. Enterprises should pay more attention to the integration of tacit resources, and the value of knowledge resources is particularly important. In the integration process of knowledge resources, learning, adapting, absorbing, and sharing will promote enterprises to keep up with industrial development, and also assist enterprises to reserve a deeper resource base to cope with the risk of future industries.
For example, in the field of artificial intelligence, mature technologies and business models are still under exploration. Besides, many bottlenecks have not been tackled, such as relying on massive data, higher artificial intelligence energy consumption, non-generalised training mode, semantic gaps, and reliability, etc. In emerging industries, there is a high risk of uncertainty, and investors and customers adopt a wait-and-see attitude. Besides, laws and regulations are immature, and the industry seems to be dynamic, but there are not many reliable opportunities [54]. Based on this, under the circumstance of fragmented market information and intermittent markets, the conclusions obtained by enterprises through analysis are often discrete, and the successful cases are also low probability events. Enterprises should learn continuously, absorb new knowledge to store knowledge bases and refine special knowledge to meet future challenges. Therefore, resource integration still plays a vital role on the SCAs. Nevertheless, enterprises cannot change the original resource structure easily, because the new resource structure may become ineffective rapidly due to an immature conclusion. It is more sensible to focus on choices rather than making adjustments, and it is easier to succeed by choosing old, simple, and reliable resource structures [55].
Accordingly, this paper proposes the following hypothesis.
Hypothesis 6.
In the emerging industry, resource integration has a positive effect on SCAs.
Hypothesis 7.
In the emerging industry, resource reconfiguration has a negative effect on SCAs.
Hypothesis 8.
In the emerging industry, there is no “concerto effect” between resource integration and resource reconfiguration on SCAs.
Figure 2 presents the overall research framework.
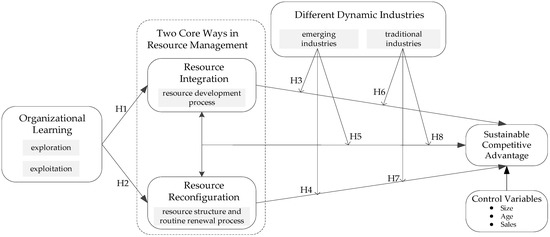
Figure 2.
The research model.
3. Methodology
3.1. Selection of Sample
A structural questionnaire was employed to measure variables and test hypotheses in the model. First, through the database of listed enterprises (Wind and Tai’an, which include enterprise information, financial data and investment consulting data, are the leading economic and financial research databases in China) and industrial enterprises, the basic information on enterprises in emerging industries and traditional industries was gathered. Based on the registration category of the industry, the classification criteria of emerging industries and traditional industries (the existing main business is consistent with the registration category which was determined by the enterprise at the early stage of the life cycle) was determined [56]. The samples of emerging industries were selected from seven strategic emerging industries (see Table 1), and the samples of traditional industries were selected from six specific traditional industries (see Table 1). Each sample has typical industry characteristics while avoiding the selection of enterprises with cross-industry characteristics.

Table 1.
Characteristics of the research samples.
Second, according to the mailing addresses which were drawn from the database, the questionnaires were addressed to the senior managers (i.e., CEOs, general managers, board directors) who are from 600 Chinese firms (300 firms in emerging industries and 300 firms in traditional industries), because they have more information about the firms and play a critical role in organizational resource management [57]. A cover letter was included to explain the purpose of our research in order to provide the managers with a better understanding of the connotation of our questionnaires. The managers were also promised that the detailed information they provided about their companies would remain confidential and that the questionnaire would only be used for scientific research. The cover letter included a network link from which the managers could fill out the questionnaires online.
3.2. Procedure of Analysis
From October 2016 to February 2018, 16 months were spent collecting the data and 514 completed questionnaires (263 questionnaires in emerging industries and 251 questionnaires in traditional industries) were returned. After checking the questionnaires, some were unqualified due to the missing information and the short filling time less than 5 minutes (43 questionnaires in traditional industries and 43 questionnaires in emerging industries), and thus were eliminated. At last, 428 valid questionnaires were achieved (220 questionnaires in emerging industries and 208 questionnaires in traditional industries). The recovery rate was 73.3% (73.3% in emerging industries and 69.3%in traditional industries). Non-response bias was used to test the differences between early and late responses [58]. Furthermore, a t-test was performed and no significant differences between the two subgroups in different industries were detected. Table 1 shows the characteristics of the research samples.
3.3. Scale Development and Measures
The study used standard statistical methods in the literature to test the reliability and validity of the scale and measure our hypotheses [59]. Each scale of the variables was based on previous scales or definitions from the literature. The selection and estimation of measurement parameters accord with international standards [60] and can fully underpin the empirical results.
According to the Atuahene-Gima and Murray’s research [61], six items were used to measure the variable of organizational learning, including three items about exploratory learning: (1) seek market information to address high risk; (2) seek potential market demand to develop new projects; (3) seek access to new areas of product), and three items about exploitative learning: (4) seek information to disentangle current product issues; (5) seek competitor information to improve product strategy; and (6) accumulate the new knowledge. The results of reliability and validity analysis of organizational learning are shown in Table 2.
Table 2.
Results of the reliability and validity test of organizational learning.
The measurement of resource integration in academia is based on the scale of Wiklund and Shepherd [62], and includes six items: (1) accumulating unique resources for future use; (2) using new resources to pursue new strategic initiatives; (3) developing new resources for use in new operations; (4) acquiring new resources for future expansion; (5) using existing resources for future expansion; (6) using new resources to create radically new product. The results of reliability and validity analysis of resource integration are shown in Table 3.
Table 3.
Results of the reliability and validity test of resource integration.
The measurement of resource reconfiguration can be based on the research of organizational routines from two aspects: the improvement of resource structure and the creation of resource structure [63,64]. Improvement of resource structure includes three items: (1) adjust organization standard process to get more efficiency; (2) use new knowledge to improve process specification; (3) evaluate the standardization of organizational process regularly. Creation of resource structure includes three items: (4) encourage employee to trial and error; (5) create new process to cope with the external changes; (6) provide new training and guidance for employees. The results of reliability and validity analysis of resource reconfiguration are shown in Table 4.
Table 4.
Results of the reliability and validity test of resource reconfiguration.
The independent variable is SCA which is measured by Wu’s [53] research with five items: (1) maintain a high market reaction speed for a long time; (2) maintain a high-quality product for a long time; (3) maintain a high production efficiency for a long time; (4) maintain a high innovation frequency for a long time; (5) maintain a high customer satisfaction for a long time. In order to avoid being influenced by external factors on the model, three control variables were chosen (size, age, and sales) [65]. The results of the reliability and validity analysis of SCAs are shown in Table 5.
Table 5.
Results of the reliability and validity test of SCAs.
4. Finding of the Research
4.1. Results of General Descriptive Analysis
Before testing the hypothesis, the bivariate correlations of variables need to be tested. Table 6 presents the results in traditional industries. The correlation coefficient matrix shows the correlation between variables, and the correlation coefficient is less than 0.7 of the critical value.
Table 6.
Results of descriptive statistics and correlation coefficients in traditional industries.
Table 7 presents the results in emerging industries. Taking the reliability of empirical research results and the correlation between variables into consideration, mean-centred was used to deal with all variables in order to reduce research errors.
Table 7.
Results of descriptive statistics and correlation coefficients in emerging industries.
4.2. Results of Multivariate Linear Regression Analysis
To test the hypotheses, a moderated hierarchical regression analysis was conducted [66]. In this process, the interaction or regulation effect requires adjusting variables to avoid multiple co linearity problems. The multiple collinear ties of the variance expansion factor were also tested.
Since the data were divided into two groups, the research first analyzed it in traditional industries. The results are shown in Table 8. The independent variables in model 1 contained only control variables, and the dependent variable was resource integration. Model 2 adds the variables of exploratory learning and exploitative learning. The results of the empirical analysis show that exploratory learning and exploitative learning both had a significant positive correlation with resource integration (r = 0.252, p < 0.001; r = 0.159, p < 0.05), indicating that hypothesis 1 is supported in traditional industries. In the same way, the results in model 3 and model 4 shows that exploratory learning and exploitative learning both had a significant positive correlation with resource reconfiguration, indicating that hypothesis 2 is supported in traditional industries. The dependent variable in model 5 is SCA, and resource integration and resource reconfiguration were added in model 6. The results show that resource integration and resource reconfiguration both had a significant positive correlation with SCA (r = 0.168, p < 0.05; r = 0.181, p < 0.01), indicating that hypothesis 3 and hypothesis 4 are both supported. Model 7 adds an interaction item of resource integration and resource reconfiguration on the basis of model 6. The results show that there was a significant positive correlation between the interaction and SCA (r = 0.216, p < 0.01), indicating that hypothesis 5 is supported.
Table 8.
Results of logistics regression analysis in traditional industries.
Then, the research tested the hypotheses in the emerging industries. The results areshown in Table 9. In model 9, the results of the empirical analysis show that exploratory learning and exploitative learning both had a significant positive correlation with resource integration (r = 0.160, p < 0.05; r = 0.211, p < 0.01), indicating that hypothesis 1 is supported in emerging industries. Combined with the results of traditional industries, hypothesis 1 is supported. In model 11, the results of the empirical analysis show that exploratory learning and exploitative learning both had a significant positive correlation with resource reconfiguration (r = 0.179, p < 0.05; r = 0.185, p < 0.05), suggesting that hypothesis 2 is supported in emerging industries. Combined with the resultants of traditional industries, hypothesis 2 is supported. In model 13, resource integration had a significant positive correlation with SCA (r = 0.182, p < 0.01), indicating that hypothesis 6 is supported. However, in model 14, the interaction item of resource integration and resource reconfiguration was added, and the research also adds the interaction item of resource reconfiguration and resource reconfiguration. The results show that there was no significant correlation between the interaction item of resource integration and resource reconfiguration and SCA (r = 0.07, p > 0.05), demonstrating that hypothesis 8 is supported. Other results show that the square of resource reconfiguration and SCA were negatively correlated (r = 0.119, p < 0.05), indicating that hypothesis 7 is not supported completely, and there is an inverted U relation between resource reconfiguration and SCA.
Table 9.
Results of logistics regression analysis in emerging industries.
A summary of the results for all hypotheses is shown in Table 10.
Table 10.
Summary of the results for all hypotheses.
5. Discussion
Since the literature began to focus on resource management theory, it is critical to explain the complex interaction mechanism between different resource management methods. Based on existing research, this study reveals the differences between resource integration and resource reconfiguration and explores the interaction of them on SCAs under different industries (empirical results are shown in Figure 3). In this context, our study contributes to both theory and practice.
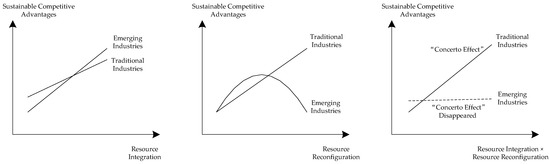
Figure 3.
Results of the empirical analysis.
5.1. Theoretical Contributions
This study makes three central contributions to the literature. First, we find that resource integration and resource reconfiguration (two core ways in resource management) are both the results of organizational learning. The conclusion emphasizes the process of understanding organizational learning before engaging in resource management activities. As far as resource integration is concerned, exploratory learning can help enterprises timely recognise and obtain the necessary information, technical, and human resources in the market, and provide an effective approach for companies to master the method of utilising new resources, while the company identifies scarce and essential resources with the aid of exploitative learning, thereby looking for and obtaining these resources pertinently. Besides, exploitative learning enables the company to perfect resource allocation and improves resource utilization. As the premise of resource reconfiguration, exploratory learning will be meaningful for organizations only by exploring opportunities or threats. Otherwise changing the original resource structure will impair the overall efficiency. Meanwhile, exploitative learning can help the companies avoid the vulnerability and timeliness of new resource structures by making constant attempts and error feedback to amend and improve innovation and reform.
Second, our research offers a better understanding of the influences of resource integration and resource reconfiguration on SCAs in traditional industries. In traditional industries, the result of organizational learning is assured and convincible. Thus, strategic decision based on organizational learning is the outcome of the high probability decision. Moreover, the organization can not only find the accurate direction on the resource integration, but also get well-directed resource allocation. Therefore, it is essential for an organization to keep continually learning and undergoing purposeful resource integration to obtain enduring competitive advantages. At the same time, due to the high reliability of strategic decision-making, upgrading and recombination can be made in the original resource structure. In such a situation, there is no vulnerability in the new resource structure caused by uncertain risk. Resource reconfiguration can promote enterprise to cultivate more dynamic and adaptive organizational routines. In a word, resource integration and resource reconfiguration can be well coordinated in such conditions.
The third contribution reveals the differences between resource integration and resource reconfiguration in emerging industries. In emerging industries, companies will encounter enormous risk in business investment and operating decisions, and organizational learning is of great significance. Meanwhile, resource integration brings about positive influence on sustainable competitive advantages. Hence, theory fracture of “organizing learning–resource integration–sustainable competitive advantages” can be drawn. However, there is an inverted U-shaped relationship between resource reconfiguration and SCAs, which produced some differences and distinctiveness. Resource reconfiguration is not suitable for long-term implementation in the organization due to the impact and limitation caused by the emerging industries. Appropriate amendment of the resource is acceptable by the organization but over adjustment will bring vulnerability to the new resource structure. Consequently, the negative side of resource structure and organizational routines leads to the invalidation of new resource structures. In emerging industries, if resource integration and resource reconfiguration are launched at the same time, a positive effect would not be achieved on SCAs, the positive effect of resource integration will be neutralised.
5.2. Managerial Contributions
Combined with the research result, practical meanings are produced as the following.
First of all, through the research on the derivation mechanisms of resource integration and resource reconfiguration, the findings reveal that organising study affects these two elements positively, which is essential for resource management. Managers need to manage resources from both sides, namely exploratory learning and exploitative learning, including exploring and digging precious resources actively and discovering the potential information and trends, especially through the processes of exploring, absorbing, transferring, and utilising knowledge. Furthermore, managers should focus on the evolution of the knowledge during organising, which impacts the formation and results of resource integration and resource reconfiguration directly.
Second, the research unveils the impact of resource integration and resource reconfiguration on SCAs in traditional industries, finding that there is the “concerto effect” between them. This conclusion encourages managers of the enterprises to implement resource integration and resource reconfiguration actively in traditional industries, including recognising and obtaining the resource, allocating and utilising the resource effectively, and attempting to upgrade the resource structure such as incremental upgrading and radical upgrading.
Finally, the result discloses that instead of over resource reconfiguration, resource integration plays a more important basic role in enterprises due to the high dynamics of the market in emerging industries such as artificial intelligence and the internet of things. In such a situation, the relationship between resource reconfiguration and SCAs is a non-linear inverted U-shaped relationship, and the “concerto effect” between resource integration and resource reconfiguration is neutralised. At this time, companies should continue to learn and accumulate new knowledge to form a resource library in case of need. However, the existing resource structure should not be changed rashly in that the upgrade at this time is built on an uncertain analysis. Therefore, wait and see prudently is what a wise man should do.
6. Conclusions
Unlike previous resource management theory that pays more attention to the development of diversified resource management methods and how to improve the efficiency of resource allocation, this study emphasizes that there may be differences and conflicts among different resource management methods, and the interaction effect between different resource management methods is decisively affected by the external environment (such as the industry). Based on the theories of RBV, organizational learning and industry analysis, this paper systematically reveals the derivative sources and essential differences between the two resource management methods (resource integration and resource reconfiguration), and explores the impact of the two resource management methods on SCAs under different industries. The conclusion shows that both resource integration and resource reconfiguration are the results of organizational learning, but the two resource management methods have different impacts on SCAs in different industries. This paper expands the applied boundaries of RBV theory in different industries and provides a new understanding of the combination of organizational learning theory and resource management theory.
Our research has clarified the differences between the two approaches of resource management and provides the conclusion and improvement in applying these two management theories in different situations, but there remains some limitations. First, we selected resource integration and resource reconfiguration as the research variables, though the core position of these two resource management approaches has been acknowledged in existing literature, other management approaches of resource management should be the chief object of study in the future. Second, the data we chose were limited in a narrow range of China and cannot represent all countries in the world, though artificial intelligence and internet of things have been developed prosperously in China and possesses many typical characteristics. A broader range of data should be collected to ratify the effectiveness of the experiment. At last, SCA is the dependable variable in this study which is a portrait and long-term competitive advantage, but its short-term advantage may also be demonstrated in different resource management approaches. Researching on the impact of different resource management approaches on long-term and short-term advantages can make up for the deficiencies of this study, and it is also an essential direction in the future research.
Author Contributions
H.M. and Q.S. proposed the conceptualization of this study and wrote the paper. Y.G. and Y.G. used the methodology and revised the paper.
Funding
This research was funded by the China Natural Science Foundation (71672072, 71602016), Science Foundation of Ministry of Education of China (16YJC630025), the China Postdoctoral Science Foundation (2018T110260, 2018T110227), the Liaoning S&T Project (20170520262), and the Liaoning Social Science Planning Fund Project (L17CJL005).
Conflicts of Interest
The authors declare no conflict of interest.
References
- Prud’homme, D. Dynamics of China’s provincial-level specialization in strategic emerging industries. Res. Policy 2016, 45, 1586–1603. [Google Scholar] [CrossRef]
- Huang, K.C.; Hu, T.S.; Wang, J.Y.; Chen, K.C.; Lo, H.M. From fashion product industries to fashion: Upgrading trends in traditional industry in Taiwan. Eur. Plan. Stud. 2016, 24, 762–787. [Google Scholar] [CrossRef]
- Abadi, S.; Huda, M.; Hehsan, A.; Mohamad, A.M. Design of online transaction model on traditional industry in order to increase turnover and benefits. Int. J. Eng. Technol. 2018, 7, 231–237. [Google Scholar]
- Forbes, D.P.; Kirsch, D.A. The study of emerging industries: Recognizing and responding to some central problems. J. Bus. Ventur. 2011, 26, 589–602. [Google Scholar] [CrossRef]
- Guillen, M.F. Business groups in emerging economies: A resource-based view. Acad. Manag. J. 2000, 43, 362–380. [Google Scholar]
- Hart, S.L. A natural-resource-based view of the firm. Acad. Manag. Rev. 1995, 20, 986–1014. [Google Scholar] [CrossRef]
- Bergman, M.M.; Bergman, Z.; Berger, L. An empirical exploration, typology, and definition of corporate sustainability. Sustainability 2017, 9, 753. [Google Scholar] [CrossRef]
- Porter, M.E. Industry structure and competitive strategy: Keys to profitability. Financ. Anal. J. 1980, 30–41. [Google Scholar] [CrossRef]
- Reuter, C.; Foerstl, K.A.I.; Hartmann, E.V.I.; Blome, C. Sustainable global supplier management: The role of dynamic capabilities in achieving competitive advantage. J. Supply Chain Manag. 2010, 46, 45–63. [Google Scholar] [CrossRef]
- Fonseca, L.M. ISO 9001 quality management systems through the lens of organizational culture. Calitatea 2015, 16, 54–59. [Google Scholar]
- Hitt, M.A.; Dacin, M.T.; Levitas, E. Partner selection in emerging and developed market contexts: Resource-based and organizational learning perspectives. Acad. Manag. J. 2000, 43, 449–467. [Google Scholar]
- Wernerfelt, B. A resource-based view of the firm. Strateg. Manag. J. 1984, 5, 171–180. [Google Scholar] [CrossRef]
- Barney, J. Firm resources and sustained competitive advantage. J. Manag. 1991, 17, 99–120. [Google Scholar] [CrossRef]
- Dranove, D.; Peteraf, M.; Shanley, M. Do strategic groups exist? An economic framework for analysis. Strateg. Manag. J. 1998, 19, 1029–1044. [Google Scholar] [CrossRef]
- Grimm, C.M.; Smith, K.G. Strategy as Action: Industry Rivalry and Coordination; South-Western College Pub.: Nashville, TN, USA, 1997. [Google Scholar]
- Halawi, L.A.; Aronson, J.E.; McCarthy, R.V. Resource-based view of knowledge management for competitive advantage. Electron. J. Knowl. Manag. 2005, 3, 75. [Google Scholar]
- Hesterly, B.; Barney, J. Strategic Management and Competitive Advantage; Pearson Prentice Hall: Upper Saddle River, NJ, USA, 2008. [Google Scholar]
- Maury, B. Sustainable competitive advantage and profitability persistence: Sources versus outcomes for assessing advantage. J. Bus. Res. 2018, 84, 100–113. [Google Scholar] [CrossRef]
- Hofer, C.W.; Schendel, D. Strategy Formulation: Analytical Concepts; West Publ.: Eagan, MN, USA, 1978. [Google Scholar]
- Distanont, A.; Khongmalai, O. The role of innovation in creating a competitive advantage. Kasetsart J. Soc. Sci. 2018, 7, 9. [Google Scholar] [CrossRef]
- Davcik, N.S.; Sharma, P. Marketing resources, performance, and competitive advantage: A review and future research directions. J. Bus. Res. 2016, 69, 5547–5552. [Google Scholar] [CrossRef]
- Kozlenkova, I.V.; Samaha, S.A.; Palmatier, R.W. Resource-based theory in marketing. J. Acad. Market. Sci. 2014, 42, 1–21. [Google Scholar] [CrossRef]
- Oliver, C. Sustainable competitive advantage: Combining institutional and resource-based views. Strateg. Manag. J. 1997, 18, 697–713. [Google Scholar] [CrossRef]
- Argote, L. Organizational learning research: Past, present and future. Manag. Learn. 2011, 42, 439–446. [Google Scholar] [CrossRef]
- Jiménez-Jiménez, D.; Sanz-Valle, R. Innovation, organizational learning, and performance. J. Bus. Res. 2011, 64, 408–417. [Google Scholar] [CrossRef]
- March, J.G. Exploratory and exploitative in organizational learning. Organ. Sci. 1991, 2, 71–87. [Google Scholar] [CrossRef]
- Yannopoulos, P.; Auh, S.; Menguc, B. Achieving fit between learning and market orientation: Implications for new product performance. J. Prod. Innov. Manag. 2012, 29, 531–545. [Google Scholar] [CrossRef]
- Yang, J.; Liu, H.; Gao, S.; Li, Y. Technological innovation of firms in China: Past, present, and future. Asia Pacific. J. Manag. 2012, 29, 819–840. [Google Scholar]
- Li, Y.; Chen, H.; Liu, Y.; Peng, M. Managerial ties, organizational learning, and opportunity capture: A social capital perspective. Asia Pacific. J. Manag. 2014, 31, 271–291. [Google Scholar] [CrossRef]
- Fonseca, L.; Ramos, A.; Rosa, Á.; Braga, A.C.; Sampaio, P. Stakeholder satisfaction and sustainable success. In Proceedings of the International Conference on Business Sustainability, Póvoa de Varzim, Portugal, 22–24 June 2011; pp. 1–4. [Google Scholar]
- Niebles, J.C.; Wang, H.; Li, F.-F. Unsupervised learning of human action categories using spatial-temporal words. Int. J. Comput. Vis. 2008, 79, 299–318. [Google Scholar] [CrossRef]
- Vargo, S.L.; Akaka, M.A. Value cocreation and service systems (re) formation: A service ecosystems view. Serv. Sci. 2012, 4, 207–217. [Google Scholar] [CrossRef]
- Lusch, R.F.; Vargo, S.L. Service-Dominant Logic: Premises, Perspectives, Possibilities; Cambridge University Press: Cambridge, UK, 2014. [Google Scholar]
- Hung, R.Y.Y.; Lien, B.Y.H.; Yang, B.; Wu, C.; Kuo, Y. Impact of TQM and organizational learning on innovation performance in the high-tech industry. Int. Bus. Rev. 2011, 20, 213–225. [Google Scholar] [CrossRef]
- Kim, N.; Atuahene-Gima, K. Using exploratory and exploitative market learning for new product development. J. Prod. Innov. Manag. 2010, 27, 519–536. [Google Scholar] [CrossRef]
- Capron, L.; Mitchell, W. Selection capability: How capability gaps and internal social frictions affect internal and external strategic renewal. Organ. Sci. 2009, 20, 294–312. [Google Scholar] [CrossRef]
- Vidal, E.; Mitchell, W. Adding by subtracting: The relationship between performance feedback and resource reconfiguration through divestitures. Organ. Sci. 2015, 26, 1101–1118. [Google Scholar] [CrossRef]
- Pentland, B.T.; Feldman, M.S. Organizational routines as a unit of analysis. Industrial and Corporate Change. 2005, 14, 793–815. [Google Scholar] [CrossRef]
- Short, J.C.; Ketchen, D.J., Jr.; Shook, C.L.; Ireland, D. The concept of “opportunity” in entrepreneurship research: Past accomplishments and future challenges. J. Manag. 2010, 36, 40–65. [Google Scholar] [CrossRef]
- Lichtenthaler, U.; Ernst, H.; Hoegl, M. Not-sold-here: How attitudes influence external knowledge exploitative. Organ. Sci. 2010, 21, 1054–1071. [Google Scholar] [CrossRef]
- Maes, J.; Sels, L. SMEs’ radical product innovation: The role of internally and externally oriented knowledge capabilities. J. Small Bus. Manag. 2014, 52, 141–163. [Google Scholar] [CrossRef]
- Zollo, M.; Winter, S.G. Deliberate learning and the evolution of dynamic capabilities. Organ. Sci. 2002, 13, 339–351. [Google Scholar] [CrossRef]
- Argote, L.; Miron-Spektor, E. Organizational learning: From experience to knowledge. Organ. Sci. 2011, 22, 1123–1137. [Google Scholar] [CrossRef]
- May, R.C.; Stewart, W.H., Jr.; Sweo, R. Environmental scanning behavior in a transitional economy: Evidence from Russia. Acad. Manag. J. 2000, 43, 403–427. [Google Scholar]
- Czarnitzki, D.; Toole, A.A. Patent protection, market uncertainty, and R&D investment. Rev. Econ. Stat. 2011, 93, 147–159. [Google Scholar]
- Swink, M.; Narasimhan, R.; Wang, C. Managing beyond the factory walls: Effects of four types of strategic integration on manufacturing plant performance. J. Oper. Manag. 2007, 25, 148–164. [Google Scholar] [CrossRef]
- Flynn, B.B.; Huo, B.; Zhao, X. The impact of supply chain integration on performance: A contingency and configuration approach. J. Oper. Manag. 2010, 28, 58–71. [Google Scholar] [CrossRef]
- Pisano, G.P. Knowledge, integration, and the locus of learning: An empirical analysis of process development. Strateg. Manag. J. 1994, 15, 85–100. [Google Scholar] [CrossRef]
- Fredrickson, J.W. The comprehensiveness of strategic decision processes: Extension, observations, future directions. Acad. Manag. J. 1984, 27, 445–467. [Google Scholar]
- Ge, B.S.; Yang, Y.B.; Jiang, D.K.; Gao, Y.; Du, X.M.; Zhou, T.T. An Empirical Study on Green Innovation Strategy and Sustainable Competitive Advantages: Path and Boundary. Sustainability 2018, 10, 3631. [Google Scholar] [CrossRef]
- Gao, Y.; Ge, B.S.; Lang, X.X.; Xu, X.B. Impacts of proactive orientation and entrepreneurial strategy on entrepreneurial performance: An empirical research. Technol. Forecast. Soc. Chang. 2018, 135, 178–187. [Google Scholar] [CrossRef]
- Teece, D.J.; Pisano, G.; Shuen, A. Dynamic capabilities and strategic management. Strateg. Manag. J. 1997, 18, 509–533. [Google Scholar] [CrossRef]
- Wu, L.Y. Applicability of the resource-based and dynamic-capability views under environmental volatility. J. Bus. Res. 2010, 63, 27–31. [Google Scholar] [CrossRef]
- Wuebker, R.; Hampl, N.; Wuestenhagen, R. The strength of strong ties in an emerging industry: Experimental evidence of the effects of status hierarchies and personal ties in venture capitalist decision making. Strateg. Entrepreneurship J. 2015, 9, 167–187. [Google Scholar] [CrossRef]
- Eisenhardt, K.M.; Martin, J.A. Dynamic capabilities: What are they? Strateg. Manag. J. 2000, 21, 1105–1121. [Google Scholar] [CrossRef]
- Jabłoński, A.; Jabłoński, M. Research on business models in their life cycle. Sustainability 2016, 8, 430. [Google Scholar] [CrossRef]
- Ambrosini, V.; Bowman, C. What are dynamic capabilities and are they usefulconstructs in strategic management? Int. J. Manag. Rev. 2009, 11, 29–49. [Google Scholar] [CrossRef]
- Armstrong, J.; Overton, T.S. Estimating nonresponse bias in mail surveys. J. Market. 1997, 14, 396–402. [Google Scholar] [CrossRef]
- Hair, J.F.; Anderson, R.E.; Tatham, R.L.; Black, W.C. Multivariate Data Analysis; Prentice Hall International: Upper Saddle River, NJ, USA, 1999. [Google Scholar]
- Ge, B.S.; Jiang, D.K.; Gao, Y.; Tsai, S.B. The influence of legitimacy on a proactive green orientation and green performance: A study based on transitional economy scenarios in china. Sustainability 2016, 8, 1344. [Google Scholar] [CrossRef]
- Atuahene-Gima, K.; Murray, J.Y. Exploratory and exploitative learning in new product development: A social capital perspective on new technology ventures in China. J. Int. Market. 2007, 15, 1–29. [Google Scholar] [CrossRef]
- Wiklund, J.; Shepherd, D.A. The effectiveness of alliances and acquisitions: The role of resource combination activities. Entrepreneurship Theory Pract. 2009, 33, 193–212. [Google Scholar] [CrossRef]
- Feldman, M.S.; Pentland, B.T. Reconceptualizing organizational routines as a source of flexibility and change. Adm. Sci. Q. 2003, 48, 94–118. [Google Scholar] [CrossRef]
- Miller, K.D.; Pentland, B.T.; Choi, S. Dynamics of performing and remembering organizational routines. J. Manag. Stud. 2012, 49, 1536–1558. [Google Scholar] [CrossRef]
- Barrales-Molina, V.; Montes, F.J.L.; Gutierrez-Gutierrez, L.J. Dynamic capabilities, human resources and operating routines: A new product development approach. Ind. Manag. Data Syst. 2015, 115, 1388–1411. [Google Scholar] [CrossRef]
- Cohen, P.; West, S.G.; Aiken, L.S. Applied Multiple Regression/Correlation Analysis for the Behavioral Sciences; Psychology Press: New York, USA, 2014. [Google Scholar]


© 2019 by the authors. Licensee MDPI, Basel, Switzerland. This article is an open access article distributed under the terms and conditions of the Creative Commons Attribution (CC BY) license (http://creativecommons.org/licenses/by/4.0/).