1. Introduction
Countries around the globe are taking steps towards increasing energy efficiency. Both countries and utility companies are implementing policies, incentives, tax benefits/credits and rebates for the installation of energy efficiency upgrades and renewable energy schemes for both existing buildings and new construction. The energy consumption in heating, ventilating, and air-conditioning (HVAC) systems have become a growing concern. They consist over 50% of the energy consumption in office buildings in the US [
1]. About 66.3% of the US and 75% of EU (European Union) buildings were constructed before 1990 [
2,
3]. Designers and constructors are now required to initiate energy retrofits in order to enhance the existing buildings’ energy performance as well as their operation costs [
4]. According to the US Department of Energy (D.O.E), an energy efficiency tax deduction is available throughout the US for commercial building [
5]. Ding et al. proposed that improvements in energy efficiency and reductions in emissions could be achieved by implementing optimized retrofit on HVAC systems [
6]. Energy modeling software programs have been receiving attention to predict energy efficiency improvements. It is now accepted by the building industry as a viable means to understand the energy consumption and performance of buildings. Many engineering firms and energy service companies (ESCO’s) are considering energy models as deliverables for projects. Energy modeling is even being recognized by government agencies as a legitimate source of information for tax credits [
7], (e.g.,: Energy Policy Act of 2005 (EPACT) [
8], Property Assessed Clean Energy Programs (PACE)).
There are various energy modeling programs available today which are universally accepted and qualified by the DOE [
9]: eQuest, Design Builder, EnergyPlus and Hourly Analysis Program (HAP). One of the most powerful software programs is eQuest, an energy modeling program freely available through the US DOE. A simple energy simulation using the ‘schematic design wizard’ can be completed in eQuest in just a few minutes while more complex simulation models using the ‘design development wizard’ can take a few hours to complete.
There has been a number of simulation studies done by the researchers in the field of energy modeling. Zhu [
10] compared the use of eQuest energy models with the Energy Star standards to study various energy-saving measures (ECMs) on building energy consumption conditions. Ke et al. [
11] studied the “Energy-Saving Performance Contract (ESPC) of an office building by applying International Performance Measurement and Verification Protocol (IPMVP) Option D (Calibrated Simulation) in combination with the energy analysis model established for the building by eQuest simulation software”. Kim et al. [
12] used data mining to analyze the original building’s baseline energy consumption and compared 12 HVAC options using eQuest by changing design parameters such as the walls, roof, airside and waterside system definitions and orientation of the building. All aforementioned studies concluded that the HVAC system has the highest effect on the energy consumption, while the building orientation has the lowest effect.
Other studies have used simulation software to provide additional insights regarding factors that directly affect energy efficiency. Yu et al. [
13] used eQuest to study the effects of the building envelope, the exterior wall R (insulation) value and glass types on residential building energy use. They concluded that the building envelope can lead to energy savings of up to 12%. Song et al. [
14] conducted the “Simulation and analysis of a university library energy consumption based on eQuest” and determined that the HVAC consumed the most energy in a library at 49% of the total energy, followed by lighting, which consumes approximately 15% of the energy. Xing et al. explored new energy retrofit solutions and used eQuest to model a hotel building in Tianjin, China [
15]. After the modeling and retrofit installation, post-implementation monitoring indicated that the calibrated eQuest model built was highly accurate. Kim et al. [
16] studied the effects of exterior shading on building energy consumption using eQuest with IES_VE (Integrated Environmental Solution_Virtual Environment) energy analysis programming. Yu et al. [
17] used Trane TRACE600 software to study the energy saving potential of 20 ECMs for a commercial building in China. Li et al. [
18] studied the effects of solar film and lighting controls on an office building and concluded that the ECMs reduced lighting energy consumption by 21.2% and reduced HVAC energy consumption by 6.9%. Neto et al. [
19] utilized EnergyPlus as a modeling tool to produce a model for an office building. Pan et al. [
20] first built a baseline model with eQuest, calibrated the model and then modified it to evaluate the energy efficiency measures (EEMs). Pedrini et al. [
21] researched the calibration of models for about 15 office buildings. The results of calibration found that building operation schedules have the highest effect on the precision of the energy models.
Joo et al. [
22] analyzed fan energy saving in a dual-duct system by using a variable speed drive for the supply fan. They achieved 35% in energy savings by replacing a conventional single-fan, dual-duct constant air volume system with the variable speed fan system. Joo and Liu [
23] in a study titled “Performance analysis of dual-fan, dual-duct constant volume air-handling units” developed analytical models to compare the energy consumption of the dual fan dual duct with the single fan dual duct; they concluded that the dual-fan dual-duct system comparatively uses less energy in winter but more energy in the summer for cooling. Liu and Claidge [
24] investigated dual-duct constant-volume to single-duct variable-volume systems just for summer operation using hot air damper. They applied their findings to a five-story building in Austin, Texas and obtained 41% in energy savings. Dong et al. [
25] showed reductions of 39.7% in electricity and 80.6% in gas utility costs by installing variable frequency drives on supply and return air fans and converting constant air volume to a variable air volume system.
From the papers cited, it is obvious that many researchers have used analytical methods and simulation software for various energy conservation measures (ECMs) to quantify buildings’ energy performance. However, there is less research on the full building HVAC system, and we are not aware of any that compares the dual-fan dual-duct (DFDD) systems to single-duct variable air volume (VAV) systems. In general, many old buildings in the United States have DFDD systems that are in need of complete replacement or retrofit. Dual-duct systems are often found in buildings constructed during the 1960s and 1970s. They are a relatively effective means of maintaining comfort, yet an extremely inefficient method of conditioning air [
26]. Not only do DFDD systems have poor energy performance, but they also require high levels of maintenance and associated costs. Today, DFDDs are no longer popular.
The rationale and the scope behind this research is to create a comparative study between the various options available to increase energy efficiency of buildings on the Indiana University Purdue University—Indianapolis campus which have DFDD systems. This research will help facility managers/engineers know the energy saving potentials of retrofitting DFDD systems.
2. Building Overview, Current HVAC system
The building under study is mostly office spaces. Building construction was completed in 1976. The current HVAC system was commissioned that same year. The building has six floors with a basement. Windows are very limited with only two small windows per floor and at the front entrance. The area distribution of the seven floors is given in
Table 1.
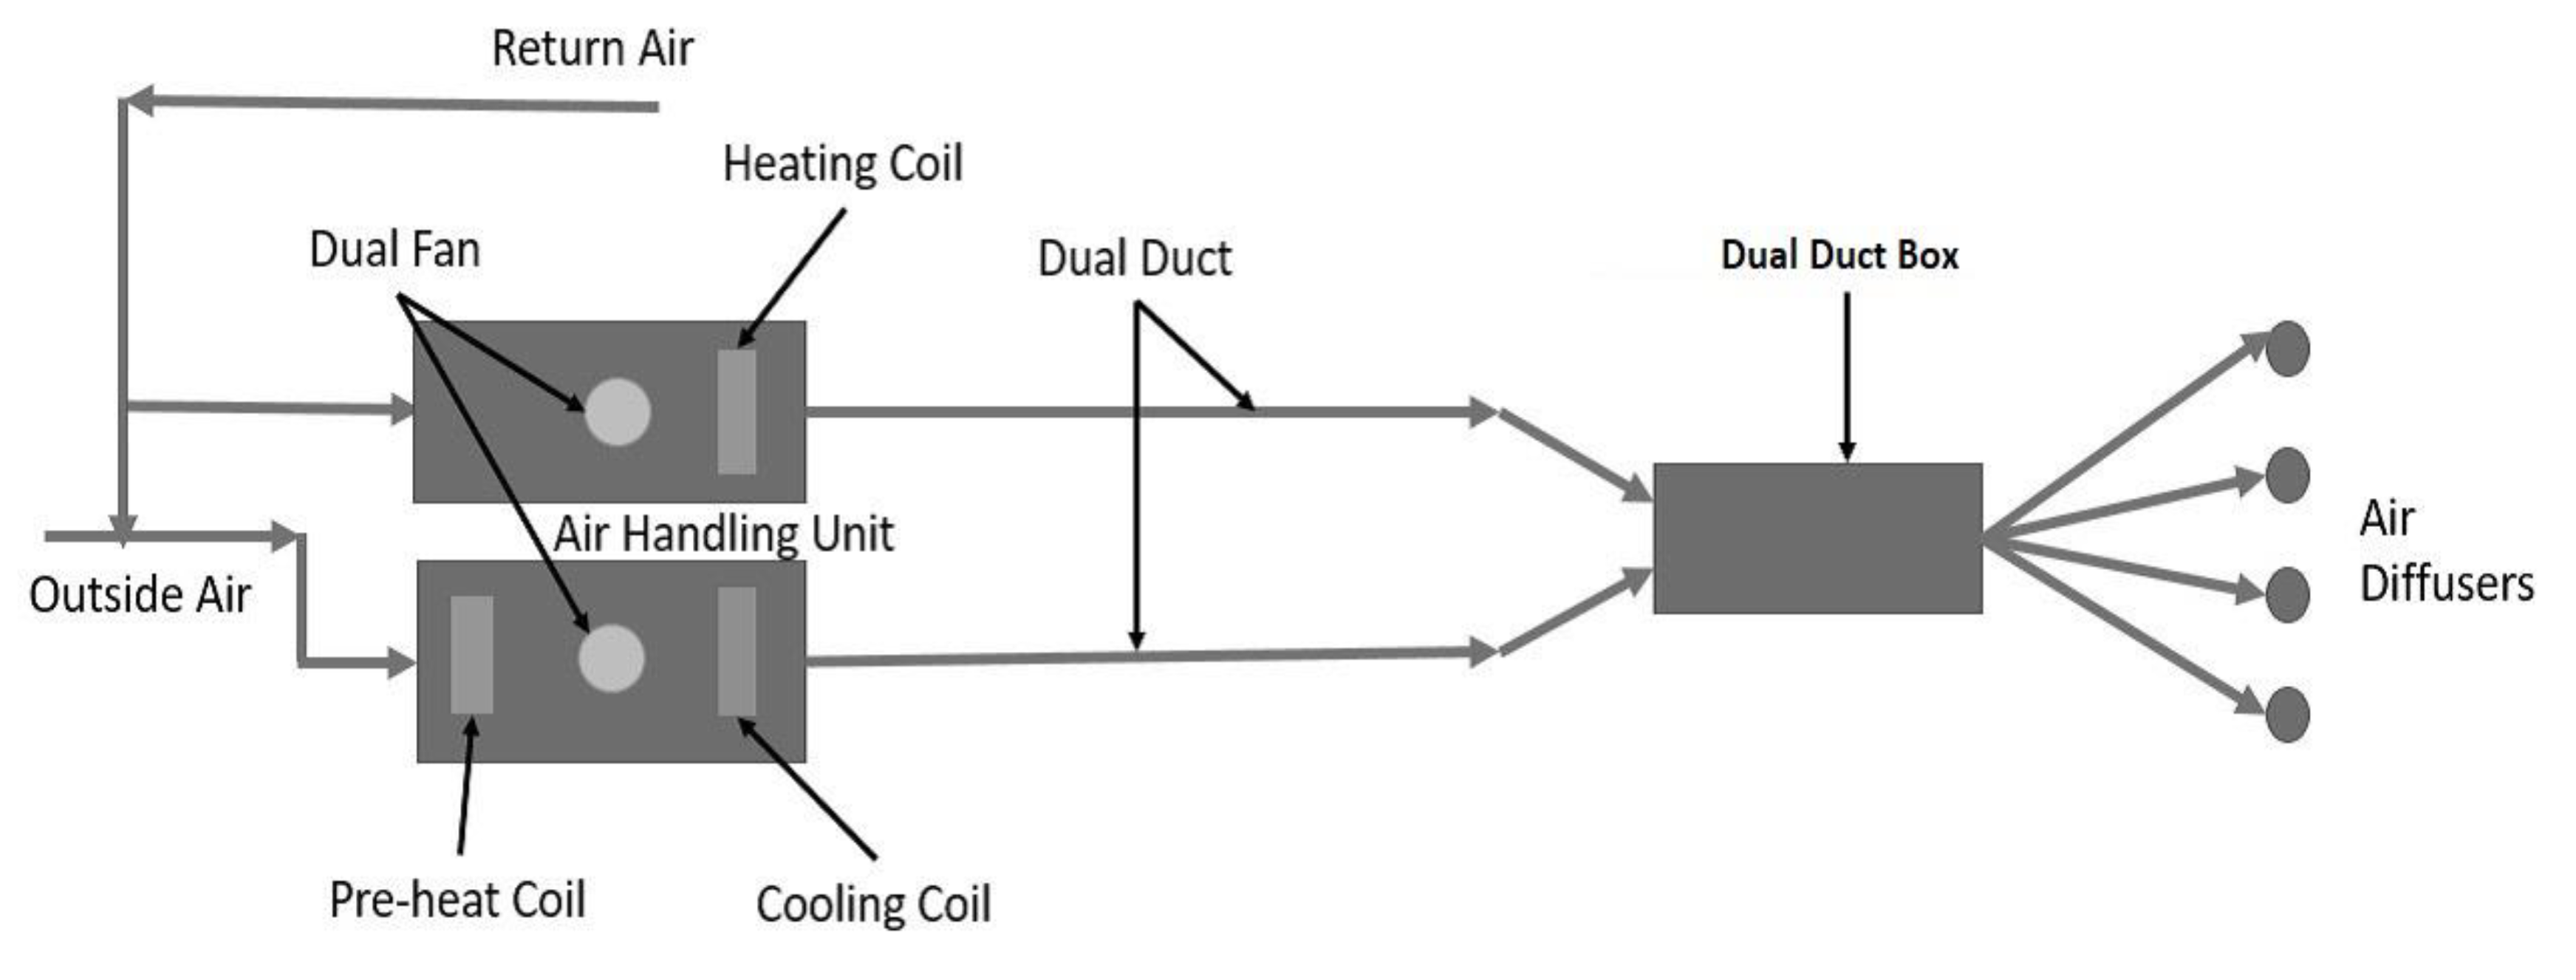
The current HVAC system is a DFDD with electric heating and has multiple maintenance issues. A DFDD has two supply ducts running to each conditioned space. One duct supplies cold air and the other supplies warm air. Air from both ducts is blended in a mixing box to provide air at a desired temperature to the conditioned space. A generic diagram of a DFDD system is shown in
Figure 1. The building has thermostats, which are not programmable. The orientation of the building entrance is south. The building has an addition on the east side, which has a new HVAC system. For modeling purposes, however, only the original building with DFDD is considered. The zones of the old building and the addition are separate.
Dual-duct systems, in general, require more ductwork and dampers, and therefore occupy more space. One of the most problematic issues with dual-duct systems is that a volume of air much larger than that required by the building, must be cooled, heated, and circulated. DFDD systems tend to be noisier since the noise and vibration associated with the air passing over the mixing dampers are directly above the conditioned space [
23]. In addition, the dampers in dual-duct mixing boxes frequently leak, even when they are supposed to be fully closed. During cooling operation, the leakage of the warm duct increases the required energy for conditioning the space. The leakage is a function of construction quality and of the duct static pressure. Leakage ratios vary between roughly 3 percent and 20 percent, which is higher than single-duct systems [
23].
Because health professionals are present around the clock, the building is set to be always occupied in all design considerations. To have a comparative study of this building with similar buildings across the US, the electric energy utilization index (EUI) for the building was calculated using ENERGY STAR Portfolio Manager [
27]. The ENERGY STAR score of the building was found to be 39. The site electric EUI was found to be 133.4 kBtu/ft
2, while the US average with similar office occupancy and conditions is 44.4 kBtu/ft2. Thus, the energy consumption of the building was very high, indicating a need to lower the energy consumption.
Table 2 shows the average local area utility prices used for analysis.
3. Energy Modeling Inputs
The building model was defined in eQuest using the exact rectangular shape of the physical building, and the zoning method considered for the program was ‘Perimeter and Core’.
Table 3 represents the designed parameters provided by the facility manager and used for the modeling. The HVAC system type defined for the baseline was ‘Dual Duct Air Handler with Electric Heating’ with the cooling source as chilled water and heating source as electric resistance. The whole building’s 3-D model was generated using eQuest, as shown in
Figure 2. Other important parameters defined in the current system are two fans (cooling fan, heating fan) for the two ducts, along with the return duct as present in the building. The DFDD system defined in the program is illustrated in
Figure 3. The utility provider provides the chilled water for the current DFDD system.
After obtaining the results from the baseline model, the first EEM model was developed for the current DFDD system: steam coils replaced electric heat. All other building parameters were kept the same as the baseline, and there were no changes to the airside system. Utility-provided steam was considered as the steam source rather than a dedicated steam boiler, per university standard.
The second EEM was to replace the whole DFDD system with the single-duct variable air volume (SD-VAV) system, which utilizes electric reheat and chilled water cooling. DFDD systems have considerable issues, ranging from poor energy performance and high maintenance requirements to noise and vibration issues, while SD-VAVs have been proven to have much fewer of these issues. Lio and Claridge [
24] proposed that dual-duct constant volume systems can be converted to single-duct VAV systems for summer operation in order to enhance the overall system efficiency and saving.
The building envelope and all parameters like occupancy schedule and controls were kept the same as the previous model. Only the HVAC system was changed. A modeling circuit diagram of the proposed single-duct with electric heat and reheat system is given in
Figure 4.
4. Results
After modeling and simulation of the first baseline DFDD system, the monthly electric and chilled water consumption results were obtained as shown in
Figure 5 and
Figure 6.
Figure 5 provides a profile that indicates that the heating KWh reduces during the summer months and increases during the winter season. Note also that there is energy consumption for heating even in the summer since a system requirement of a DFDD system is that the electric heaters are not turned off.
The electric utility consumption data was collected to verify the results of the baseline model. The data for two years (2016 and 2017) was available and is represented in
Figure 7 and
Figure 8. The electric EUI for the year 2016 was 133.3 kBtu/sf/yr, while the electric EUI for 2017 was 130.1 kBtu/sf/yr.
Furthermore, the modeling and simulation of the first EEM (current DFDD with steam coils) were executed and the monthly electric and chilled water consumption were obtained as given in
Figure 9 and
Figure 10. These results indicate that overall electric energy consumption reduces as compared to baseline; however, the system requirement of the DFDD system still results in some summertime steam consumption.
The second EEM (SD-VAV with chilled water and electric reheat) modeling and simulation were also executed. The monthly electricity and chilled water consumption results are given in
Figure 11 and
Figure 12, which indicate that electricity consumption reduces further and there is a drop in the chilled water consumption.
5. Discussion
The yearly comparison of the electrical consumption data for two consecutive years and the baseline model data show a variation of 10% in 2016 and 12% in 2017.
Table 4 depicts the annual comparison between the model and the actual electric data.
Based on the utility prices defined in the program, the annual utility cost was obtained and the results are shown in
Figure 13.
DFDD with chilled water and steam heating has electrical savings of 55% and no chilled water savings with an 18% total yearly cost savings. On the other hand, single-duct VAV with chilled water and electric reheat has electrical savings of 49% and chilled water savings of 39% with a 28% total reduction. The comparative summary of electricity, chilled water and total savings for all three models are given in
Table 5. The electricity cost savings are the highest in model 2, but the overall cost savings are the highest with model 3.
The results in
Table 4 were based on the economic analysis, which does not indicate which model is more energy efficient. Further analysis was performed by comparing the complete building Energy Usage Index (EUI) and the energy cost index (ECI), shown in
Table 6.
The site EUI of the 3rd EEM drops from 219.74 kBtu/sf/yr to 119.69 kBtu/sf/yr, while the ECI drops from 2.35 $/sf/yr to 1.69 $/sf/yr. Model 2 is less energy efficient than the baseline but is better economically, while model 3 is better in terms of both money and energy savings.
6. Conclusions
The building under study was a 41-year-old office building with the DFDD system. This analysis determined that the building consumes more energy per ft. sq. than the national average for a similar building type. The electric EUI of the building is 133.4 kBtu/ft2, while the US average is 44.4 kBtu/ft2. In addition, an ENERGY STAR score of 39 is allocated to this building. The difference between the model and the actual energy consumption is 10%‒12%, which was due to the uncertain schedule of the building occupancy, plug loads, lighting, and weather conditions. Furthermore, the exact geometry and significant level of detail modeling were not easily captured using e-QUEST software.
Based on a comparative study of all models, the third model, EEM with the single-duct VAV was the most energy efficient system with a 28% utility cost saving. Moreover, it was interesting to observe that the second EEM did not save energy but did reduce annual utility costs by 18%, as it takes advantage of utility prices in the area. The third EEM, on the other hand, saves energy and utility charges. However, this study was focused on energy consumption and the authors did not consider the capital and maintenance costs of each option due to lack of access to accurate figures. Therefore, recommendation was given to facility services to move to upgrade the current DFDD system to the single-duct VAV System in terms of capital cost and its payback period.


