Review

Building Regional Sustainable Development Scenarios with the SSP Framework

1
School of Systems Science, Beijing Normal University, Beijing 100875, China
2
School of Mathematics and Statistics, University College Dublin, Dublin, Ireland
*
Author to whom correspondence should be addressed.
Sustainability 2019, 11(20), 5712; https://doi.org/10.3390/su11205712
Submission received: 24 August 2019 / Revised: 7 October 2019 / Accepted: 11 October 2019 / Published: 16 October 2019
(This article belongs to the Section Sustainability in Geographic Science)

Abstract

:
Climate change is having an increasing effect on human society and ecosystems. The United Nations has established 17 sustainable development goals, one of which is to cope with climate change. How to scientifically explore uncertainties and hazards brought about by climate change in the future is crucial. The new Intergovernmental Panel on Climate Change (IPCC) has proposed shared socioeconomic pathways (SSPs) to project climate change scenarios. SSP has been analyzed globally, but how regions and nations respond to the global climate change and mitigation policies is seldom explored, which do not meet the demand for regional environmental assessment and social sustainable development. Therefore, in this paper, we reviewed and discussed how SSPs were applied to regions, and this can be summarized into four main categories: (1) integrated assessment model (IAM) scenario analysis, (2) SSPs-RCPs-SPAs framework scenario analysis, (3) downscaling global impact assessment model, and (4) regional impact assessment model simulation. The study provides alternative ways to project land use, water resource, energy, and ecosystem service in regions, which can carry out related policies and actions to address climate change in advance and help achieve sustainable development.

1. Introduction

To improve human conditions and develop a sustainable blueprint for the future, the United Nations proposed 17 sustainable development goals, including implementing urgent measures to address climate change and its impacts [1]. Global warming affects every country and region, resulting in heavy losses to regional development; therefore, strengthening regional resilience to climate uncertainties and threats is key to responding to climate change and regional sustainable development [2,3]. The Paris Agreement has set a temperature goal where the global average temperature would increase to well below 2 °C and tries to limit this increase to 1.5 °C above pre-industrial levels [4], which is a positive response to climate change. The Paris Agreement also promotes a series of policies to address climate change impacts, adaptation, and mitigation [5]. The key to controlling global temperature is to restrict the emissions of greenhouse gases. Limiting high-emissions facilities can increase the rate of reaching the 1.5–2 °C global temperature goal [6]. However, the previous SA90, SRES [7] and other scenarios have only considered temperature, precipitation, and energy structure [8], which do not completely reflect the greenhouse gas concentration target set by the UNFCC nor the impact of social factors in global warming [9]. From climate change impacts, adaptation, and mitigation, considering the 1.5–2 °C global temperature goal and social economic factors, the IPCC has identified five shared socioeconomic pathways about social sustainable development scenarios in the future [10].
The SSPs link the CO2 concentration target and societal economic development, which includes population, GDP, urbanization, and other socio-economic indicators. To satisfy the need for policies and quantitative analysis [11], the SSPs include seven complex indicator systems, including human and resource indicators, economic development, human development, technology, lifestyle, natural resource, and government policy [10]. In addition to population and GDP, the SSPs add the human development index to analyze adaptation, mitigation and vulnerability, especially for agriculture, land use, and water resources. Combining with SDGs [12,13], SSP is an important analysis tool for sustainable development (Figure 1).
The seven indicator systems of the scenarios were divided into five pathways: sustainable development pathway (SSP1), middle of the road (SSP2), regional rivalry road (SSP3), inequality road (SSP4), and fossil-fuel development road (SSP5) [14]. Each pathway has specific indicators and associated narratives in Table 1 [7,10,15].
SSPs are designed based on a global development framework [16]. They have been widely used on the global scale to project social and climate scenarios [17,18,19,20,21], such as with the global hydrological model to project water availability and scarcity [17], with the global nutrient model to project nitrogen in waste water [22], and with CMIPs data to project flooding [18], which got a good result for comprehending future uncertainties. However, regional policies may enhance, weaken, or even offset the impact of global climate change in a region. Therefore, for regional vulnerability and adaptability, it is necessary to downscale to a regional scale to analyze the local effects and respond to climate change [23,24,25]. The scenario descriptions and variables of the SSP framework can be tailored to local circumstances.
However, applying SSPs from the global to regional level involves many difficulties and challenges related to the following four factors: (1) SSPs, RCPs and some climate data are generally at the global scale with low spatial resolution. These data need to be downscaled to the regional scale because of local differences and diversity [9]. (2) The variables and data of regional impact assessment models need bias correction to make them more suitable to the local situation which needs to collect lots of historical data and other relative climate data, but some data are missing [18]. (3) Formulating regional climate policies needs to consider global temperature goals and stakeholders [18,25,26,27,28]. If policies are in conflict with stakeholders, it is difficult to be carried out. (4) Food water and energy are basic elements in human life, so regional sustainable development must focus on them as a whole system [29,30]. Exploring uncertainties in future regional societal needs to overcome more difficulties. So, this paper will review how to use the SSP framework in regional scenarios and discuss their advantages and disadvantages, providing alternative ways to scenarios further studies.

2. Exploration of Regional Scenario Projection Methods

2.1. Based on IAM Scenario Analysis

2.1.1. Methods Outline

An integrated assessment model (IAM) is frequently used in IPCC shared socioeconomic pathways, including SSP1 (IMAGE), SSP2 (MESSAGE-GLOBIOM), SSP3 (AIM/CGE), SSP4 (GCAM4), SSP5 (REMIND-MAGPIE), and other modules. The IAM variables include GDP, population, energy, land cover, emissions (unharmonized and harmonized), agricultural indicators, economic indicators, and technological indicators, covering 26 countries or regions globally. Because of given variables and research areas, the original IAM scenarios database is not sufficient to address all regional problems [31]. It is necessary to extend IAM scenarios. The first step is scenario descriptions that provide the basic logic and components of the SSP framework. In accordance with climate change and social economic change, the variables focus on the SSP scenario hypothesis [15]. The IAM needs to add new variables or indicators to address regional circumstances. Second, variables and scenario descriptions translate into quantifiable items, such as population, GDP, urbanization rate, farmland productivity, and water use efficiency. Lastly, these variables are imported into the IAM scenarios, and the projection results are exported from it. Concrete procedures are illustrated in Figure 2.
Water resource projection is important information for water resource sustainability and water security in the future [25], as water is closely related to regional economic development. For example, industrial water use in the future can be used in IAM or CGE, which includes a social computing matrix under the SSPs, and energy use [32]. In addition to water resources, there are land-use modules in IAM, including cropland, forest, pasture, and other natural lands [15]. Specific land-use models are used to simulate spatial dynamics and distribution patterns in the 1.5 °C scenario [26]. Besides, land emissions are another item of regional sustainability, because the emissions from farming and forests have increased gradually [33].
Energy projection is a significant part of the IAM scenarios. The energy is divided into primary energy (bioenergy, coal, oil, etc.), secondary energy (electricity, heat, water, etc.), final energy (electricity, geothermal, solar, etc.), and energy service. IAM provides detailed data and assumption results [15]. Figure 3 presents the primary energy triangle and total final energy demand. Moreover, energy production and use are also related to land use [34], air pollution, and greenhouse gas emissions [35].

2.1.2. Method Description

The implementation of SSPs into IAM can well reflect the SSP scenarios and locate the SSP scenarios of climate change mitigation and challenges [36]. The IAM community also researches the interaction of large-scale mitigation and local land use, and water resources and energy in various SDGs [26]. Besides, because of the relatively completed database and research model, the IAM scenarios database can be directly used in regional scenarios, which is easy and convenient. In addition, if models need to be extended or enriched, the authors can design quantitative indicators of SSPs or IAM, according to the actual situation in region-specific models, such as land-use model and energy-use model.
However, original models in IAM are insufficient in addressing new climate change in complex regional situations. The regional scale of the IAM Scenarios is 5 major regions and 26 countries. It is relatively low resolution that results in specific regions being difficult to accurately reflect. What is more, IAM SSP scenarios mainly focus on large-scale trends and ignore dynamics within countries and regions [33].

2.2. SSPs-RCPs-SPAs Framework Analysis

2.2.1. Methods Outline

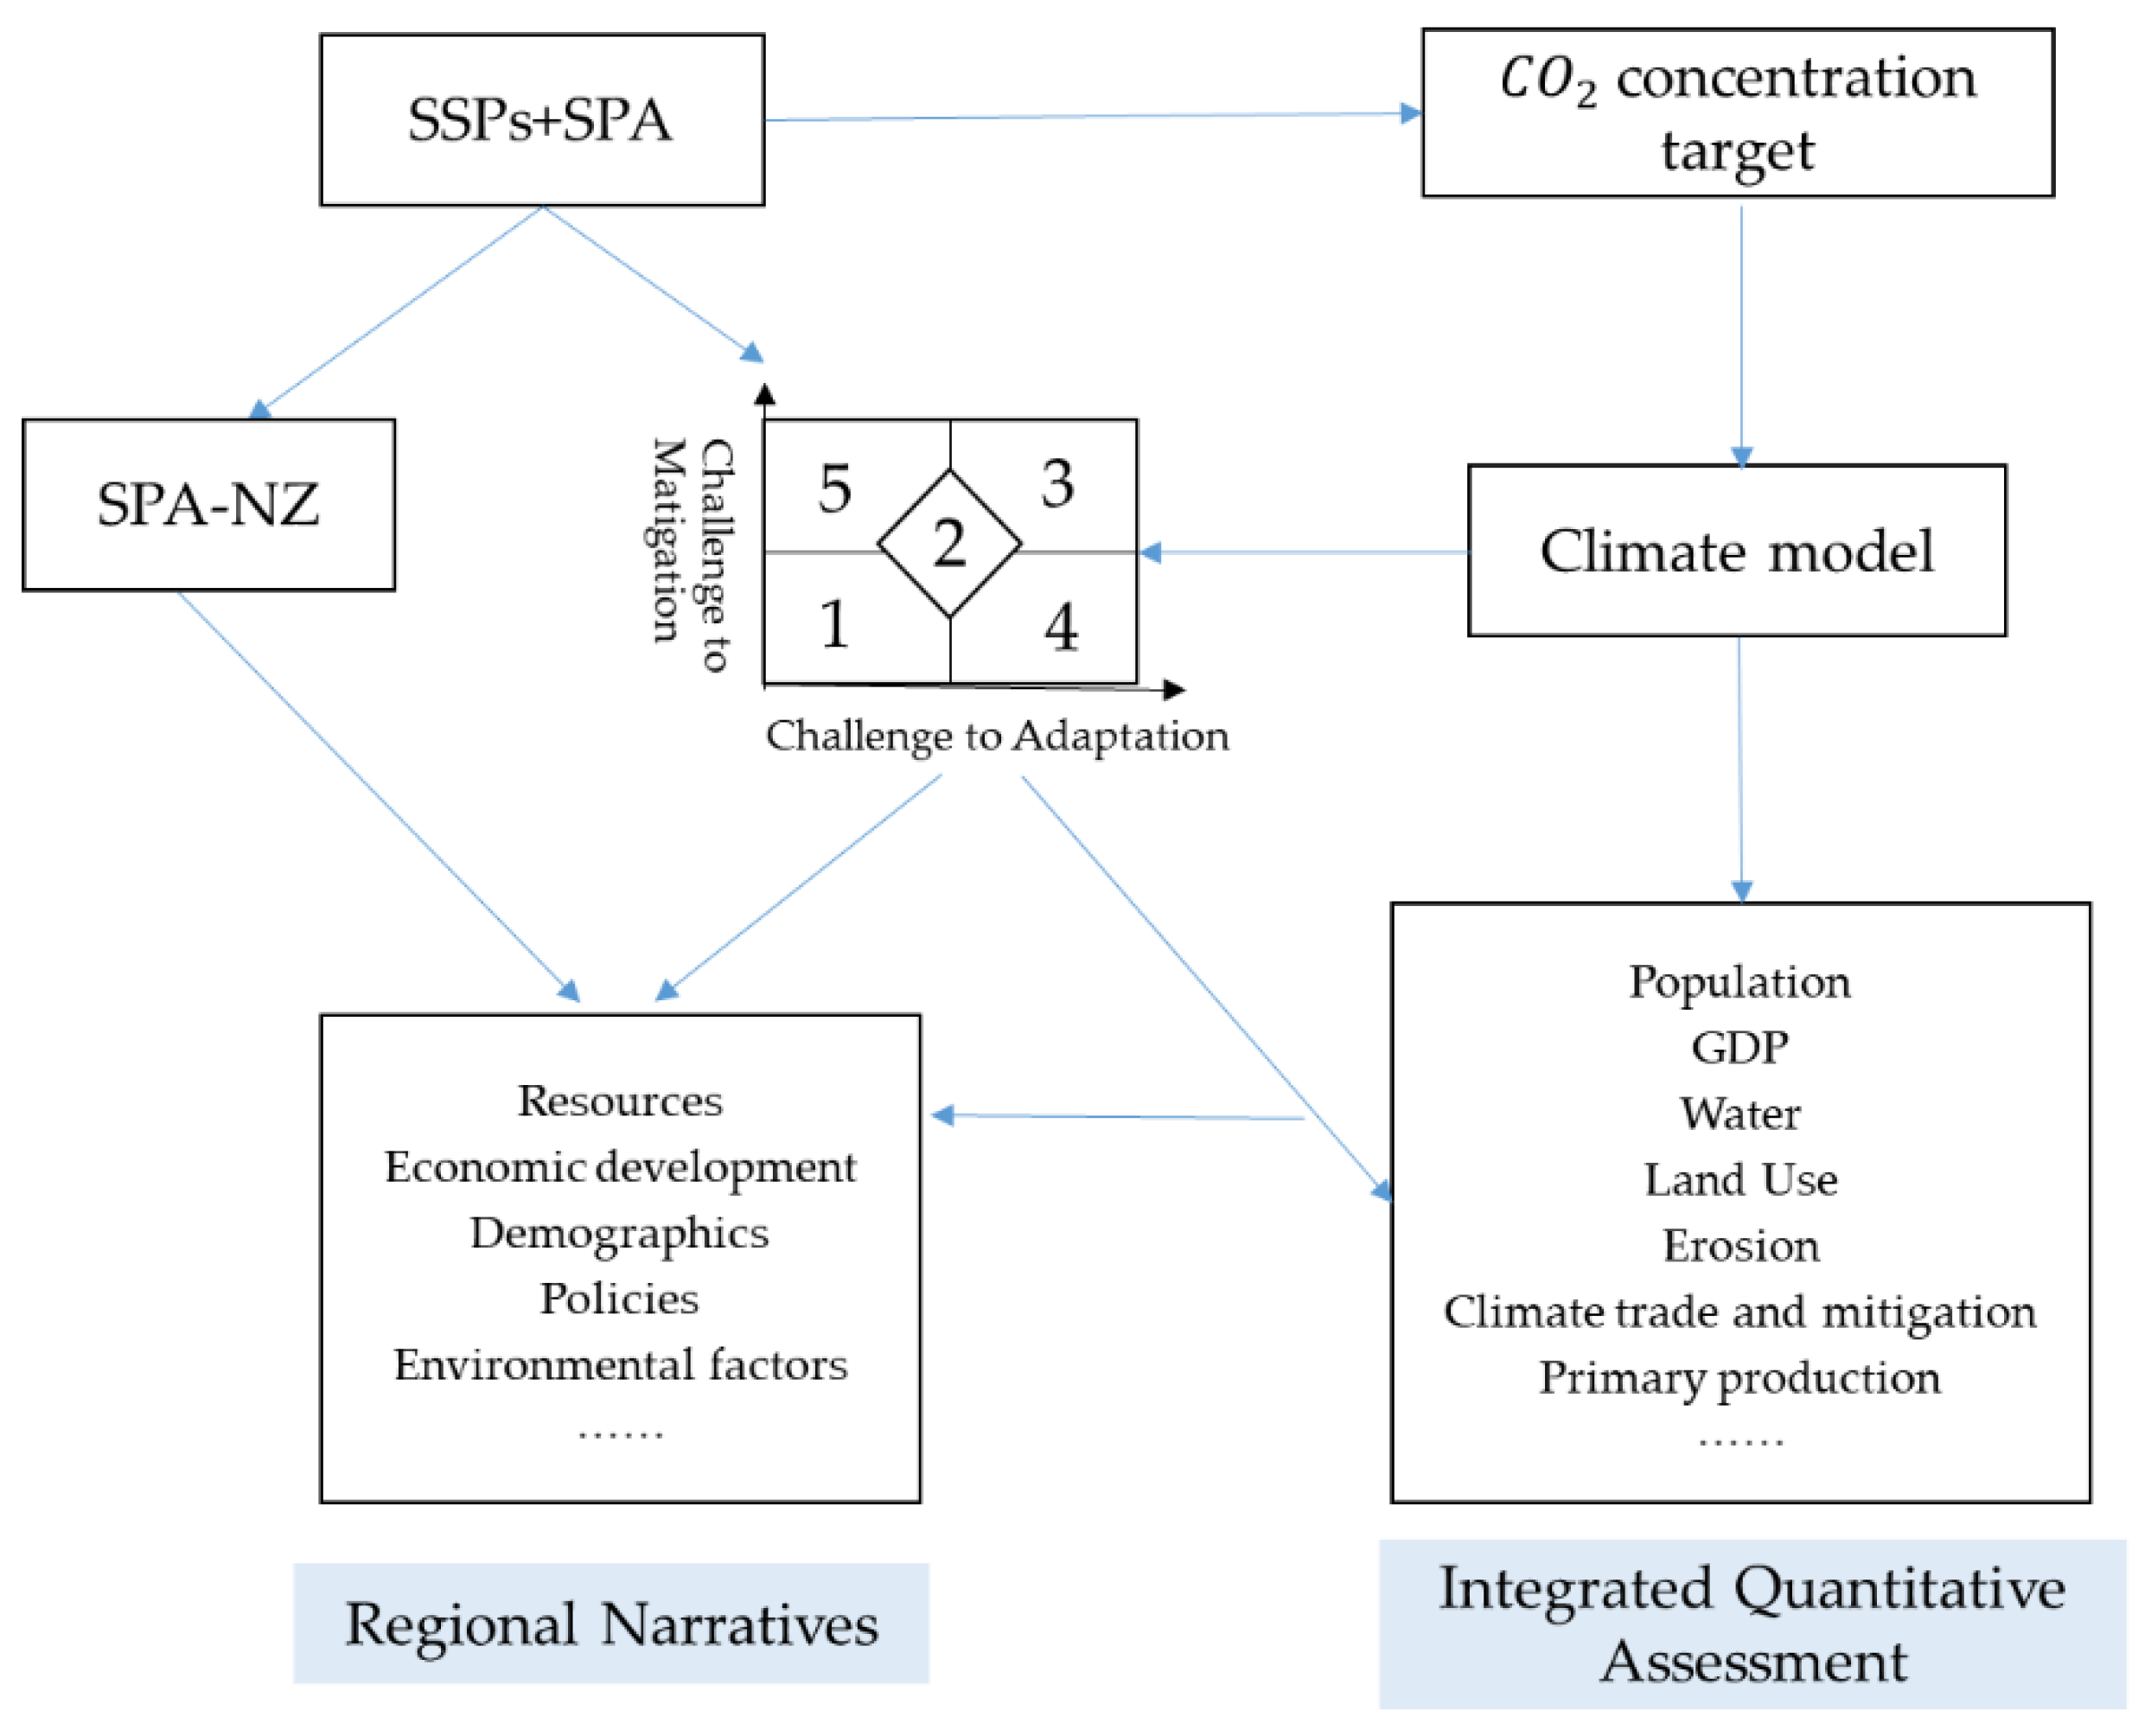
SSPs do not contain climate policies, which are particularly important for regions to address climate change. However, the global shared policy assumptions (SPAs) contain only climate policy information without climate information [37], so analyzing climate change hazards in regions should link with both of these. National SPAs, containing climate-specific and non-climate-specific policies, could ensure stakeholders realize the climate change risks in individual countries because local policies could accelerate, reduce or even negate the impact of global climate change [38]. Scenarios must include climate and non-climate policies related to production of GHGs. Emphasizing domestic climate change policies (both mitigation and adaptation) are relative to global scales for different SSPs and climate scenarios. One approach is initially to take the global RCPs and SSPs as a given and to map into a national SPA based on the options of global development. This SPAs would cover national policies and global climate change [39].
Taking New Zealand as an example, shown in Figure 4, an SSP-RCP-SPANZ framework was designed for New Zealand to assess the climate change scenarios for alpine, upland, lowland, and coastal areas, explaining the impact of climate change in the country and regions with climate policies and without climate policies [39]. The framework uses New Zealand to show how a country selects policies in SSPs and RCPs to respond to vulnerability and hazard to climate change [39]. There are some potential conflicts with the interaction of climate policies and stakeholders related to how well stakeholders cope with national hazards and adaptable responses.

2.2.2. Method Description

National climate policies and non-climate policies involve global climate change and policy makers [25,38]. From global and local perspectives, designing regional scenario drivers not only addresses conflicts between climate mitigation policies and stakeholders but also ensures the implementation of mitigation policies [39]. Based on the SSPs-RCPs-SPAs scenario analysis, model indicators and quantification methods are combined with local practice, which integrates regional factors into global change narratives. Emphasizing the impact of social trends, economic structures, cultural characteristics, natural environments, and political dynamics is necessary for understanding the challenges of multi-scale interactions in the future and for adapting to and mitigating climate change.
However, there are some disadvantages of this approach. First, some global climate change and region policies do not correspond [40]. Second, SPA are theoretical climate adaptation and mitigation theories that can conflict with an original regional climate policies, making SPAs and climate mitigation goals more difficult to implement. Finally, achieving interoperability between climate mitigation policies and scenarios, perfectly nesting SPAs, SSPs and RCPs at regional scales, requires more specific data at different scales.

2.3. Downscaling Global Impact Assessment Model

2.3.1. Methods Outline

As climate change impact and assessment method research has advanced, global impact assessment models have developed, such as the water resource impact and assessment models GHMs [19], VIC [25], WFaS [41], and H08 [42]; the land-use impact and assessment models FLUS [43], CA [44], and LUCC [45]; and the energy impact and assessment models CGE [32] and GTIMES [21]. Most of the models have been applied in global scale scenario studies driven by the CMIP-RCP [19]. The Coupled Model Intercomparison Project (CMIP) is a model comparison plan that collects data from models and simulates recent and long-term projections. Global scale models can also be applied at the regional scale through dynamic downscaling or statistical downscaling methods [46]. Recent research has presented methods to downscale global assumptions and estimates, focusing on quantifying input metrics [47]. Examples include methods that use population, productivity, and capital stock growth to estimate regional per capita GDP [11] or changes in age structure, educational attainment and economic growth to project national per capita income [48]. As for Meteorological data, the Delta method is frequently used to downscale. Getting precipitation or temperature from CMIP in future scenarios, calculating rates of change in them of every grids. Based on the data from meteorological stations in the region, multiplying the rates can get the future precipitation and temperature in this region.
In the water-use scenarios, with socio-economic capabilities and climatic hydrological factors as variables, using two different downscaling techniques in obtaining Pearl River data, the projection provides results from the WFaS global assessment in China and the Pearl River [25]. In addition, land-use scenarios can also be conducted by this method in Future Land Use Simulation Model (FLUS). Different land-use dynamics can be downscaled to different regions by ANN and CA, presenting land use spatial distribution and area in the future. Moreover, land use is related to water use, energy use and greenhouse gas emissions, so the assessment tends to use an integrated assessment model, for example, the REMIND-MAgPIE model.

2.3.2. Methods Description

The SSP scenarios are developed based on the latest socio-economic data. The modelling parameters are obtained from historical analyses [42]. In addition, climate data were obtained from the average of multiple CMIPs and GCMs [18], making meteorological data sources more widely used [19].
However, in some studies, the drivers of future scenarios only consider populations and do not include other factors [39], such as industrial water demand and urbanization rate [25], which means the scenarios incompletely reflect the regional situation. Besides, the global scale data of the SSP, RCP and CMIP data are low resolutions [23]. It is particularly important to develop a link between regional projections and the global assessment, downscaling to the regional scenarios. A bottom-up way to build regional scenarios may be an alternative way to downscale the SSP narrative to the regional level [25]. Lastly, because of regional differences and diversity, there are some inevitable errors in downscaling data. It requires more extensive regional-scale datasets and sufficient regional-specific variables to support the analysis [25].

2.4. Regional Impact Assessment Model Simulation

2.4.1. Methods Outline

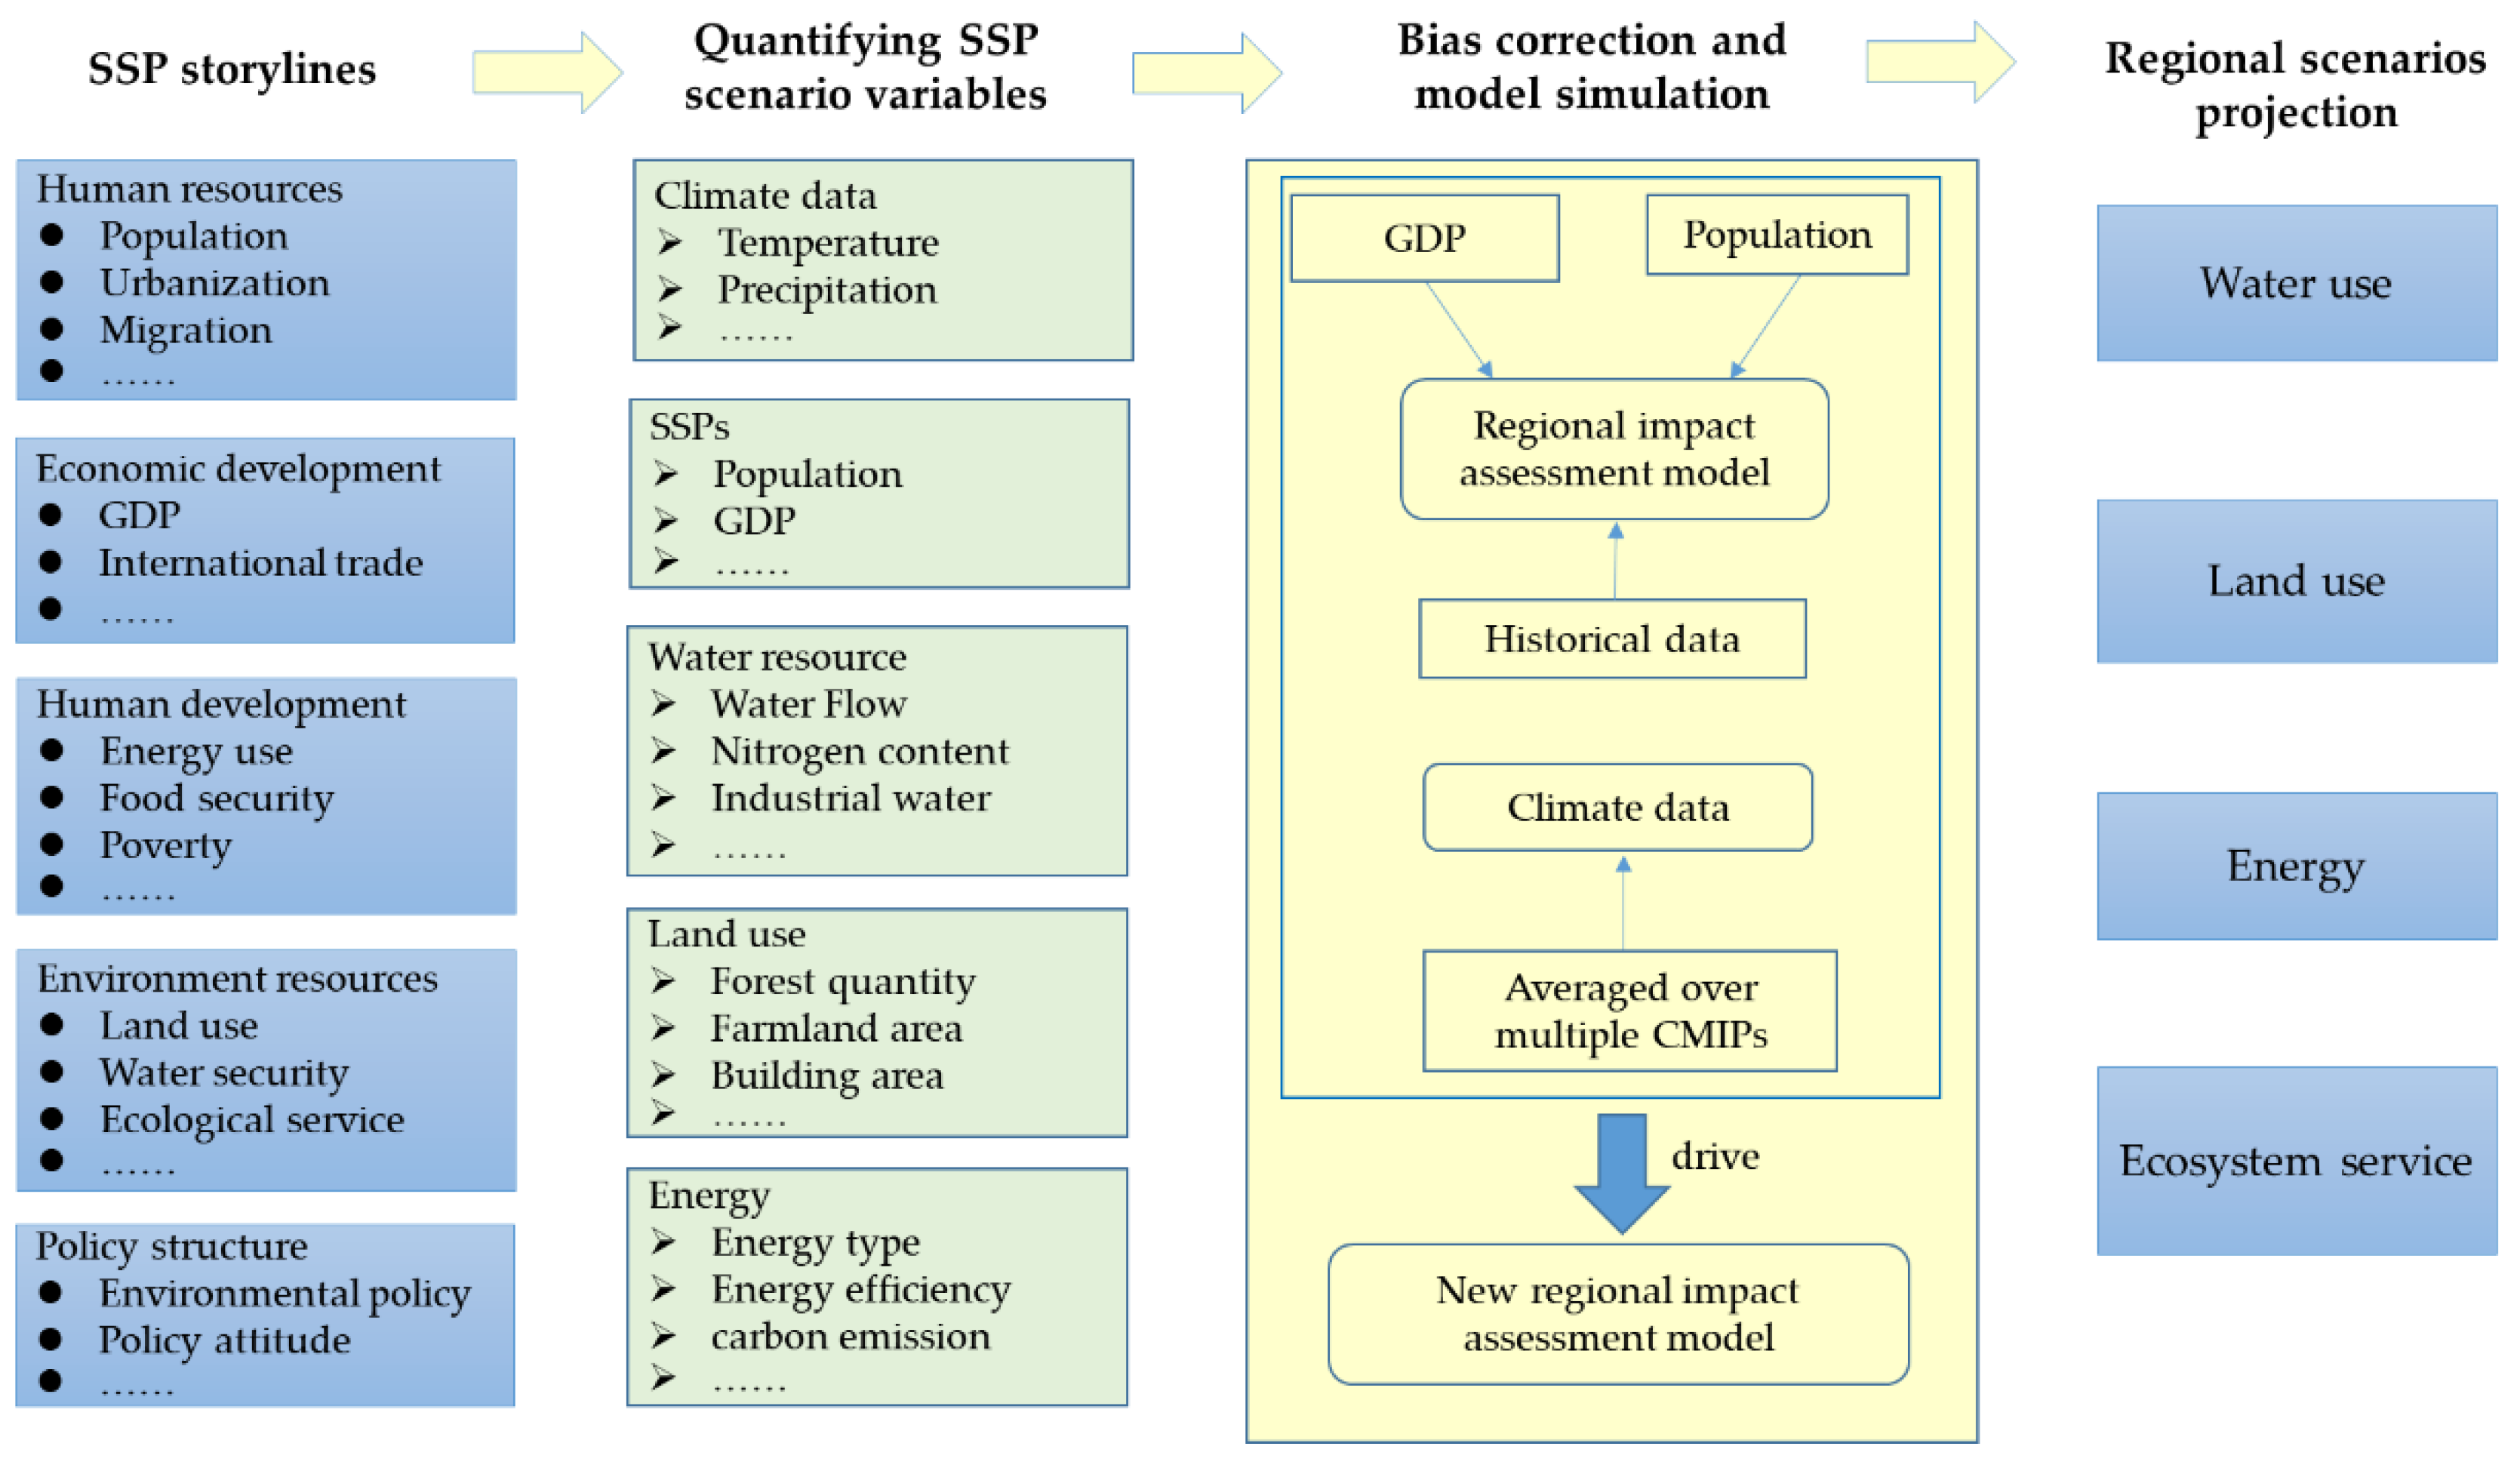
As Figure 5 shows, regional impact assessment models can be used in scenario assumptions in the SSPs. The SSPs have detailed descriptions, including information on human resources, financial development, human development, environmental resources, and policy structure. Then, all descriptions are translated into quantifiable variables that can be used in regional impact assessment models. To minimize errors, population and GDP are regressed with water resources, land use, energy, and sensitive parameters. The models are not completely suitable for regional situations, so historical data are needed to correct them. Finally, based on the new regional impact assessment models and SSP pathways, we can obtain regional scenario assumptions. Considering land use as an example, the land-use scenario dynamics-urban (LUSD-urban) model uses historical urban population data from 1990–2013 to conduct a regression with the change in urban land. Driven by the urban population, this model projects the urban land change from 2013–2040 under five SSPs to explore its spatial allocation [24].
With this framework, as summarized in Table 2, a series of scenario projection studies have been performed, including water resources, land use, energy, and ecosystem services.

2.4.2. Methods Description

The SSPs can comprehensively reflect the complexity of regional development, because their pathways consider various elements in the local situation, such as demography, economy, policy, technology, environment, and resources [54]. The data of regional impact assessment models are generally at higher resolutions and corrected by historical data. They have better precision than those of global models. Therefore, the errors of the projection results are smaller than the global scale models [24,30,43,51]. SSP in regional impact assessment models not only predict future change in land use, water resource, energy and so on, but also give an effective way to quantitatively simulate long-term changes under alternative futures [43].
However, higher resolution models also need better quality data to drive them and validate the results. Some data need to be collected over a long time or are even missing. The changes in the future are complicated that are determined by interaction in space and time of biophysical factors and human factors at different scale.

3. Discussion

Global temperature has increased, and extreme weather is more frequent since the Industrial Revolution [55]. Climate change has affected all aspects of society, such as land use, water resources, energy use, and ecosystem services [56]. The UN has proposed a series of sustainable development goals and committed designated countries to new operational goals to achieve sustainable water resource use, energy use, and agricultural practices and improve economic growth. Therefore, water, energy, and food have become the key problems in meeting sustainable development goals, which have become a conceptual tool to analyze scenarios in the future [57]. Climate change is an important issue for sustainable social development.
SSPs is a global scale analysis framework, but local and regional conditions are complex and different. Responding to climate change and achieving regional sustainable development must be transferred to the regional scale. By reviewing related papers, we have discussed four methods about how the SSPs framework is applied into regions and their advantages and disadvantages. The studies of the SSPs framework form population, GDP, CO2 concentration extend to land use, water resources, food production, and ecological services. We find that water, energy and food have a close relationship with each other, and they play a key role in regional sustainable development. In further studies, the water–energy–food nexus in the SSPs framework will be a significant study in the future.

3.1. Regional Sustainable Development Scenarios with the SSPs Framework

To meet the global temperature goal within 1.5–2 °C and address climate change and social economic development, SSPs have been developed with a multi-scale scenario at the global–country–region scale [28]. To achieve climate change adaptation and mitigation, some governments have implemented climate policies and other measures.
Regional sustainable development scenario projection methods have been developed and greatly improved with the framework of SSPs. However, there are some factors that should be paid attention to in different scenarios. (1) Climate scenarios are not only at a global scale but also at national and local scales, and regional sustainable scenarios have been studied more frequently. Both of them should not be isolated, because global climate change and regional development have an influence on each other. (2) Regional sustainable development is complex. Both global climate change and regional situations, such as population growth, energy-use efficiency, technologies, and climate policies are related to regional sustainable development scenarios. (3) Every method has advantages and disadvantages. Only one method might not meet the need for regional scenarios. In further studies, according to the actual local situation, we might choose one or two appropriate methods.

3.2. Water–Energy–Food Nexus in Regional Sustainable Development

Climate change has an important impact on human survival and social resource production. Food and water are the basic materials for human survival, and energy is a key factor in human development. Effective management of these resources is the basis for the sustainable development of human society [58]. The study of the water–energy–food nexus has become a new conceptual tool for achieving regional sustainable development [57]. For example, an upstream situation likely has an impact on the downstream situation. Soil erosion in an upper catchment will form a sedimentary delta downstream, which plays a positive role in food production. The water–energy–food nexus is a highly relative regional system [30]. Therefore, it is significant to promote water–energy–food ecosystem service capabilities in the future. The water–energy–food nexus in regional scenarios of SSPs will be a significant study in the future.

4. Conclusions

The uncertainties and vulnerability that result from global warming have an effect on human society which is greater than ever before. Scientifically addressing climate change has become one of the core issues of sustainable development. Regional scenarios focus on the uncertainty in the future of societal conditions, climate change projection and climate policies. Regional scenarios have been greatly developed, and an increasing number of studies have been implemented. In this paper, we reviewed how SSPs are used in regions and what we should take care of. In the SSPs framework, the use of it has become more and more wide, such as for land use, water resources, food production, and ecological services. It has been found that water, energy and food are systematic, and they are of vital importance to regional sustainable development. Water–energy–food nexus studies is one of the most important parts of the SSPs framework. In further studies, there are still some problems that need to be addressed, such as low resolution, missing data, and variable quantifying difficultly.

Author Contributions

S.Y. and X.C. designed the research and wrote up the manuscript together. S.Y.—the structure of the manuscript, developed the framework, summarized categories, and contributed to the draft and revision of the manuscript. X.C.—the theories and ideas of the manuscript, provided research concepts, improved the framework, and contributed to the draft and revision of the manuscript.

Funding

This research was funded by National Science Foundation of China, grant number 91637104 and 41661144006 and National Basic Research Development Program of China, grant number 2015CB953602.

Acknowledgments

The study has benefited from discussions with Bo Su, the National Key Laboratory of Surface Processes and Resource Ecology, Beijing Normal University and Tong Jiang, Nanjing University of Information Science and Technology. We would also like to express our appreciation to the anonymous reviewers and editors’ comments which greatly improved the final version of the manscript.

Conflicts of Interest

The authors declare no conflict of interest.

References

  1. Disley, Y.P. Sustainable development goals for people and planet. Nature 2013, 495, 21. [Google Scholar]
  2. Khan, K.A.; Zaman, K.; Shoukry, A.M.; Sharkawy, A.; Gani, S.; Ahmad, J.; Khan, A.; Hishan, S.S. Natural disasters and economic losses: Controlling external migration, energy and environmental resources, water demand, and financial development for global prosperity. Environ. Sci. Pollut. Res. 2019, 26, 14287–14299. [Google Scholar] [CrossRef] [PubMed]
  3. Giupponi, C.; Gain, A.; Farinosi, F. Spatial Assessment of Water Use Efficiency (SDG Indicator 6.4. 1) for Regional Policy Support. Front. Environ. Sci 2018, 6, 141. [Google Scholar] [CrossRef]
  4. Schleussner, C.-F.; Rogelj, J.; Schaeffer, M.; Lissner, T.; Licker, R.; Fischer, E.M.; Knutti, R.; Levermann, A.; Frieler, K.; Hare, W. Science and policy characteristics of the Paris Agreement temperature goal. Nat. Clim. Chang. 2016, 6, 827. [Google Scholar] [CrossRef]
  5. Dumenu, W.K.; Obeng, E.A. Climate change and rural communities in Ghana: Social vulnerability, impacts, adaptations and policy implications. Environ. Sci. Policy 2016, 55, 208–217. [Google Scholar] [CrossRef]
  6. Rogelj, J.; Luderer, G.; Pietzcker, R.C.; Kriegler, E.; Schaeffer, M.; Krey, V.; Riahi, K. Energy system transformations for limiting end-of-century warming to below 1.5 C. Nat. Clim. Chang. 2015, 5, 519. [Google Scholar] [CrossRef]
  7. O’Neill, B.C.; Kriegler, E.; Ebi, K.L.; Kemp-Benedict, E.; Riahi, K.; Rothman, D.S.; van Ruijven, B.J.; van Vuuren, D.P.; Birkmann, J.; Kok, K. The roads ahead: Narratives for shared socioeconomic pathways describing world futures in the 21st century. Glob. Environ. Chang. 2017, 42, 169–180. [Google Scholar] [CrossRef] [Green Version]
  8. Singh, V.; Goyal, M.K. Analysis and trends of precipitation lapse rate and extreme indices over north Sikkim eastern Himalayas under CMIP5ESM-2M RCPs experiments. Atmos. Res. 2016, 167, 34–60. [Google Scholar] [CrossRef]
  9. Van Vuuren, D.P.; Carter, T.R. Climate and socio-economic scenarios for climate change research and assessment: Reconciling the new with the old. Clim. Chang. 2014, 122, 415–429. [Google Scholar] [CrossRef]
  10. O’Neill, B.C.; Kriegler, E.; Riahi, K.; Ebi, K.L.; Hallegatte, S.; Carter, T.R.; Mathur, R.; van Vuuren, D.P. A new scenario framework for climate change research: The concept of shared socioeconomic pathways. Clim. Chang. 2014, 122, 387–400. [Google Scholar] [CrossRef]
  11. Kurniawan, R.; Managi, S. Measuring long-term sustainability with shared socioeconomic pathways using an inclusive wealth framework. Sustain. Dev. 2018, 26, 596–605. [Google Scholar] [CrossRef]
  12. Robert, K.; Parris, T.; Leiserowitz, A. What is Sustainable Development? Goals, Indicators, Values, and Practice. Environ. Sci. Policy Sustain. Dev. 2005, 47, 8–21. [Google Scholar] [CrossRef]
  13. Costanza, R.; Daly, L.; Fioramonti, L.; Giovannini, E.; Kubiszewski, I.; Mortensen, L.F.; Pickett, K.E.; Ragnarsdottir, K.V.; Vogli, R.D.; Wilkinson, R. Modelling and measuring sustainable wellbeing in connection with the UN Sustainable Development Goals. Ecol. Econ. 2016, 130, 350–355. [Google Scholar] [CrossRef]
  14. Jiang, L. Internal consistency of demographic assumptions in the shared socioeconomic pathways. Popul. Environ. 2014, 35, 261–285. [Google Scholar] [CrossRef] [Green Version]
  15. Riahi, K.; Van Vuuren, D.P.; Kriegler, E.; Edmonds, J.; O’neill, B.C.; Fujimori, S.; Bauer, N.; Calvin, K.; Dellink, R.; Fricko, O. The shared socioeconomic pathways and their energy, land use, and greenhouse gas emissions implications: An overview. Glob. Environ. Chang. 2017, 42, 153–168. [Google Scholar] [CrossRef]
  16. Rohat, G. Projecting drivers of human vulnerability under the Shared Socioeconomic Pathways. Int. J. Environ. Res. Public Health 2018, 15, 554. [Google Scholar] [CrossRef]
  17. Hanasaki, N.; Fujimori, S.; Yamamoto, T.; Yoshikawa, S.; Masaki, Y.; Hijioka, Y.; Kainuma, M.; Kanamori, Y.; Masui, T.; Takahashi, K.; et al. A global water scarcity assessment under Shared Socio-economic Pathways—Part 2: Water availability and scarcity. Hydrol. Earth Syst. Sci. Discuss. 2012, 9, 13933–13994. [Google Scholar] [CrossRef]
  18. Arnell, N.W.; Lloyd-Hughes, B. The global-scale impacts of climate change on water resources and flooding under new climate and socio-economic scenarios. Clim. Chang. 2014, 122, 127–140. [Google Scholar] [CrossRef]
  19. Schewe, J.; Heinke, J.; Gerten, D.; Haddeland, I.; Arnell, N.W.; Clark, D.B.; Dankers, R.; Eisner, S.; Fekete, B.M.; Colón-González, F.J. Multimodel assessment of water scarcity under climate change. Proc. Natl. Acad. Sci. USA 2014, 111, 3245–3250. [Google Scholar] [CrossRef]
  20. Jiang, L.; O’Neill, B.C. Global urbanization projections for the Shared Socioeconomic Pathways. Glob. Environ. Chang. 2017, 42, 193–199. [Google Scholar] [CrossRef] [Green Version]
  21. Chen, W.; Wang, H.; Huang, W.; Li, N.; Shi, J. Shared social-economic pathways (SSPs) modeling: Application of global multi-region energy system model. Energy Procedia 2017, 142, 2467–2472. [Google Scholar] [CrossRef]
  22. Van Puijenbroek, P.J.T.M.; Beusen, A.H.W.; Bouwman, A.F. Global nitrogen and phosphorus in urban waste water based on the Shared Socio-economic pathways. J. Environ. Manag. 2019, 231, 446–456. [Google Scholar] [CrossRef] [PubMed]
  23. Absar, S.M.; Preston, B.L. Extending the Shared Socioeconomic Pathways for sub-national impacts, adaptation, and vulnerability studies. Glob. Environ. Chang. 2015, 33, 83–96. [Google Scholar] [CrossRef] [Green Version]
  24. Zhang, D.; Huang, Q.; He, C.; Wu, J. Impacts of urban expansion on ecosystem services in the Beijing-Tianjin-Hebei urban agglomeration, China: A scenario analysis based on the Shared Socioeconomic Pathways. Resour. Conserv. Recycl. 2017, 125, 115–130. [Google Scholar] [CrossRef]
  25. Yao, M.; Tramberend, S.; Kabat, P.; Hutjes, R.W.; Werners, S.E. Building regional water-use scenarios consistent with global shared socioeconomic pathways. Environ. Process. 2017, 4, 15–31. [Google Scholar] [CrossRef]
  26. Doelman, J.C.; Stehfest, E.; Tabeau, A.; van Meijl, H.; Lassaletta, L.; Gernaat, D.E.; Hermans, K.; Harmsen, M.; Daioglou, V.; Biemans, H. Exploring SSP land-use dynamics using the IMAGE model: Regional and gridded scenarios of land-use change and land-based climate change mitigation. Glob. Environ. Chang. 2018, 48, 119–135. [Google Scholar] [CrossRef] [Green Version]
  27. Nilsson, A.E.; Bay-Larsen, I.; Carlsen, H.; van Oort, B.; Bjørkan, M.; Jylhä, K.; Klyuchnikova, E.; Masloboev, V.; van der Watt, L.-M. Towards extended shared socioeconomic pathways: A combined participatory bottom-up and top-down methodology with results from the Barents region. Glob. Environ. Chang. 2017, 45, 124–132. [Google Scholar] [CrossRef]
  28. Kebede, A.S.; Nicholls, R.J.; Allan, A.; Arto, I.; Cazcarro, I.; Fernandes, J.A.; Hill, C.T.; Hutton, C.W.; Kay, S.; Lázár, A.N. Applying the global RCP–SSP–SPA scenario framework at sub-national scale: A multi-scale and participatory scenario approach. Sci. Total Environ. 2018, 635, 659–672. [Google Scholar] [CrossRef]
  29. Dermody, B.J.; Sivapalan, M.; Stehfest, E.; Van Vuuren, D.P.; Wassen, M.J.; Bierkens, M.F.; Dekker, S.C. A framework for modelling the complexities of food and water security under globalisation. Earth Syst. Dyn. 2018, 9, 103–118. [Google Scholar] [CrossRef] [Green Version]
  30. Mouratiadou, I.; Biewald, A.; Pehl, M.; Bonsch, M.; Baumstark, L.; Klein, D.; Popp, A.; Luderer, G.; Kriegler, E. The impact of climate change mitigation on water demand for energy and food: An integrated analysis based on the Shared Socioeconomic Pathways. Environ. Sci. Policy 2016, 64, 48–58. [Google Scholar] [CrossRef] [Green Version]
  31. Schaeffer, M.; Gohar, L.; Kriegler, E.; Lowe, J.; Riahi, K.; van Vuuren, D. Mid-and long-term climate projections for fragmented and delayed-action scenarios. Technol. Forecast. Soc. Chang. 2015, 90, 257–268. [Google Scholar] [CrossRef]
  32. Fujimori, S.; Hanasaki, N.; Masui, T. Projections of industrial water withdrawal under shared socioeconomic pathways and climate mitigation scenarios. Sustain. Sci. 2017, 12, 275–292. [Google Scholar] [CrossRef] [PubMed]
  33. Popp, A.; Calvin, K.; Fujimori, S.; Havlik, P.; Humpenöder, F.; Stehfest, E.; Bodirsky, B.L.; Dietrich, J.P.; Doelmann, J.C.; Gusti, M. Land-use futures in the shared socio-economic pathways. Glob. Environ. Chang. 2017, 42, 331–345. [Google Scholar] [CrossRef] [Green Version]
  34. Kriegler, E.; Bauer, N.; Popp, A.; Humpenöder, F.; Leimbach, M.; Strefler, J.; Baumstark, L.; Bodirsky, B.L.; Hilaire, J.; Klein, D. Fossil-fueled development (SSP5): An energy and resource intensive scenario for the 21st century. Glob. Environ. Chang. 2017, 42, 297–315. [Google Scholar] [CrossRef] [Green Version]
  35. Rao, S.; Klimont, Z.; Smith, S.J.; Van Dingenen, R.; Dentener, F.; Bouwman, L.; Riahi, K.; Amann, M.; Bodirsky, B.L.; van Vuuren, D.P. Future air pollution in the Shared Socio-economic Pathways. Glob. Environ. Chang. 2017, 42, 346–358. [Google Scholar] [CrossRef]
  36. Bauer, N.; Calvin, K.; Emmerling, J.; Fricko, O.; Fujimori, S.; Hilaire, J.; Eom, J.; Krey, V.; Kriegler, E.; Mouratiadou, I. Shared socio-economic pathways of the energy sector–quantifying the narratives. Glob. Environ. Chang. 2017, 42, 316–330. [Google Scholar] [CrossRef]
  37. Kriegler, E.; Edmonds, J.; Hallegatte, S.; Ebi, K.L.; Kram, T.; Riahi, K.; Winkler, H.; Van Vuuren, D.P. A new scenario framework for climate change research: The concept of shared climate policy assumptions. Clim. Chang. 2014, 122, 401–414. [Google Scholar] [CrossRef]
  38. Kriegler, E.; O’Neill, B.C.; Hallegatte, S.; Kram, T.; Lempert, R.J.; Moss, R.H.; Wilbanks, T. The need for and use of socio-economic scenarios for climate change analysis: A new approach based on shared socio-economic pathways. Glob. Environ. Chang. 2012, 22, 807–822. [Google Scholar] [CrossRef]
  39. Frame, B.; Lawrence, J.; Ausseil, A.-G.; Reisinger, A.; Daigneault, A. Adapting global shared socio-economic pathways for national and local scenarios. Clim. Risk Manag. 2018, 21, 39–51. [Google Scholar] [CrossRef]
  40. Palazzo, A.; Vervoort, J.M.; Mason-D’Croz, D.; Rutting, L.; Havlík, P.; Islam, S.; Bayala, J.; Valin, H.; Kadi, H.A.K.; Thornton, P. Linking regional stakeholder scenarios and shared socioeconomic pathways: Quantified west African food and climate futures in a global context. Glob. Environ. Chang. 2017, 45, 227–242. [Google Scholar] [CrossRef]
  41. Wada, Y.; Flörke, M.; Hanasaki, N.; Eisner, S.; Fischer, G.; Tramberend, S.; Satoh, Y.; Van Vliet, M.; Yillia, P.; Ringler, C. Modeling global water use for the 21st century: Water Futures and Solutions (WFaS) initiative and its approaches. Geosci. Model Dev. 2016, 9, 175–222. [Google Scholar] [CrossRef]
  42. Hanasaki, N.; Fujimori, S.; Yamamoto, T.; Yoshikawa, S.; Masaki, Y.; Hijioka, Y.; Kainuma, M.; Kanamori, Y.; Masui, T.; Takahashi, K.; et al. A global water scarcity assessment under shared socio-economic pathways—Part 1: Water Use. Hydrol. Earth Syst. Sci. 2013, 17, 2375–2391. [Google Scholar] [CrossRef]
  43. Dong, N.; You, L.; Cai, W.; Li, G.; Lin, H. Land use projections in China under global socioeconomic and emission scenarios: Utilizing a scenario-based land-use change assessment framework. Glob. Environ. Chang. 2018, 50, 164–177. [Google Scholar] [CrossRef]
  44. Chen, Y.; Li, X.; Liu, X.; Zhang, Y.; Huang, M. Tele-connecting China’s future urban growth to impacts on ecosystem services under the shared socioeconomic pathways. Sci. Total Environ. 2019, 652, 765–779. [Google Scholar] [CrossRef] [PubMed]
  45. You-Qi, C.; Peng, Y. Recent progresses of international study on land use and land cover change (LUCC). Econ. Geogr. 2001, 21, 96–100. [Google Scholar]
  46. Komurcu, M.; Emanuel, K.; Huber, M.; Acosta, R. High-Resolution Climate Projections for the Northeastern United States Using Dynamical Downscaling at Convection-Permitting Scales. Earth Space Sci. 2018, 5, 801–826. [Google Scholar] [CrossRef]
  47. Leimbach, M.; Kriegler, E.; Roming, N.; Schwanitz, J. Future growth patterns of world regions–A GDP scenario approach. Glob. Environ. Chang. 2017, 42, 215–225. [Google Scholar] [CrossRef]
  48. Kompas, T.; Pham, V.H.; Che, T.N. The effects of climate change on GDP by country and the global economic gains from complying with the Paris Climate Accord. Earth’s Future 2018, 6, 1153–1173. [Google Scholar] [CrossRef]
  49. Jin, L.; Whitehead, P.G.; Rodda, H.; Macadam, I.; Sarkar, S. Simulating climate change and socio-economic change impacts on flows and water quality in the Mahanadi River system, India. Sci. Total Environ. 2018, 637, 907–917. [Google Scholar] [CrossRef]
  50. Wang, M.; Kroeze, C.; Strokal, M.; Ma, L. Reactive nitrogen losses from China’s food system for the shared socioeconomic pathways (SSPs). Sci. Total Environ. 2017, 605, 884–893. [Google Scholar] [CrossRef]
  51. Hu, X.; Iordan, C.M.; Cherubini, F. Estimating future wood outtakes in the Norwegian forestry sector under the shared socioeconomic pathways. Glob. Environ. Chang. 2018, 50, 15–24. [Google Scholar] [CrossRef]
  52. Wang, C.; Li, B.-B.; Liang, Q.-M.; Wang, J.-C. Has China’s coal consumption already peaked? A demand-side analysis based on hybrid prediction models. Energy 2018, 162, 272–281. [Google Scholar] [CrossRef]
  53. Levesque, A.; Pietzcker, R.C.; Baumstark, L.; De Stercke, S.; Grübler, A.; Luderer, G. How much energy will buildings consume in 2100? A global perspective within a scenario framework. Energy 2018, 148, 514–527. [Google Scholar] [CrossRef] [Green Version]
  54. He, C.; Li, J.; Zhang, X.; Liu, Z.; Zhang, D. Will rapid urban expansion in the drylands of northern China continue: A scenario analysis based on the Land Use Scenario Dynamics-urban model and the Shared Socioeconomic Pathways. J. Clean. Prod. 2017, 165, 57–69. [Google Scholar] [CrossRef]
  55. Bouwer, L.M. Have disaster losses increased due to anthropogenic climate change? Bull. Am. Meteorol. Soc. 2011, 92, 39–46. [Google Scholar] [CrossRef]
  56. Keesstra, S.; Nunes, J.; Novara, A.; Finger, D.; Avelar, D.; Kalantari, Z.; Cerdà, A. The superior effect of nature based solutions in land management for enhancing ecosystem services. Sci. Total Environ. 2018, 610, 997–1009. [Google Scholar] [CrossRef]
  57. Biggs, E.M.; Bruce, E.; Boruff, B.; Duncan, J.M.; Horsley, J.; Pauli, N.; McNeill, K.; Neef, A.; Van Ogtrop, F.; Curnow, J. Sustainable development and the water–energy–food nexus: A perspective on livelihoods. Environ. Sci. Policy 2015, 54, 389–397. [Google Scholar] [CrossRef]
  58. Rasul, G. Food, water, and energy security in South Asia: A nexus perspective from the Hindu Kush Himalayan region☆. Environ. Sci. Policy 2014, 39, 35–48. [Google Scholar] [CrossRef]
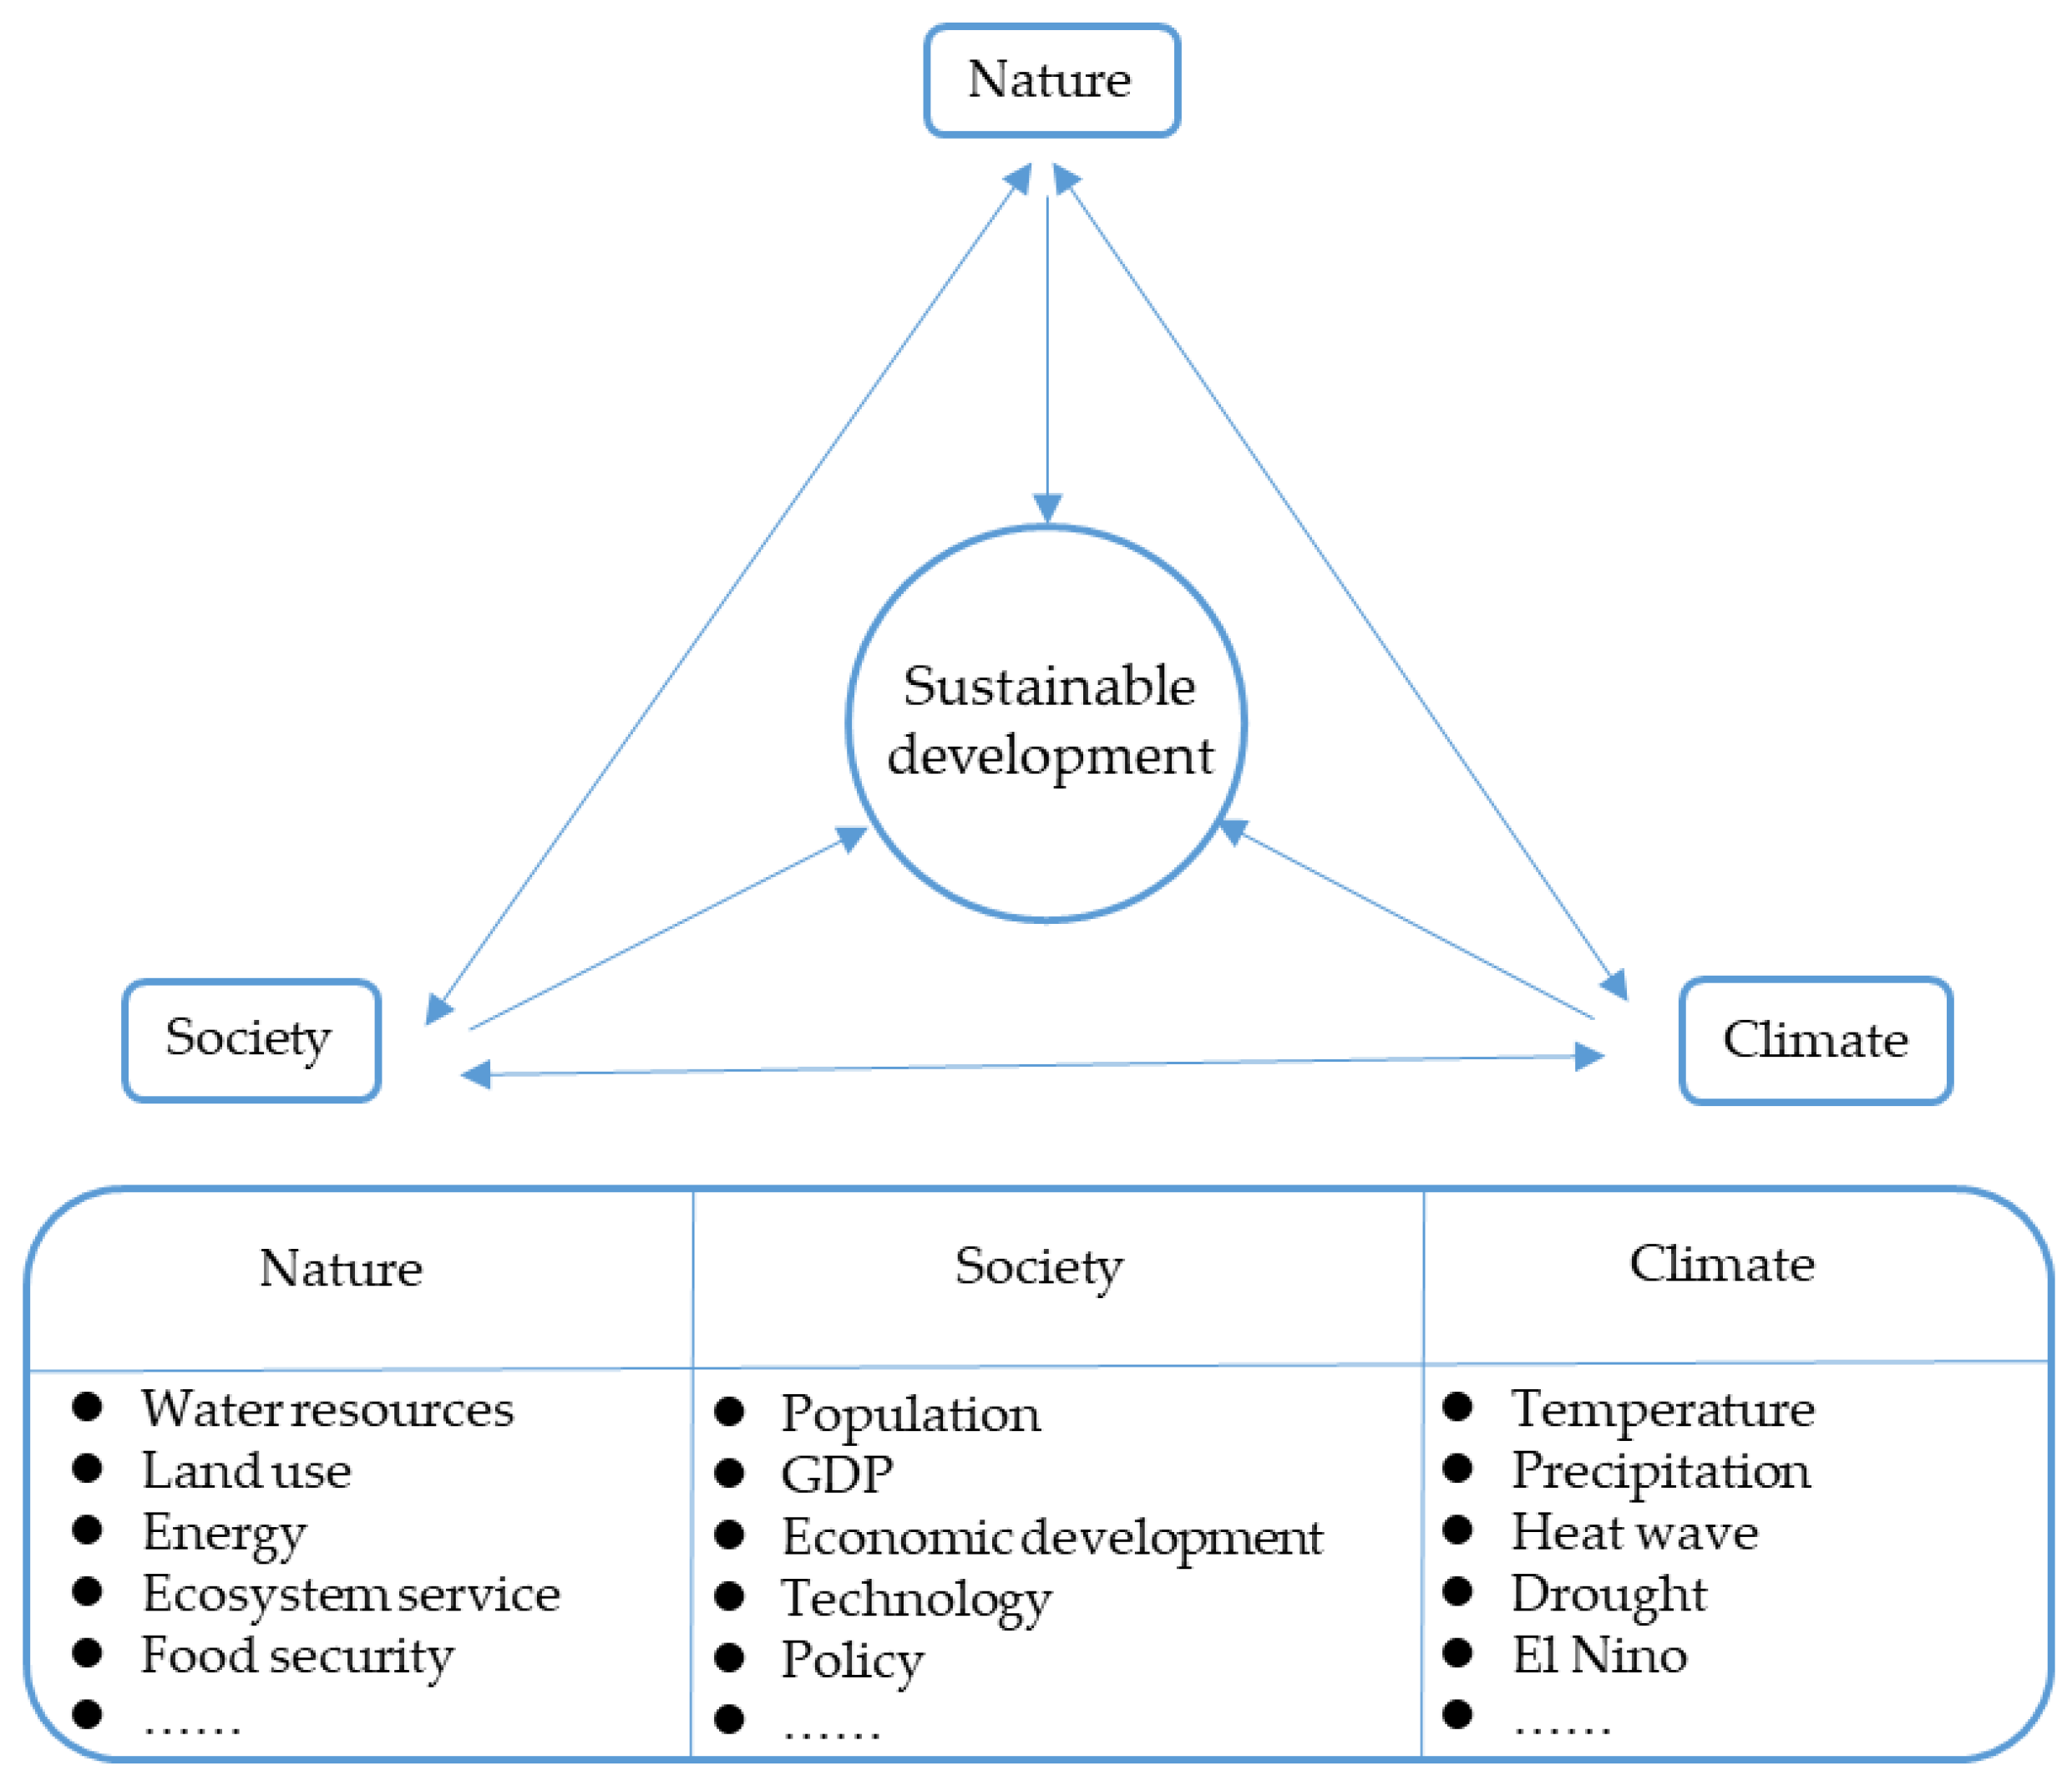
Figure 1. The relationship between nature, human society and climate change in sustainable development.
Sustainability 11 05712 g001
Figure 2. Scenario analysis with IAM scenarios framework.
Sustainability 11 05712 g002
Figure 3. Primary energy triangle and total final energy demand [15].
Sustainability 11 05712 g003
Figure 4. New Zealand climate scenarios with SSPs-RCPs-SPAs framework [14].
Sustainability 11 05712 g004
Figure 5. The framework of the regional impact assessment model in the scenario projection.
Sustainability 11 05712 g005
Table 1. Narratives of the SSPs.
NamePathway Narratives
SSP1SSP1 is a green sustainable development and low-challenge pathway. This pathway has low-resource intensity, less dependence on fossil energy, and high technological progress. Preventing environmental degradation is a priority. Internalizing economies within countries, especially low-income countries, has developed rapidly and reduced poverty.
SSP2SSP2 is an intermediate pathway, with intermediate challenges from climate change. The main features include the following: The countries have continuously reduced energy-use intensity and made progress towards sustainable development goals, according to the typical development trends in recent decades.
SSP3SSP3 is a challenging pathway, with substantial climate change challenges related to adaptation and mitigation. The main features include the following: the world is divided into extremely poor areas, middle-income areas and wealthy areas. There is a lack of coordination among these areas, and regional differences are obvious
SSP4SSP4 is a divided and unbalanced pathway where countries mostly need to adapt to challenges. There is a state of highly uneven development among countries. Adapting challenges are the most important tasks for these countries.
SSP5SSP5 is a traditional development pathway that focuses on challenges for mitigation. Countries address their own interests and economic development by implementing traditional economic development.
Table 2. The application of regional impact assessment models with the SSP framework.
FieldRegional Impact Assessment ModelInputResultExplanation
WaterIntegrated Catchment Model (INCA) [49]historical flows, nitrogen and phosphorus concentration, population, GDP.flow scenarios CNRM-CM5, HadGEM2, GFDL, nitrogen and phosphorus concentration scenarios of GFDL.The growth of population and economy increases water use and sewage drainage, which increases the nitrogen and phosphorus concentrations in rivers. Extreme weather results in unstable flows.
Industrial Water Withdrawal (IWW) [32]population, GDP, industrial water use, energy efficiency in water production, carbon emissions.Industrial water consumption regression model, IWW export from CGE, carbon capture and storage, carbon tax.There are differences in industrial water-use scenarios with and without climate mitigation policies. The use of renewable energy reduces heat use, and a high carbon tax can reduce greenhouse gas emissions.
Land useLand-Use Scenario Dynamics-Urban (LUSD-Urban) Model [24]historical population data, land spatial distribution, urbanization rate, urban functional partition, temperature, precipitation, population, GDP.population and urban spatial distribution regression model, urban spatial distribution with SSPs, food production, carbon storage, water retention and air purification scenarios.The expansion of urban agglomerations occupies farmland and forest land. Building land is expanding. However, green plants and biomass are weakened, reducing ecosystem capacity, and service functions are correspondingly weakened [44].
NUFER (Nutrient Flows and Food Chain, Environment and Resources Use) Model [50]food consumption, production and distribution, poultry production, and grain production.nitrogen use efficiency, methane, nitrogen oxide emissions, nitrogen concentration projection scenarios in SSPs, N losses.The reduction in nitrogen loss results from increasing food production and consumption, such as increasing agricultural production efficiency and recycling of food production and the consumption chain.
Forest Resource Projection [51], Tree Yield Regression Modelpopulation, GDP, historical data on tree species and wood grades, temperature, precipitation, land-use spatial distribution.tree survival rate in SSPs and quantity of types of trees.Population growth, land use, human participation, and climate change mitigation policies will influence tree survival and numbers in the future.
EnergyREMIND/MAgPie [30]Population, GDP, energy structure, energy use efficiency, industrial structure. [52]greenhouse gas emissions scenarios, the demand of coal, oil, natural gas, and electrical energy in the future.The use of high-carbon energy resources and social technologies [53] affects emissions, and the emissions play an important role in meeting the temperature goal.