A Comparison of the Environmental Performance of Cooling and Heating among Different Household Types in China’s Hot Summer–Cold Winter Zone


Abstract
:1. Introduction
2. Methodology
2.1. An Integrated Assessment Framework
- Data collection. The first step prepares the required parameter data for the following simulation by a large sample questionnaire survey. Four types of data are needed. The basic building information is collected to support the development of a reference building model for the simulation. Typically, the average values and/or most common values of the samples are adopted. Demographic information of the household members, air-conditioner usage patterns, and daily schedules are the foundation for setting the occupant related parameters for the simulation.
- Energy simulation. This study uses simulation to obtain energy use data rather than referring to statistics [34,35] or conducting field monitoring [36,37]. An important advantage of simulation is that the other two types of driving factors can be controlled at fixed levels under various scenarios of occupant information and behaviors. Among the input parameters, climate data and building- and system-related data (as highlighted in yellow in Figure 1) are set as constant values during the whole simulation. The occupant-related data (as highlighted in green in Figure 1) are sample-specific. In this way, it is possible to just quantify the influences of occupant-related driving factors and exclude other factors’ influences. In addition, simulation is an effective and widely-used method to calculate energy levels and to guide designs [38,39]. In this integrated model, Designer’s Simulation Toolkit (DeST) [40] is recommended to conduct the simulation. Detailed introductions are provided in Section 2.3.
- Environmental impact assessment. The final step transforms the simulated energy consumption into damage indicator values using an EI assessment model. The Building Environmental Performance Analysis System (BEPAS) [41] is suggested to conduct the inventory analysis, characterization and weighting. Evaluators can choose other mature EI assessment models, such as Athena [42], Envest [43] and Building for Environmental and Economic Sustainability (BEES) [44], to complete this step according to their research goals and preferences.
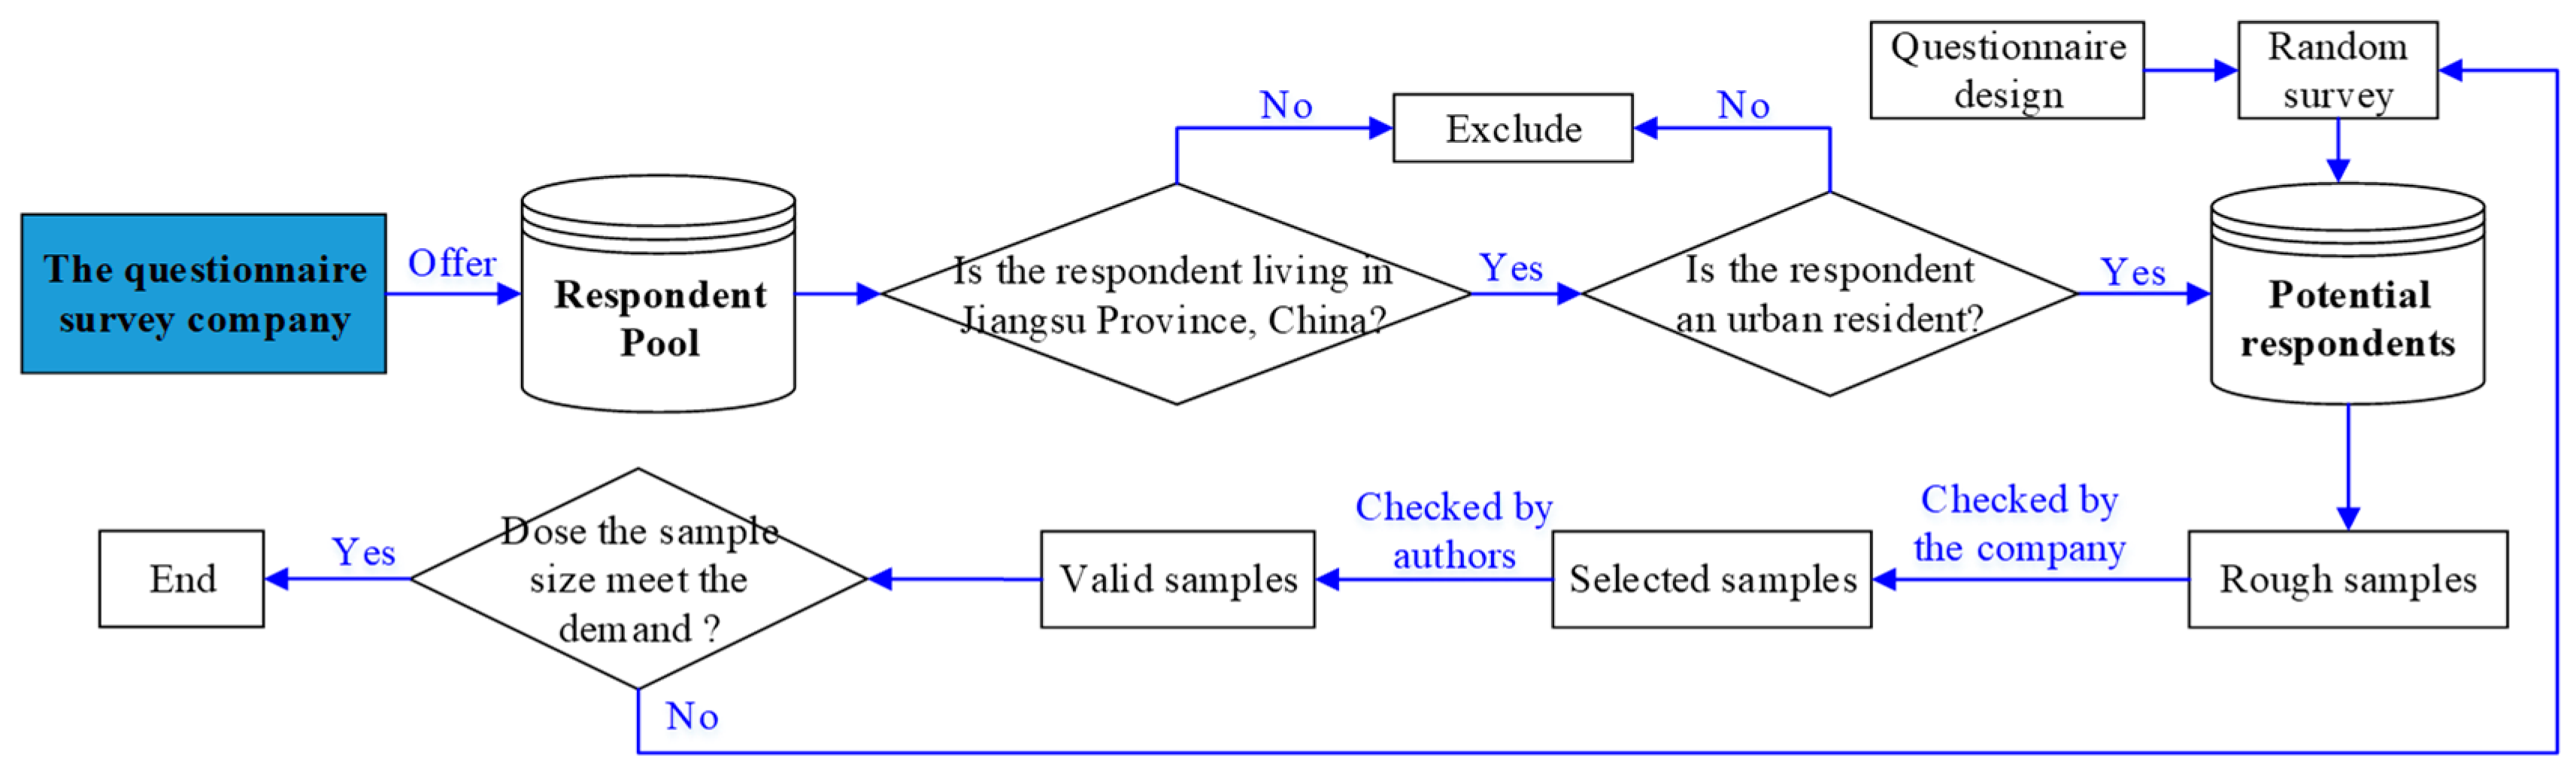
2.2. Questionnaire Survey
2.3. Energy Simulation
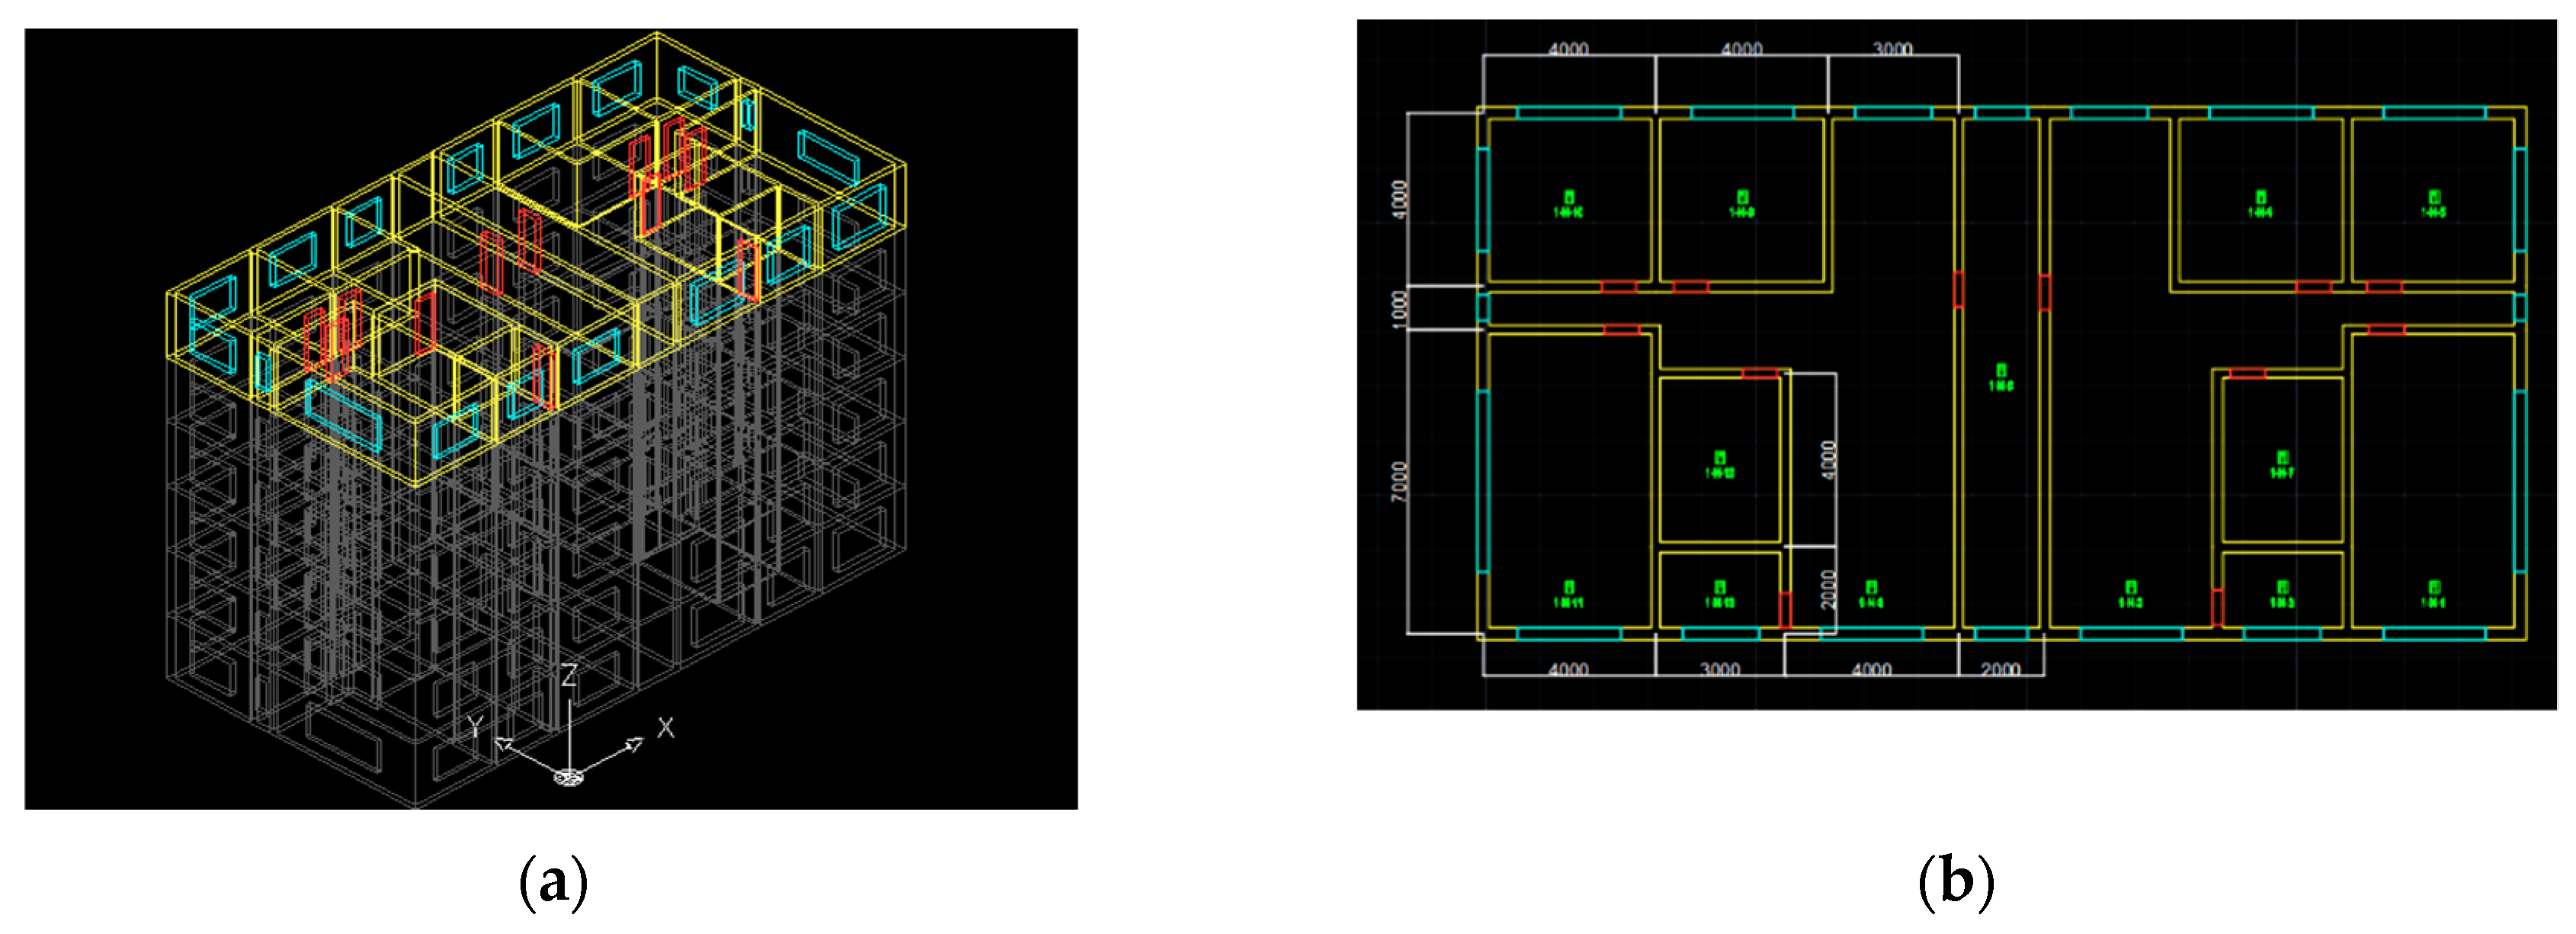
- Reference building development. First, a building model is developed in the software interface according to the architectural characteristics and parameters from surveyed samples as well as local standards.
- Parameters setting. The necessary parameters are set to support the energy simulation, including the outdoor climate parameters (the embedded weather data file in the DeST-h is used directly), building- and system-related parameters (location, orientation, component parameters, HVAC system, etc.), and occupant-related parameters (occupant schedule, turn-on and turn-off patterns of devices, probability functions of behaviors, etc.).
- Analog computation. Executing the commands to simulate the room temperature in a year and then output the related energy consumptions.
2.4. Environmental Impact Assessment
- Goal and scope definition. First, the intended application and reasons for conducting an assessment should be clearly stated, and the specific system boundary, functional unit, and level of detail need to be defined.
- Inventory analysis. This step transforms energy consumption data into inputs (the raw materials and primary energy required to realize functions) and outputs (consequent pollutant emissions to the air, water, soil and other environmental media). The use of region-specific inventory datasets of energy is significant in this step. The Chinese Life Cycle Database (CLCD) is recommended to support the inventory analysis. CLCD could provide different inventory datasets of energy in various regions of China considering the various power mix levels and power transmissions [32].
- Impact assessment. To understand and evaluate the magnitude and significance of potential EIs, classification, characterization and weighting are conducted in this step. The BEPAS model assigns different inputs and outputs to some ecological damage categories and resource-depletion categories, and then quantifies their potential impacts using characterization factors. The relative severity levels across different impact categories are then weighted using weighting factors, which are established by using the social willingness to pay approach. Finally, the EI values of different impact categories are all expressed in a unified monetary unit with economic meanings.
- Interpretation. This step analyzes the final results, reaches conclusions, explains limitations, and provides recommendations based on the findings.
3. A Study in Jiangsu Province
3.1. Data Collection
3.2. Energy Simulation
3.3. Environmental Performance Assessment
4. Results and Analysis
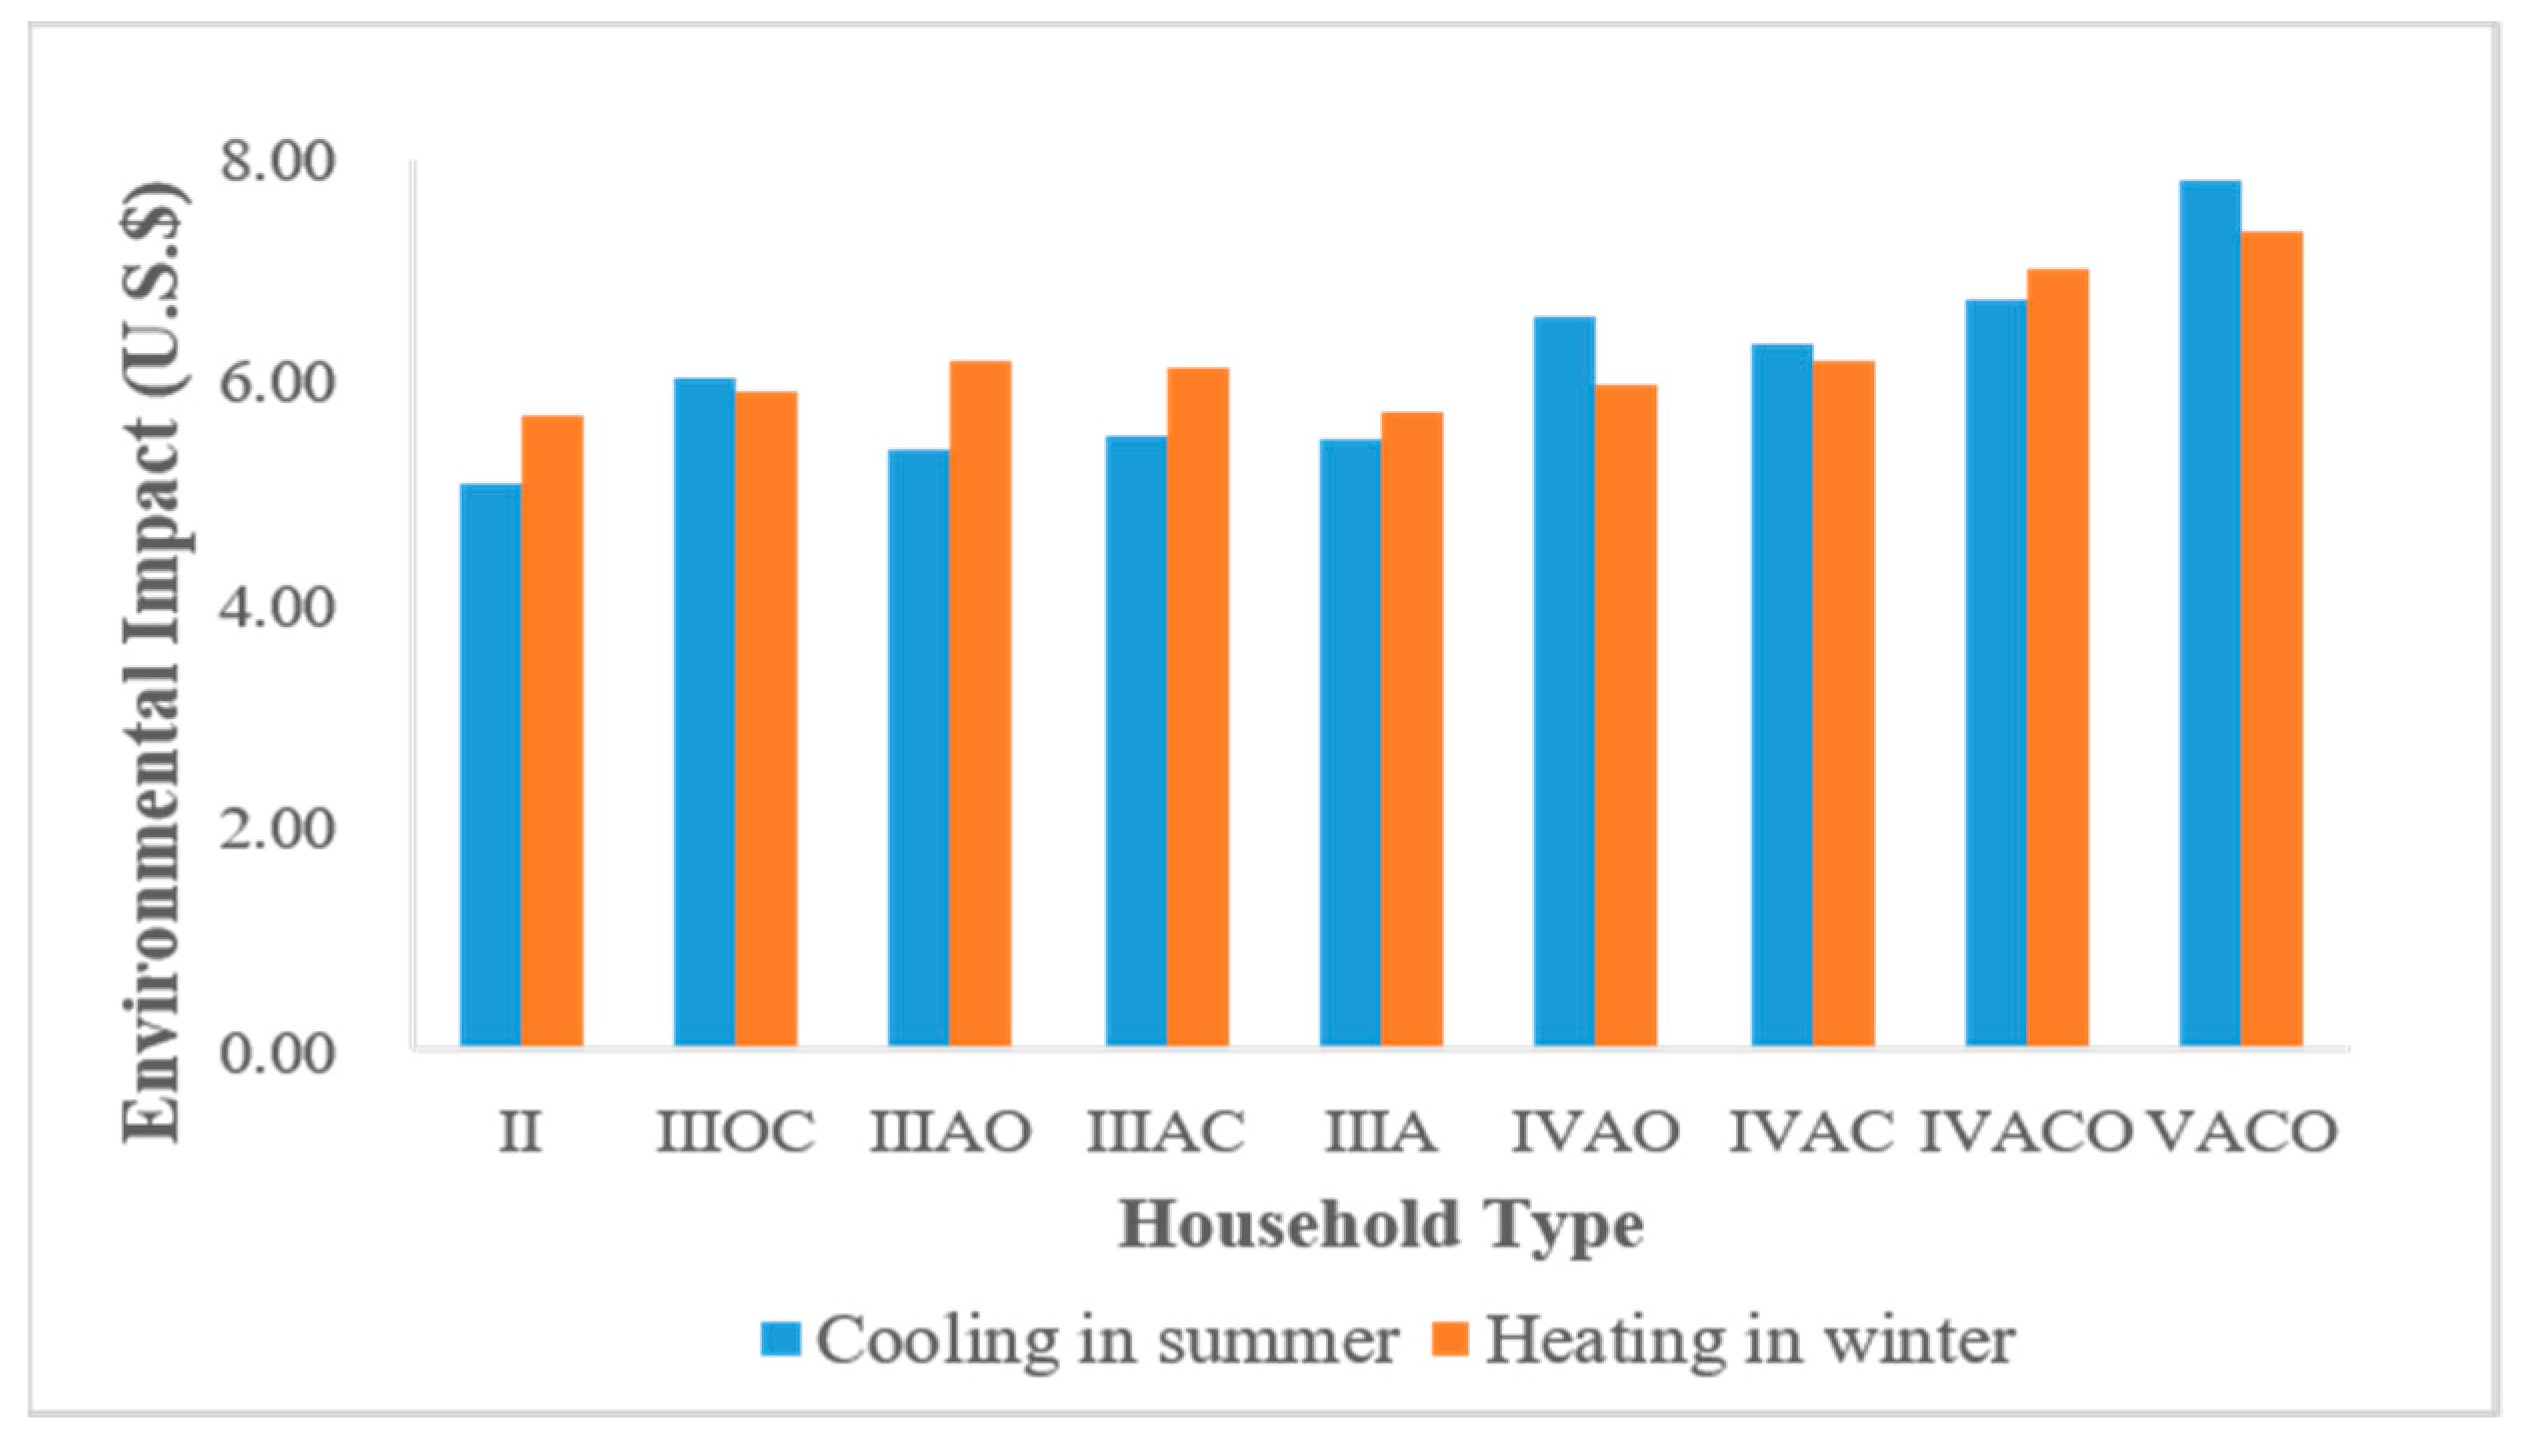
4.1. Environmental Impact (EI) Values of Different Household Types
4.2. EI Values of Different Impact Categories
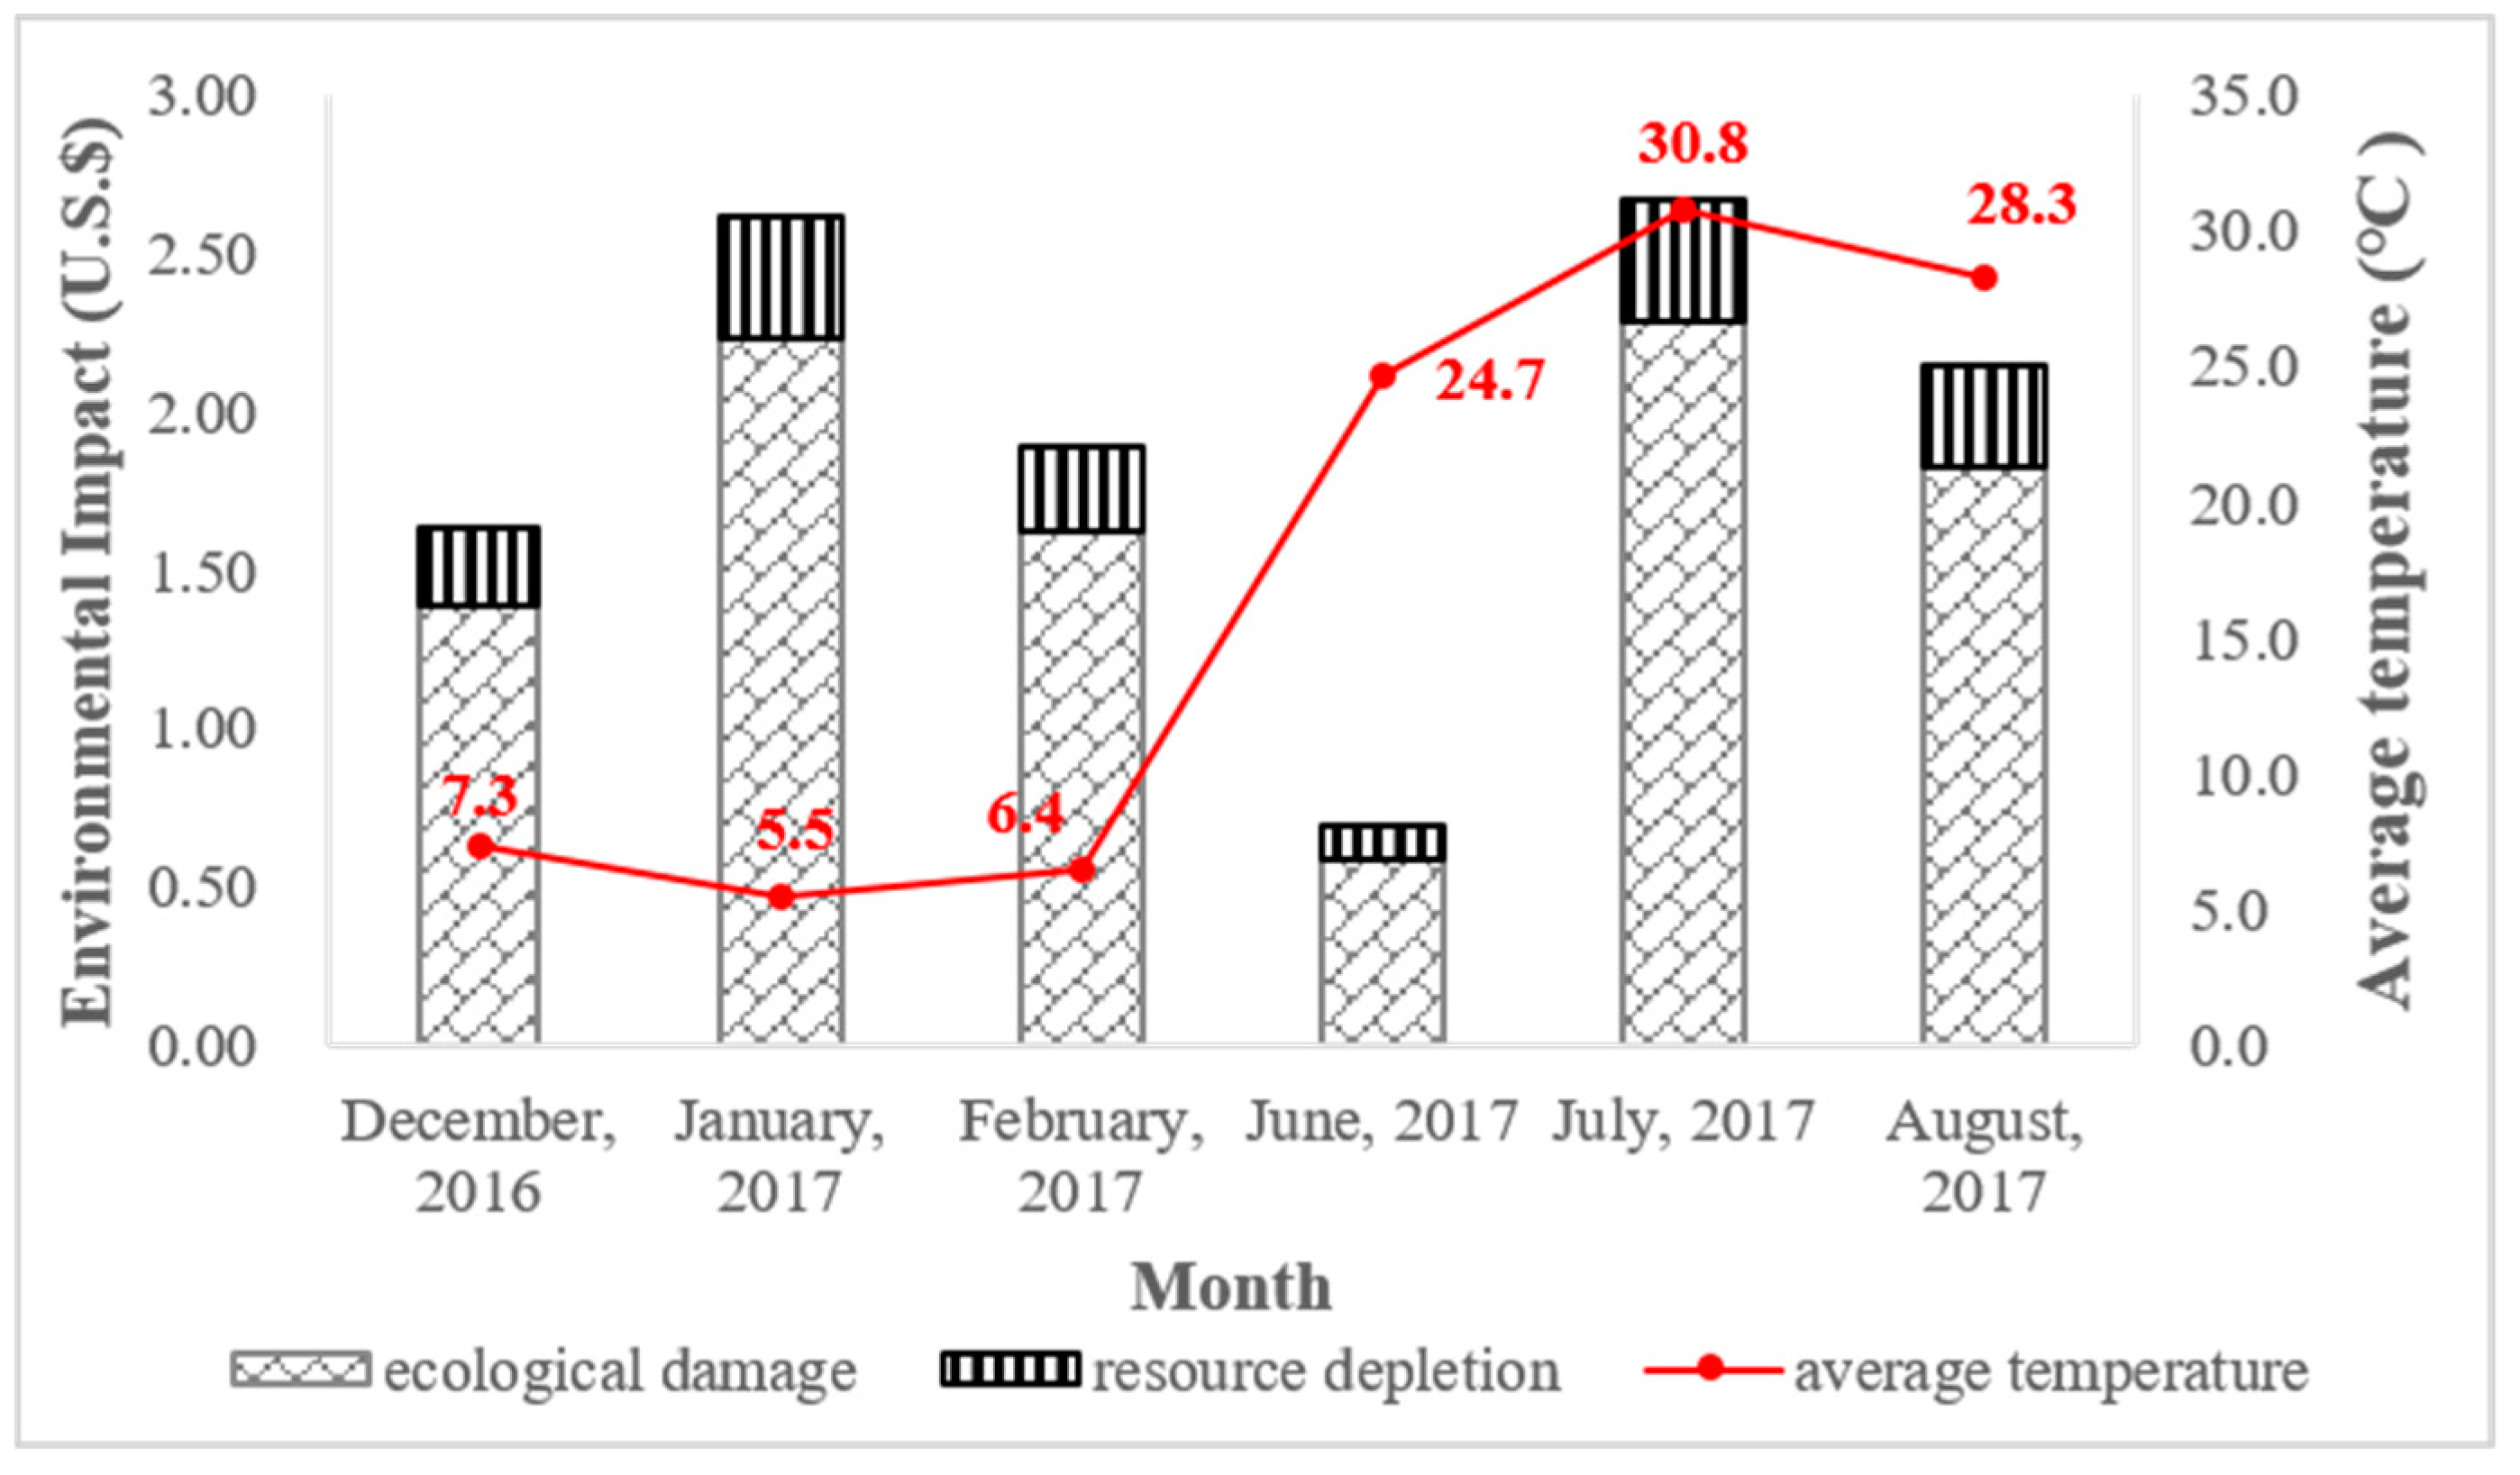
4.3. Monthly EI Values
4.4. Contribution Analysis
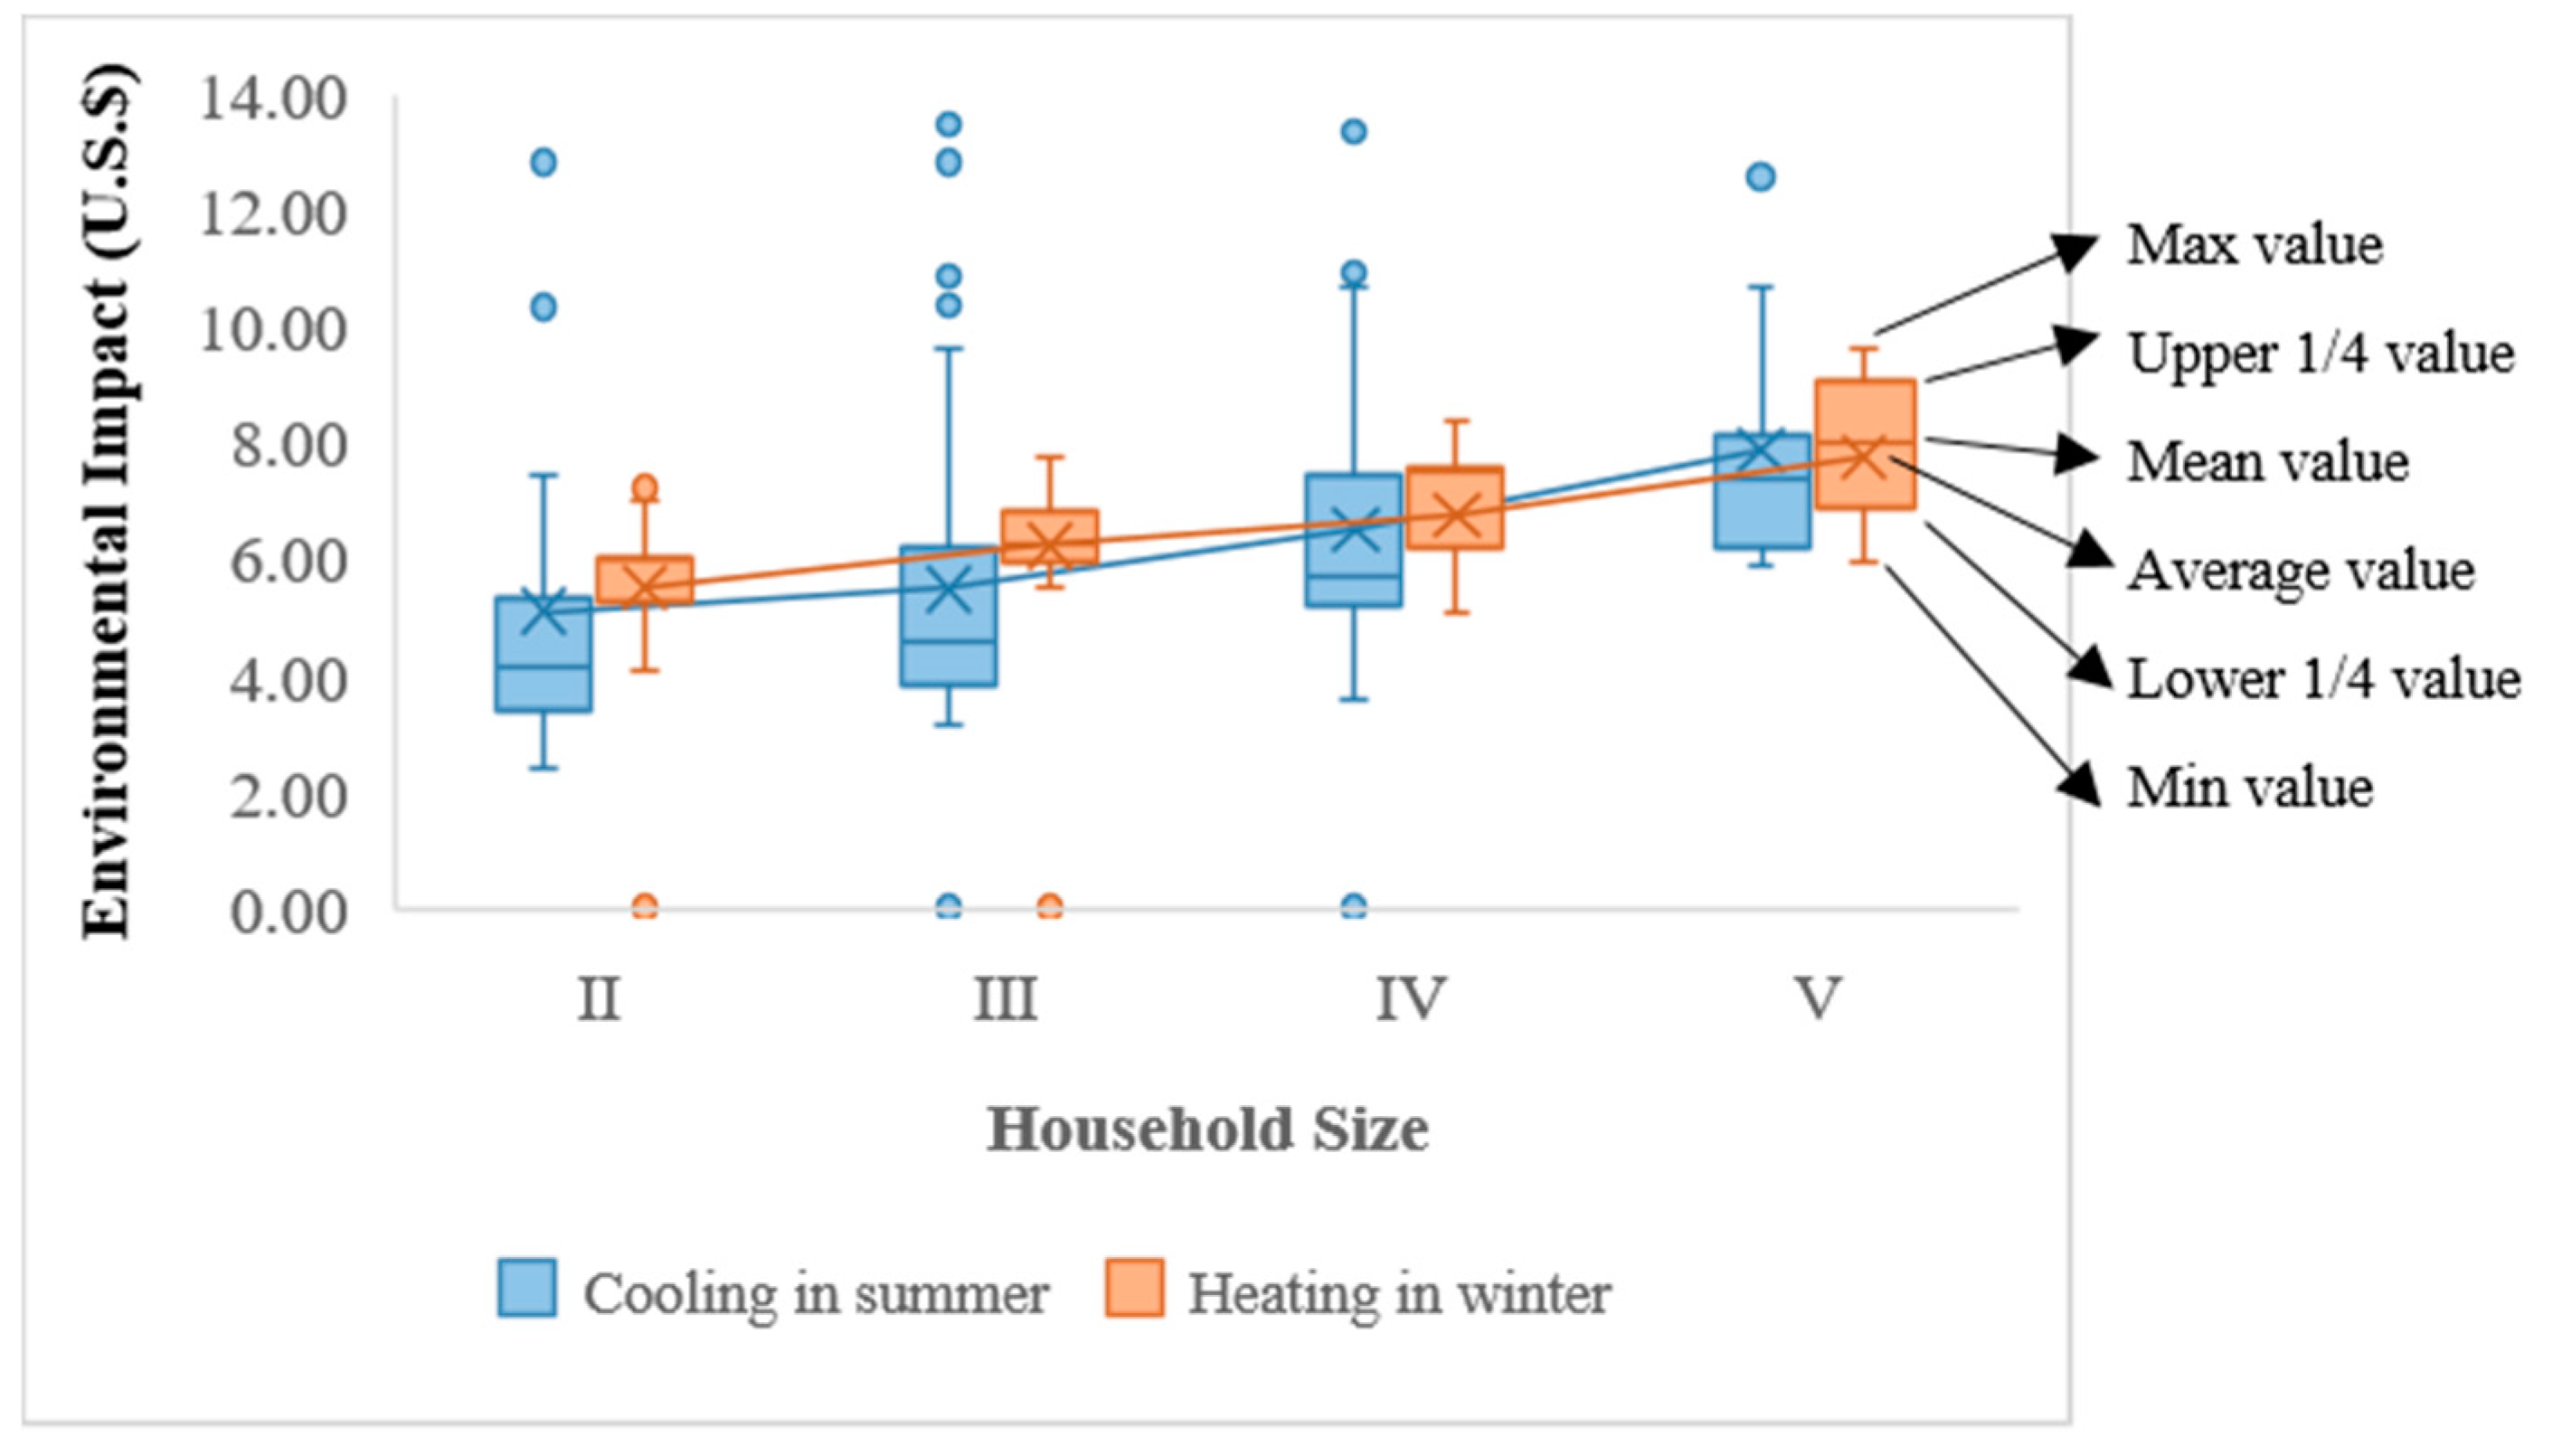
4.4.1. A Comparison among Households with Different Sizes
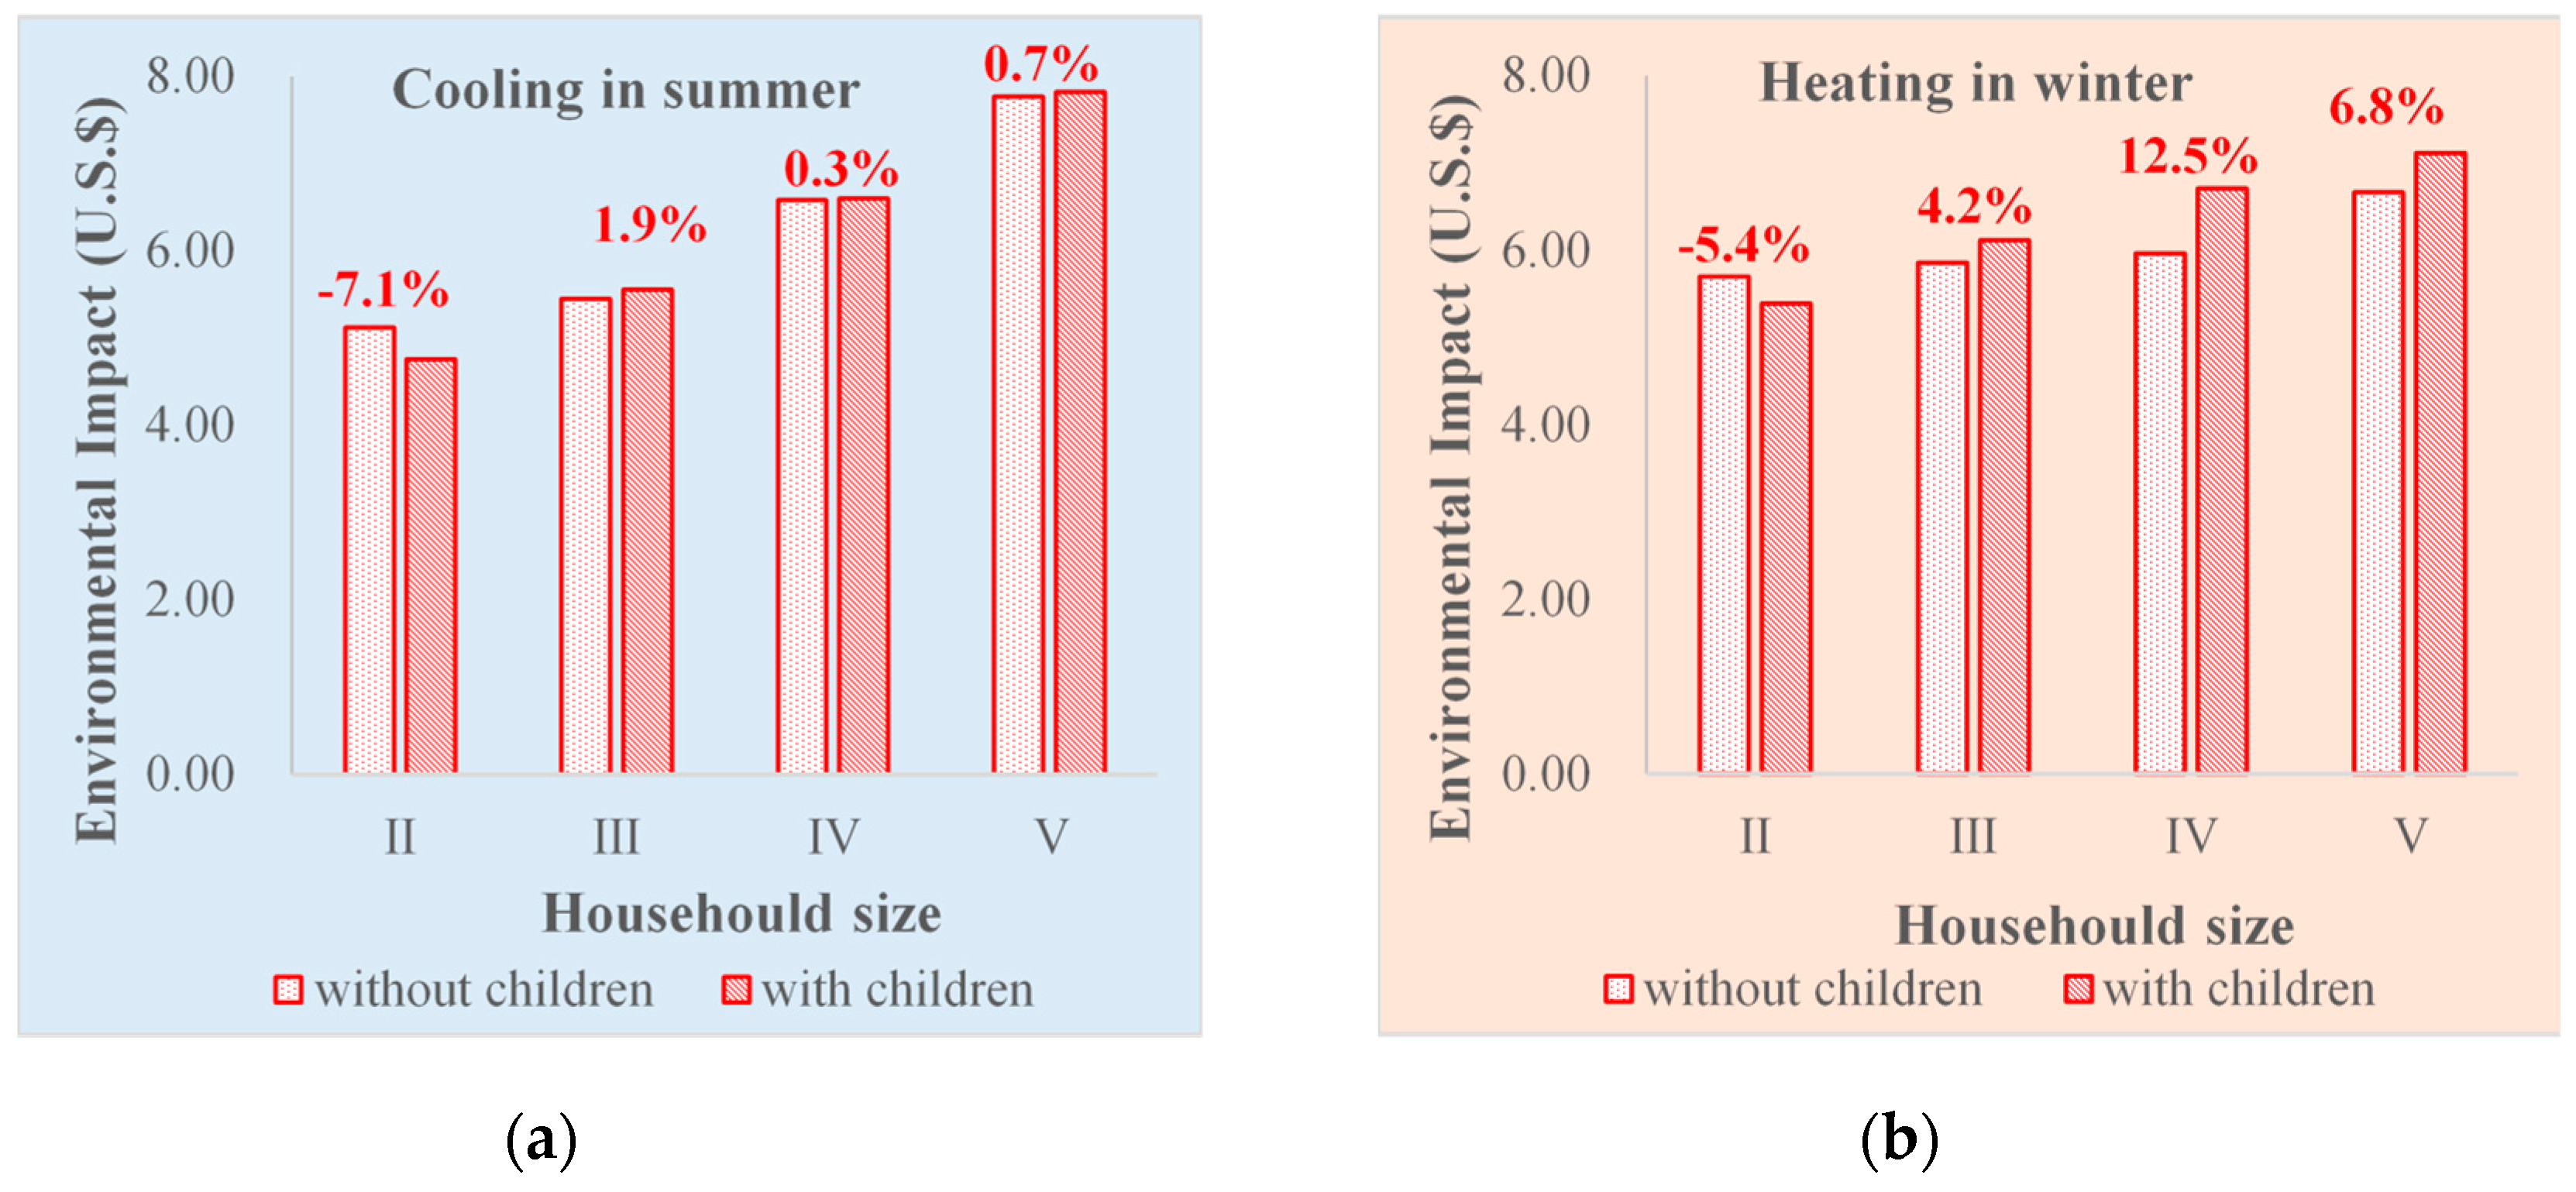
4.4.2. A Comparison among Households with Different Age Compositions
5. Discussion
6. Conclusions
Supplementary Materials
Author Contributions
Funding
Conflicts of Interest
Abbreviations
| BEPAS | Building Environmental Performance Analysis System |
| BEES | Building for Environmental and Economic Sustainability |
| CLCD | Chinese Life Cycle Database |
| DeST | Designer’s Simulation Toolkit |
| EIs | Environmental Impacts |
| EPS | Expanded Polystyrene |
| HVAC | Heating, Ventilation, and Air Conditioning |
| MOHRUD | Ministry of Housing and Rural-Urban Development |
References
- Shah, V.P.; Debella, D.C.; Ries, R.J. Life cycle assessment of residential heating and cooling systems in four regions in the United States. Energy Build. 2008, 40, 503–513. [Google Scholar] [CrossRef]
- Tsinghua University. 2017 Annual Report on China Building Energy Efficiency; China Architecture & Building Press: Beijing, China, 2017. (In Chinese) [Google Scholar]
- Cai, W.G.; Ren, H.; Cao, S.P. Decomposition analysis of driving factors for building energy consumption in China. Nat. Environ. Pollut. Technol. 2014, 13, 1–8. [Google Scholar]
- Pérez-Lombard, L.; Ortiz, J.E.; Pout, C. A review on buildings energy consumption information. Energy Build. 2008, 40, 394–398. [Google Scholar] [CrossRef]
- Hong, T.Z.; Chou, S.K.; Bong, T.Y. Building simulation: An overview of developments and information sources. Build. Environ. 2000, 35, 347–361. [Google Scholar] [CrossRef]
- Peng, C.; Yan, D.; Wu, R.H.; Wang, C.; Zhou, X.; Jiang, Y. Quantitative description and simulation of human behavior in residential buildings. In Proceedings of Building Simulation; Tsinghua University Press: Beijing, China, 2012; pp. 85–94. [Google Scholar]
- Wei, S.; Jones, R.; De Wilde, P. Driving factors for occupant-controlled space heating in residential buildings. Energy Build. 2014, 70, 36–44. [Google Scholar] [CrossRef] [Green Version]
- Su, S.; Li, X.D.; Zhu, Y.M.; Lin, B.R. Dynamic LCA framework for environmental impact assessment of buildings. Energy Build. 2017, 149, 310–320. [Google Scholar] [CrossRef]
- Chen, S.Q.; Yang, W.W.; Yoshino, H.; Levine, M.D.; Newhouse, K.; Hinge, A. Definition of occupant behavior in residential buildings and its application to behavior analysis in case studies. Energy Build. 2015, 104, 1–13. [Google Scholar] [CrossRef]
- Hong, T.Z.; Taylor-Lange, S.C.; D’Oca, S.; Yan, D.; Corgnati, S.P. Advances in research and applications of energy-related occupant behavior in buildings. Energy Build. 2016, 116, 694–702. [Google Scholar] [CrossRef] [Green Version]
- Li, Z.J.; Jiang, Y.; Wei, Q.P. Survey on energy consumption of air conditioning in summer in a residential building in Beijing. J. Heat. Vent. Air Cond. 2007, 37, 46–51. (In Chinese) [Google Scholar]
- Feng, X.H.; Yan, D.; Wang, C.; Sun, H.S. A preliminary research on the derivation of typical occupant behavior based on large-scale questionnaire surveys. Energy Build. 2016, 117, 332–340. [Google Scholar] [CrossRef]
- Delzendeh, E.; Wu, S.; Lee, A.; Zhou, Y. The impact of occupants’ behaviours on building energy analysis: A research review. Renew. Sustain. Energy Rev. 2017, 80, 1061–1071. [Google Scholar] [CrossRef]
- Hong, T.Z.; Chen, Y.X.; Belafi, Z.; D’Oca, S. Occupant behavior models: A critical review of implementation and representation approaches in building performance simulation programs. In Proceedings of Building Simulation; Tsinghua University Press: Beijing, China, 2018; pp. 1–14. [Google Scholar]
- Xu, L.Y.; Liu, J.J.; Pei, J.J.; Han, X. Building energy saving potential in Hot Summer and Cold Winter (HSCW) Zone, China—Influence of building energy efficiency standards and implications. Energy Policy 2013, 57, 253–262. [Google Scholar] [CrossRef]
- Wang, Z.; Zhao, Z.; Lin, B.R.; Zhu, Y.X.; Ouyang, Q. Residential heating energy consumption modeling through a bottom-up approach for China’s Hot Summer–Cold Winter climatic region. Energy Build. 2015, 109, 65–74. [Google Scholar] [CrossRef]
- French, L.; Camilleri, M.; Isaacs, N.; Pollard, A. Temperatures and heating energy in New Zealand houses from a nationally representative study—HEEP. Energy Build. 2007, 39, 770–782. [Google Scholar] [CrossRef]
- Andersen, R.V.; Olesen, B.W.; Toftum, J. Modelling occupants’ heating set-point prefferences. In Proceedings of the 12th Conference of International Building Performance Simulation Association, Sydney, Australia, 14–16 November 2011; pp. 1451–1456. [Google Scholar]
- Santin, O.G.; Itard, L.; Visscher, H. The effect of occupancy and building characteristics on energy use for space and water heating in Dutch residential stock. Energy Build. 2009, 41, 1223–1232. [Google Scholar] [CrossRef]
- Gram-Hanssen, K. Residential heat comfort practices: Understanding users. Build. Res. Inf. 2010, 38, 175–186. [Google Scholar] [CrossRef]
- Shipworth, M.; Firth, S.K.; Gentry, M.I.; Wright, A.J.; Shipworth, D.T.; Lomas, K.J. Central heating thermostat settings and timing: Building demographics. Build. Res. Inf. 2010, 38, 50–69. [Google Scholar] [CrossRef]
- Guerra-Santin, O.; Itard, L. Occupants’ behaviour: Determinants and effects on residential heating consumption. Build. Res. Inf. 2010, 38, 318–338. [Google Scholar] [CrossRef]
- Andersen, R.V.; Toftum, J.; Andersen, K.K.; Olesen, B.W. Survey of occupant behaviour and control of indoor environment in Danish dwellings. Energy Build. 2009, 41, 11–16. [Google Scholar] [CrossRef]
- Steemers, K.; Yun, G.Y. Household energy consumption: A study of the role of occupants. Build. Res. Inf. 2009, 37, 625–637. [Google Scholar] [CrossRef]
- Department of Economics and Social Affairs U.N. World Population Prospects 2015; Department of Economics and Social Affairs U.N.: New York, NY, USA, 2015.
- Oreszczyn, T.; Hong, S.H.; Ridley, I.; Wilkinson, P. The Warm Front Study Group, Determinants of winter indoor temperatures in low income households in England. Energy Build. 2006, 38, 245–252. [Google Scholar] [CrossRef]
- Sardianou, E. Estimating space heating determinants: An analysis of Greek households. Energy Build. 2008, 40, 1084–1093. [Google Scholar] [CrossRef]
- Pu, Q.P.; Li, B.Z. Impact factors analysis of residential buildings’ energy consumption in Huainan. In Proceedings of the IEEE International Conference on Remote Sensing, Nanjing, China, 24–26 June 2011; pp. 1278–1281. [Google Scholar]
- Kane, T.; Firth, S.K.; Allinson, D.; Irvine, K.; Lomas, K.J. Does the Age of the Residents Influence Occupant Heating Practice in UK Domestic Buildings? In Proceedings of the East Midlands Universities Association 2010 Conference—Perspectives in Society: Health, Culture and the Environment, Leicester, UK, 14 September 2010. 8p. [Google Scholar]
- Liao, H.; Chang, T. Space-heating and water-heating energy demands of the aged in the US. Energy Econ. 2002, 24, 267–284. [Google Scholar] [CrossRef]
- Dixit, M.K.; Fernández-Solís, J.L.; Lavy, S.; Culp, C.H. Identification of parameters for embodied energy measurement: A literature review. Energy Build. 2010, 42, 1238–1247. [Google Scholar] [CrossRef]
- Integrated Knowledge for our Environment (IKE). A Life-Cycle Model of Chinese Grid Power and Its Application to the Life Cycle Impact Assessment of Primary Aluminium. Available online: http://www.world-aluminium.org/publications/ (accessed on 23 May 2019).
- Yu, X.Q.; Yan, D.; Sun, K.Y.; Hong, T.Z.; Zhu, D.D. Comparative study of the cooling energy performance of variable refrigerant flow systems and variable air volume systems in office buildings. Appl. Energy 2016, 183, 725–736. [Google Scholar] [CrossRef] [Green Version]
- Roux, C.; Schalbart, P.; Peuportier, B. Accounting for temporal variation of electricity production and consumption in the LCA of an energy-efficient house. J. Clean. Prod. 2016, 113, 532–540. [Google Scholar] [CrossRef]
- Collinge, W.O.; Rickenbacker, H.J.; Landis, A.E.; Thiel, C.L.; Bilec, M.M. Dynamic life cycle assessments of a conventional green building and a net zero energy building: Exploration of static, dynamic, attributional, and consequential electricity grid models. Environ. Sci. Technol. 2018, 52, 11429–11438. [Google Scholar] [CrossRef]
- Collinge, W.O.; Landis, A.E.; Jones, A.K.; Schaefer, L.A.; Bilec, M.M. Indoor environmental quality in a dynamic life cycle assessment framework for whole buildings: Focus on human health chemical impacts. Build. Environ. 2013, 62, 182–190. [Google Scholar] [CrossRef]
- Collinge, W.O.; Landis, A.E.; Jones, A.K.; Schaefer, L.A.; Bilec, M.M. Productivity metrics in dynamic LCA for whole buildings: Using a post-occupancy evaluation of energy and indoor environmental quality tradeoffs. Build. Environ. 2014, 82, 339–348. [Google Scholar] [CrossRef]
- Zhu, D.D.; Hong, T.Z.; Yan, D.; Wang, C. A detailed loads comparison of three building energy modeling programs: EnergyPlus, DeST and DOE-2.1E. In Proceedings of Building Simulation; Tsinghua University Press: Beijing, China, 2013; pp. 323–335. [Google Scholar]
- de Souza, C.B. Contrasting paradigms of design thinking: The building thermal simulation tool user vs. the building designer. Autom. Constr. 2012, 22, 112–122. [Google Scholar] [CrossRef]
- Tsinghua University, Designer’s Simulation Toolkit (DEST). 2014. Available online: http://dest.tsinghua.edu.cn/ (accessed on 23 March 2018).
- Zhang, Z.H.; Wu, X.; Yang, X.M.; Zhu, Y.M. BEPAS—A life cycle building environmental performance assessment model. Build. Environ. 2006, 41, 669–675. [Google Scholar] [CrossRef]
- Athena Sustainable Materials Institute. Athena Impact Estimator for Buildings. Available online: http://www.athenasmi.org/our-software-data/impact-estimator/ (accessed on 14 June 2019).
- Building Research Establishment. Envest. Available online: http://envestv2.bre.co.uk/account.jsp (accessed on 14 June 2019).
- Lippiatt, B.C. BEES 4.0. Building for Environmental and Economic Sustainability Technical Manual and User Guide; National Institute of Standards and Technology: Gaithersburg, MD, USA; Building and Fire Research Laboratory: Gaithersburg, MD, USA, 2007. [Google Scholar]
- Ren, X.X.; Yan, D.; Wang, C. Air-conditioning usage conditional probability model for residential buildings. Build. Environ. 2014, 81, 172–182. [Google Scholar] [CrossRef]
- Wang, C. Simulation Research on Occupant Energy-Related Behaviors in Building; Tsinghua University: Beijing, China, 2014. (In Chinese) [Google Scholar]
- Yan, D.; Xia, J.J.; Tang, W.Y.; Song, F.T.; Zhang, X.L.; Jiang, Y. DeST—An integrated building simulation toolkit Part I: Fundamentals. In Proceedings of Building Simulation; Tsinghua University Press: Beijing, China, 2008; pp. 95–110. [Google Scholar]
- DeST Development Team. Manual of DeST-h; Tsinghua University Press: Beijing, China, 2004. [Google Scholar]
- Ministry of Housing and Urban-Rural Development of the People’s Republic of China (MOHURD). GB/T 50378-2014 Assessment standard for green building; China Architecture & Building Press: Beijing, China, 2014. (In Chinese)
- MOHURD. GB/T 50640-2010 Evaluation Standard for Green Construction of Buildings; China Planning Press: Beijing, China, 2011. (In Chinese)
- Li, X.D.; Su, S.; Zhang, Z.H.; Kong, X.Q. An integrated environmental and health performance quantification model for pre-occupancy phase of buildings in China. Environ. Impact Asses. 2017, 63, 1–11. [Google Scholar] [CrossRef]
- Li, X.D.; Su, S.; Shi, J.; Zhang, Z.H. An environmental impact assessment framework and index system for the pre-use phase of buildings based on distance-to-target approach. Build. Environ. 2015, 85, 173–181. [Google Scholar] [CrossRef]
- Su, S.; Zhu, C.; Li, X.D. A dynamic weighting system considering temporal variations using the DTT approach in LCA of buildings. J. Clean. Prod. 2019, 220, 398–407. [Google Scholar] [CrossRef]
- Cao, X.Y.; Li, X.D.; Zhu, Y.M.; Zhang, Z.H. A comparative study of environmental performance between prefabricated and traditional residential buildings in China. J. Clean. Prod. 2015, 109, 131–143. [Google Scholar] [CrossRef]
- Li, X.D.; Su, S.; Gao, Y.X.; Zhang, Z.H. Environmental impacts of residential buildings having differents structures. J. Tsinghua Univ. (Sci. Technol.) 2013, 9, 1255–1260. (In Chinese) [Google Scholar]
- Su, S.; Li, X.D.; Wang, T.; Zhu, Y.M. A comparative study of environmental performance between CFST and RC columns under combinations of compression and bending. J. Clean. Prod. 2016, 137, 10–20. [Google Scholar] [CrossRef] [Green Version]
- Zhu, C.; Chang, Y.; Su, S.; Li, X.D.; Zhang, Z.H. Development of qL-EIV interactive curves for comparison of the environmental performance of composite slabs and RC slabs from the perspective of mechanical features. Sci. Total Environ. 2019, 683, 508–523. [Google Scholar] [CrossRef]
- International Standardization Organization (ISO). ISO 14042 Environmental Management-Life Cycle Assessment-Life Cycle Impact Assessment; International Standardization Organization: Geneva, Switzerland, 2001. [Google Scholar]
- Statistics Bureau of Jiangsu Province. 2017 Jiangsu Statistical Yearbook; Statistics Bureau of Jiangsu Province: Nanjing, China, 2017. (In Chinese)
- Housing and Urban-Rural Construction Department of Jiangsu Province. DGJ32J 71-2014 Design Standard of Thermo-Environment and Conservation for Residential Buildings in Jiangsu Province; Phoenix Science Press: Nanjing, China, 2014. (In Chinese)
- IKE. Chinese Life Cycle Database. (In Chinese). Available online: http://www.ike-global.com/products-2/chinese-lca-database-clcd (accessed on 19 June 2019).


| Part | Investigated Data |
|---|---|
| Basic building information | Floor area, building age, etc. |
| Demographic information | Family member number, number of unemployed elderly people, number of children younger than 15 years old, household income, age and gender of the household’s head, etc. |
| Occupant daily schedules | Uninhabited days, occupancy time (hours in a day) on weekdays and weekends, etc. |
| Usage patterns of air conditioner | Power of the air conditioner, turn on pattern in summer, turn off pattern in summer, temperature setting in summer, turn on pattern in winter, turn off pattern in winter, temperature setting in winter, etc. |
| Household Type | Household Size | Age Composition | Proportion of Samples | |||
|---|---|---|---|---|---|---|
| Adults | Old Persons | Children | Cooling in Summer | Heating in Winter | ||
| II | 2 | − | − | − | 7.56% | 10.51% |
| IIIOC | 3 | × | √ | √ | 50.31% | 48.39% |
| IIIAO | √ | √ | × | |||
| IIIAC | √ | × | √ | |||
| IIIA | √ | × | × | |||
| IVAC | 4 | √ | × | √ | 22.78% | 21.29% |
| IVAO | √ | √ | × | |||
| IVACO | √ | √ | √ | |||
| VACO | 5 | √ | √ | √ | 19.35% | 19.81% |
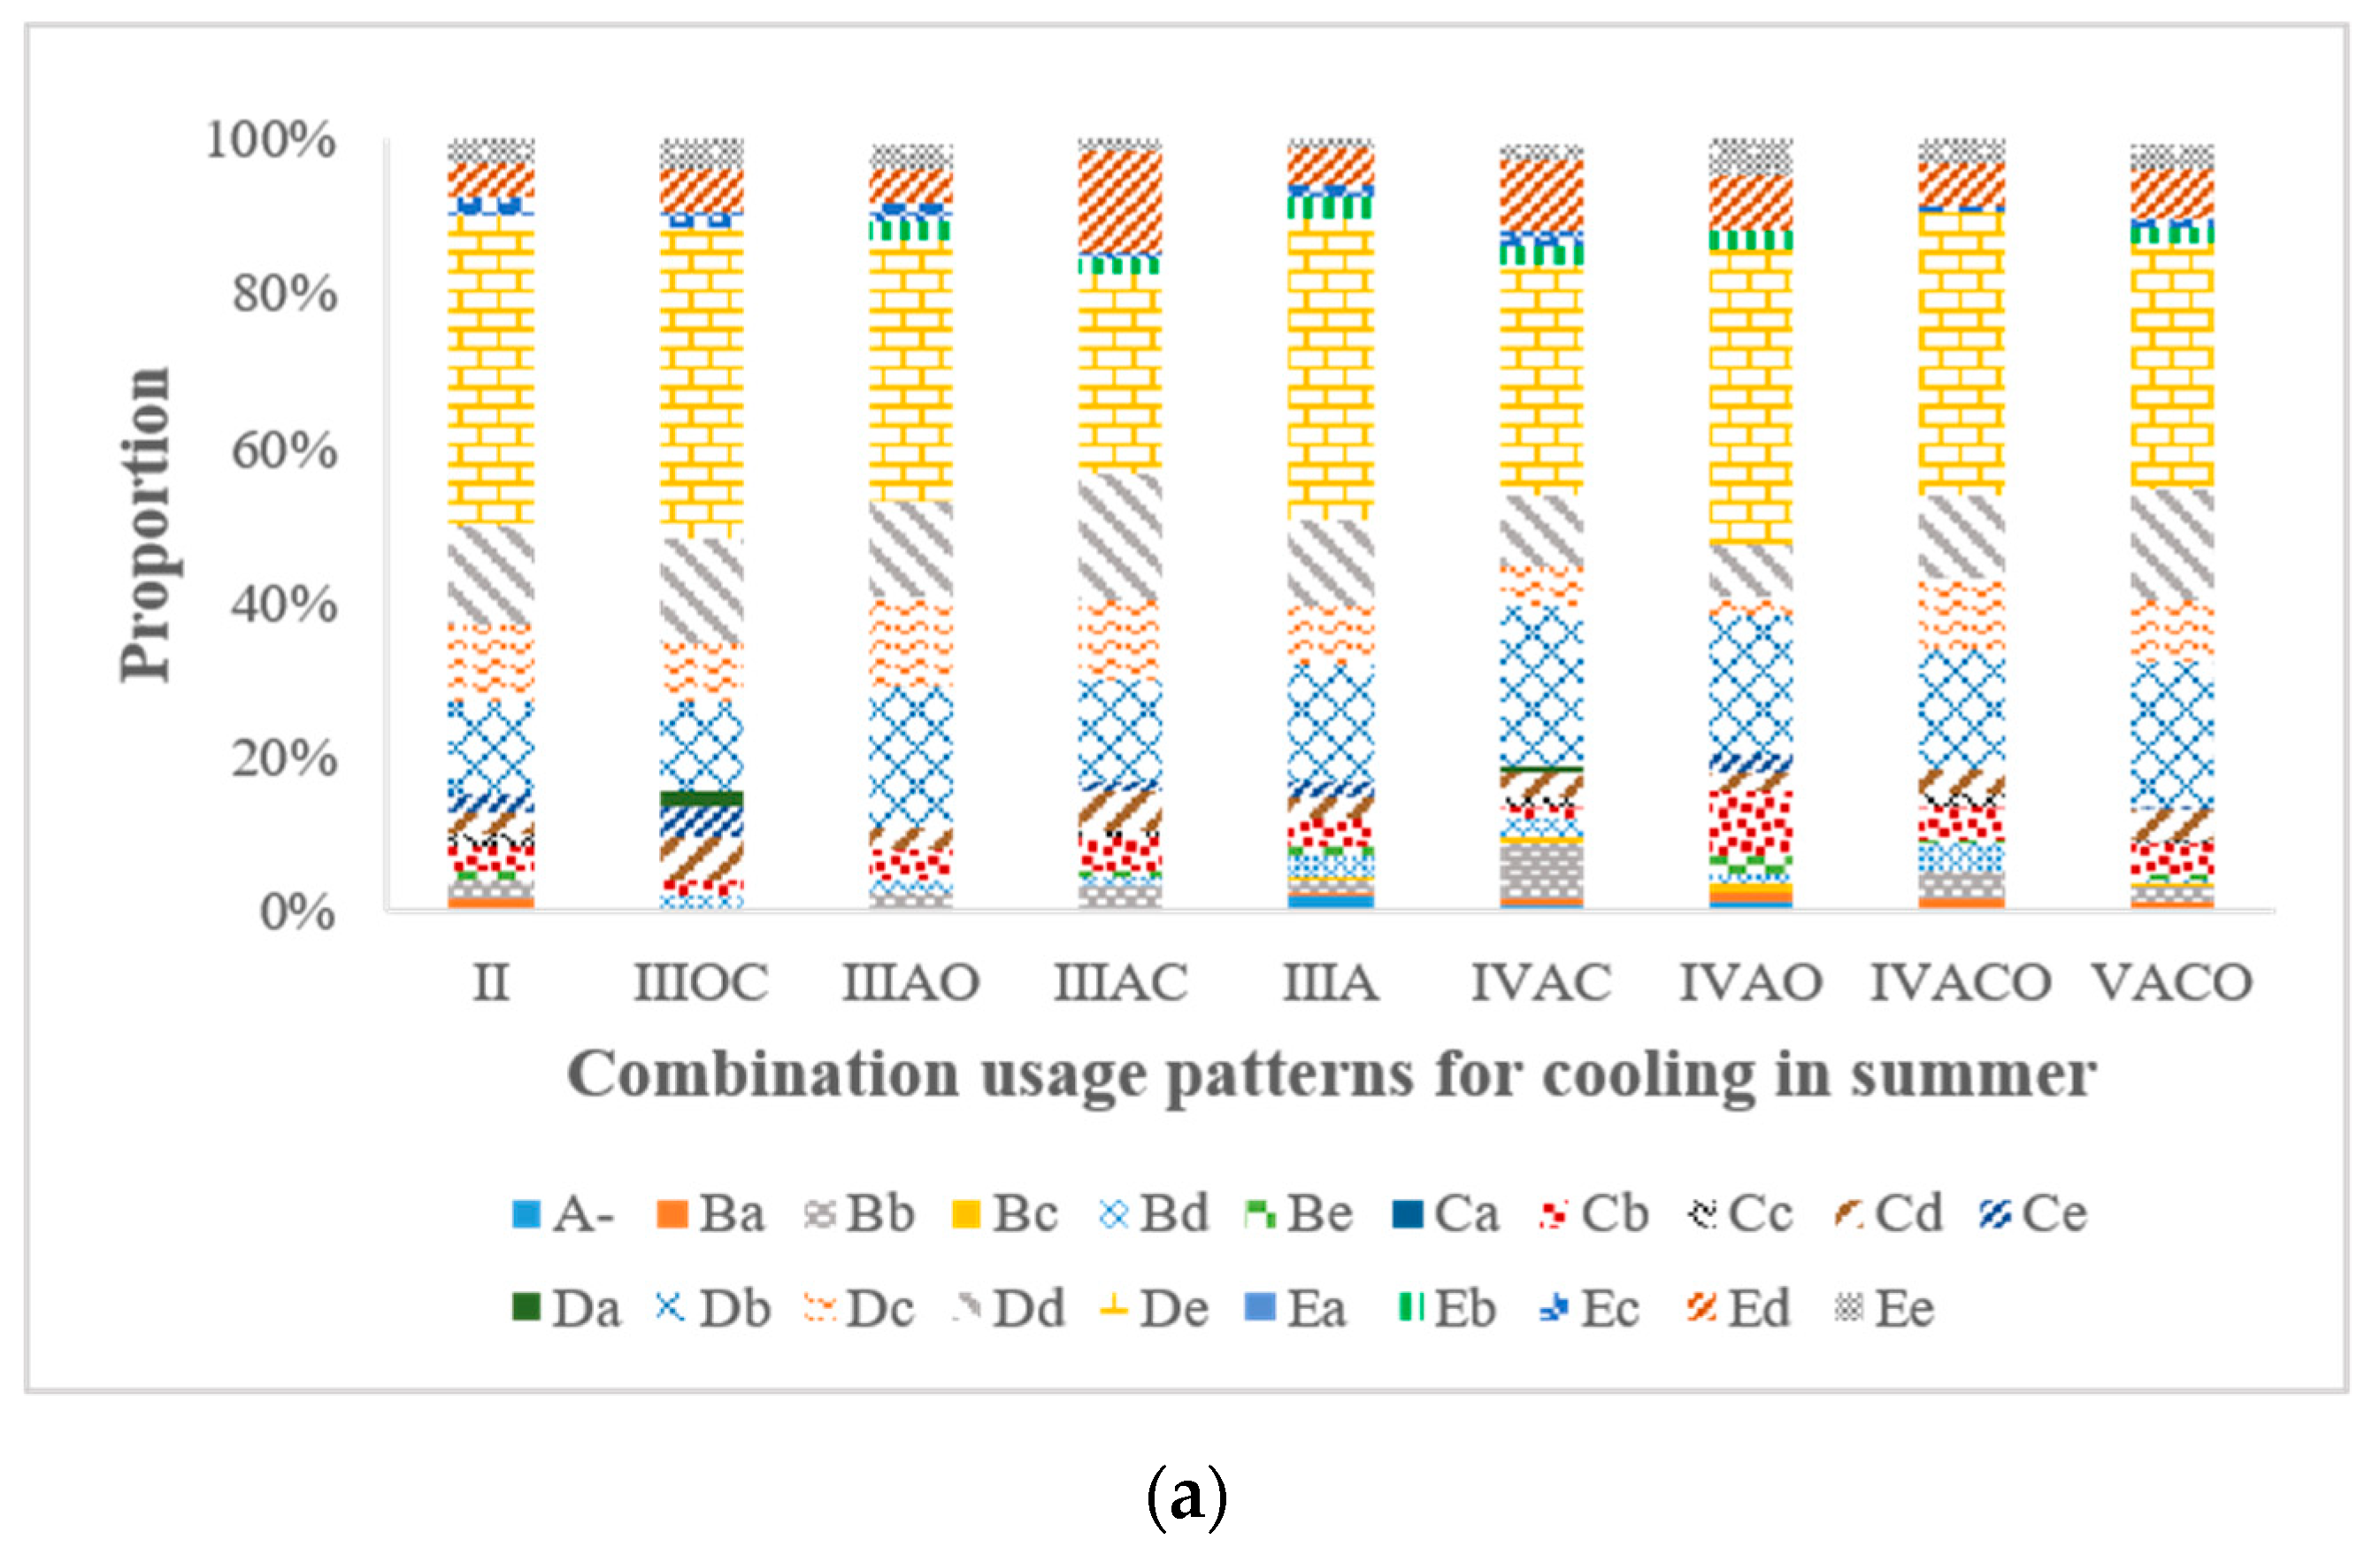
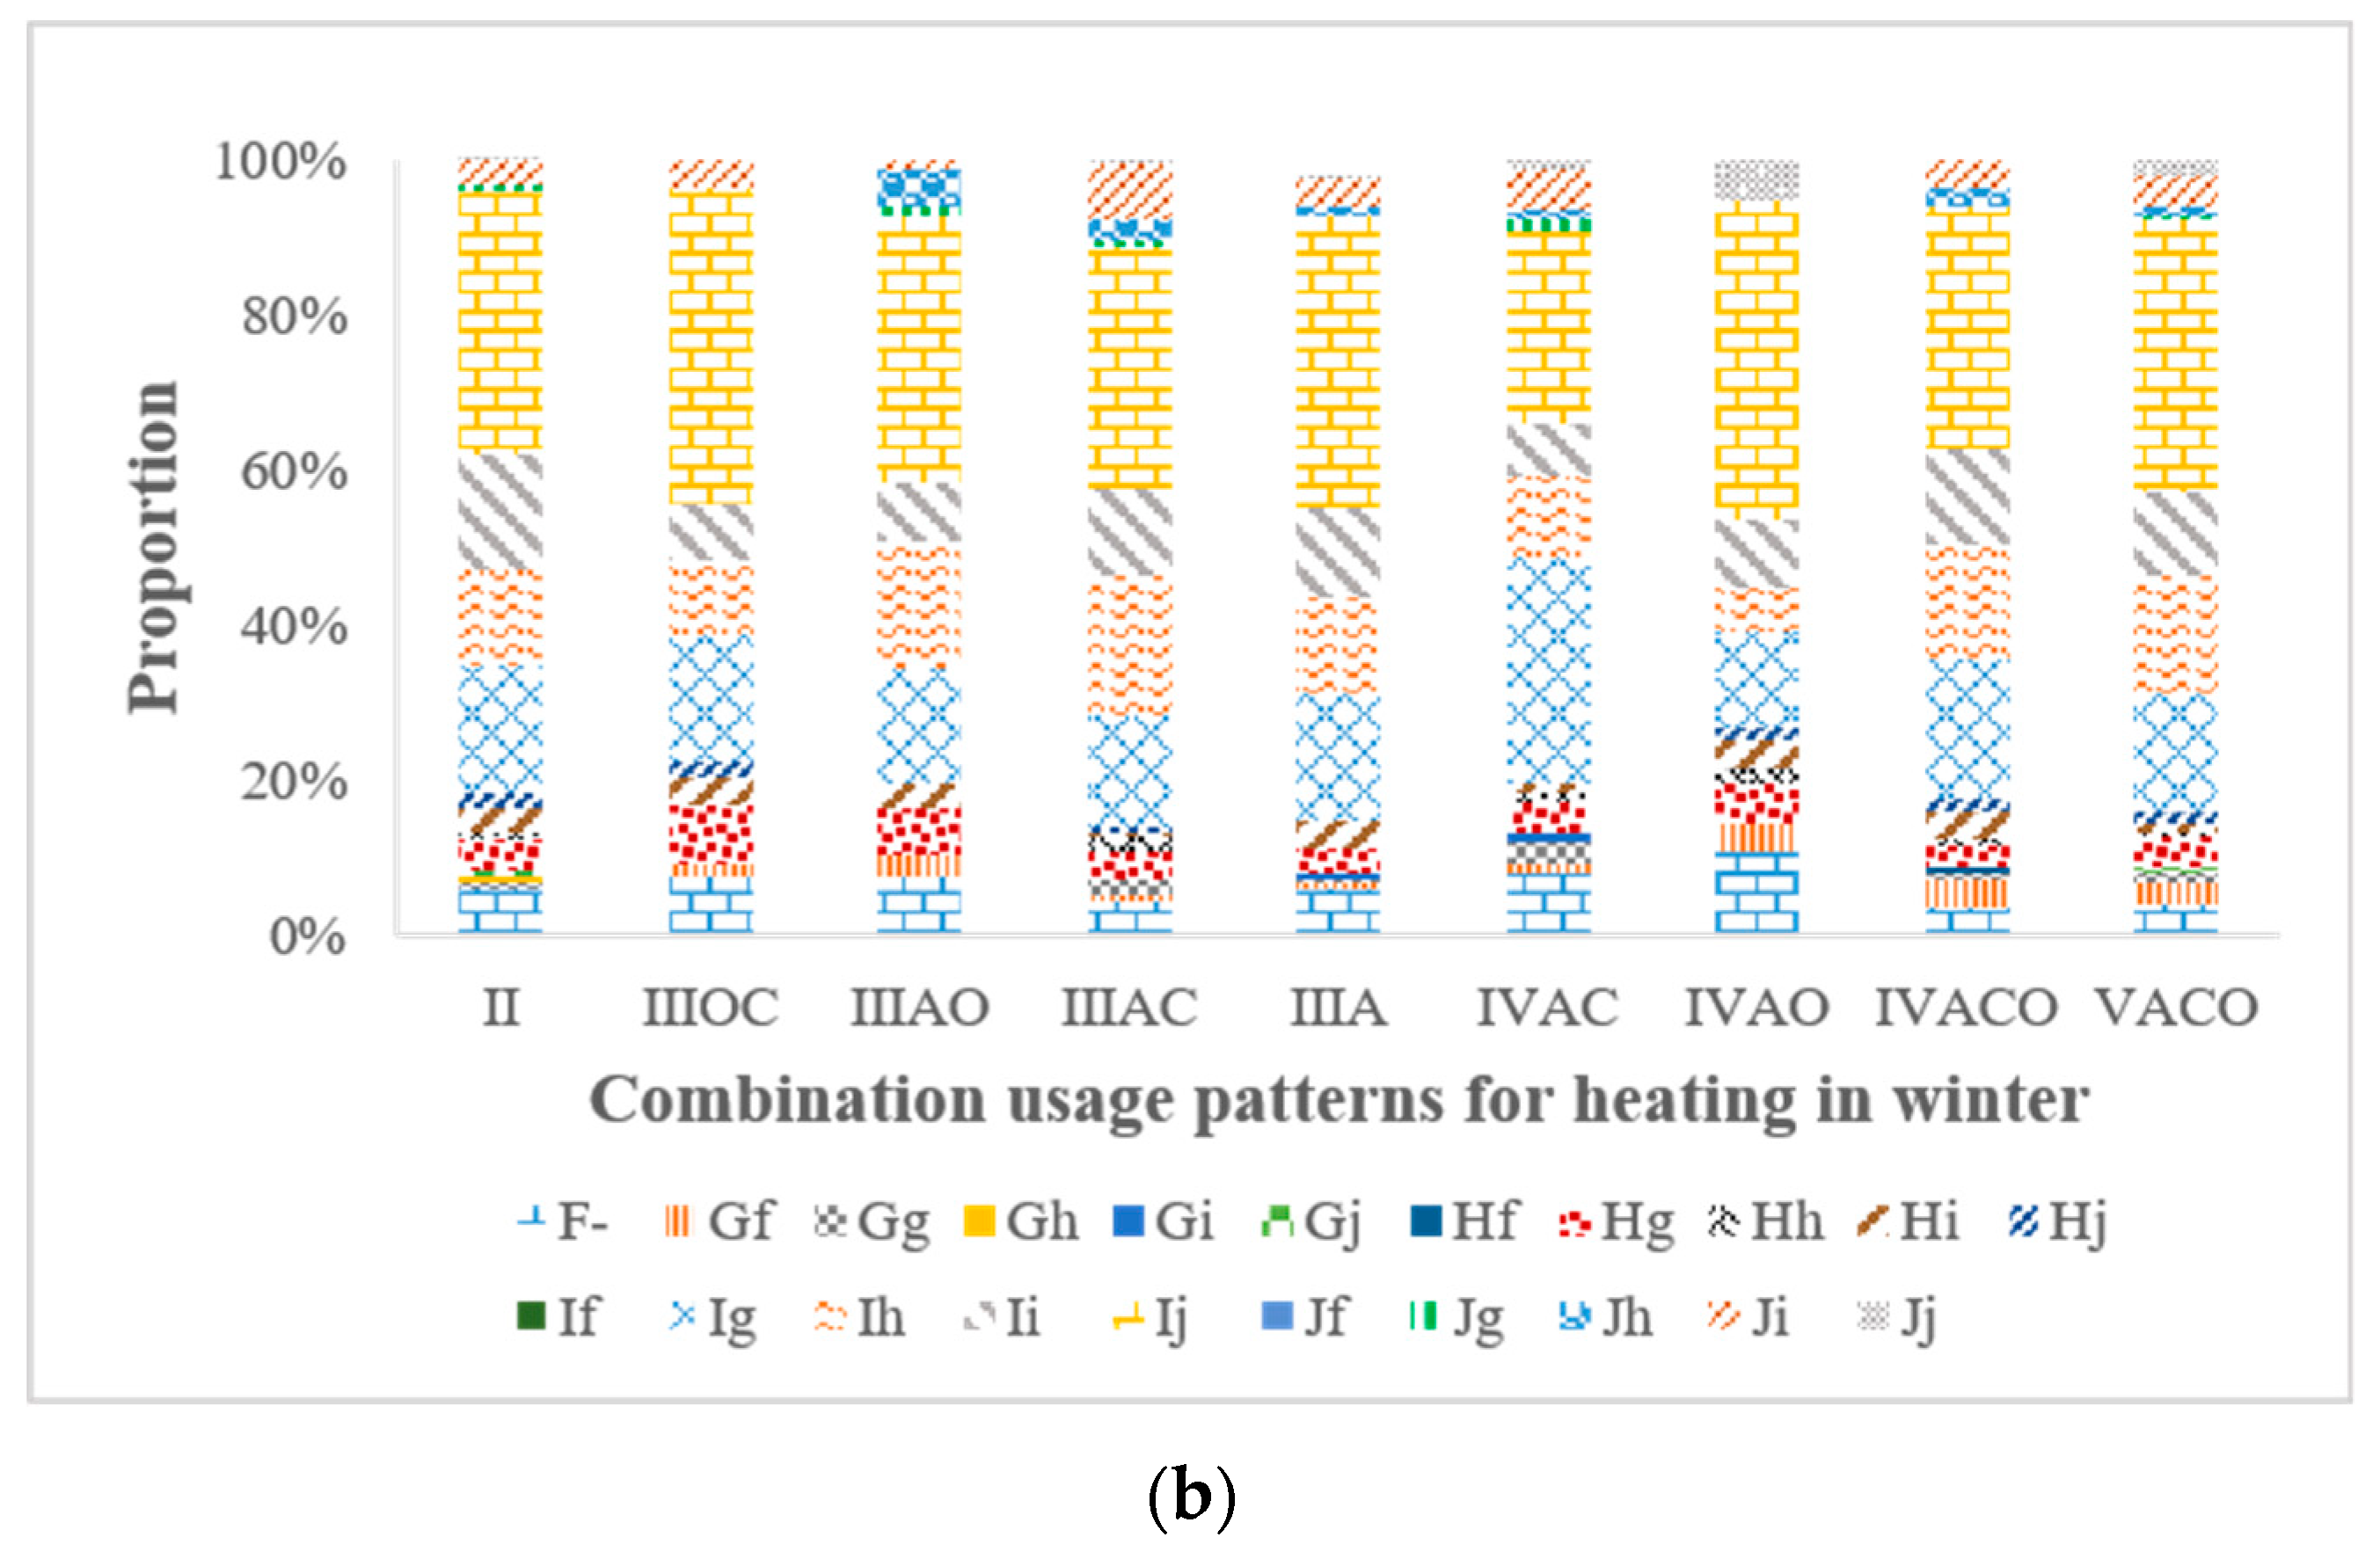
| For Cooling in Summer | For Heating in Winter | ||||||
|---|---|---|---|---|---|---|---|
| Turn on Pattern | Code | Turn off Pattern | Code | Turn on Pattern | Code | Turn off Pattern | Code |
| never | A | never | a | never | F | never | f |
| always | B | when leaving the room | b | always | G | when leaving the room | g |
| when entering the room | C | before sleeping | c | when entering the room | H | before sleeping | h |
| when feeling hot | D | after getting up | d | when feeling cold | I | after getting up | i |
| before sleeping | E | when feeling cold | e | before sleeping | J | when feeling hot | j |
| Envelope and Interior Elements | Components and Materials | Heat Transfer Coefficient (W∙m−2∙K−1) | Thermal Inertness Index |
|---|---|---|---|
| External wall | Reinforced concrete (230 mm) + expanded polystyrene (EPS) panel (32 mm) | 1.015 | 2.533 |
| Interior wall | Reinforced concrete (120 mm) + EPS panel (15mm) | 1.6 | 1.307 |
| Roof | Reinforced concrete (200 mm) + EPS panel (28 mm) | 1.149 | 2.2 |
| Floor | Reinforced concrete (120 mm) + extruded polystyrene board (20 mm) | 1.105 | 1.391 |
| Door | Fiberboard without cement (25 mm) | / | / |
| Orientation | Window-Wall Ratio |
|---|---|
| South | 0.35 |
| North | 0.25 |
| East/West | 0.15 |
| Category | Impact Category Indicator | EI Value (U.S.$) | Share in Total EIs |
|---|---|---|---|
| Ecological Damage Impacts | |||
| Global warming | 1.24 × 10³ kg CO2-e | 9.52 | 76.05% |
| Acidification | 6.68 kg SO2-e | 6.21 × 10⁻¹ | 4.96% |
| Eutrophication | 4.69 kg NO3−-e | 5.06 × 10⁻¹ | 4.04% |
| Airborne suspended particles | 1.27 kg | 4.14 × 10⁻² | 0.33% |
| Photochemical smog | 6.35 × 10⁻³ kgC2H4-e | 2.57 × 10⁻³ | 0.02% |
| Resource Depletion Impacts | |||
| Primary energy depletion | 7.51 × 10² kgce | 9.01 × 10⁻¹ | 7.20% |
| Water depletion | 4.25 m3 | 9.05 × 10⁻¹ | 7.22% |
| Timber depletion | 1.45 × 10⁻³ m3 | 2.10 × 10⁻² | 0.17% |
| Iron depletion | 2.60 × 10⁻¹ kg | 6.57 × 10⁻⁴ | 0.01% |
| Manganese depletion | 2.36 × 10⁻⁵ kg | 6.97 × 10⁻⁹ | 0.00% |
© 2019 by the authors. Licensee MDPI, Basel, Switzerland. This article is an open access article distributed under the terms and conditions of the Creative Commons Attribution (CC BY) license (http://creativecommons.org/licenses/by/4.0/).
Share and Cite
Su, S.; Li, X.; Lin, B.; Li, H.; Yuan, J. A Comparison of the Environmental Performance of Cooling and Heating among Different Household Types in China’s Hot Summer–Cold Winter Zone. Sustainability 2019, 11, 5724. https://doi.org/10.3390/su11205724
Su S, Li X, Lin B, Li H, Yuan J. A Comparison of the Environmental Performance of Cooling and Heating among Different Household Types in China’s Hot Summer–Cold Winter Zone. Sustainability. 2019; 11(20):5724. https://doi.org/10.3390/su11205724
Chicago/Turabian StyleSu, Shu, Xiaodong Li, Borong Lin, Hongyang Li, and Jingfeng Yuan. 2019. "A Comparison of the Environmental Performance of Cooling and Heating among Different Household Types in China’s Hot Summer–Cold Winter Zone" Sustainability 11, no. 20: 5724. https://doi.org/10.3390/su11205724