Effect of Carbon Pricing on Optimal Mix Design of Sustainable High-Strength Concrete
Abstract
:1. Introduction
2. Optimization Design of Concrete Mixture Ratios
2.1. Object Function—Total Cost
2.2. Constraints
2.3. Evaluation Strength and Slump of Concrete Using GEP
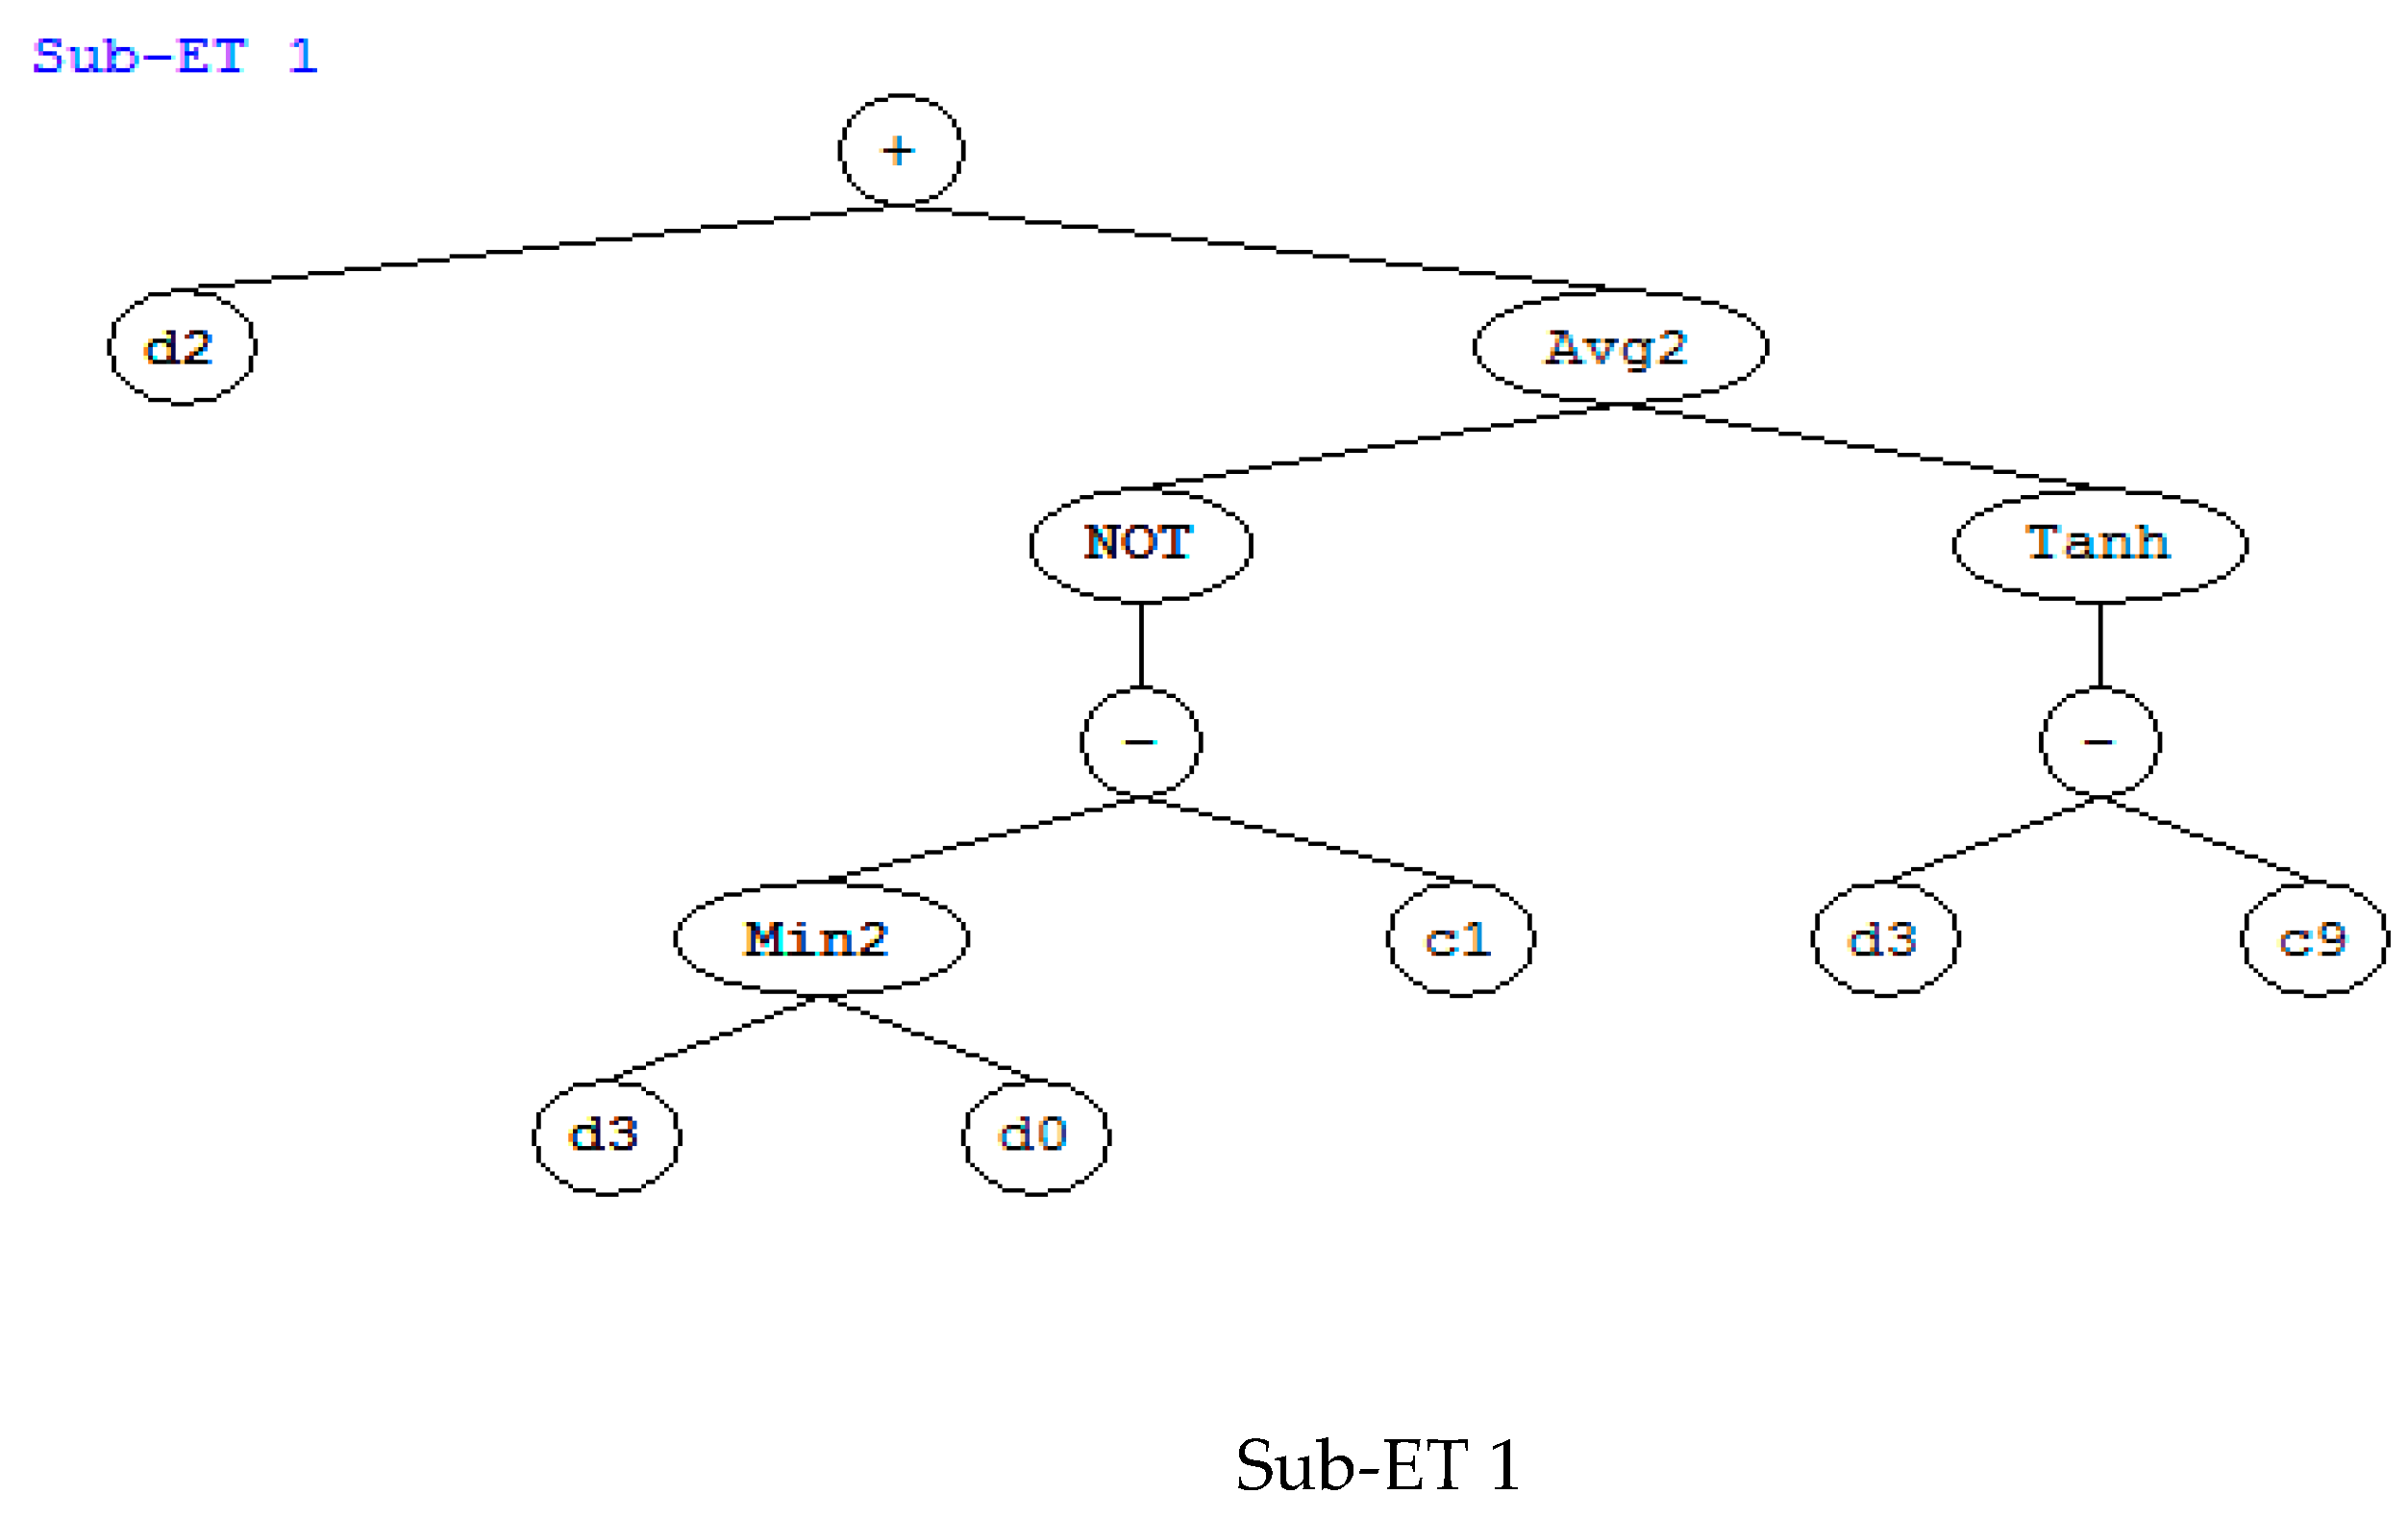
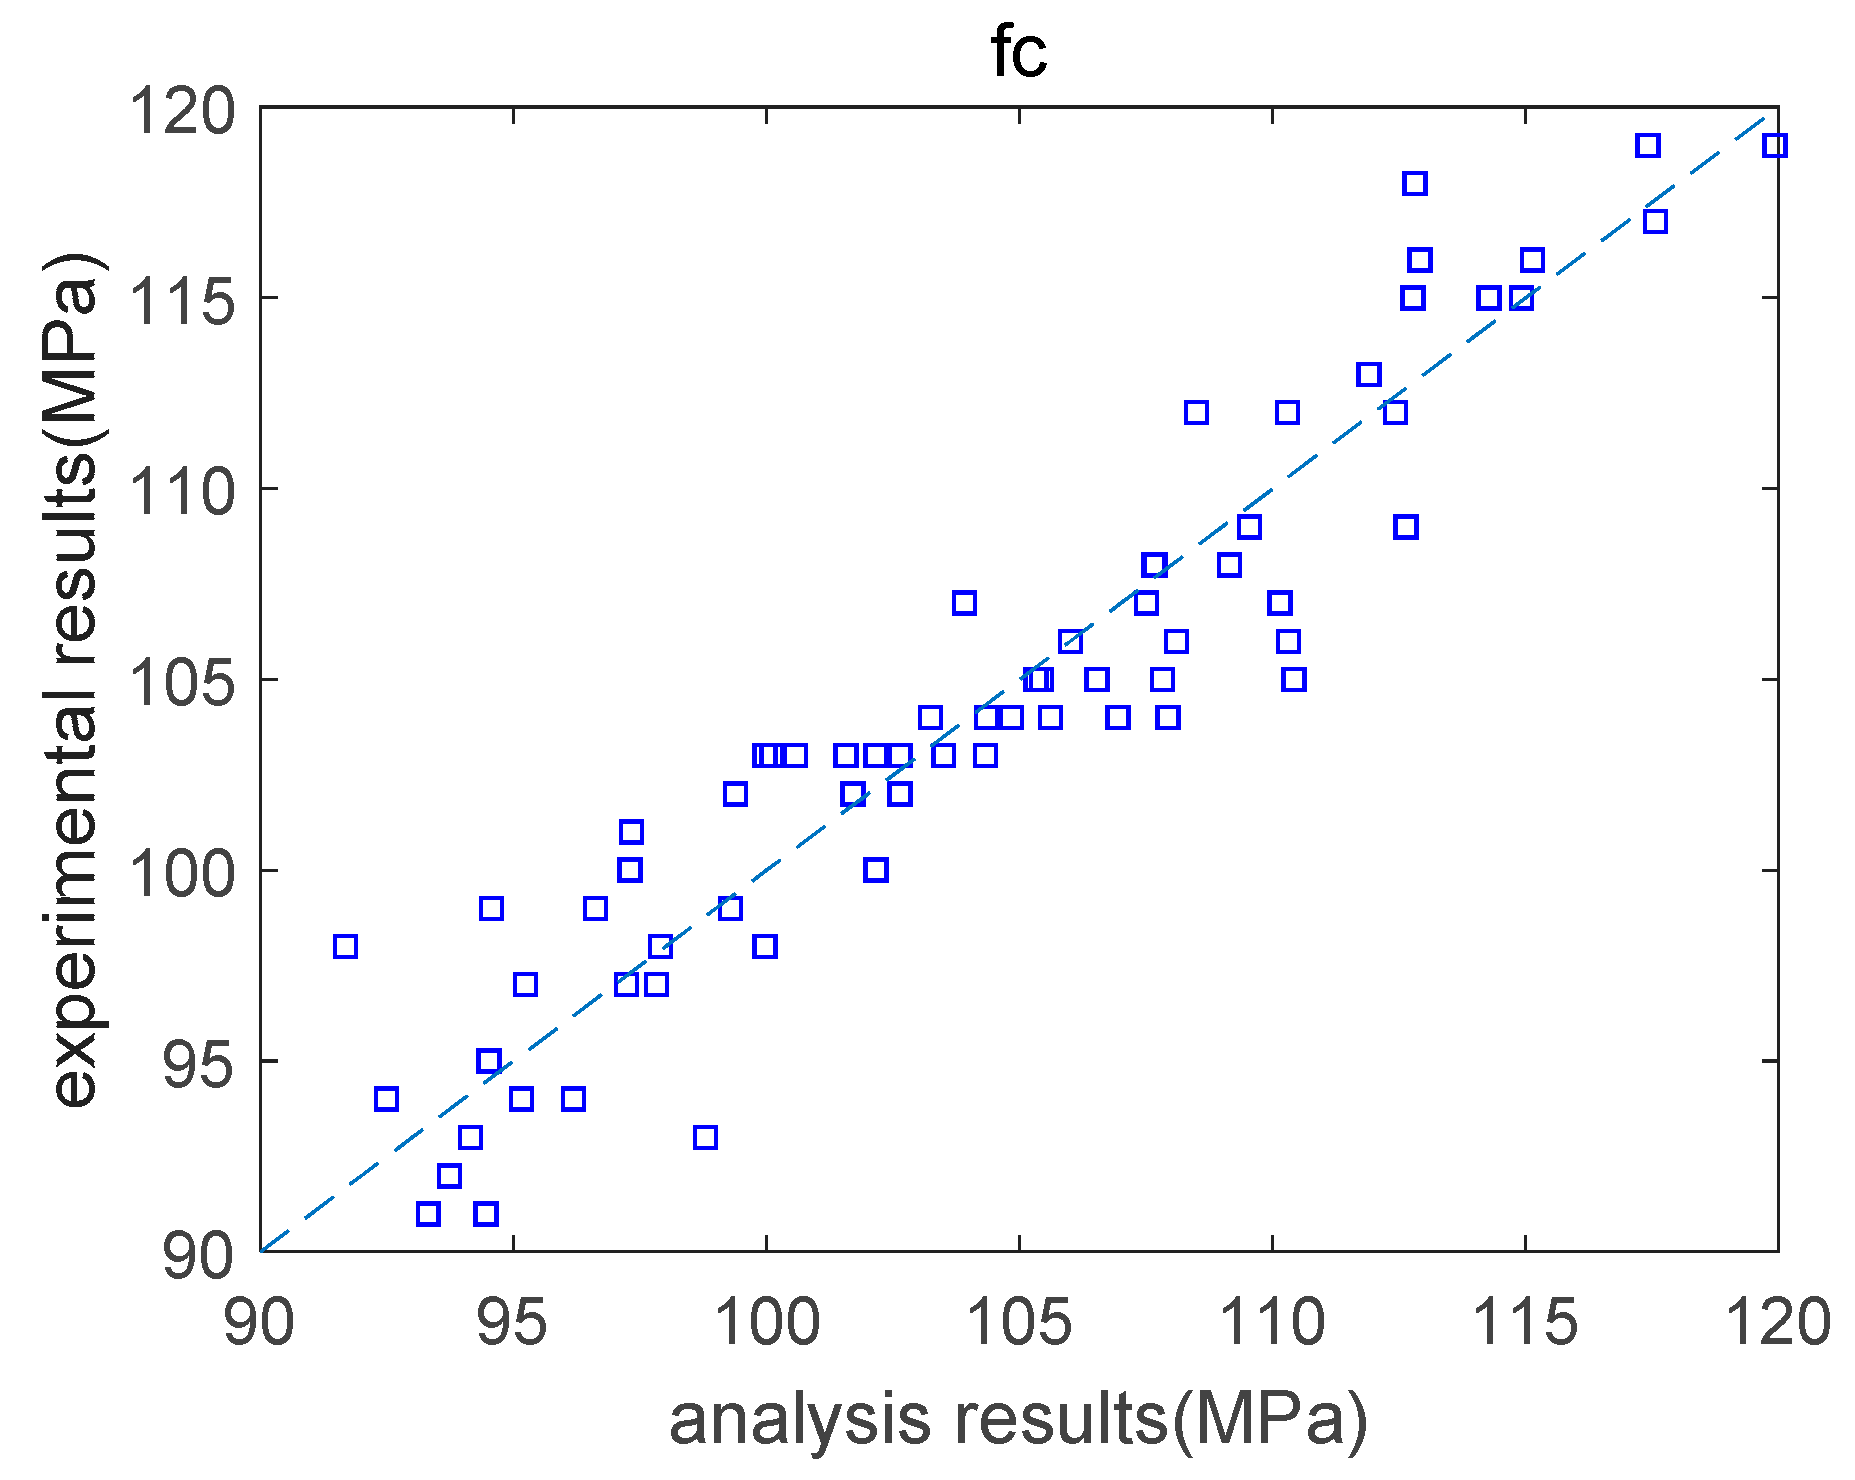
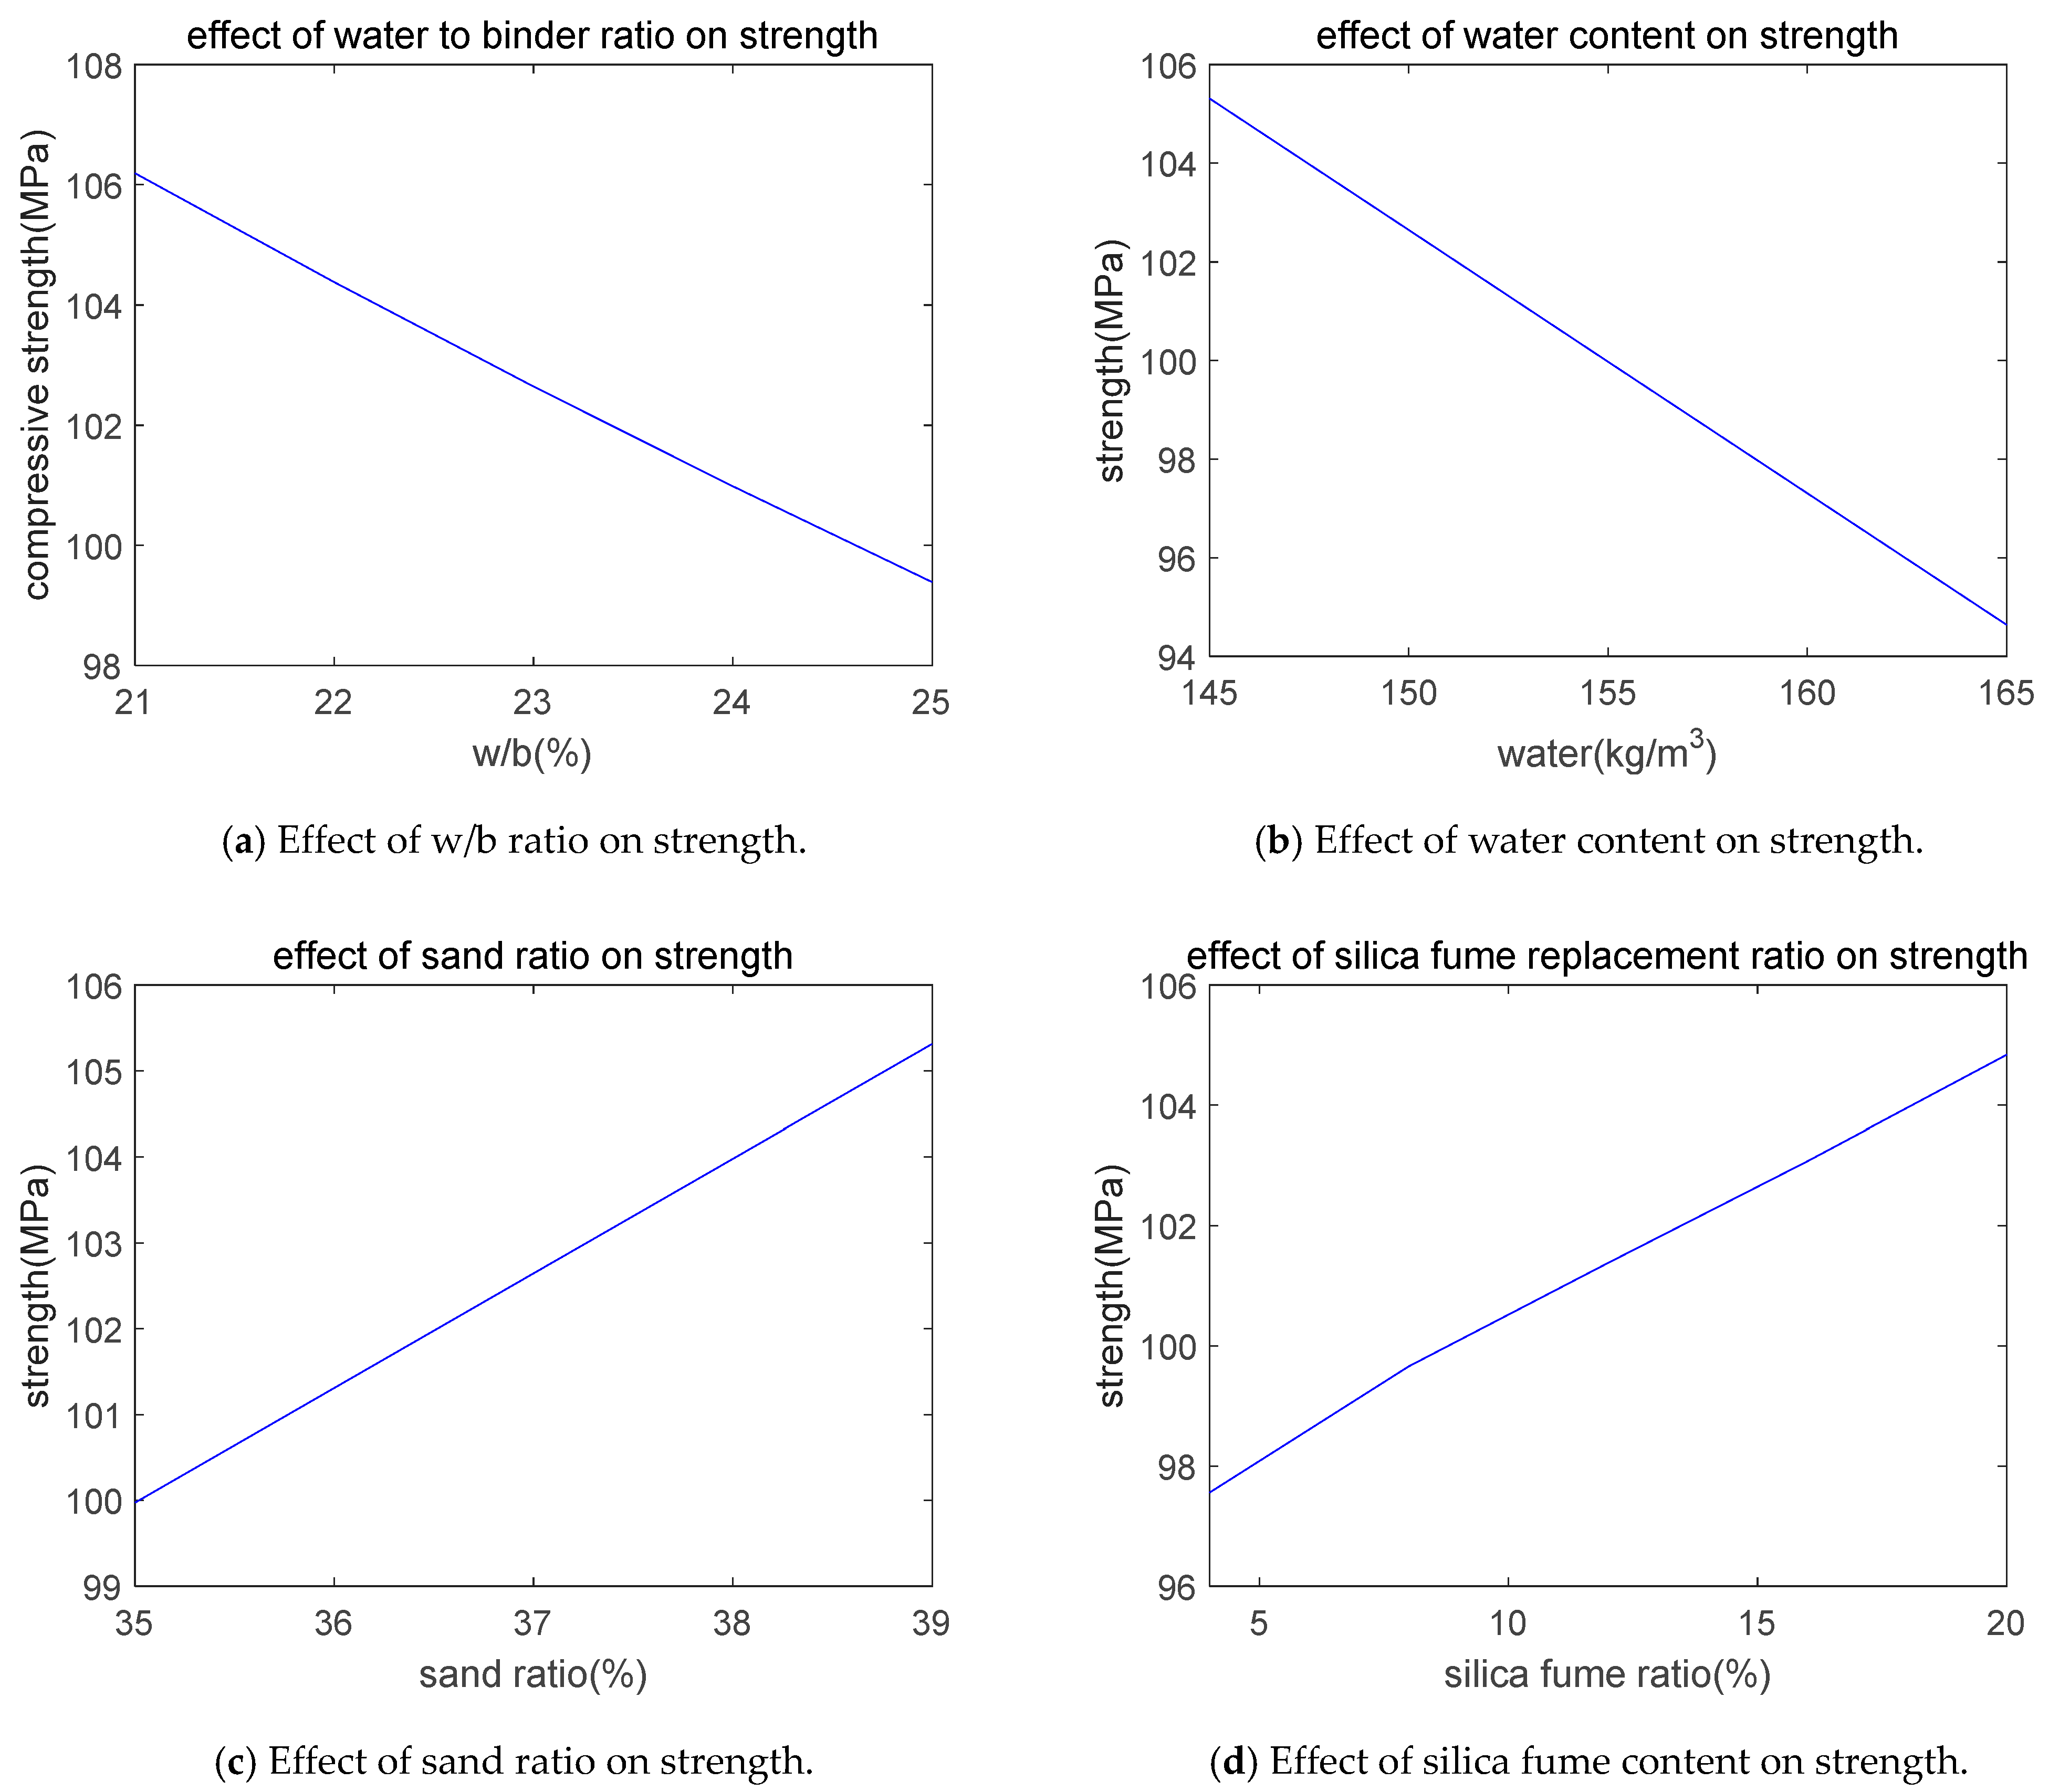
2.3.1. Evaluation Strength Using GEP
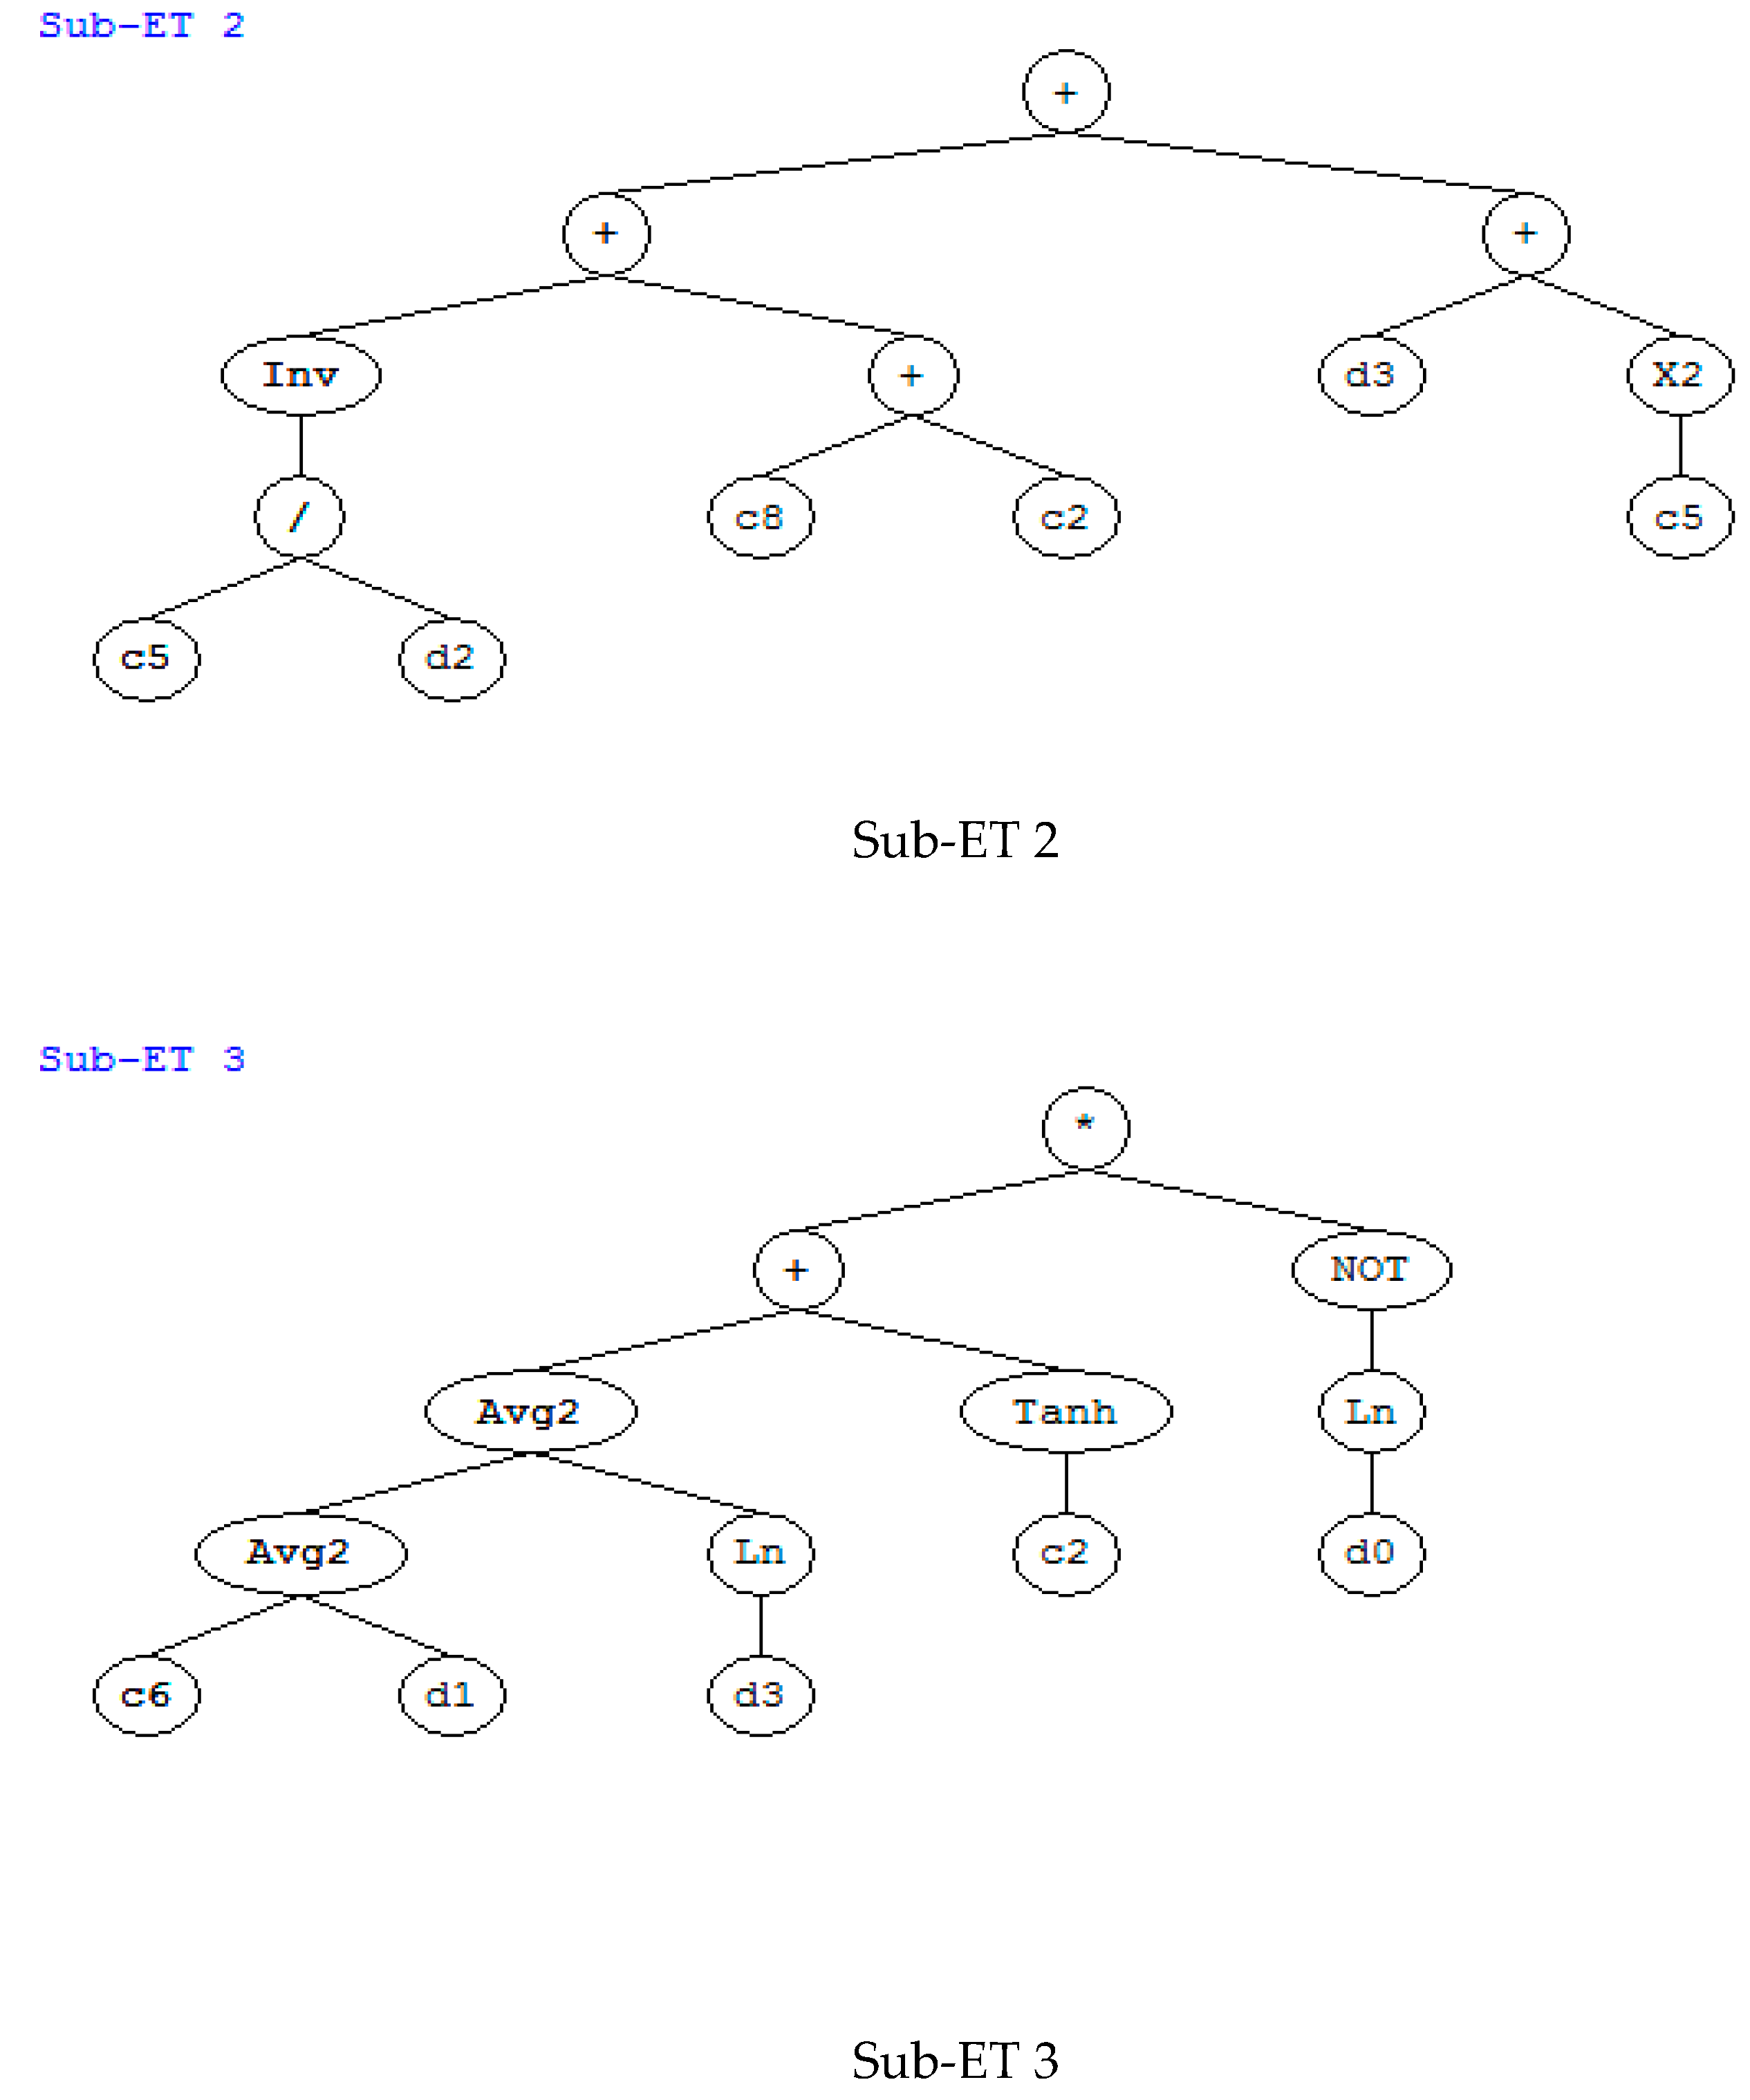
2.3.2. Evaluation Slump Using GEP
2.4. Summary of Optimization Design Approach
3. Illustrative Examples and Discussions
3.1. Optimal Mixtures with Normal CO2 Pricing
3.2. Optimal Mixtures with Zero CO2 Pricing
3.3. Optimal Mixtures with Five-fold CO2 Pricing
3.4. Optimal Mixtures with Ten-fold CO2 Pricing
3.5. Discussion
4. Conclusions
Funding
Conflicts of Interest
References
- Damme, H.V. Concrete material science: Past, present, and future innovations. Cem. Concr. Res. 2018, 112, 5–24. [Google Scholar] [CrossRef]
- Gartner, E.; Hirao, H. A review of alternative approaches to the reduction of CO2 emissions associated with the manufacture of the binder phase in concrete. Cem. Concr. Res. 2015, 78, 126–142. [Google Scholar] [CrossRef]
- Fattah, K.P.; Tamimi, A.K.A.; Hamweyah, W.; Iqbal, F. Evaluation of sustainable concrete produced with desalinated reject brine. Int. J. Sustain. Built Environ. 2017, 6, 183–190. [Google Scholar] [CrossRef]
- Rashid, K.; Razzaq, A.; Ahmad, M.; Rashid, T.; Tariq, S. Experimental and analytical selection of sustainable recycled concrete with ceramic waste aggregate. Constr. Build. Mater. 2017, 154, 829–840. [Google Scholar] [CrossRef]
- Sharma, R.; Khan, R.A. Sustainable use of copper slag in self compacting concrete containing supplementary cementitious materials. J. Clean. Prod. 2017, 151, 179–192. [Google Scholar] [CrossRef]
- Hassan, H.E.; Kianmehr, P. Pervious concrete pavement incorporating GGBS to alleviate pavement runoff and improve urban sustainability. Road Mater. Pavement Des. 2018, 19, 167–181. [Google Scholar] [CrossRef]
- Senaratne, S.; Gerace, D.; Mirza, O.; Tam, V.W.Y.; Kang, W.H. The costs and benefits of combining recycled aggregate with steel fibres as a sustainable, structural material. J. Clean. Prod. 2016, 112, 2318–2327. [Google Scholar] [CrossRef]
- Anastasiou, E.K.; Liapis, A.; Papachristoforou, M. Life Cycle Assessment of Concrete Products for Special Applications Containing EAF Slag. Procedia Environ. Sci. 2017, 38, 469–476. [Google Scholar] [CrossRef]
- Lin, R.S.; Wang, X.Y.; Zhang, G.Y. Effects of Quartz Powder on the Microstructure and Key Properties of Cement Paste. Sustainability 2018, 10, 3369–3384. [Google Scholar] [CrossRef]
- Carolina, G.G.D.; Manuel, G.S.J.; Ramon, C.H.; Luis, A.S.J.; Consolacion, G.S.M.; Alberto, G.S.L. LCA as Comparative Tool for Concrete Columns and Glulam Columns. J. Sustain. Archit. Civ. Eng. 2015, 2, 21–31. [Google Scholar]
- Tae, S.H.; Baek, C.H.; Shin, S.W. Life cycle CO2 evaluation on reinforced concrete structures with high-strength concrete. Environ. Impact Assess. Rev. 2011, 31, 253–260. [Google Scholar] [CrossRef]
- Teixeira, E.R.; Mateus, R.; Camoes, A.F.; Bragança, L.; Branco, F.G. Comparative environmental life-cycle analysis of concretes using biomass and coal fly ashes as partial cement replacement material. J. Clean. Prod. 2016, 112, 2221–2230. [Google Scholar] [CrossRef] [Green Version]
- Yang, K.H.; Song, J.K.; Song, K.I. Assessment of CO2 reduction of alkali-activated concrete. J. Clean. Prod. 2013, 39, 265–272. [Google Scholar] [CrossRef]
- Heath, A.; Paine, K.; McManus, M. Minimising the global warming potential of clay based geopolymers. J. Clean. Prod. 2014, 78, 75–83. [Google Scholar] [CrossRef] [Green Version]
- Yeh, I.C. Modeling Concrete Strength with Augment-Neuron Networks. J. Mater. Civ. Eng. 1998, 10, 263–268. [Google Scholar] [CrossRef]
- Parichatprecha, R.; Nimityongskul, P. An integrated approach for optimum design of HPC mix proportion using genetic algorithm and artificial neural networks. Comput. Concr. 2009, 6, 253–268. [Google Scholar] [CrossRef]
- Kao, C.Y.; Shen, C.H.; Jan, J.C.; Hung, S.L. A Computer-Aided Approach to Pozzolanic Concrete Mix Design. Adv. Civ. Eng. 2018. [Google Scholar] [CrossRef]
- Yadollahi, A.; Nazemi, E.; Zolfaghari, A.; Ajorloo, A.M. Application of artificial neural network for predicting the optimal mixture of radiation shielding concrete. Prog. Nucl. Energy 2016, 89, 69–77. [Google Scholar] [CrossRef]
- Chiew, F.H.; Ng, C.K.; Chai, K.C.; Tay, K.M. A Fuzzy Adaptive Resonance Theory-Based Model for Mix Proportion Estimation of High-Performance Concrete. Comput. Aided Civ. Infrastruct. Eng. 2017, 32, 772–786. [Google Scholar] [CrossRef]
- Park, H.S.; Kwon, B.K.; Shin, Y.A.; Kim, Y.S.; Hong, T.H.; Choi, S.W. Cost and CO2 Emission Optimization of Steel Reinforced Concrete Columns in High-Rise Buildings. Energies 2013, 6, 5609–5624. [Google Scholar] [CrossRef]
- Lim, C.H.; Yoon, Y.S.; Kim, J.H. Genetic algorithm in mix proportioning of high-performance concrete. Cem. Concr. Res. 2004, 34, 409–420. [Google Scholar] [CrossRef]
- Yang, K.H.; Moon, J.H. Design of Supplementary Cementitious Materials and Unit Content of Binder for Reducing CO2 Emission of Concrete. J. Korea Concr. Inst. 2012, 24, 597–604. [Google Scholar] [CrossRef]
- Behnood, A.; Ziari, H. Effects of silica fume addition and water to cement ratio on the properties of high-strength concrete after exposure to high temperatures. Cem. Concr. Compos. 2008, 30, 106–112. [Google Scholar] [CrossRef]
- Shannag, M.J. High strength concrete containing natural pozzolan and silica fume. Cem. Concr. Compos. 2000, 22, 399–406. [Google Scholar] [CrossRef]
- Mazloom, M.; Ramezanianpour, A.A.; Brooks, J.J. Effect of silica fume on mechanical properties of high-strength concrete. Cem. Concr. Compos. 2004, 26, 347–357. [Google Scholar] [CrossRef]
- Ferreira, C. Gene Expression Programming: Mathematical Modeling by an Artificial Intelligence, 2nd ed.; Springer: Berlin/Heidelberg, Germany, 2006. [Google Scholar]
- Xiao, L.Z.; Li, Z.J.; Wei, X.S. Selection of superplasticizer in concrete mix design by measuring the early electrical resistivities of pastes. Cem. Concr. Compos. 2007, 29, 350–356. [Google Scholar] [CrossRef]
- Mathworks. Available online: http://www.mathworks.com (accessed on 1 August 2019).
- Independent Chemical Information Service. What Are the Effects of the Price Increase for the CO2 Allowances on the EU ETS Market? Available online: https://beyond-ratings.com/publications/what-effects-price-increase-CO2-allowances-eu-ets-market/ (accessed on 1 August 2019).
- Prasodjo. Modeling CCS Deployment under Cap and Trade. Available online: http://darmawanprasodjo.com/economic-modeling/modeling-ccs-under-cap-and-trade/ (accessed on 1 August 2019).
- Yeh, I.C. Computer-aided design for optimum concrete mixtures. Cem. Concr. Compos. 2007, 29, 193–202. [Google Scholar] [CrossRef]
- Kim, T.H.; Tae, S.H.; Roh, S.J. Assessment of the CO2 emission and cost reduction performance of a low-carbon-emission concrete mix design using an optimal mix design system. Renew. Sustain. Energy Rev. 2013, 25, 729–741. [Google Scholar] [CrossRef]
- Park, J.H.; Tae, S.H.; Kim, T.H. Life cycle CO2 assessment of concrete by compressive strength on construction site in Korea. Renew. Sustain. Energy Rev. 2012, 16, 2940–2946. [Google Scholar] [CrossRef]
- Life365 Consortium III. Life-365 Service Life Prediction Model. 2018. Available online: http://www.life-365.org/ (accessed on 1 August 2019).
- Ministry of housing and urban-rural development of the People’s republic of China. Standard for Durability Assessment of Existing Concrete Structures; China Architecture & Building Press: Beijing, China, 2019. [Google Scholar]
- Papadakis, V.G.; Tsima, S. Supplementary cementing materials in concrete Part I: Efficiency and design. Cem. Concr. Res. 2002, 32, 1525–1532. [Google Scholar] [CrossRef]


| Unit Cost (NT dollar/kg) | Unit CO2 Emissions (kg/kg) | |
|---|---|---|
| Cement | 2.25 | 0.931 |
| Silica fume | 11.25 | 0.014 |
| Water | 0.01 | 0.000196 |
| Sand | 0.28 | 0.0026 |
| Coarse aggregate | 0.236 | 0.0075 |
| Superplasticizer | 25.1 | 0.25 |
| Lower Limit | Upper Limit | |
|---|---|---|
| Cement | 450 | 710 |
| Silica fume | 25 | 210 |
| Binder (cement + silica fume) | 574 | 833 |
| Water | 140 | 165 |
| Sand | 500 | 900 |
| Coarse aggregate | 700 | 1050 |
| Superplasticizer | 10.9 | 36.5 |
| Lower limit | Upper limit | |
|---|---|---|
| Water-to-binder ratio | 0.18 | 0.27 |
| Water-to-cement ratio | 0.211 | 0.317 |
| Sand ratio | 0.35 | 0.39 |
| Silica-fume-to-binder ratio | 0.05 | 0.25 |
| Superplasticizer-to-binder ratio | 0.0188 | 0.0469 |
| Cement | Silica Fume | Water | Fine Aggregate | Coarse Aggregate | Superplasticizer | |
|---|---|---|---|---|---|---|
| Mixture 1—95 MPa | 545.30 | 28.70 | 150.71 | 659.31 | 1031.22 | 10.90 |
| Mixture 2—100 MPa | 545.30 | 28.70 | 144.60 | 665.65 | 1041.15 | 10.90 |
| Mixture 3—105 MPa | 564.96 | 29.73 | 140.00 | 662.65 | 1036.45 | 11.87 |
| Mixture 4—110 MPa | 649.21 | 34.17 | 140.00 | 631.70 | 988.05 | 13.18 |
| Mixture 5—115 MPa | 663.51 | 68.36 | 140.00 | 609.42 | 953.19 | 15.36 |
| w/b Ratio | Silica-Fume-to-Binder Ratio | Sand Ratio | Superplasticizer-to-Binder Ratio | Water-to-Cement Ratio | Absolute Volume | |
|---|---|---|---|---|---|---|
| Mixture 1—95 MPa | 0.262 | 0.05 | 0.39 | 0.0189 | 0.276 | 1 |
| Mixture 2—100 MPa | 0.251 | 0.05 | 0.39 | 0.0189 | 0.265 | 1 |
| Mixture 3—105 MPa | 0.235 | 0.05 | 0.39 | 0.0199 | 0.247 | 1 |
| Mixture 4—110 MPa | 0.204 | 0.05 | 0.39 | 0.0192 | 0.215 | 1 |
| Mixture 5—115 MPa | 0.191 | 0.093 | 0.39 | 0.0209 | 0.211 | 1 |
| Compressive Strength (MPa) | Slump (mm) | CO2 Emission Cost (NT dollar/m3) | Material Cost (NT dollar/m3) | Total Cost (NT dollar/m3) | |
|---|---|---|---|---|---|
| Mixture 1—95 MPa | 95.00 | 193.31 | 250.61 | 2252.87 | 2503.48 |
| Mixture 2—100 MPa | 100.00 | 183.96 | 250.65 | 2256.93 | 2507.59 |
| Mixture 3—105 MPa | 105.00 | 180.00 | 259.58 | 2335.27 | 2594.85 |
| Mixture 4—110 MPa | 110.00 | 180.00 | 297.33 | 2587.49 | 2884.82 |
| Mixture 5—115 MPa | 115.00 | 180.00 | 304.08 | 3044.43 | 3348.51 |
| Cement | Silica Fume | Water | Fine Aggregate | Coarse Aggregate | Superplasticizer | |
|---|---|---|---|---|---|---|
| Mixture 6—95 MPa | 545.30 | 28.70 | 150.71 | 659.31 | 1031.22 | 10.90 |
| Mixture 7—100MPa | 545.30 | 28.70 | 144.60 | 665.65 | 1041.15 | 10.90 |
| Mixture 8—105 MPa | 564.96 | 29.73 | 140.00 | 662.65 | 1036.45 | 11.87 |
| Mixture 9—110 MPa | 649.21 | 34.17 | 140.00 | 631.70 | 988.05 | 13.18 |
| Mixture 10—115 MPa | 663.51 | 68.36 | 140.00 | 609.42 | 953.19 | 15.36 |
| Cement | Silica Fume | Water | Fine Aggregate | Coarse Aggregate | Superplasticizer | |
|---|---|---|---|---|---|---|
| Mixture 11—95 MPa | 545.30 | 28.70 | 150.71 | 659.31 | 1031.22 | 10.90 |
| Mixture 12—100 MPa | 545.30 | 28.70 | 144.60 | 665.65 | 1041.15 | 10.90 |
| Mixture 13—105 MPa | 532.22 | 41.78 | 140.00 | 668.04 | 1044.88 | 11.72 |
| Mixture 14—110 MPa | 592.97 | 53.44 | 140.00 | 641.30 | 1003.06 | 13.29 |
| Mixture 15—115 MPa | 450.00 | 147.96 | 140.00 | 645.11 | 1009.02 | 13.17 |
| Compressive Strength (MPa) | Slump (mm) | CO2 Emissions Cost (NT dollar/m3) | Material Cost (NT dollar/m3) | Total Cost (NT dollar/m3) | |
|---|---|---|---|---|---|
| Mixture 11—95 MPa | 95.00 | 193.31 | 1253.05 | 2252.87 | 3505.93 |
| Mixture 12—100 MPa | 100.00 | 183.96 | 1253.27 | 2256.93 | 3510.20 |
| Mixture 13—105 MPa | 105.00 | 180.00 | 1224.95 | 2396.73 | 3621.68 |
| Mixture 14—110 MPa | 110.00 | 180.00 | 1361.60 | 2686.69 | 4048.28 |
| Mixture 15—115 MPa | 115.00 | 180.00 | 1044.26 | 3427.71 | 4471.97 |
| Cement | Silica Fume | Water | Fine Aggregate | Coarse Aggregate | Superplasticizer | |
|---|---|---|---|---|---|---|
| Mixture 16—95 MPa | 545.30 | 28.70 | 150.71 | 659.31 | 1031.22 | 10.90 |
| Mixture 17—100 MPa | 545.30 | 28.70 | 144.60 | 665.65 | 1041.15 | 10.90 |
| Mixture 18—105 MPa | 532.22 | 41.78 | 140.00 | 668.04 | 1044.88 | 11.72 |
| Mixture 19—110 MPa | 468.16 | 105.84 | 140.00 | 658.85 | 1030.51 | 12.74 |
| Mixture 20—115 MPa | 450.00 | 147.96 | 140.00 | 645.11 | 1009.02 | 13.17 |
| Compressive Strength (MPa) | Slump (mm) | CO2 Emission Cost (NT dollar/m3) | Material Cost (NT dollar/m3) | Total Cost (NT dollar/m3) | |
|---|---|---|---|---|---|
| Mixture 16—95 MPa | 95.00 | 193.31 | 2506.11 | 2252.87 | 4758.98 |
| Mixture 17—100 MPa | 100.00 | 183.96 | 2506.54 | 2256.93 | 4763.47 |
| Mixture 18—105 MPa | 105.00 | 180.00 | 2449.90 | 2396.73 | 4846.63 |
| Mixture 19—110 MPa | 110.00 | 180.00 | 2167.57 | 2992.86 | 5160.43 |
| Mixture 20—115 MPa | 115.00 | 180.00 | 2088.52 | 3427.71 | 5516.23 |
© 2019 by the author. Licensee MDPI, Basel, Switzerland. This article is an open access article distributed under the terms and conditions of the Creative Commons Attribution (CC BY) license (http://creativecommons.org/licenses/by/4.0/).
Share and Cite
Wang, X.-Y. Effect of Carbon Pricing on Optimal Mix Design of Sustainable High-Strength Concrete. Sustainability 2019, 11, 5827. https://doi.org/10.3390/su11205827
Wang X-Y. Effect of Carbon Pricing on Optimal Mix Design of Sustainable High-Strength Concrete. Sustainability. 2019; 11(20):5827. https://doi.org/10.3390/su11205827
Chicago/Turabian StyleWang, Xiao-Yong. 2019. "Effect of Carbon Pricing on Optimal Mix Design of Sustainable High-Strength Concrete" Sustainability 11, no. 20: 5827. https://doi.org/10.3390/su11205827
APA StyleWang, X.-Y. (2019). Effect of Carbon Pricing on Optimal Mix Design of Sustainable High-Strength Concrete. Sustainability, 11(20), 5827. https://doi.org/10.3390/su11205827


