Abstract
This research introduces an approach to analyze the nexus of water, energy and rice production system at the watershed scale. The nexus relationship equations, developed to suit the local scale facilitating analysis in the rice production sector, were integrated with a Material Flow Analysis tool to expand the visualization capability. Moreover, the nexus flow was linked with the selected resource security, eco-efficiency and economic indicators, taking into account the spatial and temporal effect of water availability. The study covers the nexus resource flows not only in the rice production sector but also all other sectors in the whole watershed to assess local resource security. The tool covers wider implications, trade-offs and synergy impacts that were not much covered in previous studies. The tool was applied to evaluate the trade-offs and synergies of the impacts from proposed scenarios of alternative agricultural practices and land-use change options. The scenarios applying land-use change, and changing non-suitable and low-suitable rice cultivation areas to sugarcane and cassava, can reduce water use significantly resulting in reducing the nexus energy while the impact on economics, food security and direct energy use is small.
1. Introduction
Increases in world population, economic development, and urbanization and international trade have led to increasing demand for food production and, in turn, water and energy resources to produce food [1]. Moreover, the pressure from climate change has been causing drought and flood almost every year in some areas making the situation even worse. Agriculture is the largest water consumer [1]. It consumes 70% of the global freshwater resources withdrawn [2]. Almost 30% of global energy is used in agri-food supply chain in cultivation, processing, transportation and consumption processes [2]. Apart from direct consumption of water and energy, there is an interrelationship among those issues. Acquiring water supply for irrigation, for example, pumping water for irrigation and treatment of water for food processing, requires energy. Producing energy also requires water; for example, hydropower plants, thermal power plants, fuel, or biofuel also consume large amounts of water in processing. Those synergy impacts of water, energy and food consumption are often referred to as the “Water-Energy-Food Nexus” (WEF nexus) [3]. Water, energy and food security issues could be significant for sustainable development. However, the underlying resources management is mostly controlled by different sectors that barely look at the relationship or effect of management of one resource that may affect others.
Rice is a key food crop in Thailand and Asia; it involves 3.55 million households of rice farmers in Thailand [2]. In the global market of rice products, although the amount of rice production in Thailand is relatively small compared to other countries, more than fifty percent is produced for export, making Thailand consistently ranked at the top three of rice exporting countries in the world. Thailand has a market share of approximately 24 percent of world rice exports, with the major competitors being India and Vietnam [4,5,6]. Although Thailand is one of the world’s leading rice exporters, Thailand is losing its competitiveness, especially in the part of white rice, because yield is lower than the competing countries, and the cost per area higher [4,5].
Rice farming in Thailand is characterized as high risk but low return because agricultural products are dependent on often erratic weather conditions. If there are droughts or floods, farmers will lose money. However, even in years where there are no weather problems, with the low price and high production cost (including labor, energy, and chemicals costs), the returns from rice farming are very small. Therefore, most of the farmers who hold small land are poor and have a lot of debt because of being under the control of middlemen combined with the fluctuations in the price of rice in the world market [7]. The yield tends to decrease due to the deterioration of soil quality from continuous agriculture without lack of soil rest, and proper soil improvement and problems with the competition for water resources which in the future may become more severe. Due to efforts at expanding plantation areas and increase planting cycles, water demand is increasing, but irrigation volume tends to decrease due to weather fluctuations and water demand from other sectors that increase [8].
Rice cultivation area accounts for almost 40% of the total agriculture area in Thailand (Office of Agricultural Economics). In the year 2016, the Chaopraya basin produced about 3.78 million tonnes paddy rice or 12% of the Thailand supply, and supplied 1.74 million tonnes rice to the market or about 18% of Thailand’s rice export [9]. Rice production consumes the largest volume of water in Thailand compared to other crops and other sectors [10]. This is a major issue because Thailand has water scarcity in some watersheds in some periods, especially the Chaopraya watershed which is the main second rice (irrigated rice) production area in Thailand [11]. The Chaopraya basin has been challenged with water management for many years, although the basin has one of the largest annual water availabilities per area [12]. The Chaopraya watershed has high water use competition, severe drought in some years and water security problem. Irrigation water in the past five years has never been enough to fulfill the demand for all second rice use and other crops downstream. In some years, the government has had to limit water use for second rice and ask farmers not to grow second rice in the drought years to conserve water to use for households, the industrial sector and maintain the ecosystem downstream.
Almost half of the rice produced in Thailand is exported; thus, it implies that most of the limited natural resources were used to produce food for export. International trading of food products, especially rice (water-intensive products), made Thailand and India the largest net virtual water exporters in the world [13]. Considering the several problems mentioned above, we need to think again if it is worthwhile or not if we still do as business as usual of producing rice for export with high risk and low returns to the farmers. One of the priorities of the Thai government is to consider improving rice production practices or other alternative options including changing from rice to other crops or other options of land use to reduce stress on natural resources use and improve farmers’ quality of life [14]. As a result, resource management in rice production needs to be more efficient, or alternative options need to be explored to reduce resource use and increase benefit for farmers. The water-food-energy nexus impact of alternative options needs to be evaluated to ensure that optimizing one issue will not cause severe effect to other issues; for example, some option to reduce water use may have large impact on energy and food security.
The Material Flow Analysis (MFA) tool is useful for assisting resource management for policy intervention. MFA has been used to track resource and waste flows over several decades to understand the anthroposphere metabolism [15,16]. The benefit of MFA to the stakeholder is the ability for visualization to understand the holistic picture and interconnection of resource flows via Sankey diagram. Water and energy flows have been analyzed at the regional scale in many case studies [17,18,19,20,21]. However, in the conventional MFA method, nexus relationship has not been comprehensively analyzed.
The nexus analysis tools that look into the interlinkage between water, food and energy have been developed over almost a decade. [22] has introduced nexus in the California energy and water situation analysis. The WEF nexus was recognized as a global issue since 2011 [1]. FAO has also recommended a framework to do the water-food-energy nexus analysis which includes; qualitative analysis (context analysis), quantitative analysis, assessment of interventions and comparison of interventions of all the elements [3]. Tremendous research and studies have been done and reviewed in several articles [23,24,25,26]. Many articles classified the literature on several aspects and dimensions, including quantitative and modeling approach, scale and boundary, context, purpose, policy intervention, collaboration, and implementation. Resource quantitative approach used in the nexus assessment including Input-Output Analysis [27], Multiregional input-output (MRIO) [28], Life Cycle Assessment (LCA) [26,27,28,29,30,31,32], Footprint tool [33,34,35] and System Dynamics (SD) [36,37,38]. An integrated modeling approach was also developed and implemented in many research. The Water Nexus (WEN) model classifies the analysis into two parts: Energy for water framework and Water for energy framework [39,40]. The CLEWs model (climate, land-use, energy and water strategies) was developed by the integration of all three types of tools, namely Water model (WEAP), Energy model (LEAP), Land-use model (AEZ) for analysis [41].
Many tools and models were developed and implemented in different aspects to suit the specific context and purpose because there is no versatile tool that can fit all contexts and purposes of WEF analysis and policy interventions. Lin et al. [40] applied the water-energy nexus (WEN) tool to analyze urban water and energy management. Energy and water-saving technologies and measures were evaluated using the tool to identify the synergies and co-benefit among those measures. Multi-Scale Integrated Assessment of Society and Ecosystem Metabolism (MuSIASEM) was developed and employed to analyze the WEF nexus impact and possibility to integrate alternative energy production in South Africa using a multi-level system of accounting and to analyze the option to produce biofuel from sugarcane in the Republic of Mauritius instead of sugar [42]. Walker et al. applied Multi-sectoral Systems Analysis (MSA) and MFA for estimating flows (nutrients, water, and energy) in the urban area and analyzing interrelationships among them and evaluating the synergy effect of implementing water and wastewater management innovations on fertilizer and energy production. However, the analysis of agricultural practices and management and policy intervention on food security were not covered because the focus was on the urban city context. Spatial and temporal effects and resource stresses were not taken into account [43]. Mukuve and Fenner analyzed the stress of resource consumption and food security at the multi-scale of national and local scales. The integrated multi-scale food system resource analysis was based on MFA with WEF nexus analysis. The food security intervention policy was analyzed. However, the indicator of analyzed resources security and economic analysis of the scenario was not comprehensively investigated in the alternative improvement options [44]. In a comparative analysis, dynamic WEF nexus simulation at the national scale was applied to Korea and Indonesia to evaluate improvement measures on renewable energy sources and building more water infrastructure [36]. Bazilian et al. used WEF nexus analysis on alternative energy including biofuels and hydropower and water desalination, with the trade-off on food security [45]. Miara et al. employed the energy, water and food nexus tool to assess and plan for algal systems [46].
Most of the models mentioned above were applied in the urban context by focusing on evaluating the improvement measures and policies on energy and water infrastructure. There has rarely been an analysis of agricultural policy management or agricultural practice improvement, especially in rice production. Water-energy-food nexus in rice production in Japan was conducted specifically in great detail with the future projection of different management practices by Lee et al. [37]. Nevertheless, water availability characteristics of each watershed with different space and time effect were not taken into account in the previous studies. Moreover, the scenarios focused mainly on variation in self-sufficient rice production, whereas other countries have different contexts and concerns. Thailand has rice surplus and is a rice exporting country; therefore, there is more concern about water, energy security and farmers’ income and quality of rice.
This research introduces the framework and approach to analyze the nexus of water, energy, and food in the rice production system holistically at watershed scale using MFA. The flows of resources through the rice production system and all other sectors in the watershed boundary were revealed and visualized using the Sankey diagram, allowing stakeholders to understand the situation holistically. The framework and tool were mainly developed to suit local scale of rice production system and can be connected to regional and global scale of rice production systems. Interrelationship of water, food energy was determined using selected parameters, and the nexus equations were formulated. A set of resource securities and economic analysis indicators were selected to analyze resource availability, resource use efficiency, benefit and cost of the base case and scenarios of improvement measures or policy. The spatial and temporal effect of water was also taken into account. The tool was applied to evaluate the trade-offs and synergies of the impacts from proposed scenarios of alternative agricultural practices and land-use change options.
2. Materials and Methods
2.1. Study Area and Background Data
The Chaopraya basin is the watershed of the Chaopraya River, the most important river of Thailand. The basin is located in the center of the middle region of the country with an area of 2,052,342 ha. It is one of the largest paddy rice producing areas in Thailand; the paddy cultivation area covers about 905,721 ha or 44% of the total watershed area as shown in Figure 1. The annual paddy production is 3,785,395 tonnes, which is about 11.5% of the total national production [47].
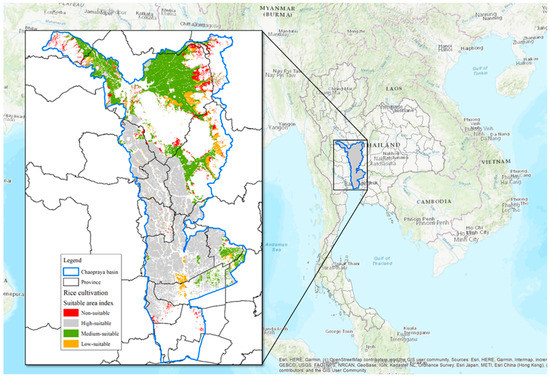
Figure 1.
Areas suitable for rice cultivation in the Chaopraya watershed.
Paddy rice land use, rice production, and yield in the Chaopraya watershed in 2009–18 are shown in Table 1. Land use for paddy rice in the area has not changed much over the past ten years. The yield has fluctuated because of climate conditions and has not been improved over the past ten years because of soil quality deterioration from intensive cultivation and non-sustainable agricultural practices [47,48,49,50,51,52,53,54,55,56]. The rice cultivation in this area is 2–3 crop cycles, starting from rain-fed rice as the first crop followed by irrigated rice as the second and third crop. The baseline data were selected to be based on 2016 because the most updated land-use geographic information system (GIS) data available from the Land Development Department of Thailand was in that year, and it is required for using in the scenario analysis.

Table 1.
Rice cultivation and price data in Chaopraya basin (2009–18).
Water demand and supply in the watershed during 2009–18 is presented in Figure 2. As shown in the figure, the results show the positive balance of the supply over the demand, but there is a risk situation because the amount of water demand and supply is close for most of the year with the demand over the supply in the year 2015. Moreover, the bar charts show the data of the total area based on yearly available water without looking at the spatial and temporal effects.
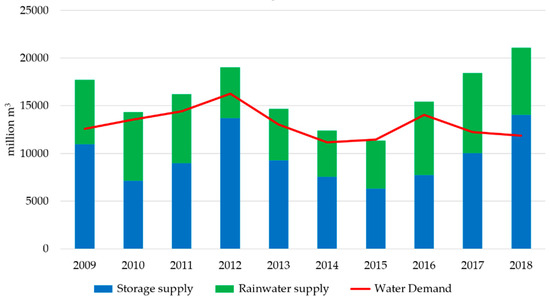
Figure 2.
Water demand and supply in the Chaopraya watershed during 2009–18.
2.2. Water and Energy Flow in the Base Case
2.2.1. Energy Sub-system Flow
Fuel and electricity are the most consumed energy resources in the basin. The sources of energy are classified as in-boundary production and trans-boundary imported resources which are further separated into domestic trans-boundary import and international trans-boundary import. Fuel supply to the Chaopraya basin is the international imported type; on the other hand, electricity is mainly produced domestically from several resources including natural gas, coal, hydropower and another renewable energy as shown in Figure 3. In-boundary energy consumption of the basin was characterized as direct and nexus utilization. Energy consumption in the basin is separated into three types, firstly, fuel and electricity energy that has been used directly in paddy cultivation and rice production process, secondly, energy utilization in other agriculture sectors, and lastly, the energy used in other sectors which consist of household, livestock, and industry. The nexus energy utilization is the auxiliary energy which has been utilized for water supply in each sector, such as agricultural irrigation and city plumbing supply system, which are functions of direct water utilization in the watershed.
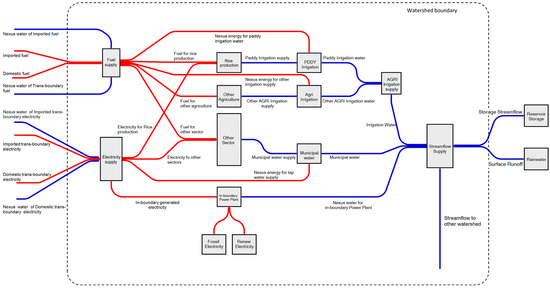
Figure 3.
Water and energy flow in Chaopraya basin.
2.2.2. Water Sub-System Flow
The water resources in the basin are from two sources, the runoff surface water and the trans-boundary water from reservoir storage in an outer basin under the Greater Chao Phraya irrigation project. The direct water utilization comprises three types. Firstly, the direct irrigation water used in annual paddy cultivation and water use in the rice production system. Secondly, the direct consumption in other crops. Lastly, the utilization of other sectors which consist of household, livestock, industrial, and ecosystem service demand. The nexus water utilization is the volume of water used for energy production, which is a function of the in-boundary energy production and trans-boundary energy production, as shown in Figure 3.
2.3. Nexus Model
The development of WEF nexus model in this study was adapted from generic WEF nexus framework from FAO [3] to support food security and sustainable agriculture. To analyze the interlinkage among the three components of water, energy, and food, the context analysis was implemented by a preliminary survey, literature review and interview with key stakeholders. The concept structure of the nexus model was set to display the flow of resources (water and energy) supply to food production, especially rice production systems compared to other food production systems and other sectors. Nexus resources use related to the demand for direct resource used can be quantified and displayed in the flow diagram. The parameters and flow components were selected, and interrelationship equations were developed to suit the local context and the main objective of assessing rice production system. The detailed calculation equations of this research are shown in Table 2. The integration system model has been summarized in Figure 4.

Table 2.
Details of the calculation equations.
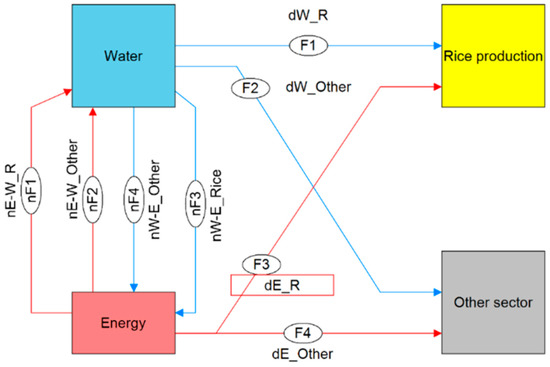
Figure 4.
Rice production Water-Energy-Food nexus (WEF nexus) framework.
The simplified processes are divided into two groups; resource supply side (water and energy supply) and resource demand side (rice production and other sectors (other agriculture, household, commercial, industrial, and ecosystem conservation)). The resource supply to rice production system included direct water (dW_R) and energy (dE_R) used in first and second paddy cultivation and rice processing. The direct water (dW_Other) and energy (dE_Other) used in other agriculture, municipal, and industrial processes were also separately quantified. Nexus water and energy in each sector were calculated from the function of direct resource utilization such as nexus water used in energy production and nexus energy for irrigation water supply and city plumbing supply system. Nexus energy to water for rice production (nE-W_R) and other sectors (nE-W_Other) can be separately calculated and displayed. Nexus water to energy for rice production (nW-E_R) and other sectors (nW-E_Other) can be separately calculated and displayed.
2.4. Resource Security Indicator
Implementation of nexus sustainability indicators is the approach recommended by the WEF nexus framework from FAO [3] to assess current resource security and sustainable status and to assess impact of intervention policies and measures applied. The concept of resource security assessment is to assess the aspect of availability, accessibility, and affordability of resources [3,23]. Apart from resource security, resource use efficiency indicators and economic indicators are also used for sustainability assessment. Resource security and sustainability in rice production system were analyzed based on the identification of availability, accessibility, and efficiency of resources. According the principle just mentioned, a set of indicators was selected based on the local context and purpose of the research. The equations are described in Table 3.

Table 3.
Equations of the indices used in this research.
2.5. Scenario Analysis
As mentioned in the introduction and the context of study area, almost half of the rice production in Thailand is for export. However, the climate and global competitive trade situation, and inefficiency practice in agriculture is putting resource stress and risk to natural resources without improving the income of farmers, especially in the Chaopraya watershed, which is the largest irrigation area. Therefore, policy or measure intervention to improve resource efficiency and resource security needs to be in place. The Ministry of Agriculture recently has launched the flagship policy to improve sustainability of agricultural practices in Thailand via several measures. The main alternative rice cultivation practice to improve resource efficiency under consideration by the Royal Irrigation Department, Ministry of Agriculture is Alternate Wet and Dry (AWD) system for paddy rice cultivation because it has good potential to reduce water consumption in rice and also reducing greenhouse gas emission [57]. Land-use zoning policy based on land suitability analysis was developed, and farmers have been persuaded to change the original crop to a more suitable, more profitable and less resource-intensive one. Rice is also a main target to crop to change to alternative crops including sugarcane, cassava and maize [14]. Bioeconomy policy in Thailand that aims to increase the value added of an agricultural product using feedstock from sugarcane and cassava for producing biochemical, biopharmaceutical, and biofuel products can have mutual benefit with land-use zoning and crop change policy [58,59,60].
Therefore, this research applied four scenarios based on the most likely policy interventions in Thailand mentioned above to evaluate the WEF nexus trade-offs and synergies of different management solutions on rice cultivation in the Chaopraya watershed, as described in Table 4. The first scenario is applying Alternate Wetting and Drying (AWD) system for paddy rice cultivation. The scenario will change 50% of the paddy area from the conventional cultivation method, which needs the rice field always being wet, to the alternating dry and wet practice. The AWD is to be able to reduce the water requirement of rice by about 27%, without effect to yield compared to the conventional wet practice according to average results from the literature [61,62,63,64,65].

Table 4.
Description of scenarios.
The second, third, and fourth scenarios are changing 160,000 ha of non-suitable, low-suitable and medium-suitable rice cultivation areas in the Chaopraya basin to sugarcane, cassava and maize respectively. The suitability index of paddy rice area was calculated by the Land Development Department of Thailand. The index was evaluated from the soil characteristics data, including physical and chemical properties, monthly rainfall data, crop requirement, forest area, land-use type, etc. The data interpretation and evaluation were performed using GIS and resulting in the final suitable index map, as shown in Figure 1 [66]. The proportions of the land areas in the Chaopraya watershed with different suitability are shown in Figure 5. These scenarios will affect the water and energy consumption of the area since sugarcane, cassava, maize, and paddy rice require a different amount of resources; in this research, we applied the general water and energy consumption of sugarcane, cassava, and maize from Gheewala et al. [67], Pingmuanglek et al. [68], and Jakrawatana et al. [69].
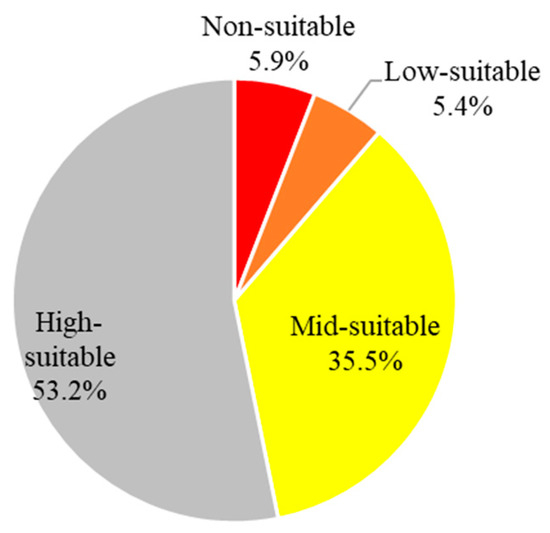
Figure 5.
Rice cultivation suitable area in Chaopraya basin.
3. Results and Discussion
3.1. Water and Energy Flow System
In the year 2016, the energy sub-system flow of the Chaopraya basin results showed that the basin mainly relies on fossil energy consumption (82%) and more than 90% of these fuel supplies were imported from other countries which resulted in higher dependency level of energy and lower self-sufficiency of the basin as well as at the national scale. The results of fossil energy consumption show a similar trend with other Asian countries, for example, Indonesia, Korea, Japan, and China [36,37,40].
Energy used in the area was classified into fuel (82%) and electricity (18%). Most of the fuel was consumed by the household, commercial, and industry sectors (85%), agriculture sector excluding rice consumed (14.5%) while the energy consumed in both direct and nexus water-related part of rice production was small compared to the other sectors as shown in Figure 6. The total energy used for rice accounted 3.7 million GJ or less than 1% of total energy used in the area. The energy use in rice production was classified into 68% fuel and 32% electricity. The energy consumption in rice production sectors in this study is lower than in Japan [37] which has a national rice production area about 1.5 times bigger than the Chaopraya basin, but the energy use in this sector is almost seven times higher than in the Chaopraya basin. The different practices of rice production in Japan that intensively use machine and technology could be the cause of larger energy consumption.
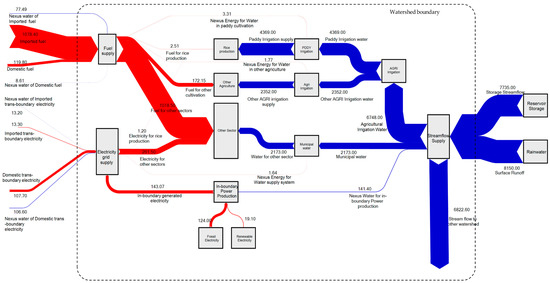
Figure 6.
Water and Energy flow system of the base case year (2016) (Water flow unit: million m3; Energy flow: million GJ).
In terms of electricity use, the grid-mix electricity purchased from the local electricity agency supplying from the power plants of the Electricity Generating Agency of Thailand (EGAT) and other private companies inside the basin was used. The in-boundary electricity production was able to support about 54% of the total basin usage. The rest of electricity usage came from trans-boundary electricity generation. Almost 99% of the electricity in the basin was utilized by the household, commercial, and industry sectors, the remaining by the rice production system (generally in milling process) and for supplying water.
The nexus energy for water is small, accounting for less than 1% of total energy use in the basin. However, when considering only the rice production sector, the nexus energy for water is almost equal to the direct energy use for rice production. On the other hand, compared to the study from Lin et al. (2019) in Xiamen city, China, the nexus energy for water production and supply accounted for 4.5% of total energy use in the city [40]. In South Korea and Indonesia, the nexus energy use for water production accounted for less than 3% [36].
Water utilization in the Chaopraya basin was vulnerable to water shortage since the surface water reliance is mainly on the outer basin reservoir. The watershed in-boundary rainwater is 51% of the total water resource supplied to the region, while the trans-boundary sources are the reservoir storage water provided from the large scale outbound dam. The storage from four large dams was supplied to the streamflow for the Chaopraya basin by almost half of total water supply. The irrigation water system was the major consumer due to the large scale of agriculture, and the most dominant consumer was paddy rice, both first and second rice, which withdrew about 45% of the annual water withdrawal, and the entire agriculture sector totally used 67% of the annual water withdrawal. The remaining water was utilized by other sectors, including household, industry, and ecosystem services. In South Korea and Indonesia, the ratio of water withdrawal for agriculture was 60% and 80%, respectively [36]. The water consumption in the rice production sector in this study is at the same rate as Japan [37] which has a national rice production area about 1.5 times bigger than the Chaopraya basin, and the water use in this sector is also 1.5 times higher than in the Chaopraya basin.
The nexus water use for energy production accounted for 8% of total water use in the basin. However, the water use for energy production for the rice production sector is very small. On the other hand, the nexus water use for energy in Xiamen city is significantly larger, accounting for 68.4% of total energy use in the city because the majority of water was used for electricity production and industry sector, while the allocation of water use for agriculture in Xiamen city is only 8.8% [40].
3.2. WEF Nexus in the Scenarios
The result of applying different scenarios is exhibited in Figure 7. In Scenario 1, the result of applying the AWD system affects directly to the irrigation water withdrawal and nexus-related energy for water supply. This scenario can reduce the water demand of annual paddy cultivation by 6% because the AWD application was covered for only the flat land that has the potential for the AWD. This practice slightly reduced the nexus-related energy for water by 6%.
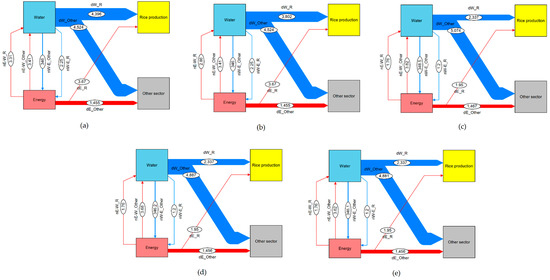
Figure 7.
Nexus model scenarios of Chaopraya basin: (a) Base case; (b) AWD; (c) R2S; (d) R2C; (e) R2M.
In the second scenario (R2S), land-use change from paddy cultivation to sugarcane was applied. The result of this change showed a high impact on water withdrawal and its nexus-related energy explicitly since the cultivation process of sugarcane requires lower irrigation water compared to paddy rice cultivation. The watershed water consumption in this scenario is lower than the base case by 17%. This impact also correspondingly resulted in reducing the nexus energy for water by 17%. However, direct energy consumption increased because sugarcane growing requires larger amount of fuel for machinery in land preparation and harvesting. Nevertheless, impact on nexus water for energy production is low because nexus water for energy production is very low compared to direct water use for crop production.
In the third and fourth scenarios (R2C) and (R2M), land-use change from paddy cultivation to cassava and maize were applied. Both scenarios have the same potential to reduce direct water withdrawal by 19%, which is better than Scenario 2. The nexus energy for water of the third and fourth scenarios was reduced by 19% and 20%, respectively. The direct energy consumption and nexus water for energy are not different from the base case. Therefore, in terms of water and energy conservation, they are better than Scenarios 1 and 2. However, eco-efficiency and benefit and cost analysis are evaluated in the next section to look at more detailed implications.
3.3. Resource Security and Economic Analysis
Figure 8a1 reveals that there is an extremely high water withdrawal to availability (WTA = 0.997). Since the water withdrawn for each sector was quite high and close to the basin water availability, thus in the research focus year 2016, the basin was faced with a lower water resource situation, subsequently leading to competition and struggle for water resources for each sector. Applying AWD in Scenario 1 has lower WTA reduction potential than land use and crop change in Scenarios 2, 3 and 4, considering the limited area that can apply AWD without significant adjustment. Scenario 4 exhibited the best potential in WTA reduction because of the great difference in crop water requirements between rice and maize and very low impact on nexus water for energy production. Considering the Water Stress Index (WSI) score from Figure 8a2, owing to the WSI methodology applied in this research, which considers the seasonal water demand and availability, changing crop plantation can reduce the stress in dry season significantly resulting subsequently in annual WSI reduction. The wet season has high stress because of the shift in the rainy period and the limited storage water used to retain the planted crop during the drought period. Scenario 4 has the best performance to reduce water stress in the dry season but has the second performance to reduce water stress in the wet season. The study from another region that has the similar characteristic of intensive rice production area like Juru watershed in Penang State, Malaysia WTA has an extreme water stress at 0.999 [70]. Water eco-efficiency (WEE) analysis results in Figure 8a3 show that Scenarios 2 and 3 changing rice to sugarcane and rice to cassava had the best and second best performance because the higher price of the crop made more benefit than maize in the Scenario 4.
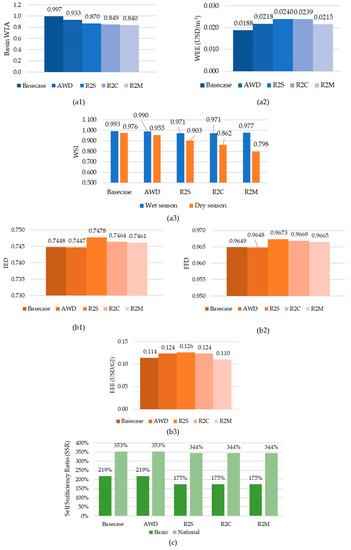
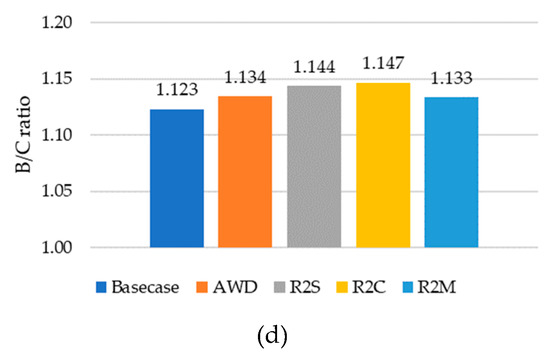
Figure 8.
Resource security and economic analysis indicators. (a1–a3): Water Indicators; (b1–b3): Energy Indicators; (c): Food Indicators; (d): Economic Indicators.
In Figure 8b1, the results show that the basin has a very high fossil fuel dependency (FFD = 0.965) and high imported energy dependency (IED = 0.745) because of the end-use consumption in the basin mostly from fossil fuel combustion in many sectors. Applying different scenarios have various results of FFD and IED. It displayed some negative results of applying land-use change, especially in Scenario 2 (R2C), since the cultivation of sugarcane requires more energy consumption than paddy rice production. However, an increase in energy consumption in the related agricultural sectors does not affect the energy security characteristics of the basin significantly. The change of FFD and IED in the worst scenario accounted for only 0.2% and 0.4%, respectively.
Self-Sufficiency Ratio at both watershed and national level in Figure 8c shows that Thailand has strong food security. The results of applying different scenarios on the rice production system showed a small decrease in security; however, the rice production of Thailand is still more than twice the total domestic consumption each year. This situation is different from other Asian countries relying mainly on importing food, for example Japan [37] that has SSF = 91% for rice and Korea [36] that has SSF = 91% for rice. According to Lee et al. (2018), the attempt to increase SSF to be 100% for Japan can result in increasing significant amount of water use [37].
Since the benefits of paddy cultivation farmers in the Chaopraya basin play an important role in the possibility of inducing farmers to change their practice, higher benefit and lower price risk are the major drivers that affect these decisions directly. The result of the benefit/cost ratio in the different scenarios, as shown in Figure 8d, indicates that B/C ratio in base case is 1.12 which means the net income of farmer in the basin is about 16% of total cost. However, due to the instability of paddy rice pricing over the past ten years, the farmers have always been faced with income risk. Applying Scenario 2 and 3 that has highest B/C ratio might be the better solution because of lower resource consumption, but since the price of cassava still has small fluctuations, pricing regulation should pragmatically be applied in this case.
4. Conclusions
In this study, the framework to evaluate the water, food, and energy interrelationship in the rice production system at the watershed scale was demonstrated using the parameters and equations facilitating the analysis in the rice production sector. This research shows the advantage of using the MFA approach to visualize the relationship of the WEF nexus and link with the selected indicators to assess the water, energy, and food security and sustainability in the dimension of resource use efficiency and economic analysis. The spatial and temporal effects of water availability, not considered in the previous studies, were also accounted in the analysis framework. The tool was applied to evaluate the trade-off and synergy of alternative options for agricultural management including Alternate Wetting and Drying technique (AWD) for water management and land use and crop change options, in terms of performance to conserve water and energy resources, increase eco-efficiency and increase the benefit and cost ratio, taking nexus relationship effect into consideration.
The case study area, Chaopraya watershed, produces rice for export while, however, consuming almost half of water resource in the watershed, thus putting high stress on water. The remaining water is utilized by other sectors, and less than 5% was nexus-related water utilized in internal power production. In this area, energy use for water irrigation and supply was also small. The results from assessing resource security indicators showed that the Chaopraya basin has high risk in water security, moderate risk in energy security and low risk in food security. The alternative options related to the land-use change may result in a quite better performance in a trade-off situation than the Alternate Wet and Dry System option. Scenario 4, land-use change from paddy cultivation to maize, has the high potential to reduce the water risk with very low impact on energy security and food security considering all the nexus relationships. However, Scenario 4 showed a lower net economic benefit than Scenario 2, land-use change from paddy cultivation to sugarcane. Therefore, decision makers need to take all trade-off results into consideration before making decision. The price of water and food can be the main factor for the final economic results for the decision of government or farmers. Therefore, a detailed analysis of this issue is recommended for further research. The dynamic system model that includes the feedback loop and other socio-economic factors for analyzing the future trend could be useful for further research. Analyzing the impact of climate change on future water and energy availability within this model is also recommended for further research.
Author Contributions
Conceptualization, P.N. (Pitak Ngammuangtueng) and N.J.; Data curation, P.N. (Pitak Ngammuangtueng) and P.N. (Pariyapat Nilsalab); Methodology, N.J.; Resources, P.N. (Pitak Ngammuangtueng) and P.N. (Pariyapat Nilsalab); Supervision, N.J.; Validation, S.H.G.; Visualization, P.N. (Pitak Ngammuangtueng); Writing—Original draft, P.N. (Pitak Ngammuangtueng) and N.J.; Writing—Review & editing, S.H.G.
Funding
This research was funded by the National Science and Technology Development Agency (NSTDA), grant number: FDA-CO-2559-3268-TH.
Conflicts of Interest
The authors declare no conflict of interest.
References
- Hoff, H. Understanding the Nexus. In Proceedings of the The Water, Energy and Food Security Nexus; Springer: Bonn, Germany, 2011. [Google Scholar]
- FAO. Walking the Nexus Talk: Assessing the Water-Energy-Food Nexus in the Context of the Sustainable Energy for All Initiative; FAO: Rome, Italy, 2014. [Google Scholar]
- FAO. The Water-Energy-Food Nexus. A New Approach in Support of Food Security and Sustainable Agriculture; FAO: Rome, Italy, 2014. [Google Scholar]
- Issawilanont, S. Production Marketing and Creating Rice Networks. In Roi Khaen Kalasin Provincial Cluster Seminar; Khonkhan Provincial Office: Khonkhan, Thailand, 2015. [Google Scholar]
- Issawilanont, S. Rice research to Thailand 4.0; Agricultural Research Development Agency in collaboration with the rice partner organizations4: Bangkok, Thailand, 2018. [Google Scholar]
- Lamjiak, R. Vietnam rice policy: the Main Trade Rival of Thailand; The Secretariat of the Senate: Bangkok, Thailand, 2014. Available online: http://library.senate.go.th/document/Ext7661/7661093_0002.PDF (accessed on 5 October 2019).
- Boonyaprapas, C. Sustainable Thai Rice Development; Prachachart: Bangkok, Thailand, 2017. [Google Scholar]
- Puapongsakorn, N.; Thitapiwatanakul, B.; Tohkritsana, R.; Sirisupalak, P.; Nititanprapas, I.; Napasinthuwong, O.; Supanchad, W.; Sanglertsawai, S.; Udomsopakit, S.; Lathapipat, D. Thai Rice Strategy Project; Thai Rice Research Development and Forward-Looking Thailand Policy Monitoring Project; Thailand Research Fund(TRF). 2013. Available online: http://www.agripolicyresearch.com/wp-content/plugins/download-attachments/includes/download.php?id=3537 (accessed on 5 October 2019).
- TREA. Rice Export Quantity and Value: 2016; Thailand Rice Exporters Association: Bangkok, Thailand, 2018. [Google Scholar]
- RID. Water Management and Crop Plantation Plan of 2016 Wet and Dry Season; Royal Irrigation Department; Ministry of Agriculture: Bangkok, Thailand, 2016. [Google Scholar]
- Gheewala, S.; Silalertruksa, T.; Nilsalab, P.; Lecksiwilai, N.; Sawaengsak, W.; Mungkung, R.; Ganasut, J. Water stress index and its implication for agricultural land-use policy in Thailand. Int. J. Environ. Sci. Technol. 2017, 15, 833–846. [Google Scholar] [CrossRef]
- HAII. Data Collecting and Analyzing, 25 Basin Database Warehouse and Flood-Drought Model Development Projects: Chaopraya Basin; Hydro and Agro Informatics Institute: Bangkok, Thailand, 2012. [Google Scholar]
- Hoekstra, A.Y.; Hung, P.Q. Globalisation of water resources: International virtual water flows in relation to crop trade. Glob. Environ. Chang. 2005, 15, 45–56. [Google Scholar] [CrossRef]
- Ministry of Agriculture. Executive Summary of Main Agricultural Policy and Progress of Implementation; Ministry of Agriculture: Bangkok, Thailand, 2018. (In Thailand)
- Baccini, P.; Brunner, P.H. Metabolism of the Anthroposphere; Springer: Heidelberg/Berlin, Germany; New York, NY, USA, 1991; New edition March. MIT Press: Cambridge, MA, USA, 2012. [Google Scholar]
- Brunner Paul, H.; Rechberger, H. Anthropogenic Metabolism and Environmental Legacies Archived December 17, 2008, at the Wayback Machine in Encyclopedia of Global Environmental Change; Wiley: New York, NY, USA, 2002; ISBN 0-471-97796-9. [Google Scholar]
- Obernosterer, R.; Brunner, P.H.; Daxbeck, H.; Gagan, T.; Glenck, E.; Hendriks, C.; Morf, L.; Paumann, R.; Reiner, I. IUrban Metabolism: The City of Vienna, Case Study Report 1. In Materials Accounting as a Tool for Decision making in Environmental Policy (MacTEmPo); Final Report EC Program Environment and Climate 1994–1998; Institute for Water Quality and Waste Management, Vienna University: Vienna, Austria, 1998; ENV4–CT96–0230; Available online: http://publik.tuwien.ac.at/files/PubDat_143905.pdf (accessed on 15 September 2019).
- Hendriks, R.; Obernosterer, D.; Müller, S.; Kytzia, P.; Baccini, P.H. Brunner, Carolyn Material Flow Analysis: A tool to support environmental policy decision making. Case-studies on the city of Vienna and the Swiss lowlands. Local Environ. 2000, 5, 311. [Google Scholar] [CrossRef]
- Lennox, A.J.; Turner, G. State of the Environment Report: Report on Human Settlements, Stocks and Flows Indicators; Department of the Environment and Heritage: Canberra, Australia, 2005. [Google Scholar]
- Jakrawatana, N.; Ngammuangtueng, P.; Gheewala, S.H. Linking substance flow analysis and soil and water assessment tool for nutrient management. J. Clean. Prod. 2017, 142, 1158–1168. [Google Scholar] [CrossRef]
- Pingmuanglek, P.; Jakrawatana, N.; Gheewala, S.H. Freshwater use analysis of cassava for food feed fuel in the Mun River basin, Thailand. Int. J. Life Cycle Assess. 2017, 22, 1705–1717. [Google Scholar] [CrossRef]
- Lofman, D.; Petersen, M.; Bower, A. Water, Energy and Environment Nexus: The California Experience. Int. J. Water Resour. Dev. 2002, 18, 73–85. [Google Scholar] [CrossRef]
- United Nations ESCAP. The Status of the Water-Food-Energy Nexus in Asia and the Pacific; United Nations publication: New York, NY, USA, 2013. [Google Scholar]
- GIZ. The Water-Energy-Food Security Nexus: A Review of Nexus Literature and Ongoing Nexus Initiatives for Policymakers; Nexus Regional Dialogue Programme (NRD): Bonn, Germany, 2018. [Google Scholar]
- Newell, J.; Goldstein, B.; Foster, A. A 40-year review of food–energy-water nexus literature and its application to the urban scale. Environ. Res. Lett. 2019, 14, 073003. [Google Scholar] [CrossRef]
- Albrecht, T.R.; Arica Crootof, A.; Scott, C.A. The Water-Energy-Food Nexus: A systematic review of methods for nexus assessment. Environ. Res. Lett. 2018, 13, 043002. [Google Scholar] [CrossRef]
- Daher, B.T.; Mohtar, R.H. Water–Energy–Food (WEF) Nexus Tool 2.0: Guiding Integrative Resource Planning and Decision-Making. Water Int. 2015, 8060, 1–24. [Google Scholar] [CrossRef]
- Owen, A.; Scott, K.; Barrett, J. Identifying critical supply chains and final products: An input-output approach to exploring the energy-water-food nexus. Appl. Energy 2018, 210, 632–642. [Google Scholar] [CrossRef]
- Salmoral, G.; Yan, X. Food-energy-water nexus: A life cycle analysis on virtual water and embodied energy in food consumption in the Tamar catchment, UK. Resour. Conserv. Recycl. 2018, 133, 320–330. [Google Scholar] [CrossRef]
- Al-Ansari, T.; Korre, A.; Nie, Z.; Shah, N. Development of a life cycle assessment tool for the assessment of food production systems within the energy, water and food nexus Sustain. Prod. Consum. 2015, 2, 52–66. [Google Scholar] [CrossRef]
- De Laurentiis, V.; Hunt, D.V.L.; Rogers, C.D.F. Overcoming food security challenges within an energy/water/food nexus (EWFN) approach. Sustainability 2016, 8, 95. [Google Scholar] [CrossRef]
- Irabien, A.; Darton, R.C. Energy–water–food nexus in the Spanish greenhouse tomato production. Clean. Technol. Environ. Policy 2015, 18, 1307–1316. [Google Scholar] [CrossRef]
- Cottee, J.; Lopez-Aviles, A.; Behzadian, K.; Bradley, D.; Butler, D.; Downing, C.; Farmani, R.; Ingram, J.; Leach, M.; Pike, A.; et al. The Local Nexus Network: Exploring the Future of Localised Food Systems and Associated Energy and Water Supply Sustainable Design and Manufacturing 2016. In Smart Innovation, Systems and Technologies; Springer: Cham, Switzerland, 2016; Volume 52, pp. 613–624. ISBN 978-3-319-32096-0. [Google Scholar]
- Daccache, A.; Ciurana, J.S.; Rodriguez Diaz, J.A.; Knox, J.W. Water and energy footprint of irrigated agriculture in the Mediterranean region. Environ. Res. Lett. 2014, 9, 124014. [Google Scholar] [CrossRef]
- Damerau, K.; Patt, A.G.; van Vliet, O.P.R. Water saving potentials and possible trade-offs for future food and energy supply. Glob. Environ. Chang 2016, 39, 15–25. [Google Scholar] [CrossRef]
- Wicaksono, A.; Kang, D. Nationwide simulation of water. Energy, and food nexus:case study in South Korea and Indonesia. J. Hydro-Environ. Res. 2019, 2, 70–87. [Google Scholar] [CrossRef]
- Lee, S.-H.; Taniguchi, M.; Mohtar, R.; Choi, J.-Y.; Yoo, S.-H. An Analysis of the Water-Energy-Food-Land Requirements and CO2 Emissions for Food Security of Rice in Japan. Sustainability 2018, 10, 3354. [Google Scholar] [CrossRef]
- Hu, M.-C.; Fan, C.; Huang, T.; Wang, C.-F.; Chen, Y.-H. Urban Metabolic Analysis of a Food-Water-Energy System for Sustainable Resources Management. Int. J. Environ. Res. Public Health 2018, 16, 90. [Google Scholar] [CrossRef]
- Perrone, D.; Murphy, J.; Hornberger, G.M. Gaining Perspective on the Water−Energy Nexus at the Community Scale. Environ. Sci. Technol. 2011, 45, 4228–4234. [Google Scholar] [CrossRef]
- Lin, J.; Kang, J.; Bai, X.; Li, H.; Lv, X.; Kou, L. Modeling the urban water-energy nexus: A case study of Xiamen, China. J. Clean. Prod. 2019, 215, 680–688. [Google Scholar] [CrossRef]
- Howells, M.; Hermann, S.; Welsch, M.; Bazilian, M.; Engström, R.; Alfstad, T.; Gielen, D.; Rogner, H.; Fischer, G.; Velthuizen, H.; et al. Integrated Analysis of Climate Change, Land-Use, Energy and Water Strategies. Nat. Clim. Chang. 2013, 3, 621. [Google Scholar] [CrossRef]
- Giampietro, M.; Aspinall, R.; Bukkens, S.; Cadillo, J.; Diaz-Maurin, F.; Flammini, A.; Gomiero, T.; Kovacic, Z.; Madrid Lopez, C.; Ramos-Martin, J.; et al. An Innovative Accounting Framework for the Food-Energy-Water Nexus: Application of the Musiasem Approach to Three Case Studies; FAO: Rome, Italy, 2013; ISBN 978-92-5-107957-7. [Google Scholar]
- Villarroel Walker, R.; Beck, M.B.; Hall, J.W.; Dawson, R.J.; Heidrich, O. The energy-water-food nexus: Strategic analysis of technologies for transforming the urban metabolism. J. Environ. Manag. 2014, 141, 104–115. [Google Scholar] [CrossRef] [PubMed]
- Mukuve, F.M.; Fenner, R.A. Scale variability of water, land, and energy resource interactions and their influence on the food system in Uganda. Sustain. Prod. Consum. 2015, 2, 79–95. [Google Scholar] [CrossRef]
- Bazilian, M.; Rogner, H.; Howells, M.; Hermann, S.; Arent, D.; Gielen, D.; Steduto, P.; Mueller, A.; Komor, P.; Tol, R.S.J.; et al. Considering the energy, water and food nexus: Towards an integrated modeling approach. Energy Policy 2011, 39, 7896–7906. [Google Scholar] [CrossRef]
- Miara, A.; Pienkos, P.T.; Bazilian, M.; Davis, R.; Macknick, J. Planning for algal systems: An energy-water-food nexus perspective. Ind. Biotechnol. 2014, 10, 202–211. [Google Scholar] [CrossRef]
- OAE. Agricultural Statistics of Thailand 2016. Office of Agriculture and Economics, Ministry of Agriculture and Cooperatives, Bangkok. Available online: http://www.oae.go.th/assets/portals/1/files/ebook/yearbook59.pdf (accessed on 20 June 2019).
- OAE. Agricultural Statistics of Thailand 2009. Office of Agriculture and Economics, Ministry of Agriculture and Cooperatives, Bangkok. Available online: http://www.oae.go.th/assets/portals/1/files/ebook/yearbook52.pdf (accessed on 20 June 2019).
- OAE. Agricultural Statistics of Thailand 2010. Office of Agriculture and Economics, Ministry of Agriculture and Cooperatives, Bangkok. Available online: http://www.oae.go.th/assets/portals/1/files/ebook/yearbook53.pdf (accessed on 20 June 2019).
- OAE. Agricultural Statistics of Thailand 2011. Office of Agriculture and Economics, Ministry of Agriculture and Cooperatives, Bangkok. Available online: http://www.oae.go.th/assets/portals/1/files/ebook/yearbook54.pdf (accessed on 20 June 2019).
- OAE. Agricultural Statistics of Thailand 2012. Office of Agriculture and Economics, Ministry of Agriculture and Cooperatives, Bangkok. Available online: http://www.oae.go.th/assets/portals/1/files/ebook/yearbook55.pdf (accessed on 20 June 2019).
- OAE. Agricultural Statistics of Thailand 2013. Office of Agriculture and Economics, Ministry of Agriculture and Cooperatives, Bangkok. Available online: http://www.oae.go.th/assets/portals/1/files/ebook/yearbook56.pdf (accessed on 20 June 2019).
- OAE. Agricultural Statistics of Thailand 2014. Office of Agriculture and Economics, Ministry of Agriculture and Cooperatives, Bangkok. Available online: http://www.oae.go.th/assets/portals/1/files/ebook/yearbook57.pdf (accessed on 20 June 2019).
- OAE. Agricultural Statistics of Thailand 2015. Office of Agriculture and Economics, Ministry of Agriculture and Cooperatives, Bangkok. Available online: http://www.oae.go.th/assets/portals/1/files/ebook/yearbook58.pdf (accessed on 20 June 2019).
- OAE. Agricultural Statistics of Thailand 2017. Office of Agriculture and Economics, Ministry of Agriculture and Cooperatives, Bangkok. Available online: http://www.oae.go.th/assets/portals/1/files/ebook/yearbook60.pdf (accessed on 20 June 2019).
- OAE. Agricultural Statistics of Thailand 2018. Office of Agriculture and Economics, Ministry of Agriculture and Cooperatives, Bangkok. Available online: http://www.oae.go.th/assets/portals/1/files/jounal/2562/yearbook2561.pdf (accessed on 20 June 2019).
- RID. Alternate Wet and Dry (AWD) System for Paddy Rice Cultivation; Royal Irrigation Department, Ministry of Agriculture: Bangkok, Thailand, 2015.
- Bhumiratana, S. Bioeconomy in the context of Thailand. In Proceedings of the Thai-German Bioeconomy Conference: Cooperation Opportunities for a Sustainable Bioeconomy, Chiang Mai, Thailand, 28–29 January 2016. [Google Scholar]
- Tanticharoen, M. Bioeconomy in the Context of Thailand; GBS: Berlin, Germany, 2018. [Google Scholar]
- Thailand Board of Investment. Thailand’s Bioeconomy Industry; Thailand Board of Investment: Bangkok, Thailand, 2017. [Google Scholar]
- Maneepitak, S.; Ullah, H.; Paothong, K.; Kachenchart, B.; Datta, A.; Shrestha, R.P. Effect of water and rice straw management practices on yield and water productivity of irrigated lowland rice in the Central Plain of Thailand. Agric. Water Manag. 2019, 211, 89–97. [Google Scholar] [CrossRef]
- Stuart, A.M.; Pame, A.R.P.; Vithoonjit, D.; Viriyangkura, L.; Pithuncharurnlap, J.; Meesang, N.; Suksiri, P.; Singleton, G.R.; Lampayan, R.M. The application of best management practices increases the profitability and sustainability of rice farming in the central plains of Thailand. Field Crop. Res. 2018, 220, 78–87. [Google Scholar] [CrossRef]
- Carrijo, D.R.; Lundy, M.E.; Linquist, B.A. Rice yields and water use under alternate wetting and drying irrigation: A meta-analysis. Field Crop. Res. 2017, 203, 173–180. [Google Scholar] [CrossRef]
- LaHue, G.T.; Chaney, R.L.; Adviento-Borbe, M.A.; Linquist, B.A. Alternate wetting and drying in high yielding direct-seeded rice systems accomplishes multiple environmental and agronomic objectives. Agric. Ecosyst. Environ. 2016, 229, 30–39. [Google Scholar] [CrossRef]
- Rejesus, R.M.; Palis, F.G.; Rodriguez, D.G.P.; Lampayan, R.M.; Bouman, B.A.M. Impact of the alternate wetting and drying (AWD) water-saving irrigation technique: Evidence from rice producers in the Philippines. Food Policy 2011, 36, 280–288. [Google Scholar] [CrossRef]
- Maneewan, N. Determination of Suitable Area for Economic Crops. In Proceedings of the the 4th National Seminar on Soil and Fertilizer, Bangkok, Thailand, 4–8 July 2015. [Google Scholar]
- Gheewala, S.H.; Silalertruksa, T.; Prasara, A.J.; Prapaspongsa, T.; Jakrawatana, N.; Pongpat, P.; Sawaengsak, W.; Permpool, N.; Chatwachirawong, P.; Leal, M.R.L.V. Sustainability assessment of sugarcane complex for enhancing the competitiveness of Thai sugarcane industry. In The Joint Graduate School Energy and Environment; King Mongkut’s University of Technology: Thonburi, Thailand, 2016. [Google Scholar]
- Pingmuanglek, P. An Analysis of Alternatives for Sustainable Management of Cassava and Its Related Products for the Future Sustainability of Food and Biofuels; University of Phayao: Phayao, Thailand, 2016. [Google Scholar]
- Jakrawatana, N. Material Flow Cost Accounting of Maize Supply Chain in Thailand for Improving Eco-Efficiency. Asian J. Account. Gov. 2016, 8, 107–121. [Google Scholar]
- Hanafiah, M.; Ghazali, N.; Harun, N.; Abdulaali, S.; Abdulhasan, M.; Khairul, M.; Kamarudin, M. khairul amri Desalination; Water Treatment. Assessing water scarcity in Malaysia: A case study of rice production. Desalin. WATER Treat. 2019, 149, 274–287. [Google Scholar] [CrossRef]
© 2019 by the authors. Licensee MDPI, Basel, Switzerland. This article is an open access article distributed under the terms and conditions of the Creative Commons Attribution (CC BY) license (http://creativecommons.org/licenses/by/4.0/).