Article

Assessing the Impacts of Urban Expansion on Bundles of Ecosystem Services by Dmsp-Ols Nighttime Light Data

1
School of Surveying and Land Information Engineering, Henan Polytechnic University, Jiaozuo 454003, China
2
Nanjing Institute of Environmental Sciences, Ministry of Ecology and Environment of the People’s Republic of China, Nanjing 210042, China
*
Author to whom correspondence should be addressed.
Sustainability 2019, 11(21), 5888; https://doi.org/10.3390/su11215888
Submission received: 16 September 2019 / Revised: 18 October 2019 / Accepted: 20 October 2019 / Published: 23 October 2019

Abstract

:
Urban expansion poses severe threats to ecosystems. It is therefore important we better understand the impact of different urban expansion level on ecosystems for developing regionally differentiated ecological protection policies. Here, we proposed a conceptual framework to describe the impacts of urbanization on bundles of ecosystem services. Referred to as the concept of land use degree by nighttime light data, we put forward and verified an urban expansion level model. According to this model, study area was divided into a slow increase zone, increase zone, and rapid increase zone. Then, taking Taihu Lake Basin in China as a case, we used Zonal-statistics and Pearson correlation coefficients to reveal the impact in different zones of urban expansion level on multiple ecosystem services: crop production, freshwater supply, aquatic production, net primary productivity, soil conservation, water retention, flood regulation, and forest recreation index. Our results revealed that urban expansion levels significantly impacted all ecosystem services. In either increase zone or rapid increase zone, we found lowered values of crop production, net primary productivity, soil conservation, water retention, and flood regulation, while both aquatic production and forest recreation index increased in all zones from 1990 to 2010. Across the levels of urbanization, urban expansion level was always negatively correlated with provisioning services. This result suggests local governors should improve crop production per unit area and increase the cultivated land area to guarantee food security. In addition, urban expansion level had positive correlations with the trade-offs between flood regulation and forest recreation index, and those among crop production, freshwater supply, and net primary productivity. Therefore, policy-makers should effectively maintain the land use balance among ecological protection, agriculture development, and urban expansion to better coordinate relationships between development and protection. In acquiring quantitative knowledge of how urban expansion level drives ecosystem changes, our findings may help guide future sustainable urban planning with respect to ecosystem services, urban development, and human welfare benefits.

1. Introduction

The Millennium Ecosystem Assessment [1] concluded that 15 of the 24 global ecosystem service functions—more than 60% of the total—are degrading, consistent with The Economics of Ecosystems and Biodiversity research that revealed the global ecological environment is under grave threat [2]. Some researchers have suggested that the changes in land use patterns in recent years have already caused a decline in the global ecological environment [3], one that will directly threaten regional and global ecological security [1,4]. Changes to ecosystem services are both affected by natural and human activities, but the latter unabated will undoubtedly undermine ecosystem functioning, which may alter the very environment human societies depend upon [5].
Urban expansion is a complex process involving many factors, including social economy, population, and geographical space [6]. Urban expansion level (UEL) is a comprehensive indicator of urban expansion, which can not only reflect the changes in urban construction land area, but also in urban economic, population density, landscape pattern, etc., since UEL can be used to strengthen the monitoring of urban expansion, which is of great significance to regional sustainable management. Yet how to effectively determine this UEL remains a pressing problem. Currently, the key and composite index methods are commonly used to measure urban expansion [7]. However, one-sidedness of a single indicator [8], regionality of composite indicators [9,10], and lags in statistical data [11,12], have rendered these two indexes insufficient in applicability, comparability, and timeliness [12].
Recent advances in remote sensing technology now provide the technical support to solve the problem through the collection and application of nighttime light image [12,13]. The nighttime light data obtained by the Operational Line Scan System (OLS) of the Defense Meteorological Satellite Program (DMSP) can effectively detect low-intensity light signals generated by urban lighting, and even small-scale residential lighting and light from traffic. It has served as an excellent source of data for monitoring human activities and studying urban expansion [14,15,16]. Due to differences in atmospheric conditions and satellite sensors, we cannot directly compare original images from different years, which made it hard to use long-term sequence images for urban expansion analysis [17]. Calibration models including the invariant region method [18] and Pseudo Invariant Features [17] method were developed to realize intercalibration, saturation correction and continuity correction [19]. Therefore, developing an UEL model that can comprehensively convey the characteristics of urban expansion with high comparability, based on the rapid acquisition of data, have been taken as priority. However, few studies have yet quantified UEL to characterize urban expansion based on nighttime light data [9].
Taihu Lake Basin (TLB) is located in the eastern part of the Yangtze River Economic Zone in China. From 1985 to 2010, it has experienced profound changes that include rapid economic development (annual gross domestic product growth rate of 15.7%), human population increases (annual population growth rate of 3.0%), and urban expansion (annual urbanization growth rate of 9.2%). Basin has fed 4.8% of the national population with 0.38% of the national land area and created 11.6% of national gross domestic product in 2010 [20]. Which has fueled population growth and urban expansion, leading to the replacement of farmland and wetlands around the city with construction land. Moreover, key ecosystem services (ESs), such as crop production [21], water purification [20], and carbon sequestration [22] have considerably deteriorated with a rapid urbanization. In order to study the impact of urban expansion and ESs, a lot of research has been done [23]. However, few studies analyzed impact of changes in urban expansion level on bundles of ESs (i.e., trade-offs and synergies among ESs). Identifying spatial interactions among ESs is the foundation and prerequisite for ES management [24], which provides an approach to reveal the ecological effects of urban expansion on the spatial-temporal ESs interaction view.
To this end, we used the Taihu Lake Basin as a case study to explore the impact of urban expansion on ecosystem services. Referring to nighttime light data, multi-period land use/cover data, related parameters and socioeconomic statistical data, we proposed and verified an urban expansion level (UEL) index and estimated multiple ESs. Then, Zonal-statistics and Pearson correlation coefficients were used to reveal the impact of UEL on ESs under different UEL zones. Eight ecosystem services (ESs), including crop production (CP), freshwater supply (FS), aquatic production (AP), net primary productivity (NPP), soil conservation (SC), water retention (WR), flood regulation (FR) and forest recreation index (FRI), were used to derive key indicators for gauging how UEL can change ESs, especially bundles of ESs. This research thus enhances our understanding of the complex interactions among multiple ESs under different urban expansion levels, which should help to devise a green urbanization path and to tailor its ecological protection policy for the rapid urbanization watershed throughout the world.

2. Materials and Methods
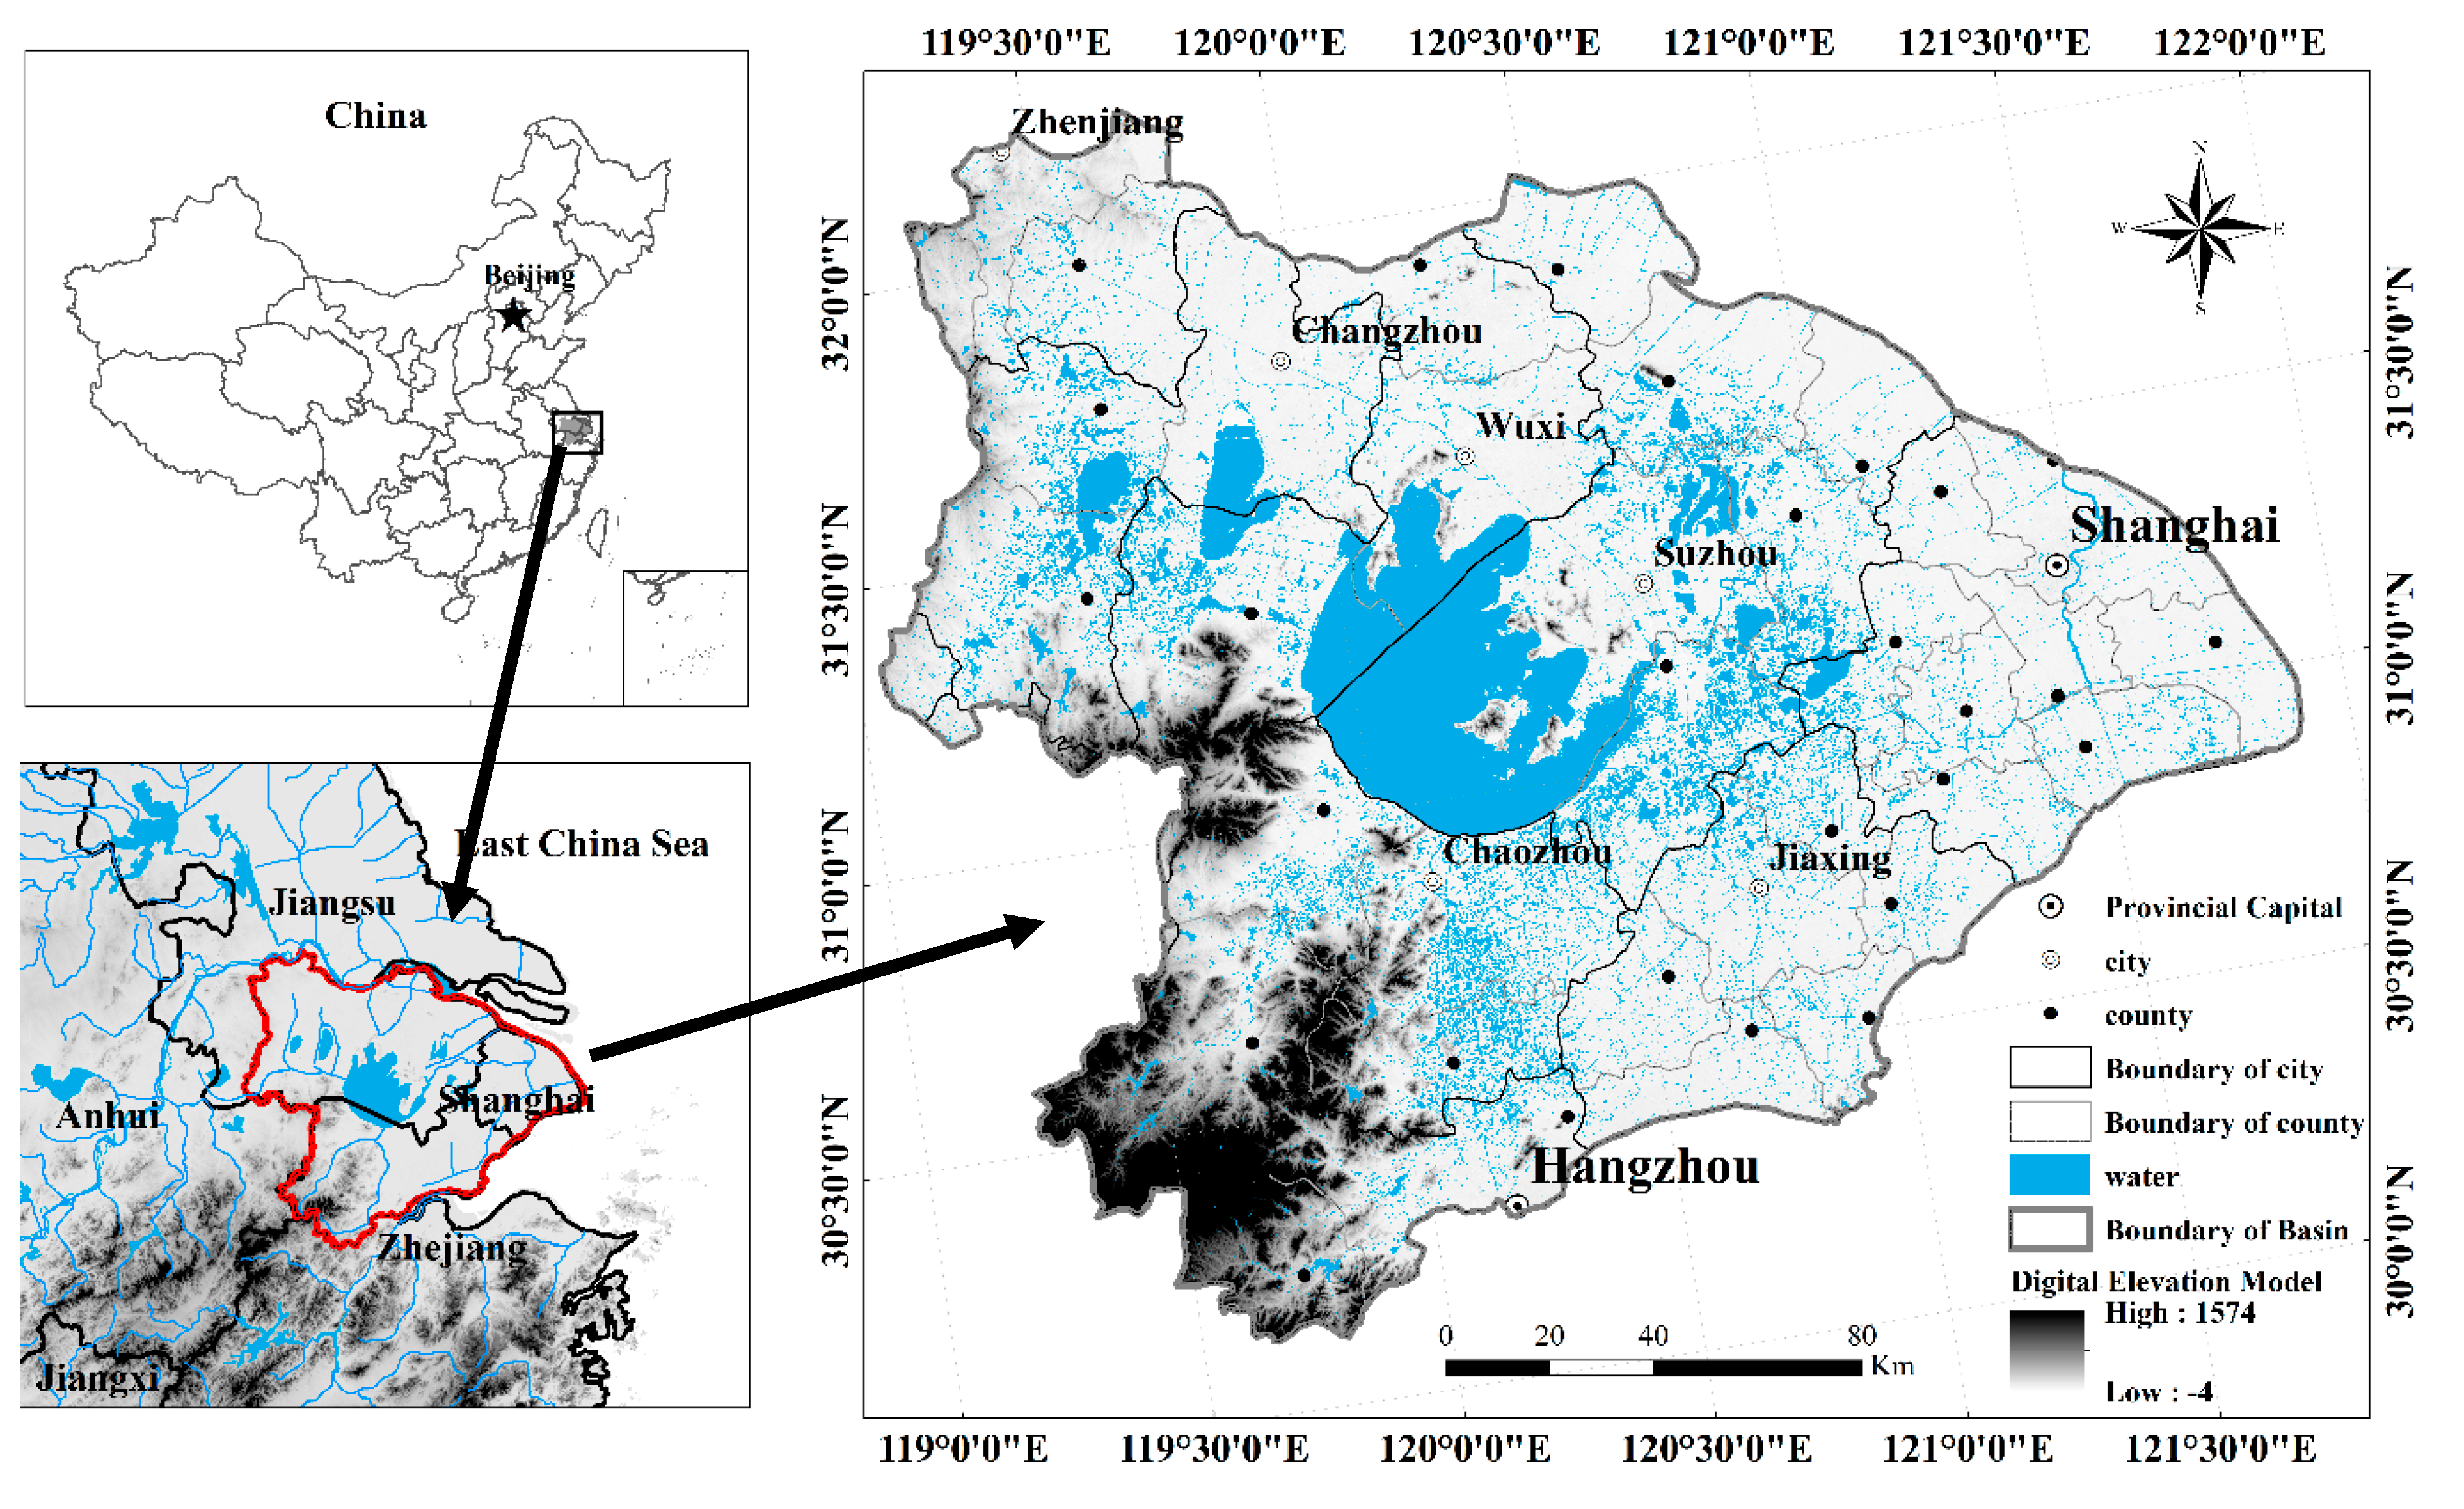
2.1. Study Area

The Taihu Lake Basin (TLB) is located in the eastern part of the Yangtze River Economic Zone in China. The land area of basin is 36,900 km2. Its administrative division includes the southern part of Jiangsu Province, Huzhou City of Zhejiang Province, and parts of Jiaxing City and Hangzhou City, and most of the Shanghai Municipality (Figure 1). The basin harbors a dense river network, and river channel density in the plains area is 3.2 km/km2. TLB has a lake area totaling 3160 km2 (based on the surface area of lakes > 0.5 km2 in area), which account for 10.7% of the basin’s plain area. There are 10 lakes with an area of more than 10 square kilometers, while Taihu Lake (2427.8 km2) is the largest freshwater lake in the basin and the third largest freshwater lake in China [25].

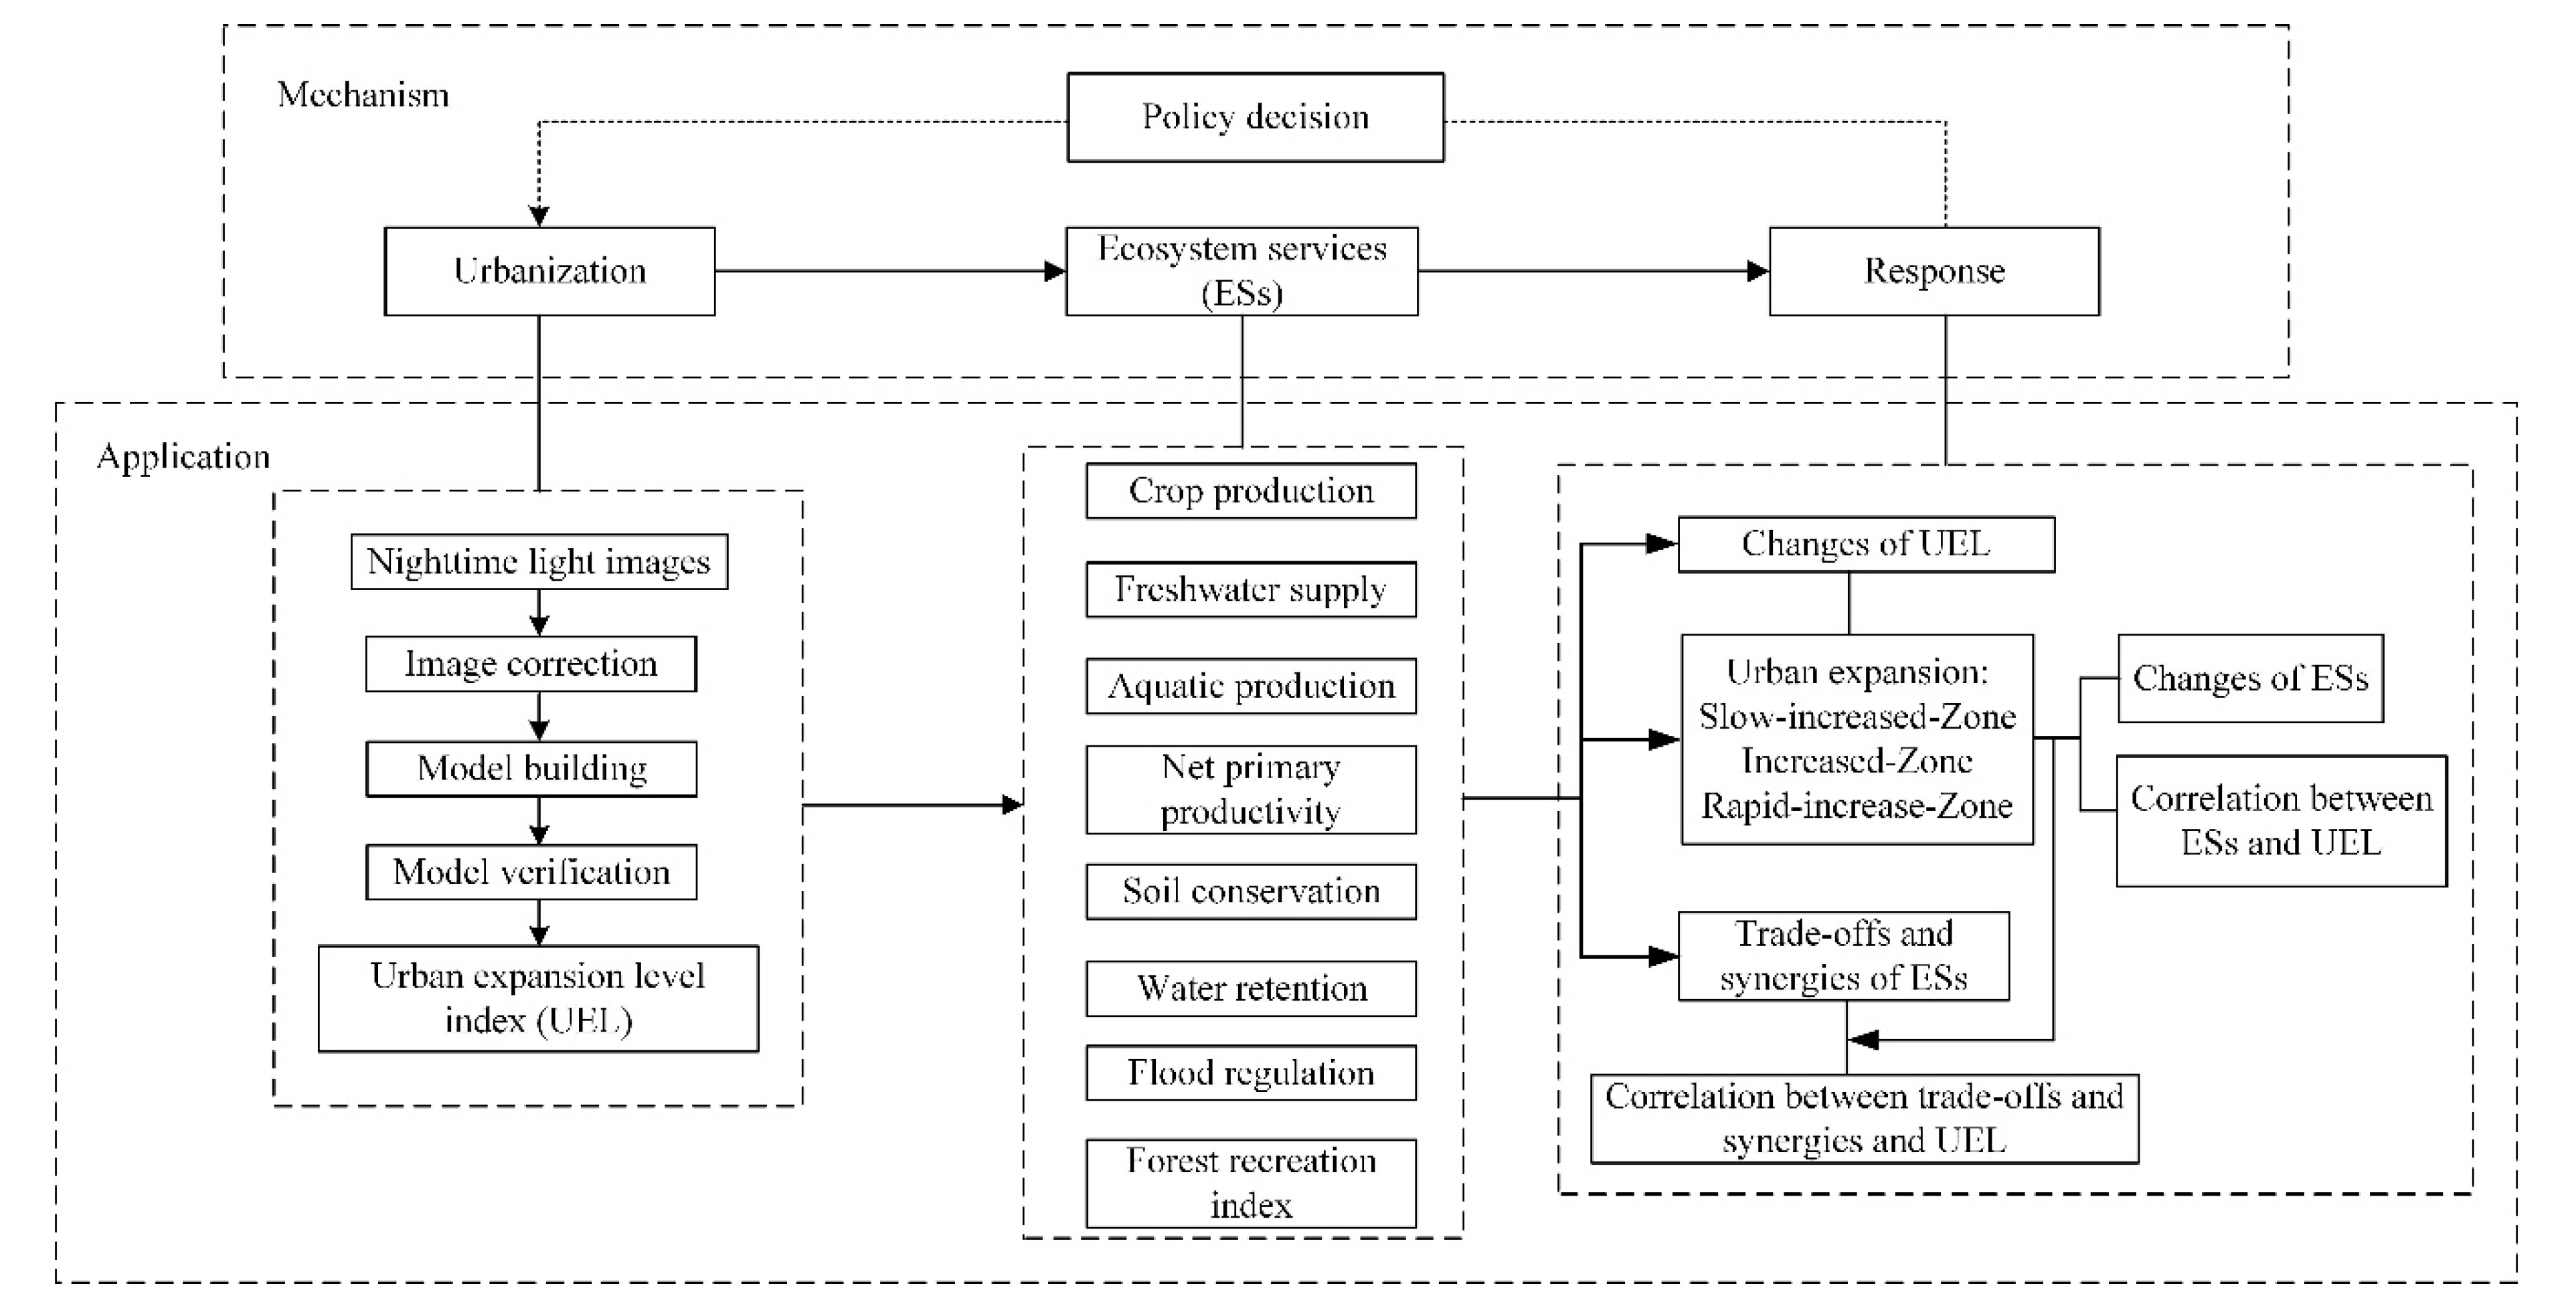
2.2. Overview of the Method

Figure 2 shows the general framework for assessing how urban expansion influenced multiple ecosystem services (ESs) in the Taihu Lake Basin from 1990 to 2010. Firstly, we collected nighttime light images from National Geoscience Data Centre (https://www.ngdc.noaa.gov/eog/download.html) from 1992–2010. Then, invariant region method was used to correct long-term sequence nighttime light images in ArcGIS 10.6 Software, including radiation correction and continuity correction. Secondly, referred to the concept of land use degree, we built and verified an urban expansion level (UEL) model based on nighttime light data and statistical data. Thirdly, for the whole 1990–2010 period, eight ESs were assessed at 1 km2 in the Taihu Lake Basin (crop production, freshwater supply, aquatic production, net primary productivity, soil conservation, water retention, flood regulation and forest recreation index). Fourthly, we analyzed the change of urban expansion level and divided it into three zones, such as slow increase zone, increase zone and rapid increase zone. Changes of Mean value and coefficient of variation of ESs from 1990 to 2010 were measured during different urban expansion levels. Pearson correlation coefficients between urban expansion level and ecosystem services were calculated in ArcGIS by Band Collection Statistics tool. Finally, Principal Component Analysis method was used to identify interaction of ESs based on 1000 random points by Statistical Product and Service Solutions Software. We further explored the correlation between the trade-offs and synergies of ESs and UEL among different urban expansion zones.

2.3. Quantification of Urban Expansion Level by Nighttime Light Data

The Operational Line Scan System of the Defense Meteorological Satellite Program nighttime light data sourced from the National Geoscience Data Centre, comprised a total of 31 images of six sensors from 1992 to 2010. Stable light data included cities, towns, and other areas with long-lasting light sources; Spanning range of latitudes of −65° to 75° and longitude of −180° to 180° [26]. In addition, the National Geoscience Data Centre website provides global unsaturated nighttime lighting data for 2006, which may be used as an ideal reference image. Compared to stable nighttime light data, the 2006 radiation-corrected image does not contain saturated pixels but does feature a larger range of values. The bright town center range in stable nighttime light data is not recognized, so the saturated cell value is 63; however, in the 2006-radiometric calibration products, the town center will present different values. We converted global nighttime light data into Lambert’s isometric conical projection, then re-sampled it to generate a 1-km × 1-km grid, and used the vector administrative boundary for masking.

2.3.1. Radiation Correction of Nighttime Light Data

Following the correction method of Wu et al. (2013) [18], we selected Okinawa in Japan as the constant target for the image radiation correction for three reasons. Firstly, this prefecture has undergone little socio-economic change and a relatively stable development process in the last 20 years. Secondly, the digital number (DN) value of the Okinawa Prefecture was evenly distributed from low to high. Thirdly, the nighttime light data of Okinawa Prefecture from F12 satellite sensor in 1992 (F121992) showed a good linear relationship with the nighttime light data from F18 satellite sensor in 2010 (F182010) (Figure 3). Square of correlation coefficient (R2) is 0.89 and Root mean square error (RMSE) is 16.98. According to relevant research [18], the power function correction model provides the best correlation, so this was applied using Equation (1).
D N c o r r e c t + 1 = a × ( D N m + 1 ) b
where DNm and DNcorrect represent the pixel DN value before and after its correction, respectively, and a and b are power function regression parameters.

2.3.2. Continuity Correction of Nighttime Light Data

Due to design issues, images acquired by different satellite sensors were affected by different factors, resulting in variation between images obtained in the same year. Although our radiation correction reduced this error, it was not completely eliminated. To solve the discontinuity problem between different images, according to the Equation (2), the image digital number (DN) values obtained by two sensors in the same year are corrected.
D N ( n , i ) = D N ( n , i ) c + D N ( n , i ) d 2       ( n = 1994 , 1997 , 1998 , , 2007 )
where DN(n,i) represents the DN value of the i-th pixel in the corrected n-th year image. D N ( n , i ) c and D N ( n , i ) d represent the DN value of the i-th pixel in the nighttime light image acquired, respectively, by the two different sensors corrected in the n-th year.
China’s urbanization level has continuously risen, so urban land use has continued to increase. Therefore, the pixels identified as urban patches in the previous year’s image should not disappear in the next year’s image. We thus assumed the nighttime light data pixel of previous year was no more than the same pixel value of following year [27]. The correction method then processes the multi-sensors to detect abnormal fluctuation of the pixel digital number (DN) value between different annual image data, with the calibration shown in Equation (3).
D N ( n , i ) =     { D N ( n 1 , i ) D N ( n + 1 , i ) > 0   and   D N ( n 1 , i ) > D N ( n , i )         D N ( n , i ) others          
where the terms DN(n-1,i), DN(n,i), and DN(n+1,i) are radiation-corrected and multi-sensors for the n–1-th, n-th, and n+1-th years, respectively. In this way, we obtained the DN value of the ith picture of the corrected nighttime light image among images from different sensors in the same year.

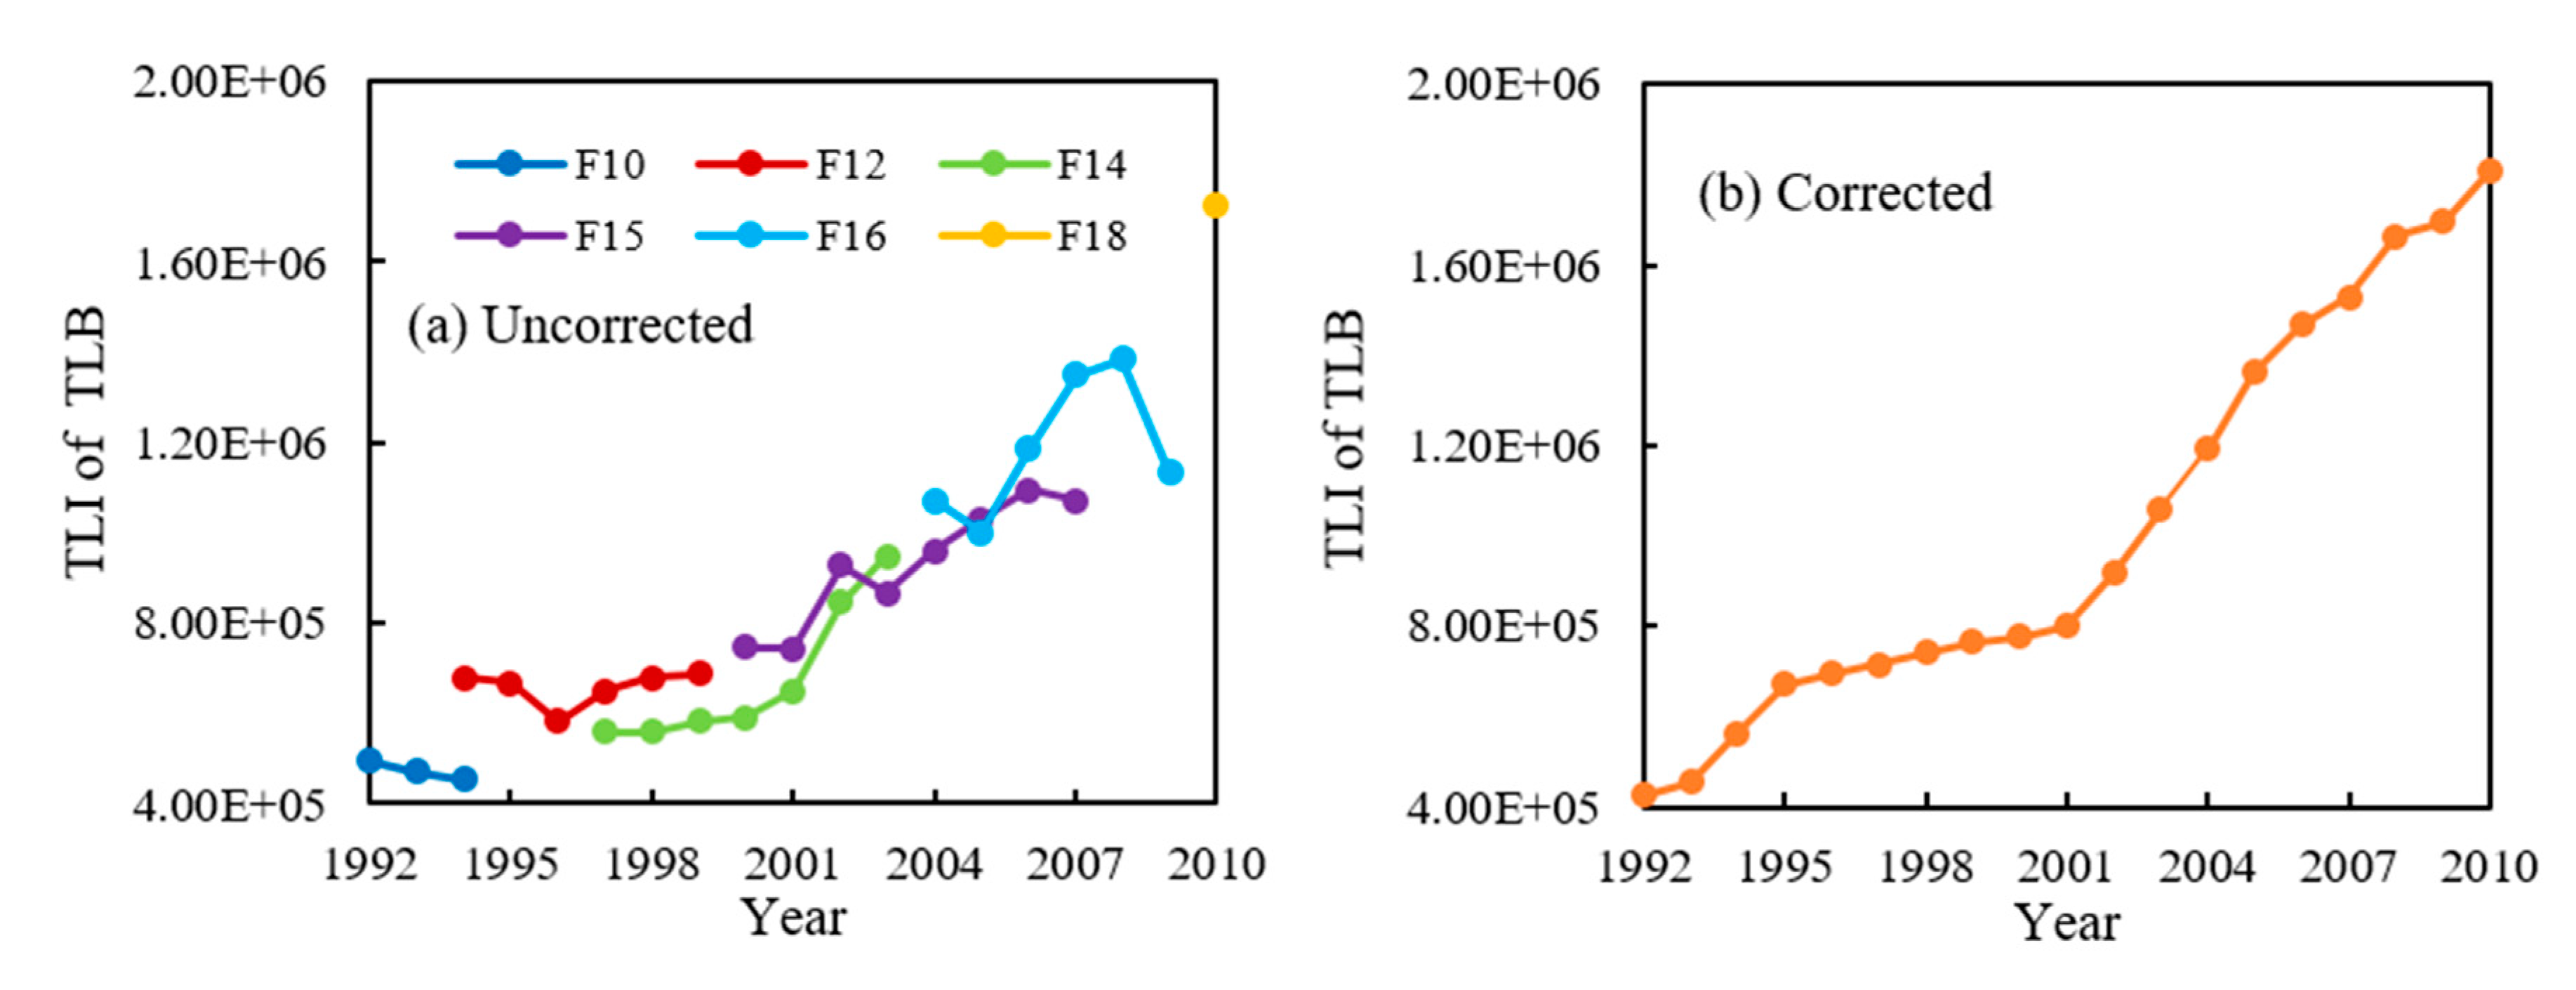
2.3.3. Correction Results of Nighttime Light Data

In the uncorrected nighttime light data sets, there was a disordered fluctuation in the time-scale of each scene’s sum-of-brightness value of pixels (Figure 4a). The summed image digital number values of each data period in the corrected image data set increased year by year, indicating that each corrected image was continuous and relatively stable (Figure 4b). As the same reference image was used for relative correction of differing images, those in each corrected image data set were now comparable.

2.3.4. Urban Expansion Level by Nighttime Light Data

Studies have shown that stable nighttime light data can effectively identify urban areas and be used to monitor urban dynamics [28,29]. Specifically, Zhou et al. (2015) analyzed the temporal and spatial patterns of urban expansion in South Asia and Ma et al. (2015) proposed a bright gradient algorithm to study characteristics of urban variation. Due to the discontinuity and saturation of the original image data, the F16_20051128-20061224_rad_v4 image was selected to serve as the basis for radiation calibration. Nighttime light data for the basin was corrected for any saturated data with the constant target method, and the image then corrected for continuity. This ensured continuity and comparability between different images and reduced the saturation effect of pixels. We then drew on the concept of land use degree [30] to develop urban expansion level (UEL) model, by applying these two equations:
U = 100 × i = 1 n D i × P i
Δ U b a = U b U a = { ( i = 1 n D i × P i b ) ( i = 1 n D i × P i a ) } × 100
where U is the UEL in the study area; Di is value of the i-th nighttime light pixel (range of pre-corrected values: 0–63); Pi is percentage value of the i-th nighttime light pixel area; ΔUb-a is the change in a given UEL. If ΔUb-a is positive, the UEL at time b exceeds that at time a; otherwise, the opposite is true. Pia and Pib represent the UEL corresponding to the i-th grade for times a and b, respectively. Likewise, Ua and Ub respectively represent the UEL at times a and b.

2.4. Quantification of ESs

From 1990 to 2010, eight ecosystem services (ESs) indicators were quantified in Taihu Lake Basin (TLB) with a spatial resolution of 1 km2. TLB is a traditional high-yielding area of grain in China, with excellent cultivated land quality, favorable hydrothermal conditions and abundant freshwater resources (annual rainfall averages 1010–1400 mm). In its urban areas, aquatic products have gradually become key to the well-being of residents, not only providing them with natural benefits but also serving as substitutes for certain natural ecosystem-supplied services. We used a statistical model to calculate the services of crop production, freshwater supply, and aquatic production. In addition, TLB’s rapid urbanization has reduced its net primary productivity, soil conservation, water retention, and flood regulation. The Camegie-Ames-Stanford Approach (CASA) model, Universal Soil Loss Equation (USLE) model, and water retention model were used to respectively map net primary productivity, soil conservation, and water retention. We also calculated the basin’s lake storage capacity and wetlands storage capacity to assess flood regulation. Additionally, a forest recreation index model was developed to map the forest recreation activity, in which we presumed forest recreation index was affected by convenient access, population density, and recreation opportunity. As described in a previous study, all these model-estimated ESs were derived from land use maps, satellite images, and biophysical data for the TLB region [21].

3. Results

3.1. Urban Expansion Level Model Verification and Analysis

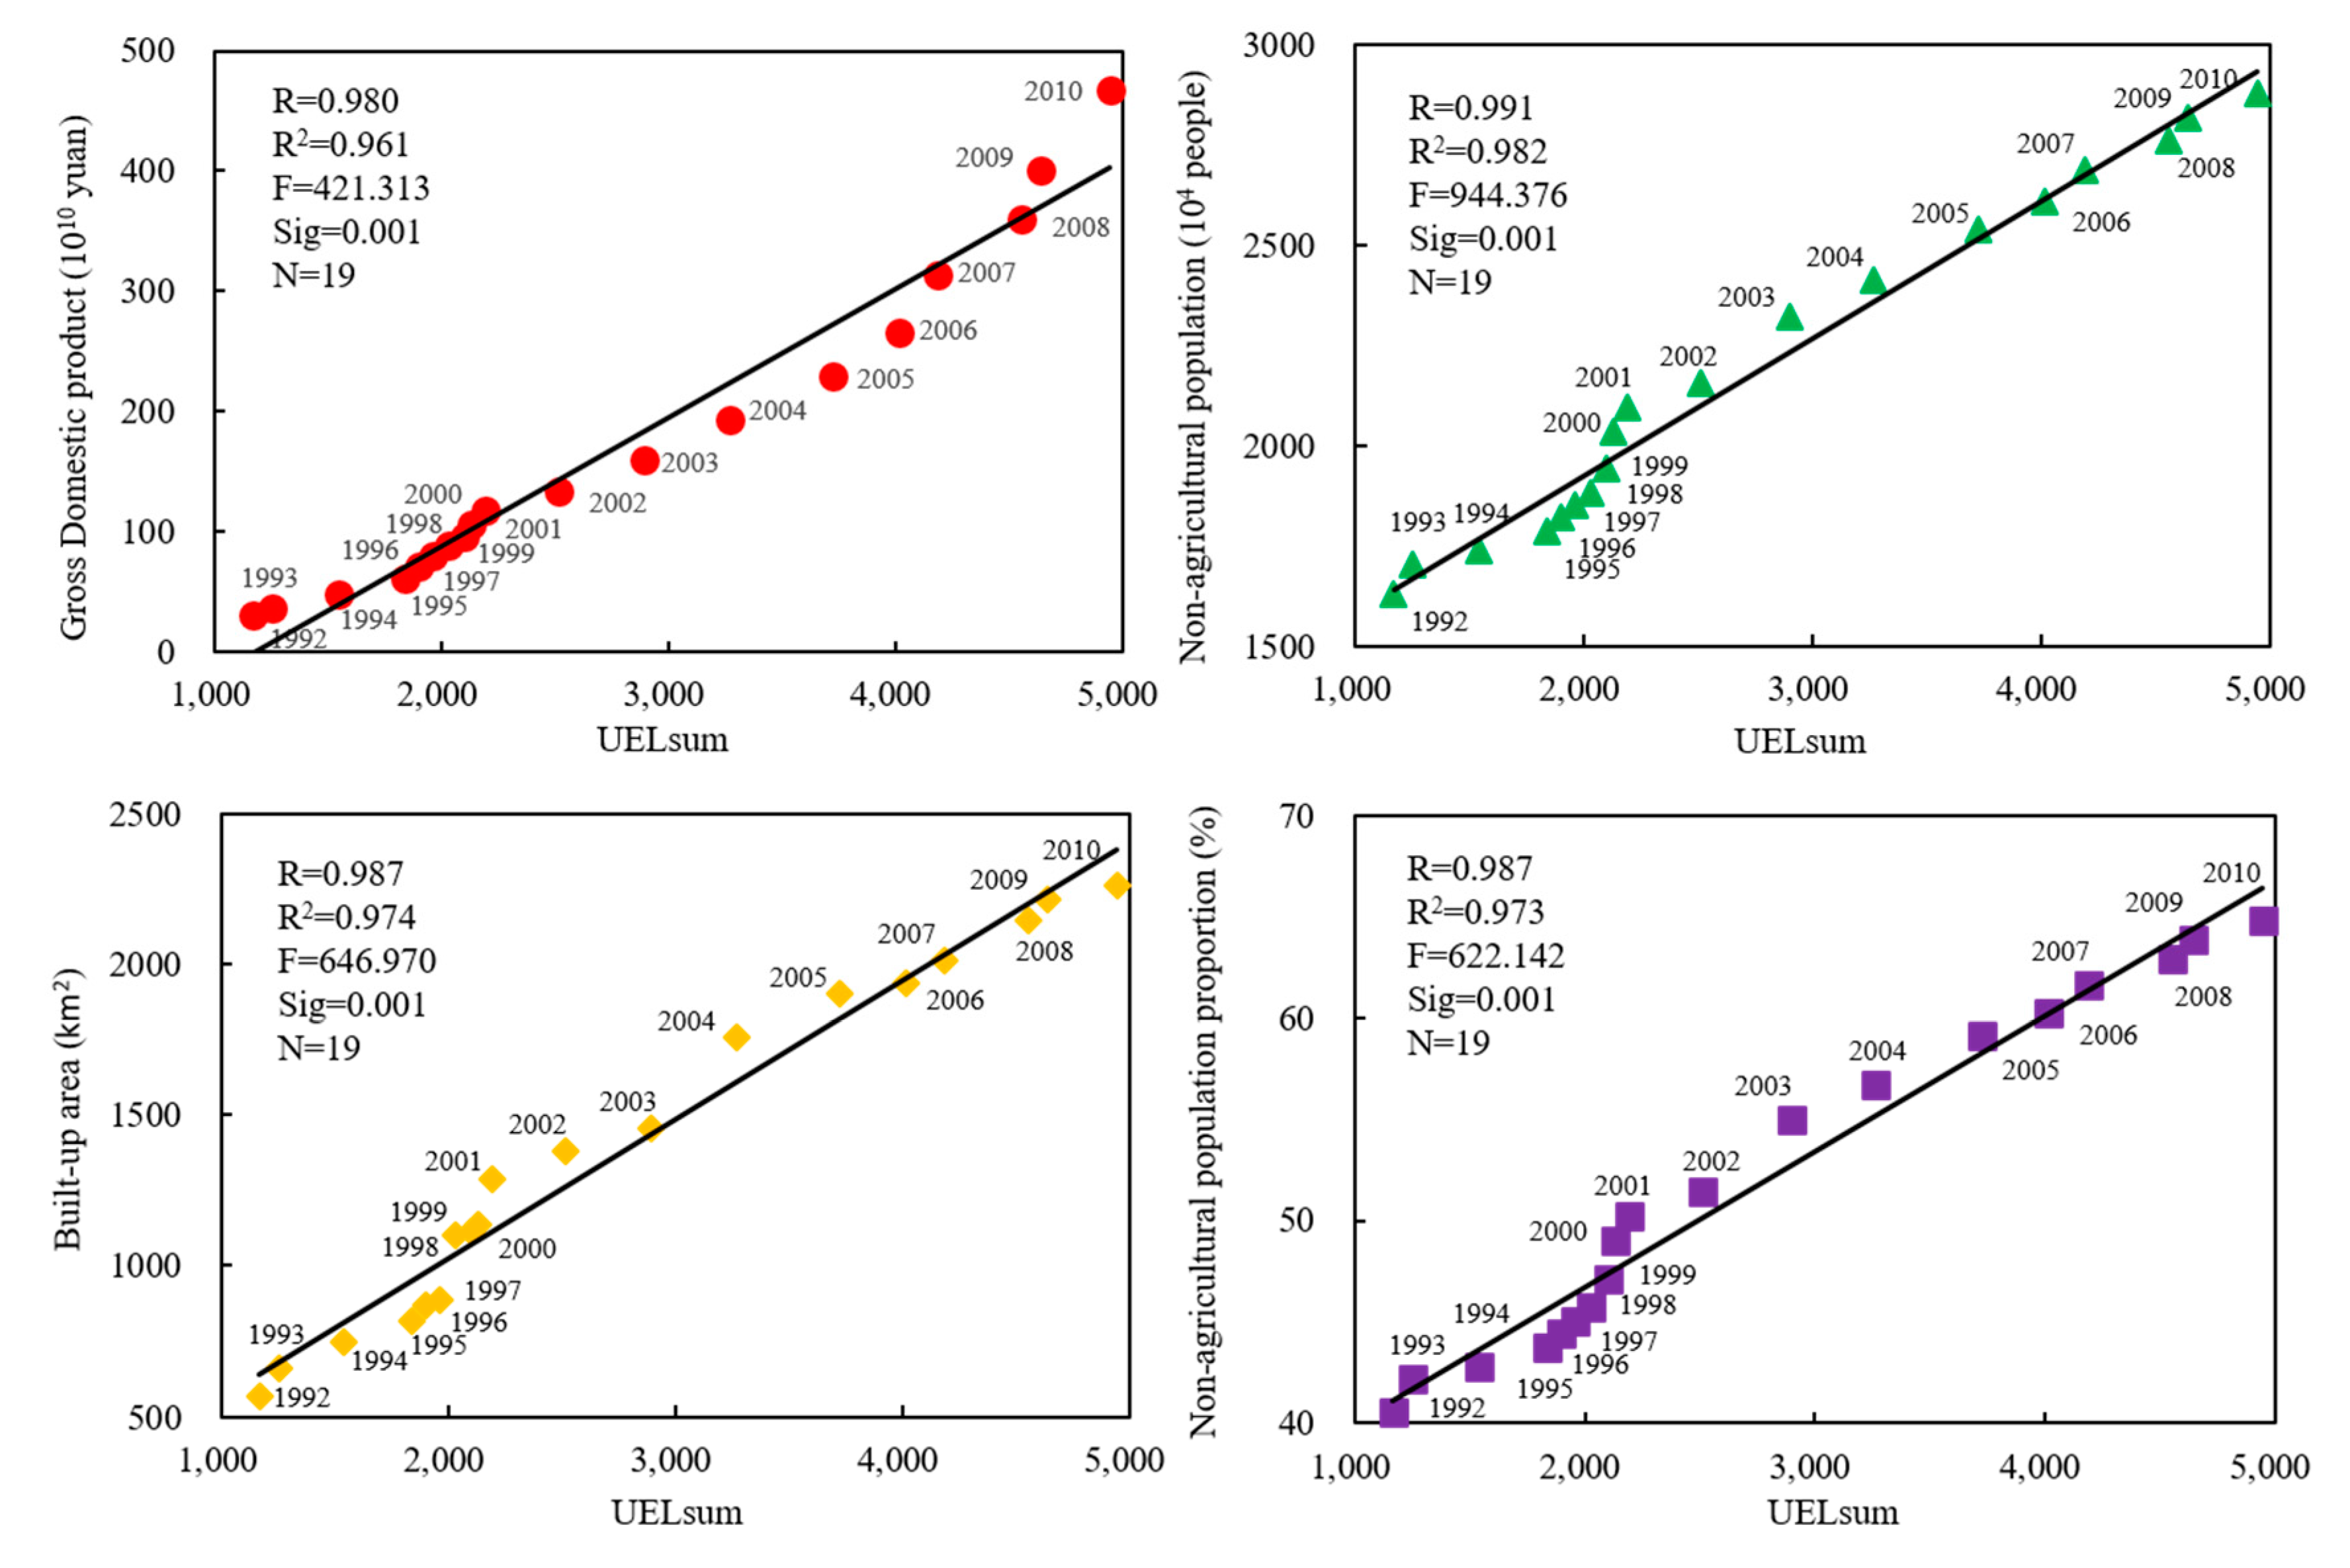
3.1.1. Urban Expansion Level Model Verification

Relevant research showed that nighttime light data has a good correlation with gross domestic product, built-up area, non-agricultural population, and non-agricultural population proportion [31,32]. As shown in Figure 5, total gross domestic product of the basin, its built-up area, proportion of non-agricultural population, and non-agricultural population all increased yearly, with urban expansion level (UEL) increased accordingly. From 1992 to 2010, the relationship of these four statistics as a function of UELsum had R2-values > 0.95, with P-value < 0.01 for the F-test of each regression; hence these relationships were robust. Thus UEL based on nighttime light data can comprehensively reflect the urban expansion characteristics.

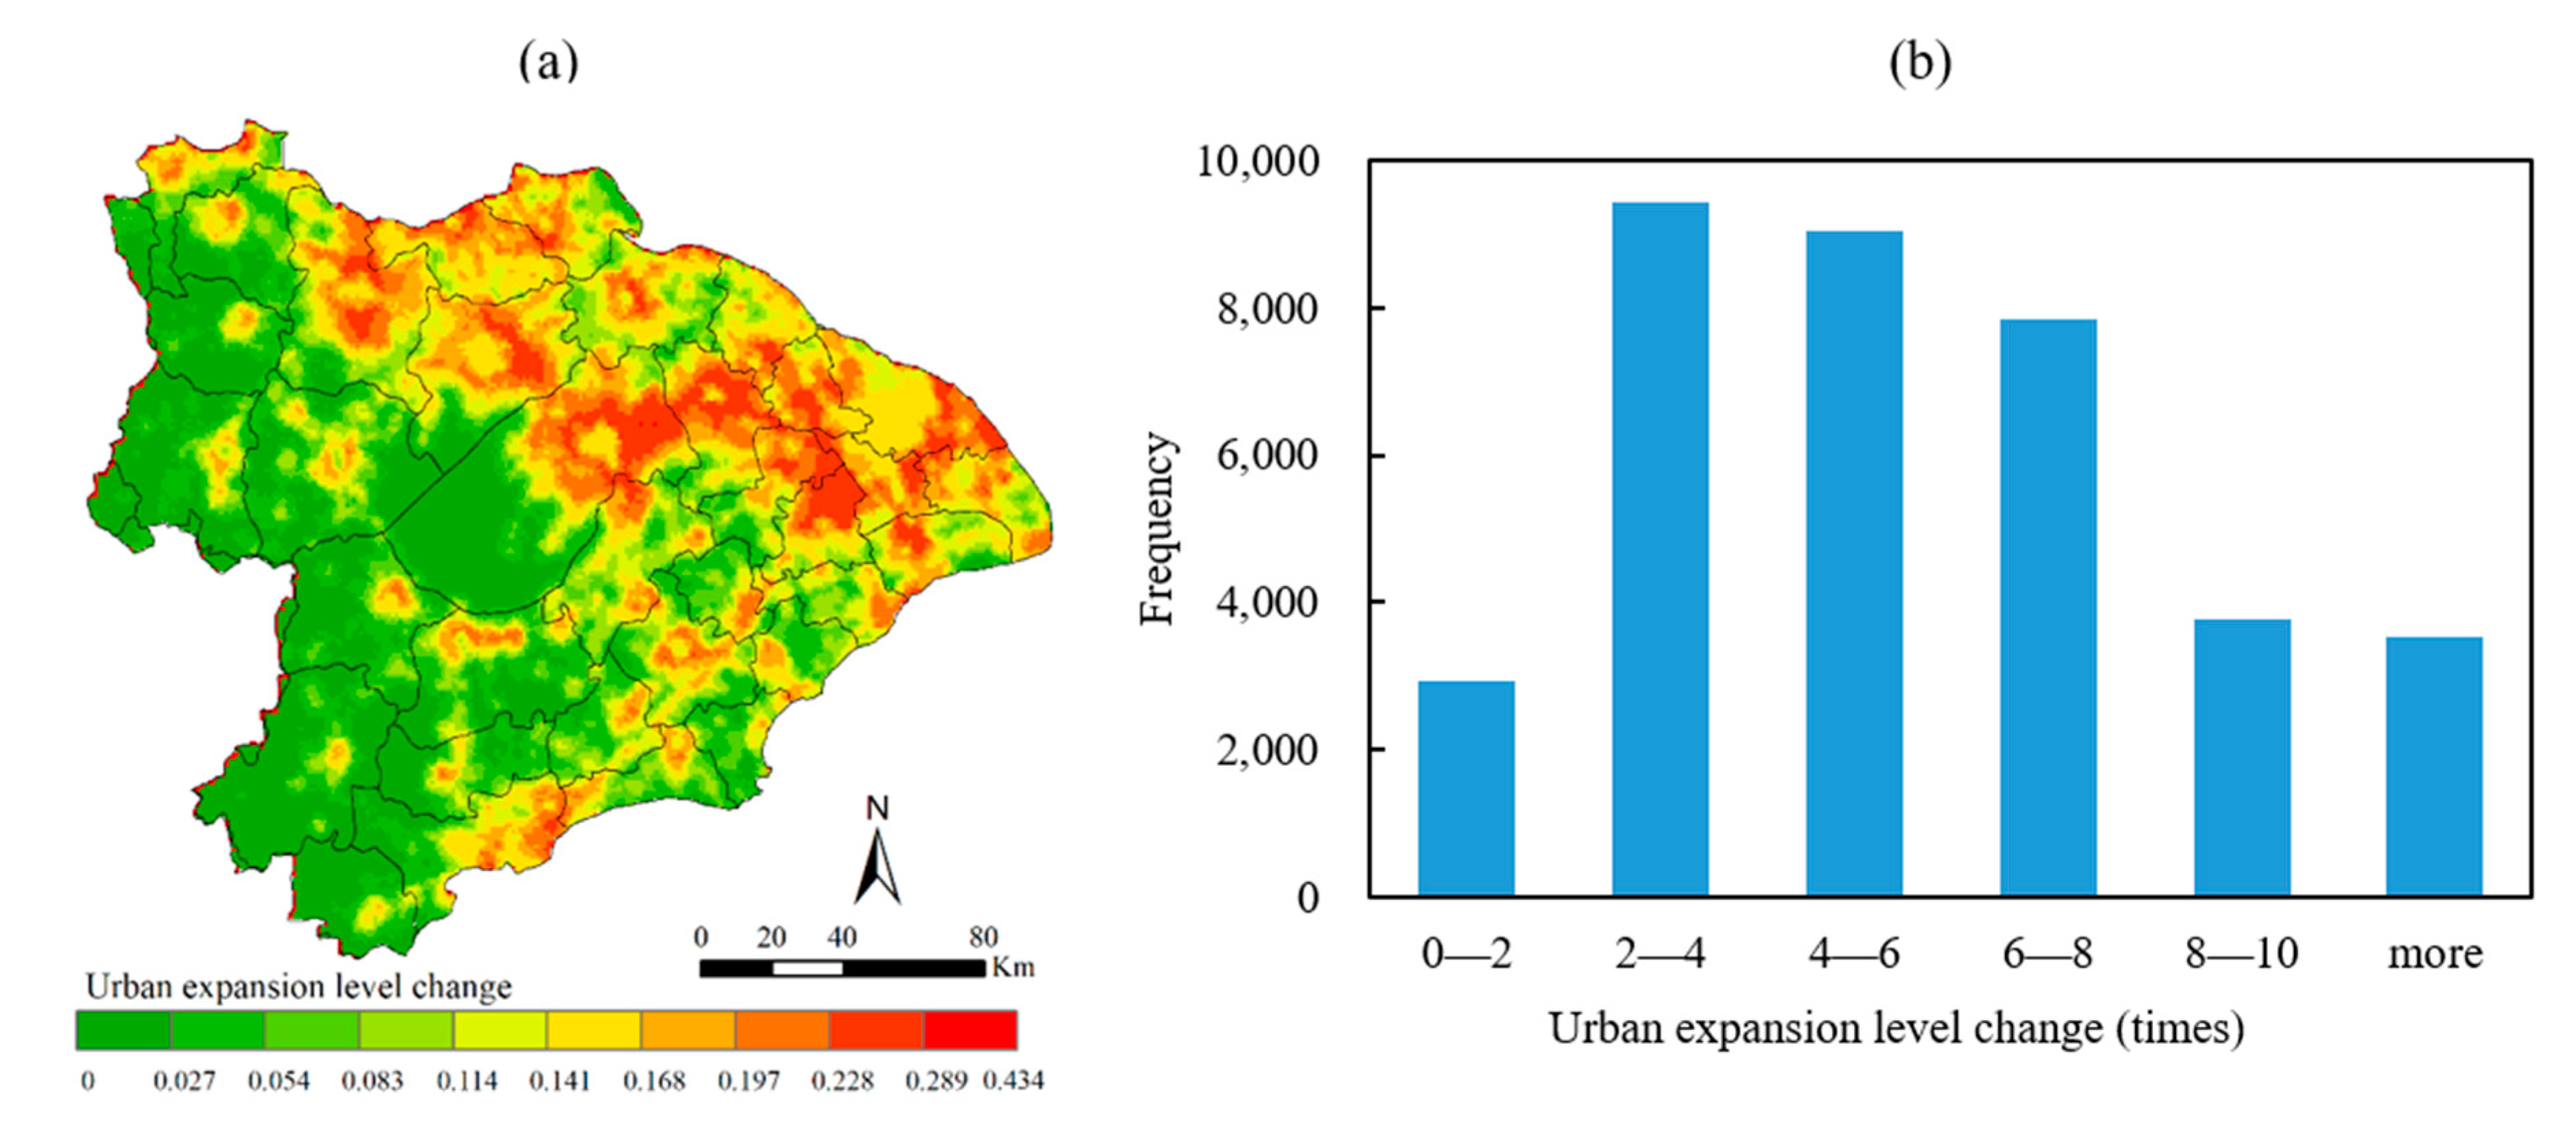
3.1.2. Urban Expansion Level Analysis

The mean urban expansion level (UEL) at the 1 km scale of Taihu Lake Basin in 1990, 2000, and 2010 were respectively 0.032, 0.058, and 0.135, with a maximum grid value of 0.803. Additionally, the corresponding proportions of area where the UEL had values less than its mean were 76.21%, 75.66%, and 54.95%. The UEL of northern, eastern, and southeastern basin were high, such as for Shanghai Municipality, Suzhou City, Wuxi City, and Changzhou City, whereas it was low in the basin’s southwestern and western areas, such as Anji County and Changxing County (Figure 6).
Over the last two decades, the averaged urban expansion level (UEL) value of the basin has increased by 321.87%. Since 1990, cities in the basin mainly expanded around their downtown areas, where UEL increased considerably (Figure 7a). During the elapsed 20 years, the UEL of the basin has increased 10-fold accounting for 9.68%, while the more than 4 times, accounting for 66.09%, and the UEL is less than 2 times, accounting for only 8.07% (Figure 7b).

3.2. Impact of Urban Expansion Level Changes on Ecosystem Services

A zero value and the mean urban expansion level (UEL) value were selected as the threshold. Since the change of UEL was always positive, 0–UELmean was classified as a slow increase zone (SIZ), UELmean–2UELmean as an increase zone (IZ), and any difference exceeding 2 UELmean as a rapid increase zone (RIZ).

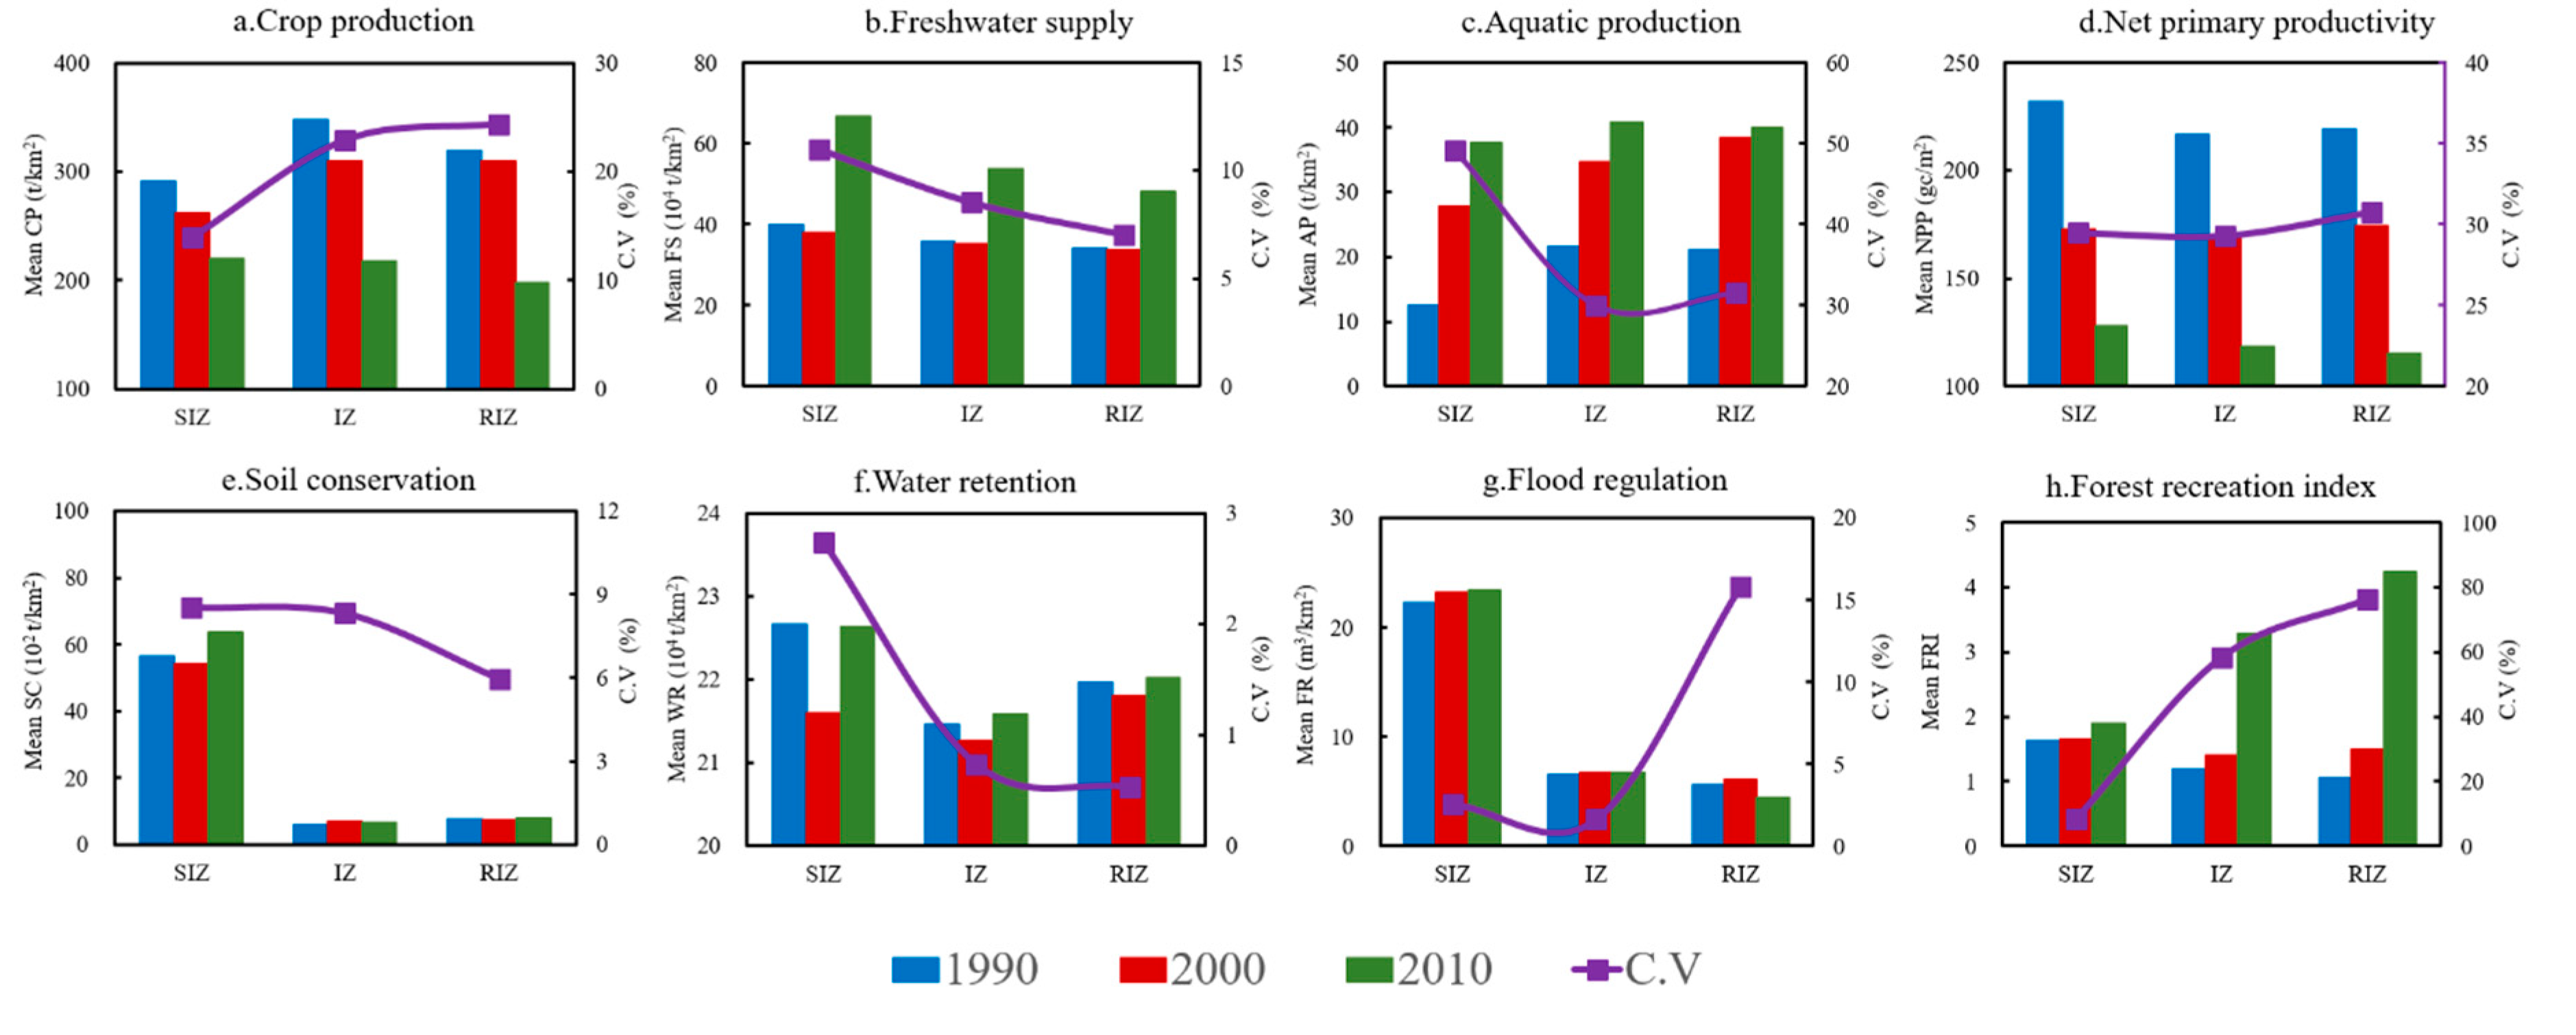
3.2.1. Changes to Ecosystem Services in Different Urban Expansion Level Zones

The mean ecosystem services not only differed greatly among the three zones, but also changed significantly cross years in the Taihu Lake Basin (Figure 8). The highest and lowest value for crop production occurred, respectively, in the IZ (348.13 t/km2) and RIZ (198.29 t/km2). The freshwater supply peaked in SIZ (66.60 × 10⁴ t/km2), with lower values distributed in IZ and RIZ. The aquatic production reached its maximum value in IZ (40.76 t/km2) and was at least three-times lower in SIZ (12.42 t/km2). The greatest net primary productivity was found in SIZ (232.12 t/km2) and the least in RIZ (115.21 t/km2). The soil conservation value and flood regulation value in SIZ were much higher than those of either IZ or RIZ in the basin. Water retention was greatest in SIZ (22.67 × 10⁴ t/km2), followed by the RIZ and then IZ. Finally, with respect to forest recreation index, its mean value in the RIZ exceeded that in SIZ.
According to the changed mean value and coefficient of variation (C.V) of ecosystem services under different urban expansion level zones from 1990 to 2010 (Figure 8), crop production evidently decreased over time, with a low and high C.V in SIZ and RIZ, respectively. Crop production changed the most in the RIZ. The freshwater supply showed a trend of increasing volatility, for which the minimum C.V was in the RIZ. The aquatic production increased year by year in all three zones, having the lowest C.V value in IZ. By contrast, net primary productivity declined yearly, but its C.V remained similar among the zones. The soil conservation increased with volatility, (its lowest C.V was in RIZ). The water retention fluctuated over time, reaching a maximum C.V in SIZ. In stark contrast, flood regulation remained mostly unchanged, but did have a high C.V in the RIZ. With respect to forest recreation index, it increased from 1990 to 2010, with high and low C.V values in RIZ and SIZ, respectively.

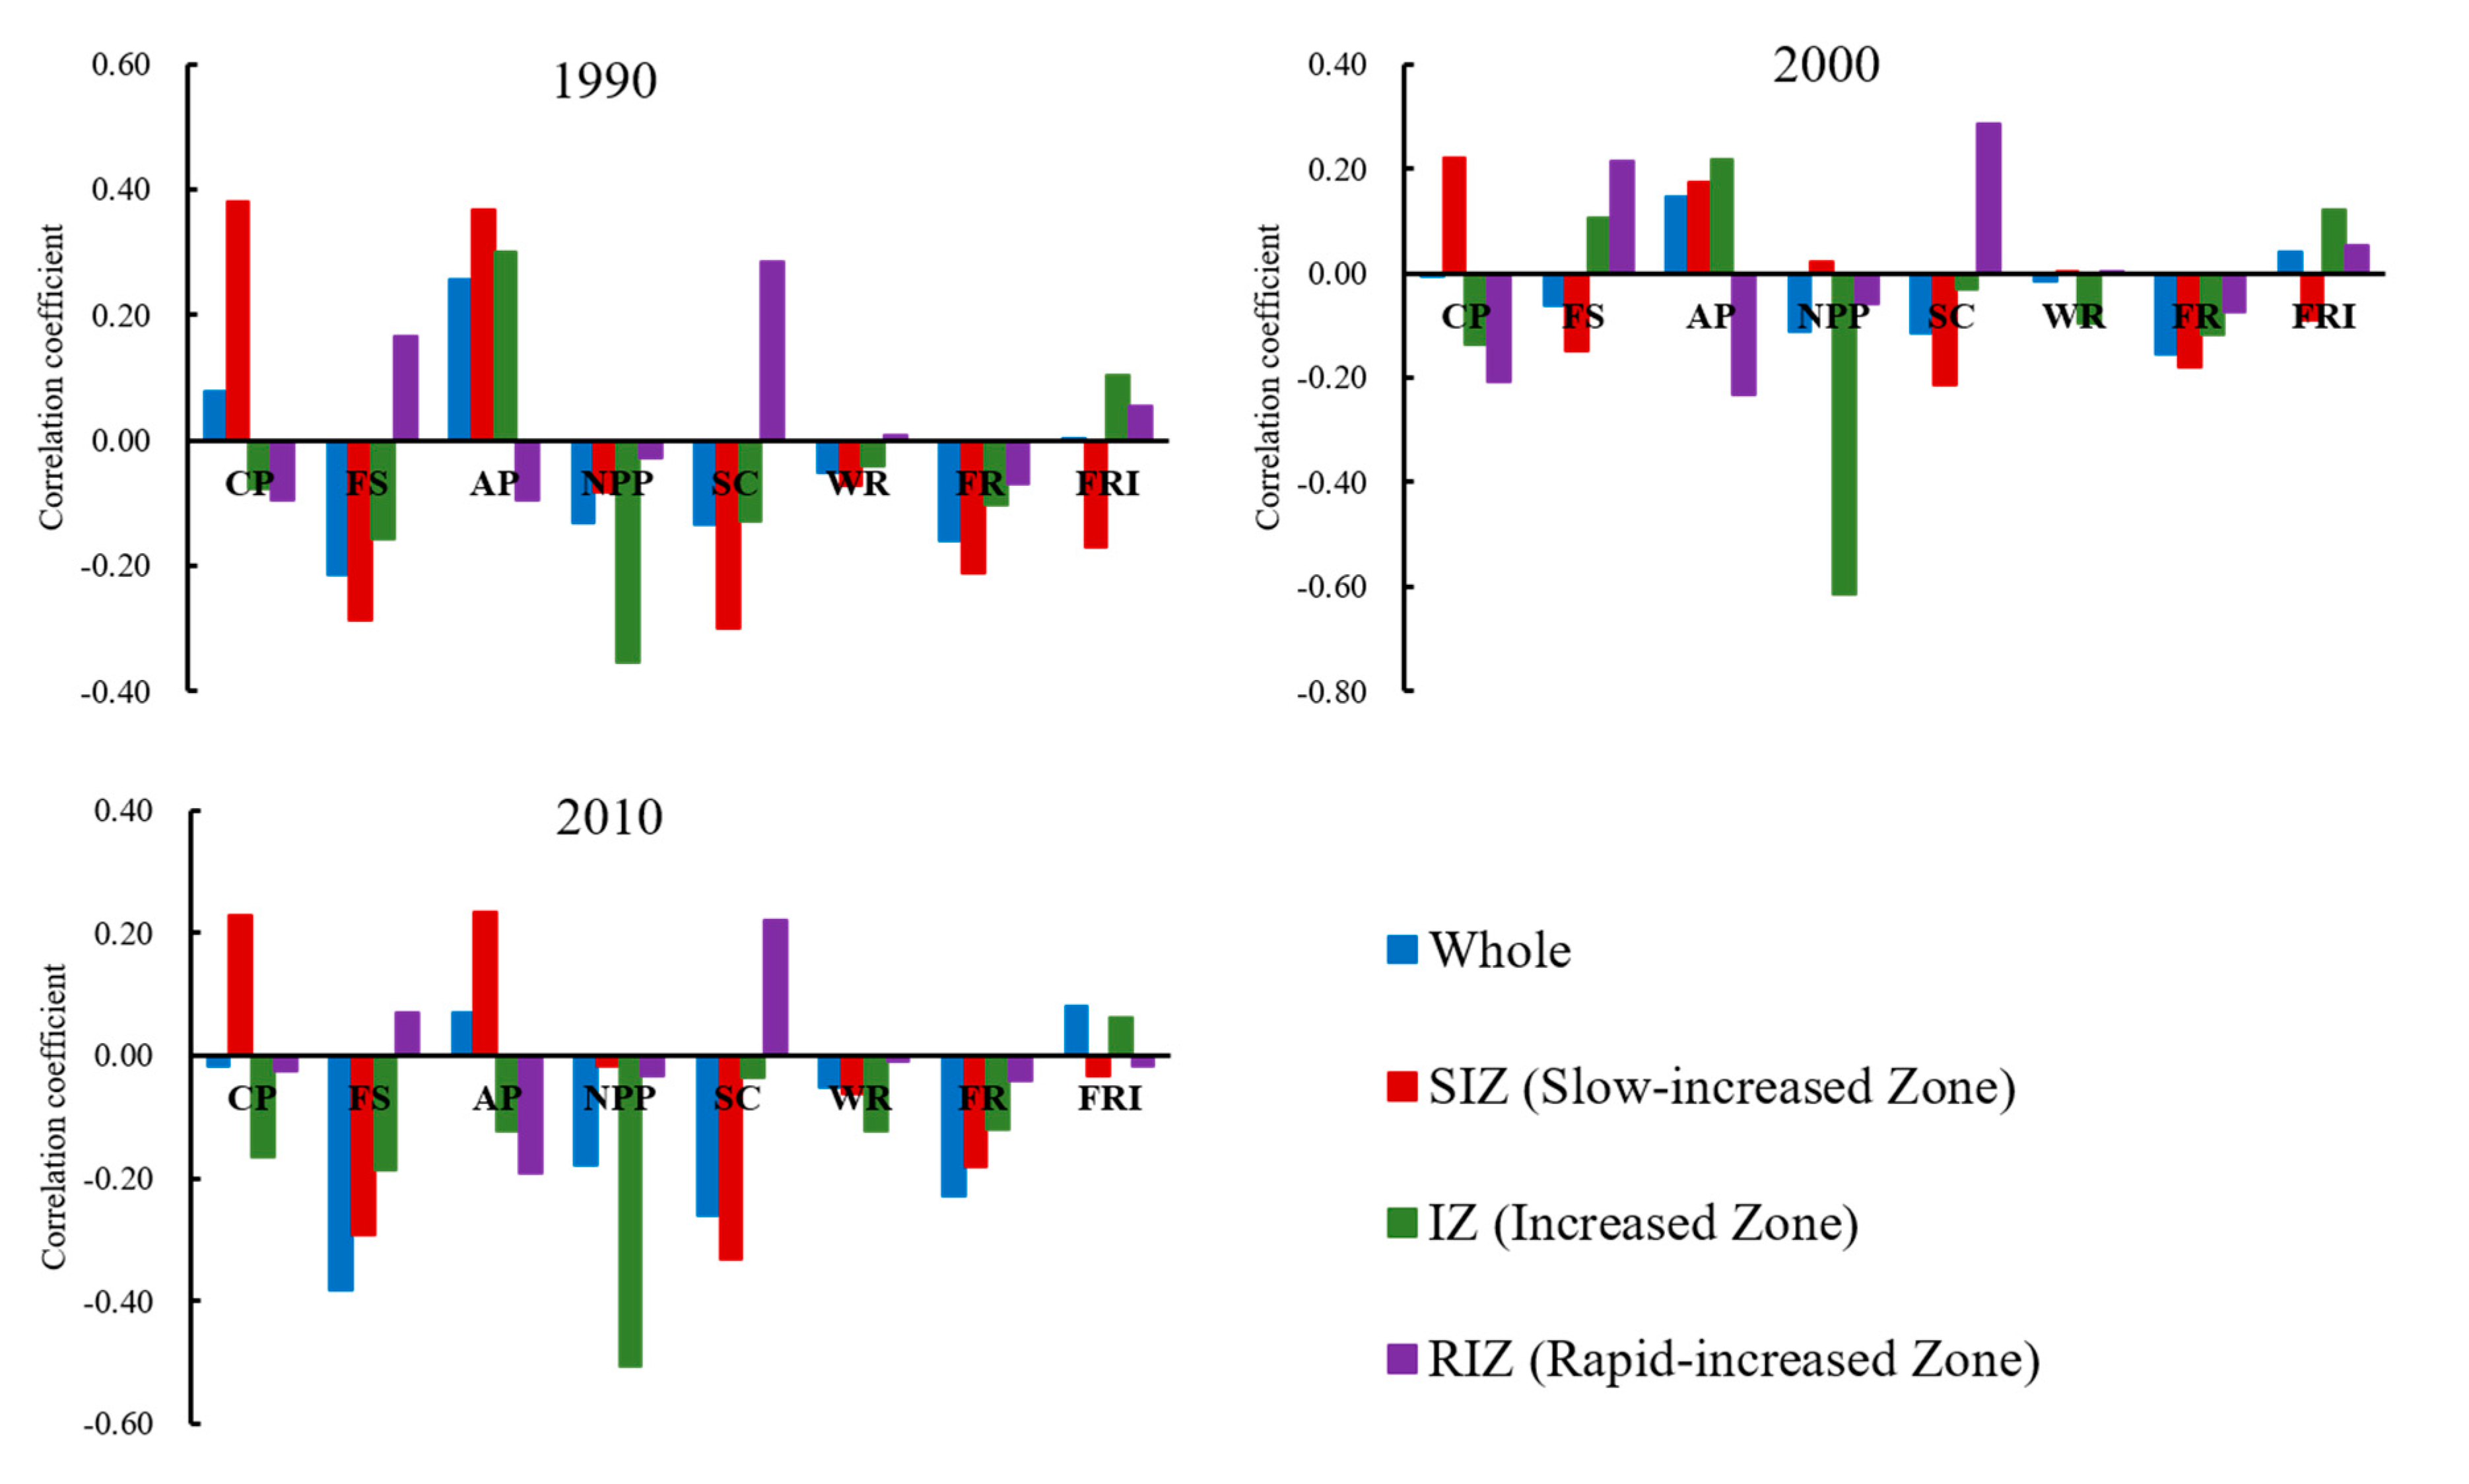
3.2.2. The Impact of Urban Expansion Level on Ecosystem Services

In 1990, the aquatic production in the whole basin had the highest correlation coefficient with the urban expansion level (UEL), which was 0.26, while water retention and UEL is the lowest, which is 0.05 (Figure 9). Interestingly, there was no correlation between the forest recreation index and UEL in 1990. In the different UEL zone, the crop production in the slow increase zone (SIZ) has the highest relation to UEL, which is 0.38, while the water retention in the rapid increase zone (RIZ) has the lowest correlation with UEL, which is 0.01. In 2000, the flood regulation had the highest correlation coefficient with the UEL, which was 0.16. The correlation coefficient between the crop production and UEL is the lowest, which is 0.01. In the different UEL zone, the net primary productivity in the increase zone (IZ) has the highest relation to UEL, which is 0.62. While the water retention in the IZ has the lowest correlation with UEL, which is 0.01. Surprisingly, the water retention in the RIZ and SIZ had no correlation with UEL. In 2010, the whole value of freshwater supply in the basin had the highest correlation coefficient with the UEL, which was 0.38. The correlation coefficient between the whole value of crop production and UEL is the lowest, which is 0.02. In the different UEL zone, the net primary productivity in the IZ is the highest positive relation to UEL, which is 0.51, while the water retention in the RIZ has the lowest correlation with UEL, which is 0.01.
In 1990–2010, the values of freshwater supply, net primary productivity, soil conservation, water retention, and flood regulation all showed negative correlations with urban expansion level (UEL) (Figure 9). By contrast, aquatic production and forest recreation index values were positively correlated with UEL, and over time crop production’s correlation changed, going from positive to negative. During the past two decades, only crop production and aquatic production were found positively correlated with UEL in the slow increase zone, while all other ecosystem services were negatively correlated with UEL. For increase zone, only its forest recreation index was positively correlated with UEL and the remainder ecosystem services negatively correlated. In the rapid increase zone, UEL was positively correlated with both freshwater supply and soil conservation, and UEL, while the rest of the ecosystem services had opposite correlations.

3.3. Impact of Changes in Urban Expansion Level on Bundles of Ecosystem Services

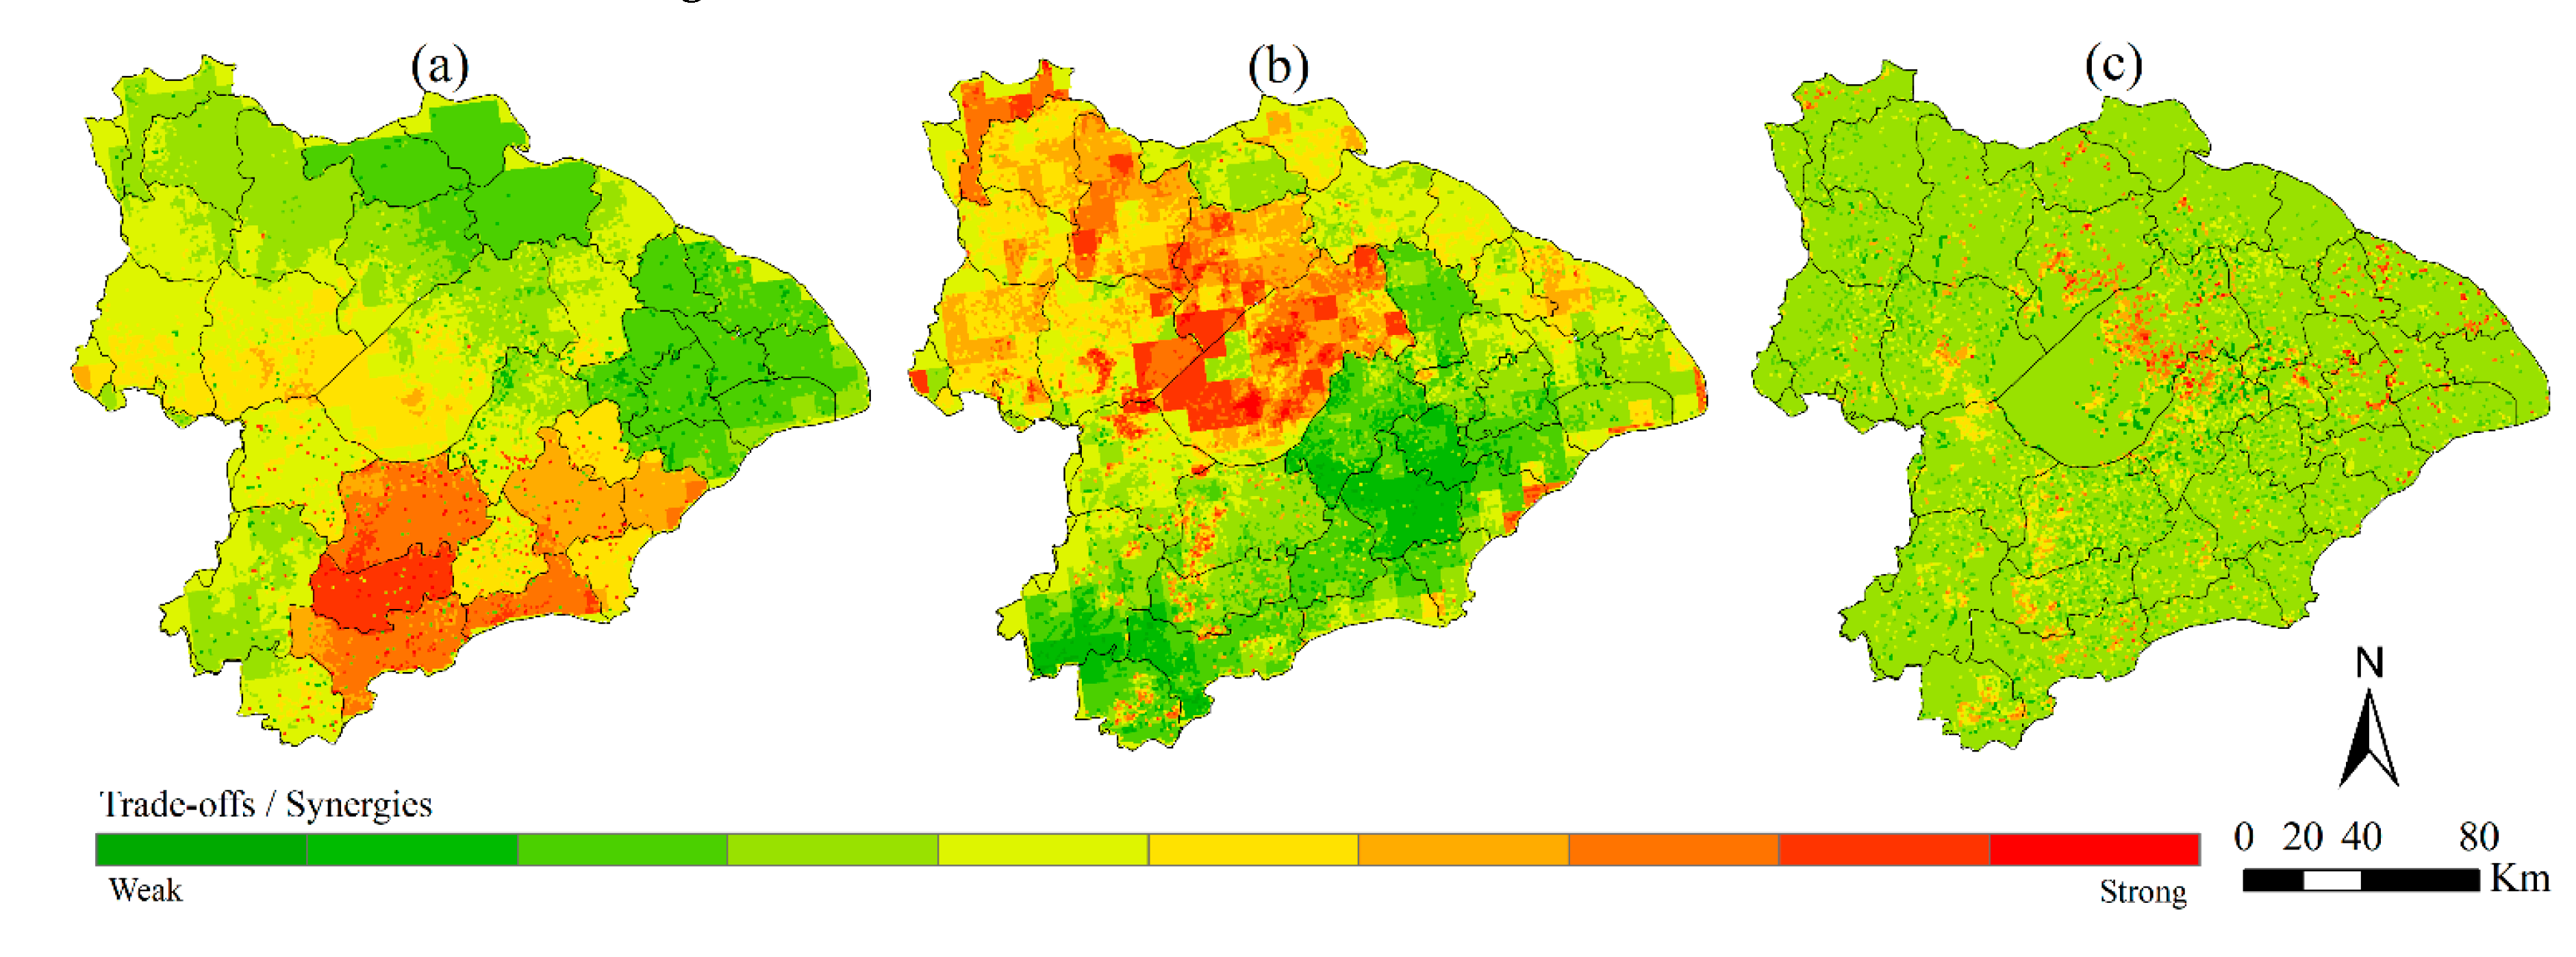
3.3.1. Trade-Offs and Synergies Among the Ecosystem Services

For the eight ecosystem services, we used interpolation to calculate their changes during 1990–2010 and then used principal component analysis to find which services covaried most to form bundles. The first three factors accounted for 48.135% of the total variation (i.e., eigenvalue > 1; Table 1, Figure 10). The factor1 represented the synergy between freshwater supply and aquatic production, explaining almost 19% of total variation; factor2 explained another 15% by representing the trade-offs among crop production, freshwater supply and net primary productivity. The third factor, factor3, conveyed the spatial trade-off between flood regulation and forest recreation index, which accounted for about 14% of the variation in ecosystem services.

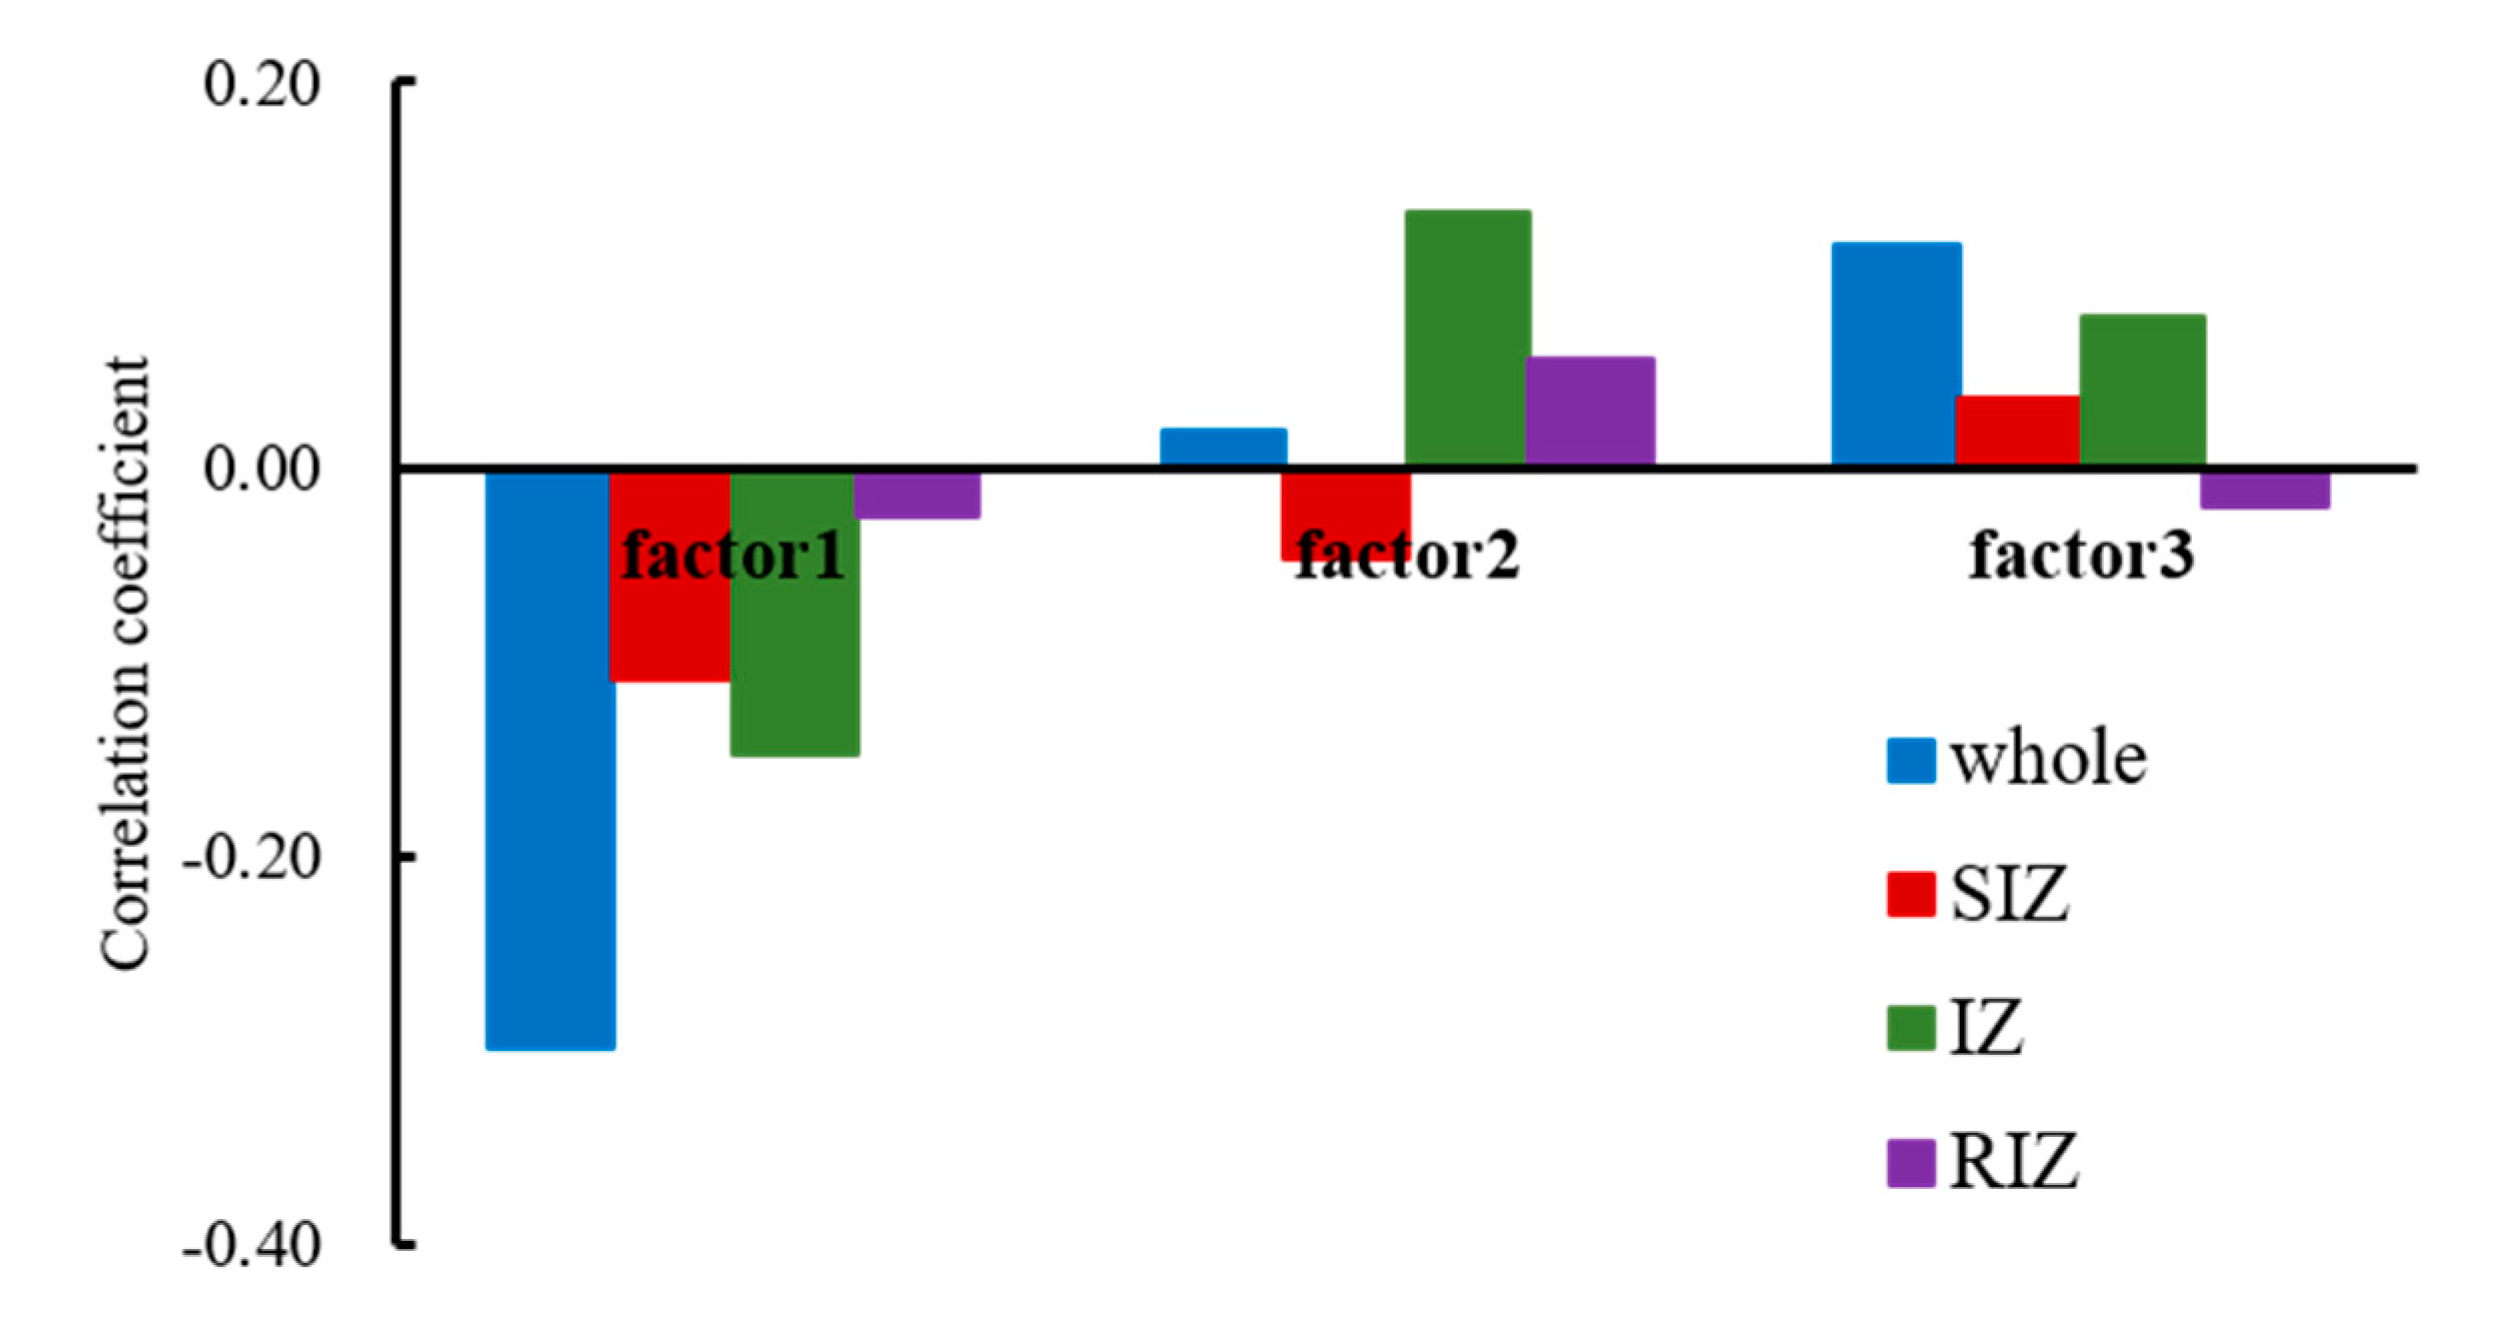
3.3.2. The Impact of Urban Expansion Level on Bundles of Ecosystem Services

We also calculated the correlation coefficients between urban expansion level (UEL) and trade-offs and synergies of ecosystem services over 20 years in different zones (Figure 11). In the basin, factor1 was most correlated with UEL (0.30) whereas factor2 was least correlated with it (0.02). In each UEL zone, the factor1 of increased zone had the strongest association with UEL (−0.15), while the lowest association occurred for factor3 in the rapid increased zone (−0.02). Importantly, factor1 was always negatively correlated with UEL at zone and whole basin scales.

4. Discussion

4.1. Comparative Analysis of Different Human Activity Model

In River Basin evaluation projects, methods to characterize the severity of human disturbance are often sought. However, choosing variables to quantify human activities is often subjective. Falcone et al. (2010) developed a series of human interference indices by testing a set of variables, scoring methods and weights of 33 potential interference factors [33]. Here, we took another approach to comprehensively assess human activities, relying on the concept of land use degree, characterizing it by developing an urban expansion level (UEL) index. Our results show the UEL model based on nighttime light data can comprehensively reflect the urban expansion characteristics. Over the past two decades, Taihu Lake Basin saw its UEL increase by 321.87%, suggesting a severe threat to its ecosystem services. To put this in perspective, this percentage is much greater than the human influence intensity (28.43%) in the Tibetan Plateau from 1990–2010, based on four categories of human pressures on the environment (land use/cover, population density, road distribution, and grazing density [9]. In measuring the global terrestrial human footprint, Venter et al. [34] found that while the human population has increased by 23% and the world economy has grown 153%, the corresponding human footprint has increased by just 9%. Surprisingly, the human activity index decreased 23.46% in the Yanhe Watershed from 2000 to 2008, largely due to the “Grain for Green” program’s implementation [10]. Meanwhile, human activity intensity slightly decreased 1.8% from 2000 to 2010 in the Guanzhong-Tianshui economic region of China [35]. In recent years, the Grain for Green plan has led to the large area of farmland transformed into forests and grasslands in the Loess Plateau, which has significantly impacted its ESs [36].

4.2. Impacts of Urban Expansion on Ecosystem Services

In this study, we found that the urban expansion level (UEL) of different zones (slow increased zone-SIZ, increased zone-IZ, and rapid increased zone-RIZ) led to major changes in the spatial distribution of ecosystem services in the Taihu Lake Basin. These results support the findings of previous studies that investigated changes to ecosystem services along the urban–rural gradient [5,37]. Notably, the crop production declined in all three zones, being most variable in RIZ. Urban expansion has displaced cultivated land, with the largest shrinkage found in the SIZ. With expansion of cities, the crop production in peri-urban areas has decreased significantly. Soil conservation, water retention, and flood regulation also had low values in the IZ or RIZ, likely due to their land being covered by water-impervious surfaces, which also would explain the net primary productivity reductions in developing urban areas. Due to human demand and traffic accessibility, it was not surprising that aquatic production increased from 1990 to 2010. However, forest recreation index also significantly increased, as many forests were planted and wetland parks were built, with convenient access and population density increase, especially in RIZ.
Other researchers have reported negative correlations between human activities index and water or soil conservation [10,35]. Our study’s results point to a similar conclusion, in that UEL had a significant negative association with both soil conservation and water retention. However, the human activities index have a high correlation with the agricultural production in the Guanzhong – Tianshui economic region while crop production had no correlation in the Taihu Lake Basin. To our surprise, we found that freshwater supply, net primary productivity, and flood regulation were negatively related to UEL (p < 0.01), while human activities index was uncorrelated with net primary productivity and carbon sequestration and oxygen production in Yanhe and Guanzhong economic regions. These patterns may be related to differences in how human activities index and UEL are calculated. The former’s framework includes population, farmland, road impact, and residential impact, and a lesser impact of human activities on vegetation; the UEL relies on nighttime light data to characterize human activities and environmental effects [29,38]. In addition, land use change is also the main reason. For example, irrational land use in the Loess Plateau [39]. With the rapid expansion of cities and towns, population growth and land use change pose a substantial threat to the ecological security of the basin [20].

4.3. Ecosystem Services Bundles and Urban Expansion Level

As earlier studies note, analyzing static instead of dynamic ecosystem services (ESs) relationships would emphasize the effects of spatial variability of drivers (e.g. land use/cover, management practices), thereby neglecting the effects from drivers whose temporal variation plays a more critical role (e.g., precipitation) [40]. Ignoring the history of ESs and their change over time may overlook promising opportunities to foster their synergies, resulting in unnecessary and costly trade-offs [41]. To address this, we also analyzed identified ES bundles and analyzed their respective change over time in the Taihu Lake Basin, from 1990 to 2010. These results changed over time in the same region. Recent research reported a trade-off among crop production, freshwater supply, and soil conservation in 2010 [21], yet in our study of the Taihu Lake Basin a trade-off among crop production, freshwater supply, and net primary productivity was detected from 1990 to 2010. To our surprise, the synergy between freshwater supply and aquatic production remained consistent over this 20-year period.
Crucially, at different stages of urbanization, urban expansion level (UEL) was always negatively correlated with provisioning services, such as the synergy between freshwater supply and aquatic production. Due to urban expansion, those ESs provided by cultivated lands inevitably decreased. This illustrates the inherent contradiction between the farmland and construction land in a finite area. The demand for agricultural products has increased as the human population in the basin quickly grew in recent years. To sustainably satisfy this demand and maintain food security, crop production efficiency needs improvement coupled to expanding the total area of cultivated land.
We uncovered a positive correlation between UEL and the trade-off between flood regulation and forest recreation index. These three aspects of urbanization—UEL, flood regulation, and forest recreation index—are relevant to construction land, wetland, and forested land, respectively. In the rapid increase zone, many wetlands became occupied by construction land, thus decreasing the flood regulation service they provided. Meanwhile, more recreational opportunities, access to population centers, and people’s accessibility to green-space areas fostered an increase of forest recreation index in the rapid increase zone.

5. Conclusions and Policy Implications

A conceptual framework for how urban expansion impacts on ecosystem services was proposed for China. We put forward and verified an urban expansion level index derived from nighttime light data. Taihu Lake Basin was divided into three zones by urban expansion level: slow increase, increase, and rapid increase zones. Then, we analyzed both among and within these zones the impacts of urban expansion level upon eight ecosystem services (crop production, freshwater supply, aquatic production, net primary productivity, soil conservation, water retention, flood regulation, forest recreation index).
Over the last two decades, the urban expansion of the basin has more than threefold increase mainly around downtown areas. The cities located in northern, eastern, and southeastern basin expanded rapidly, such as Shanghai Municipality, Suzhou City, Wuxi City, and Changzhou City. Due to urban expansion and land covered by water-impervious surfaces, the crop production, net primary productivity, soil conservation, water retention, and flood regulation were all low in the increase zone or rapid increase zone. The aquatic production and forest recreation index increased from 1990 to 2010 in different urban expansion level zones because of population growth and convenient access.
The urban expansion posed severe threats to bundles of ecosystem services. Across varying levels of urban expansion, the urban expansion level was always negatively correlated with provisioning services. The relation between urban expansion and crop production changed with time, from positive to negative. Meanwhile, urban expansion aggravated the trade-offs between flood regulation and forest recreation, as well as those among crop production, freshwater supply, and net primary productivity. The faster the urban expansion, the higher the forest recreation, and the lower the flood regulation.
A moderate urban expansion speed helps balance watershed urbanization and the ecosystem services maintaining. We recommend policy-makers should take spatial heterogeneity of interactions of ecosystem service bundles into consideration and delineate urban development boundary, prime farmland protection redline and ecological conservation redline to ensure land use is balanced among ecological protection, agriculture development, and urban expansion. In addition, the local government should improve crop production per unit area and increase cultivated land area to increase crop production and guarantee the basin’s food security.
In future research, more aspects of human pressure ought to be considered when mapping the cumulative urban expansion level. We plan to combine the Visible Infrared Imaging Radiometer Suite (VIIRS) carried by the Suomi National Polar-Orbiting Partnership (Suomi NPP) satellite with the Defense Meteorological Satellite Program’s Operational Line scan System (DMSP/OLS) nighttime light data as a basis for spatial assessments to improve the accuracy and temporal-spatial changes of our urban expansion level model.

Author Contributions

Y.G. collected and processed the data, performed the analysis, and wrote the paper; X.Q. conceived and designed the study and wrote the paper; M.X. wrote the paper; C.Z. designed the study; D.L., D.W. and Y.W. contributed to the analysis of the data. All authors have read and approved the final manuscript.

Funding

This work was supported by the National Key Research and Development Program (Grant No. 2017YFC0506606, Grant No. 2016YFC0502106), the National Natural Science Foundation of China (Grant No. 41971274), Philosophy and Social Science Scholar’s Funds of Universities of Henan Province (Grant No.2018-YXXZ-07), Innovation research team of Henan Polytechnic University (Grant No. T2018-4), Basic Research Funding for the Central Level Scientific Research Institutes of Nanjing Institute of Environmental Sciences, Ministry of Ecology and Environment (Grant No. GYZX190204).

Acknowledgments

We express our gratitude to anonymous reviewers and editors for their professional comments and suggestions.

Conflicts of Interest

The authors declare no conflict of interest.

References

  1. MEA (Millennium Ecosystem Assessment). Ecosystems and Human Well-Being: Synthesis, 2nd ed.; Island Press: Washington, DC, USA, 2005. [Google Scholar]
  2. Kumar, P. The Economics of Ecosystems and Biodiversity: Ecological and Economic Foundations; Earthscan: Washington, DC, USA, 2010; pp. 34–35. [Google Scholar]
  3. Costanza, R.; de Groot, R.; Sutton, P.; van der Ploeg, S.; Anderson, S.J.; Kubiszewski, I.; Farber, S.; Turner, R.K. Changes in the global value of ecosystem services. Glob. Environ. Chang. 2014, 26, 152–158. [Google Scholar] [CrossRef]
  4. Sun, X.; Li, F. Spatiotemporal assessment and trade-offs of multiple ecosystem services based on land use changes in Zengcheng, China. Sci. Total Environ. 2017, 609, 1569–1581. [Google Scholar] [CrossRef] [PubMed]
  5. Li, B.J.; Chen, D.X.; Wu, S.H.; Zhou, S.L.; Wang, T.; Chen, H.S. Spatio-temporal assessment of urbanization impacts on ecosystem services: Case study of Nanjing City, China. Ecol. Indict. 2016, 71, 416–427. [Google Scholar] [CrossRef]
  6. Terfa, K.B.; Chen, N.C.; Liu, D.D.; Zhang, X.; Niyogi, D. Urban Expansion in Ethiopia from 1987 to 2017: Characteristics, Spatial Patterns, and Driving Forces. Sustainability 2019, 11, 2973. [Google Scholar] [CrossRef]
  7. Weng, Q.H. Remote sensing of impervious surfaces in the urban areas: Requirements, methods, and trends. Remote Sens. Environ. 2012, 117, 34–49. [Google Scholar] [CrossRef]
  8. Hu, T.Y.; Yang, J.; Li, X.C.; Gong, P. Mapping Urban Land Use by Using Landsat Images and Open Social Data. Remote Sens. 2016, 8, 151. [Google Scholar] [CrossRef]
  9. Li, S.C.; Zhang, Y.L.; Wang, Z.F.; Li, L.H. Mapping human influence intensity in the Tibetan Plateau for conservation of ecological service functions. Ecosyst. Serv. 2018, 30, 276–286. [Google Scholar] [CrossRef]
  10. Su, C.H.; Fu, B.J.; He, C.S.; Lü, Y.H. Variation of ecosystem services and human activities: A case study in the Yanhe Watershed of China. Acta Oecol. 2012, 44, 46–57. [Google Scholar] [CrossRef]
  11. Zhang, K.H.L.; Song, S.F. Rural–urban migration and urbanization in China: Evidence from time-series and cross-section analyses. Chin. Econ. Rev. 2003, 14, 386–400. [Google Scholar] [CrossRef]
  12. Shi, G.; Jiang, N.; Li, Y.; He, B. Analysis of the Dynamic Urban Expansion Based on Multi-Sourced Data from 1998 to 2013: A Case Study of Jiangsu Province. Sustainability 2018, 10, 3467. [Google Scholar] [CrossRef]
  13. Zhong, Y.; Lin, A.W.; Zhou, Z.G.; Chen, F.Y. Spatial Pattern Evolution and Optimization of Urban System in the Yangtze River Economic Belt, China, Based on DMSP-OLS Night Light Data. Sustainability 2018, 10, 3782. [Google Scholar] [CrossRef]
  14. Elvidge, C.D.; Cinzano, P.; Pettit, D.R. The Nightsat mission concept. Int. J. Remote Sens. 2007, 28, 2645–2670. [Google Scholar] [CrossRef]
  15. Pandey, B.; Joshi, P.K.; Seto, K.C. Monitoring urbanization dynamics in India using DMSP/OLS night time lights and SPOT-VGT data. Int. J. Appl.Earth Obs. 2013, 23, 49–61. [Google Scholar] [CrossRef]
  16. Stathakis, D.; Tselios, V.; Faraslis, I. Urbanization in European regions based on night lights. Remote Sens. Appl. Soc. Environ. 2015, 2, 26–34. [Google Scholar] [CrossRef]
  17. Wei, Y.; Liu, H.X.; Song, W.; Yu, B.L.; Xiu, C.L. Normalization of time series DMSP-OLS nighttime light images for urban growth analysis with Pseudo Invariant Features. Landsc. Urban Plan. 2014, 128, 1–13. [Google Scholar] [CrossRef]
  18. Wu, J.S.; He, S.B.; Peng, J.; Li, W.F.; Zhong, X.H. Intercalibration of DMSP-OLS night-time light data by the invariant region method. Int. J. Remote Sens. 2013, 34, 7356–7368. [Google Scholar] [CrossRef]
  19. Cao, Z.Y.; Wu, Z.F.; Kuang, Y.Q.; Huang, N.S. Correction of DMSP/OLS Night-time Light Images and its application in China. J. Geo-inf. Sci. 2015, 17, 1092–1102. [Google Scholar]
  20. Xu, X.B.; Yang, G.S.; Tan, Y.; Zhuang, Q.L.; Li, H.P.; Wan, R.R.; Su, W.Z.; Zhang, J.L. Ecological risk assessment of ecosystem services in the Taihu Lake Basin of China from 1985 to 2020. Sci. Total Environ. 2016, 554–555, 7–16. [Google Scholar] [CrossRef]
  21. Qiao, X.N.; Gu, Y.Y.; Zou, C.X.; Xu, D.L.; Wang, L.; Ye, X.; Yang, Y.; Huang, X.F. Temporal variation and spatial scale dependency of the trade-offs and synergies among multiple ecosystem services in the Taihu Lake Basin of China. Sci. Total Environ. 2019, 651, 218–229. [Google Scholar] [CrossRef]
  22. Wang, G.X.; Zhang, L.M.; Zhuang, Q.L.; Yu, D.S.; Shi, X.Z.; Xing, S.H.; Xiong, D.Z.; Liu, Y.L. Quantification of the soil organic carbon balance in the Tai-Lake paddy soils of China. Soil Till. Res. 2016, 155, 95–106. [Google Scholar] [CrossRef]
  23. Zhang, D.; Huang, Q.X.; He, C.Y.; Wu, J.G. Impacts of urban expansion on ecosystem services in the Beijing-Tianjin-Hebei urban agglomeration, China: A scenario analysis based on the Shared Socioeconomic Pathways. Resour. Conservat. Recycl. 2017, 125, 115–130. [Google Scholar] [CrossRef]
  24. Raudsepp-Hearne, C.; Peterson, G.D.; Bennett, E.M. Ecosystem service bundles for analyzing tradeoffs in diverse landscapes. Proc. Natl. Acad. Sci. USA 2010, 107, 5242–5247. [Google Scholar] [CrossRef] [PubMed] [Green Version]
  25. Qiao, X.N.; Gu, Y.Y.; Zou, C.X.; Wang, L.; Luo, J.H.; Huang, X.F. Trade-offs and Synergies of Ecosystem Services in the Taihu Lake Basin of China. Chin. Geogr. Sci. 2018, 28, 86–99. [Google Scholar] [CrossRef] [Green Version]
  26. Huang, Q.X.; He, C.Y.; Gao, B.; Yang, Y.; Liu, Z.F.; Zhao, Y.Y.; Dou, Y. Detecting the 20 year city-size dynamics in China with a rank clock approach and DMSP/OLS nighttime data. Landsc. Urbran Plan. 2015, 137, 138–148. [Google Scholar] [CrossRef]
  27. Liu, Z.F.; He, C.Y.; Zhang, Q.F.; Huang, Q.X. Extracting the dynamics of urban expansion in China using DMSP-OLS nighttime light data from 1992 to 2008. Landsc. Urbran Plan. 2012, 106, 62–72. [Google Scholar] [CrossRef]
  28. Zhou, N.J.; Hubacek, K.; Roberts, M. Analysis of spatial patterns of urban growth across South Asia using DMSP-OLS nighttime lights data. Appl. Geogr. 2015, 63, 292–303. [Google Scholar] [CrossRef]
  29. Ma, T.; Zhou, Y.K.; Zhou, C.H.; Haynie, S.; Pei, T.; Xu, T. Night-time light derived estimation of spatio-temporal characteristics of urbanization dynamics using DMSP/OLS satellite data. Remote Sens. Environ. 2015, 158, 453–464. [Google Scholar] [CrossRef]
  30. Wang, S.Y.; Liu, J.S.; Ma, T.B. Dynamics and changes in spatial patterns of land use in Yellow River Basin, China. Land Use Policy 2010, 27, 313–323. [Google Scholar] [CrossRef]
  31. Shi, K.F.; Huang, C.; Yu, B.L.; Yin, B.; Huang, Y.; Wu, J.P. Evaluation of NPP-VIIRS night-time light composite data for extracting built-up urban areas. Remote Sens. Lett. 2014, 5, 358–366. [Google Scholar] [CrossRef]
  32. Jean, N.; Burke, M.; Xie, M.; Davis, W.M.; Lobell, D.B.; Ermon, S. Combining satellite imagery and machine learning to predict poverty. Science 2016, 353, 790. [Google Scholar] [CrossRef]
  33. Falcone, J.A.; Carlisle, D.M.; Weber, L.C. Quantifying human disturbance in watersheds: Variable selection and performance of a GIS-based disturbance index for predicting the biological condition of perennial streams. Ecol. Indict. 2010, 10, 264–273. [Google Scholar] [CrossRef]
  34. Venter, O.; Sanderson, E.W.; Magrach, A.; Allan, J.R.; Beher, J.; Jones, K.R.; Possingham, H.P.; Laurance, W.F.; Wood, P.; Fekete, B.M.; et al. Sixteen years of change in the global terrestrial human footprint and implications for biodiversity conservation. Nat. Commun. 2016, 7, 12558. [Google Scholar] [CrossRef] [PubMed] [Green Version]
  35. Li, J.; Zhou, Z.X. Natural and human impacts on ecosystem services in Guanzhon—Tianshui economic region of China. Environ. Sci. Pollut. Res. 2016, 23, 6803–6815. [Google Scholar] [CrossRef] [PubMed]
  36. Brett, A.B.; Gao, L.; Ye, Y.Q.; Sun, X.F.; Connor, J.D.; Crossman, N.D.; Stafford-Smith, M.; Wu, J.G.; He, C.Y.; Yu, D.L.; et al. China’s response to a national land-system sustainability emergency. Nature 2018, 559, 193. [Google Scholar]
  37. Larondelle, N.; Haase, D. Urban ecosystem services assessment along a rural–urban gradient: A cross-analysis of European cities. Ecol. Indict. 2013, 29, 179–190. [Google Scholar] [CrossRef]
  38. Shi, K.F.; Chen, Y.; Yu, B.L.; Xu, T.B.; Chen, Z.Q.; Liu, R.; Li, L.Y.; Wu, J.P. Modeling spatiotemporal CO2 (carbon dioxide) emission dynamics in China from DMSP-OLS nighttime stable light data using panel data analysis. Appl. Energ. 2016, 168, 523–533. [Google Scholar] [CrossRef]
  39. Fu, B.J.; Gulinck, H. Land evaluation in an area of severe erosion—The loess plateau of China. Land Degradation Rehabilit. 1994, 5, 33–40. [Google Scholar] [CrossRef]
  40. Qiu, J.X.; Carpenter, S.R.; Booth, E.G.; Motew, M.; Zipper, S.C.; Kucharik, C.J.; Loheide, S.P.; Turner, A.G. Understanding relationships among ecosystem services across spatial scales and over time. Environ. Res. Lett. 2018, 13, 5. [Google Scholar] [CrossRef]
  41. Tomscha, S.A.; Gergel, S.E. Ecosystem service trade-offs and synergies misunderstood without landscape history. Ecol. Soc. 2016, 21, 43. [Google Scholar] [CrossRef]
Figure 1. Location of the study area.
Sustainability 11 05888 g001
Figure 2. Framework for assessing the impact of urban expansion on multiple ecosystem services. In urbanization, urban expansion level model was put forward and verified by nighttime light data. In ecosystem services, eight ecosystem services were assessed. Urban expansion level was separated into three zones: slow-increase zone, increased zone and rapid increase zone. We analyzed the correlation between urban expansion level and ecosystem services.
Sustainability 11 05888 g002
Figure 3. Simulation of digital number values between F101992 and F182010 of Okinawa in Japan. The horizontal axis represents the digital number value of nighttime light data of Okinawa Prefecture from F12 satellite sensor in 1992 (F101992). The vertical axis represents the digital number value of nighttime light data of Okinawa Prefecture from F18 satellite sensor in 2010 (F182010). Where Square of correlation coefficient (R2) is 0.89 and Root mean square error (RMSE) is 16.98.
Sustainability 11 05888 g003
Figure 4. Contrasts in total light index (TLI) of Taihu Lake Basin (TLB) after inter-calibration (a) uncorrected vs. (b) corrected. TLI values were obtained by summing digital number value. The horizontal axis represents year. The vertical axis represents the total light index in the Taihu Lake Basin. F10, F12, F14, F15, F16 and F18 refers to F10, F12, F14, F15, F16 and F18 satellite sensor, respectively.
Sustainability 11 05888 g004
Figure 5. Regression relationships between UELsum and gross domestic product, UELsum and built-up area, UELsum and non-agricultural population, and UELsum and proportion of non-agricultural population in the Taihu Lake Basin from 1992 through 2010. UEL refers to urban expansion level. UELsum refers to the sum of urban expansion level index. R refers to Correlation coefficient. R2 refers to square of correlation coefficient. F-test refers to joint hypotheses test. Sig-test refers to significance test. N refers to number of samples.
Sustainability 11 05888 g005
Figure 6. The 1 km scale mapping of urban expansion level in the Taihu Lake Basin for 1990, 2000, and 2010. Due to the unavailable nighttime light data for 1990, the 1992 data was used instead. In 1990 and 2000, the mean urban expansion level was 0.032 and 0.058. In 2010, the mean urban expansion level was 0.135, which increased by 1.3 times compared with 2000.
Sustainability 11 05888 g006
Figure 7. Changes to urban expansion level at the 1 km scale in the Taihu Lake Basin, from 1990 to 2010. (a) Absolute changes of urban expansion level. (b) Histogram showing the distribution of relative changes in urban expansion level.
Sustainability 11 05888 g007
Figure 8. Mean value and coefficient of variation (C.V) of ecosystem services in crop production (CP), freshwater supply (FS), aquatic production (AP), net primary productivity (NPP), soil conservation (SC), water retention (WR), flood regulation (FR), forest recreation index (FRI) among the slow increase zone (SIZ), increase zone (IZ), rapid increase zone (RIZ) of the Taihu Lake Basin in 1990–2010.
Sustainability 11 05888 g008
Figure 9. Pearson correlation coefficients between urban expansion level and ecosystem services in crop production (CP), freshwater supply (FS), aquatic production (AP), net primary productivity (NPP), soil conservation (SC), water retention (WR), flood regulation (FR), forest recreation index (FRI) among the slow increase zone (SIZ), increase zone (IZ), rapid increase zone (RIZ), and the whole Taihu Lake Basin, for 1990–2010.
Sustainability 11 05888 g009
Figure 10. Spatial patterns of trade-offs and synergies: (a) Factor 1, synergies. Red indicates locations where both freshwater supply and aquatic production are high. (b) Factor 2, trade-offs. Red indicates locations where both crop production and net primary productivity are high, yet freshwater supply is low. (c) Factor 3, trade-offs. Red indicates where forest recreation is high, but flood regulation is low.
Sustainability 11 05888 g010
Figure 11. Pearson correlation coefficients between urban expansion level and bundles of ecosystem services in the whole basin, and the slow increased zone (SIZ), increased zone (IZ), and rapid increased zone (RIZ) of the Taihu Lake Basin.
Sustainability 11 05888 g011
Table 1. Loadings of ecosystem service indicators on principal component analysis (with varimax rotation), using 1000 random points in the Taihu Lake Basin.
Ecosystem servicesFactor1Factor2Factor3
Crop production−0.0770.6760.011
Freshwater supply0.663−0.4860.011
Aquatic production0.757−0.062−0.041
Net primary productivity0.1450.6790.016
Soil conservation0.3990.2250.358
Water retention−0.439−0.2390.097
Flood regulation0.0580.084−0.708
Forest recreation index−0.0380.0530.715
Variance explained (%)18.62215.45814.055
Notes: Factor loadings ≥0.45 are shown in bold.

