Article

Delineation of Urban Growth Boundaries with SD and CLUE-s Models under Multi-Scenarios in Chengdu Metropolitan Area

1
College of Tourism and Urban-Rural Planning, Chengdu University of Technology, Chengdu 610059, China
2
School of Urban Planning and Architecture, Southwest Minzu University, Chengdu 610041, China
3
College of Architecture, Planning and Public Affairs, University of Texas at Arlington, Arlington, TX 76019, USA
*
Author to whom correspondence should be addressed.
Sustainability 2019, 11(21), 5919; https://doi.org/10.3390/su11215919
Submission received: 29 August 2019 / Revised: 18 October 2019 / Accepted: 22 October 2019 / Published: 24 October 2019
(This article belongs to the Section Sustainable Urban and Rural Development)

Abstract

:
For megacities experiencing rapid urbanization in China, urban growth boundaries (UGBs) have been considered as a useful means to control urban sprawl and to promote sustainable urban development. However, scientific methods and tools to delineate sound UGBs by planners are few and far between. Using metropolitan Chengdu as the study area, this paper applies the system dynamics (SD) and conversion of land use and its effects at small region extent (CLUE-s) models to delineate UGBs. In this study, land use demand was simulated in the SD model temporally at a macro-level and allocated in the CLUE-s model spatially at a micro-level. Key social-economic elements and spatial pattern factors were used in the simulation process for the period of 2013–2030. The simulation results under various scenarios showed that areas along the major corridors and belt roads of the main Chengdu metropolitan area and its satellite towns have higher chances to be developed. The areas most likely to be developed were used to establish the UGBs for 2020, 2025, and 2030. This research demonstrates that the integrated framework of SD and CLUE-s models provides a feasible means of UGB delineation under different development scenarios.

1. Introduction

Since the 1990s, China has been undergoing rapid urbanization with an annual average growth rate of about 1.0% between 1990–2000 (36.1%) and 1.4% between 2000–2017 (58.5%), respectively [1,2]. During this period of rapid urbanization, unregulated urban expansion within built-up areas encroaching on farmlands, forests, and waterbodies were reported by many metropolitans [3], causing degradation to regional ecosystems and speculation in the real estate market. Realizing these problems and the importance of controlling urban sprawl in cities, the Chinese government has turned to urban growth boundaries (UGBs) to guide sustainable urban development.
UGBs were originally used for Lexington, Kentucky, USA in 1958 [4] and adopted by Portland, Oregon, USA in 1979 [5]. Although UGB is still controversial among scholars and decision-makers, it has become one of the most popular planning tools to curb urban sprawl worldwide [6]. In recent years, city officials, research experts, and practicing planners have become increasingly concerned about the negative aspects of urbanization, including various environment, physical, and social issues. Some Chinese cities have experimented with various UGBs to see their effects. In 2014, the urban development boundary (UDB) was put forward by four ministries of the central government to promote the integrated planning process in pilot cities (counties). UDB in China, in terms of boundary and containment, is essentially the same as UGBs in the USA and other Western countries. Both UDB and UGB delineate the boundaries between urban and rural areas or between construction land and other land, with development priorities given to the lands within boundaries [7]. In this paper, we adopt UGB for the rest of the discussion.
In China, UGBs for cities are often delineated according to planners’ personal experiences [7], which are not reliable in land use forecasts. Consequently, on the one hand, the supply of suitable land for needed development is short of the demand in some cities, and on the other hand, the UGB planning has failed to control urban sprawl in some metropolitan areas in the past few decades [8]. Another reason that urban planning failed to control urban growth was inaccurate urban population forecast in China. Moreover, to control urban growth, China’s central government put forward some new urban planning requirements, including delineating the ecological, agricultural, and urban spaces at a more complex regional scale. Therefore, to determine better UGBs and to minimize mismatches between land supplies and demands, more scientific methods and tools should be explored and developed.
In this study, key steps include establishing the linkage of population, land uses and land demands, forecasting population, simulating land-use patterns under three scenarios and delineating UGBs of metro Chengdu by using SD (system dynamics) and CLUE-s (Conversion of Land Use and its Effects at Small Region Extent) models. The paper is organized as follows. After the brief introduction in Section 1, a concise literature review is provided in Section 2. Section 3 presents the study area and relevant spatial and temporal databases. Section 4 develops the methodology, which is based on the integrated framework that combines the SD and CLUE-s models. Important results and analyses are provided in Section 5, followed by research conclusions and remarks in Section 6.

2. Literature Review

The literature indicates that the delineation of UGBs can benefit from using urban growth models or land use change simulation models., including cellular automata (CA) and agent based model (ABM) [6,7,9,10,11,12,13,14,15,16], such as SLEUTH [17], CLUE-s [18], and GEOMOD [19]. Some influential studies and plans have applied these models to help determine UGBs [6,7,20,21,22].
More specifically, the CLUE-s model is suitable for local or regional scale applications. In this model, a series of hierarchical rules is coupled with a logit model to transit cells in pixels for a study area. Compared with other empirical models, its advantage is that it can simulate changes of multiple land-use types at the same time with the dynamic simulation of competition between different land-use types [18]. This property makes it widely applicable to different regions or countries with various land use compositions, changes, and policies. For example, Verburg et al. used it for identifying the main trajectories of land use change across Europe [23]. The Dyna-CLUE, a prior version of CLUE-s, was also used by Verburg et al. to explore future abandoned farmlands in Europe [24]. Wang et al. combined multi-objective programming and the Dyna-CLUE model to project land use changes of Wuhan city in 2030 [25]. Zhang et al. used CLUE-s and the SWAT models to simulate pollution loads under multi-land use scenarios in the upstream watershed of Miyun Reservoir in Beijing [26]. Castella and Verburg compared ABM and CLUE-s model to check the respective validity in a mountain area of Vietnam [27]. Trisurat et al. studied land-use/land-cover changes during 2009–2020 by using the CLUE-s model and conceivable rainfall changes to predict the future levels of water yield and sediment load in Southern Thailand [28]. Henríquez-Dole et al. used Dyna-CLUE to assess the impacts of long-term policy on land use changes in the Maipo River basin of Chile up to year 2050 [29]. The CLUE-s model was also shown to be suitable for UGB delimitating for urban China [30].
The SD model, developed by Jay W. Forrester in the 1950s, consists of three tightly coupled subsystems, namely the population, land use and economy in this study. In the model, the population subsystem, gross domestic product (GDP), scientific-technological progress, and local land use policies directly or indirectly affect the amount of land use demand. This model can illustrate the complexity of a city or region very well [31] by interactions between factors through positive or negative feedback. Population forecasting under multi-scenarios was the essential step for land use demand prediction. Since population growth is considered nonlinear and affected by many factors, the SD model can yield more realistic population forecasts than the population prediction methods traditionally used by urban planners.
This study combines the non-spatial modules in SD and spatial modules in CLUE-s to define UGBs for metro Chengdu by rationally allocating urban-rural development spaces based on demands from the population and to determine the spatial patterns of urban-rural development that meet the sustainable development needs. Thus, the SD and CLUE-s models complement each other to provide powerful analytical capabilities for UGBs delineation.

3. Study area and Data

3.1. Study Area

The Chengdu metropolitan area has been a political, economic, and cultural center of Southwest China since ancient times. It is within the extent of 102°54′ E to 104°53′ E and 30°05′ N to 31°26′ N, and located in the center of Sichuan province (Figure 1). It is 192 km from east to west and 166km from north to south. The study area covered 12,121 km2, including 10 districts, four cities (county-level), and five counties. The plains, hills and mountainous areas accounted for 40.1%, 27.6% and 32.3% of the total metro area, respectively. The elevation of the study area ranges from 387 m to 5364 m [32].
In recent years, the economy of the Chengdu city area has been growing rapidly. During 2010–2015, its GDP increased 95%, growing from 555.13 billion RMB Yuan to 1080.12 billion RMB Yuan (equivalent to 173.37 billion U.S. dollars, at the exchange rate of 6.23 in 2015). The population increased 7% from 11.49 million to 12.28 million during the same period. From 1977 to 2013, Chengdu’s built-up areas changed from 91 km2 to 413 km2, with the proportion of the total land area increased from 17% to 76% within the fourth ring road [33]. Chengdu city has become a megacity in the plains, making it more necessary to properly delineate UGBs in order to guide the city’s sustainable expansion today and in the future.
With respect to the other 660 Chinese cities in terms of population, urbanized area, GDP, land-use, and other major factors in magnitude and change rates, Chengdu is a top megacity just behind the first-level mega cities Beijing, Shanghai, Tianjin, Guangzhou, and Shenzhen. Its urban spatial development is not as dramatic as many second-level smaller cities in the east, but in China’s west, Chengdu had developed fairly well since China’s open-door policy started in 1978. It is a good representative megacity for urban spatial growth through UGBs.

3.2. Data

The data used for this study include remote sensing, digital elevation model (DEM), population census, GDP, transportation, soil, and administrative data. The remote sensing data, including Landsat Thematic Mapper (TM), Enhanced Thematic Mapper Plus (ETM+) and Operational Land Imager (OLI) images for the selected years of 2000, 2005, 2009 and 2013, were acquired from the USGS website. DEM was extracted from ASTER GDEM v2, which was downloaded from LP DAAC website. Population census and GDP data were taken from the CHENGDU STATISTICAL YEARBOOK 2000–2015. We obtained transportation, soil, and administrative data from the Sichuan Remote Sensing Center.
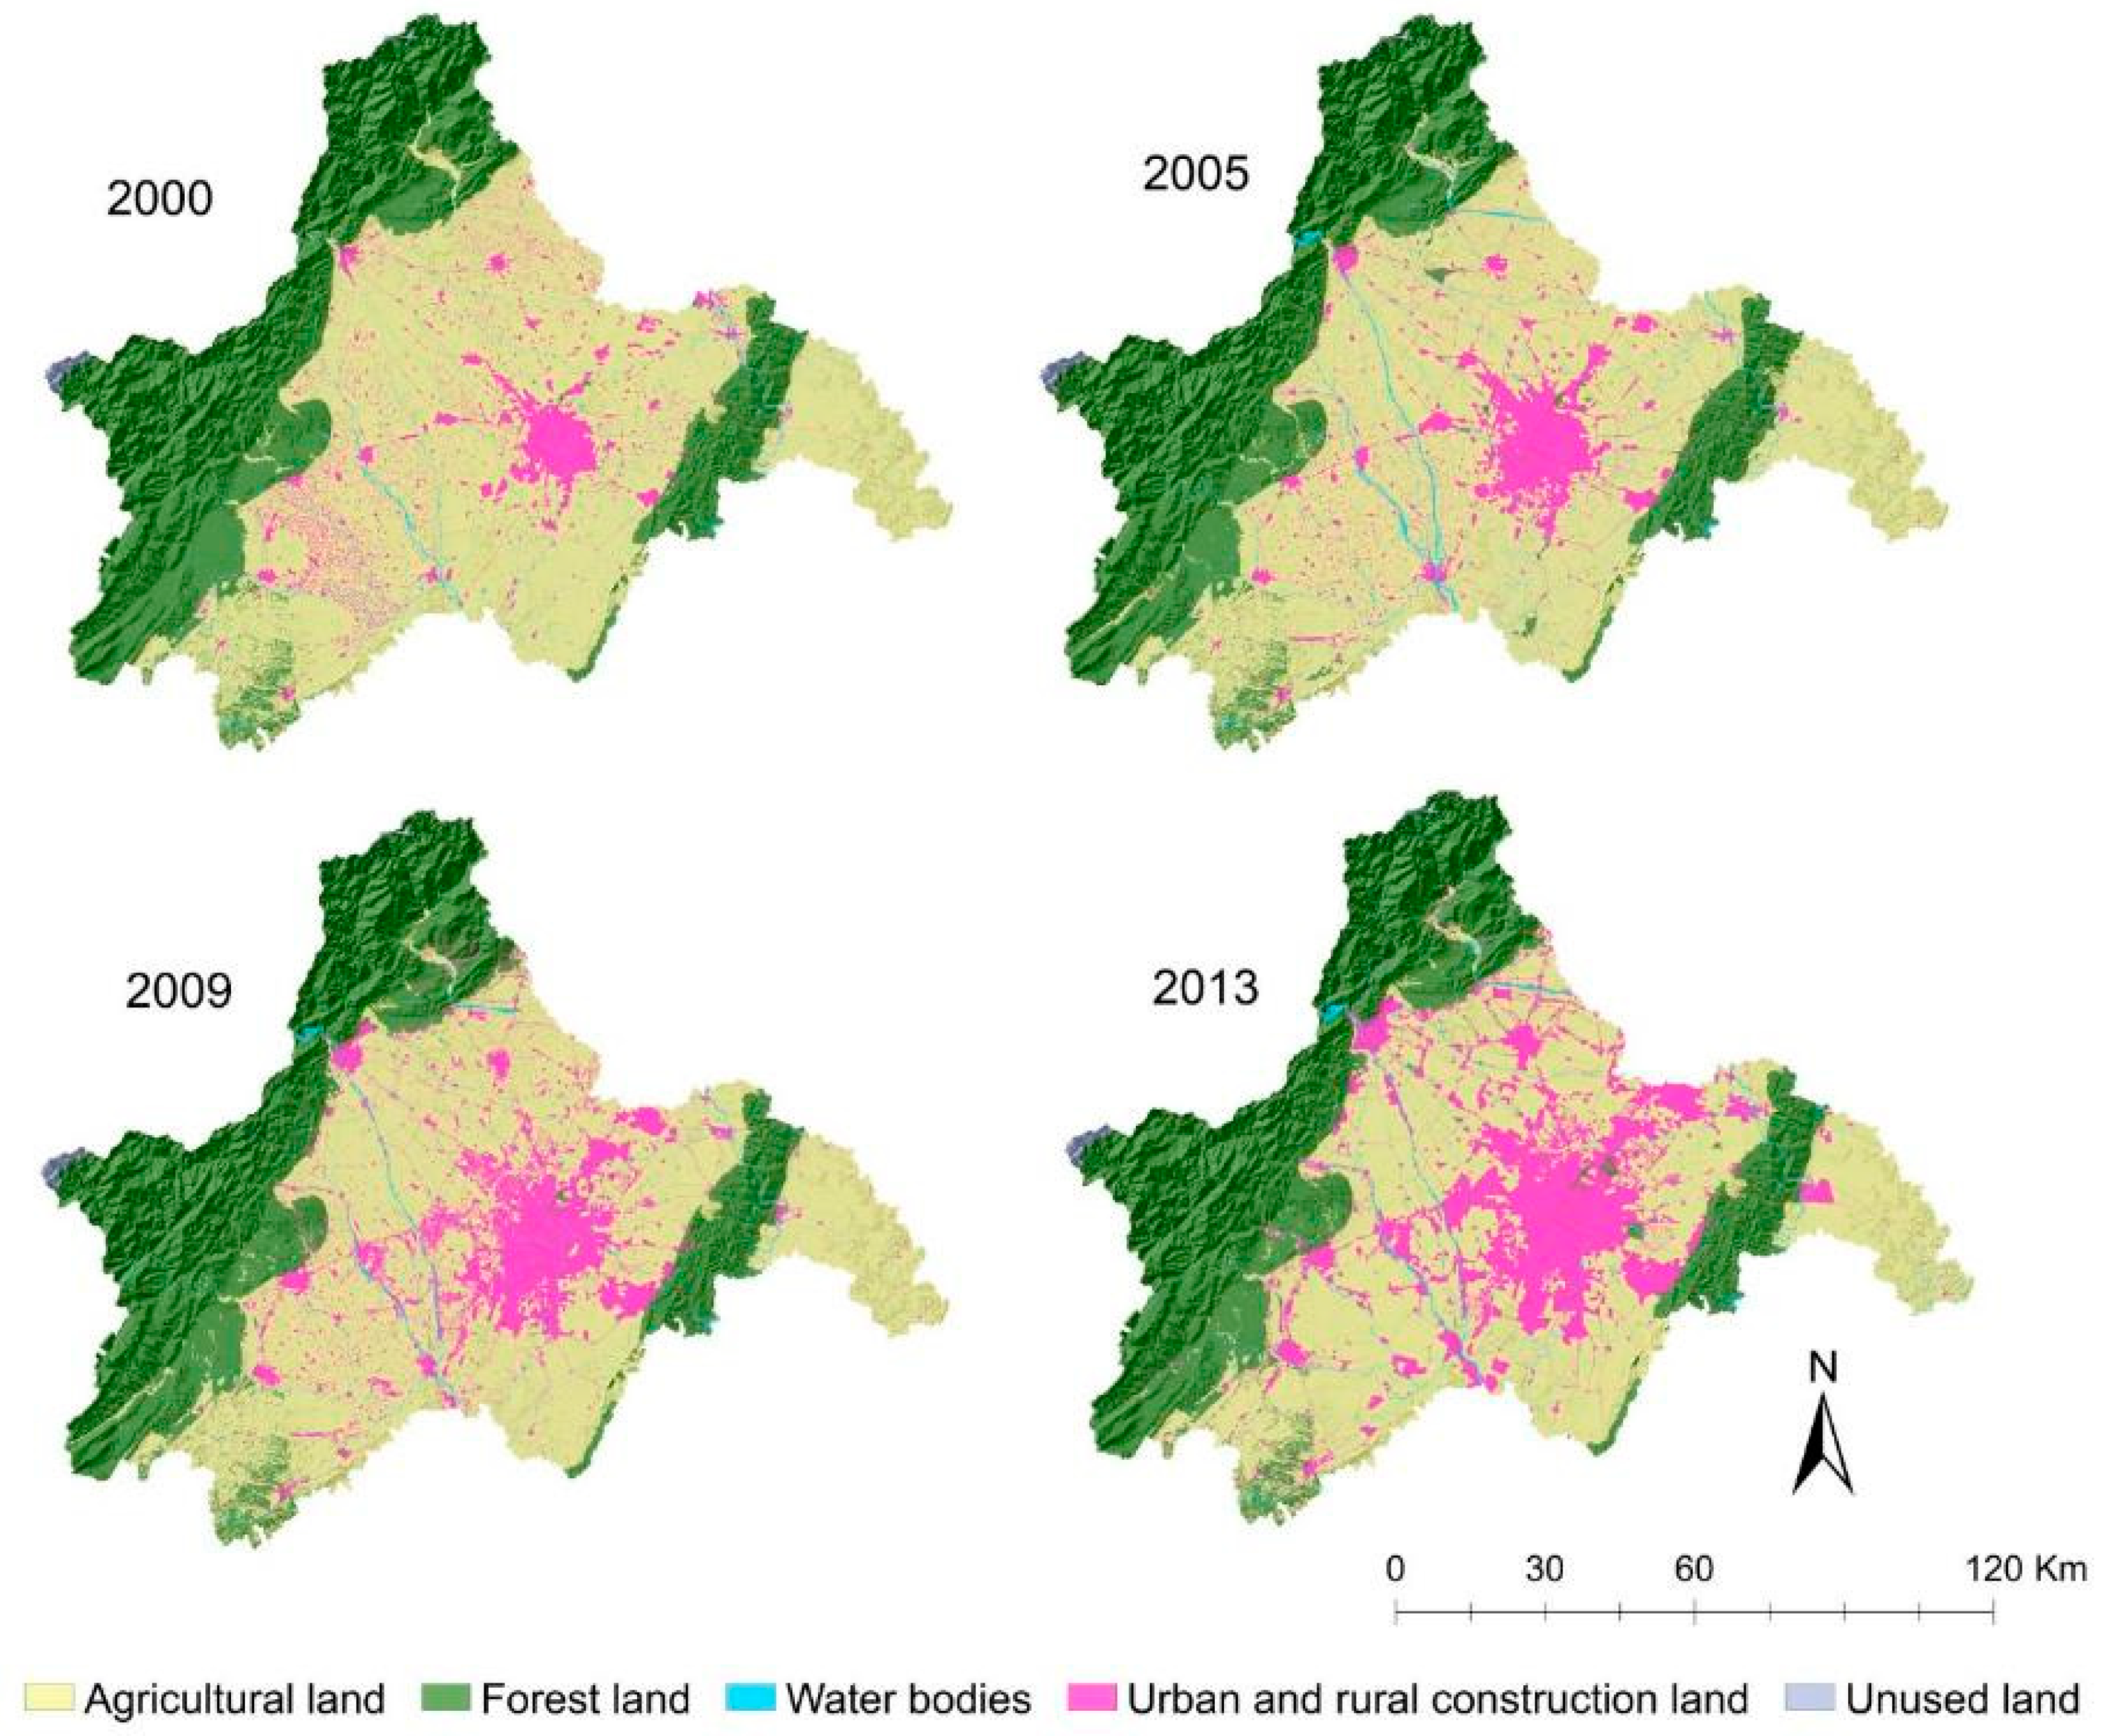
All the images covering the study area were geometrically corrected. The coordinate system of all the data was transformed into UTM84N, WGS-84 in GIS software. All the remote sensing data was processed for band selection, color composition, atmospheric correction, mosaic, and image cutting in the Imagine remote sensing software. In addition, some field surveys were taken to get the interpreting marks for the images. Based on these marks, land use information was extracted from the remote sensing images for the years 2000, 2005, 2009, and 2013 with the ArcGIS software by interactive image interpretation. Five types of land cover—agriculture land, forest land, urban and rural construction land, water bodies, and unused land—were identified and mapped (Figure 2). To check the image classification accuracy, we used old land use/cover documents and Google Earth images. The overall accuracy and Kappa coefficient were computed.

4. Methods

The combined SD-CLUE-s model provides the functions to project the future land use demand and determine the spatial allocation of land resources. The SD model adopts ‘top-down’ processing to predict the land use demand based on multi-scenarios at the regional scale. The CLUE-s model (the Dyna-CLUE version 2.0) combines the top-down allocation of land use change to grid cells with a bottom-up determination of conversions for specific land use transitions. The details of the two models are presented below.

4.1. SD Model for Land Use Demands Prediction

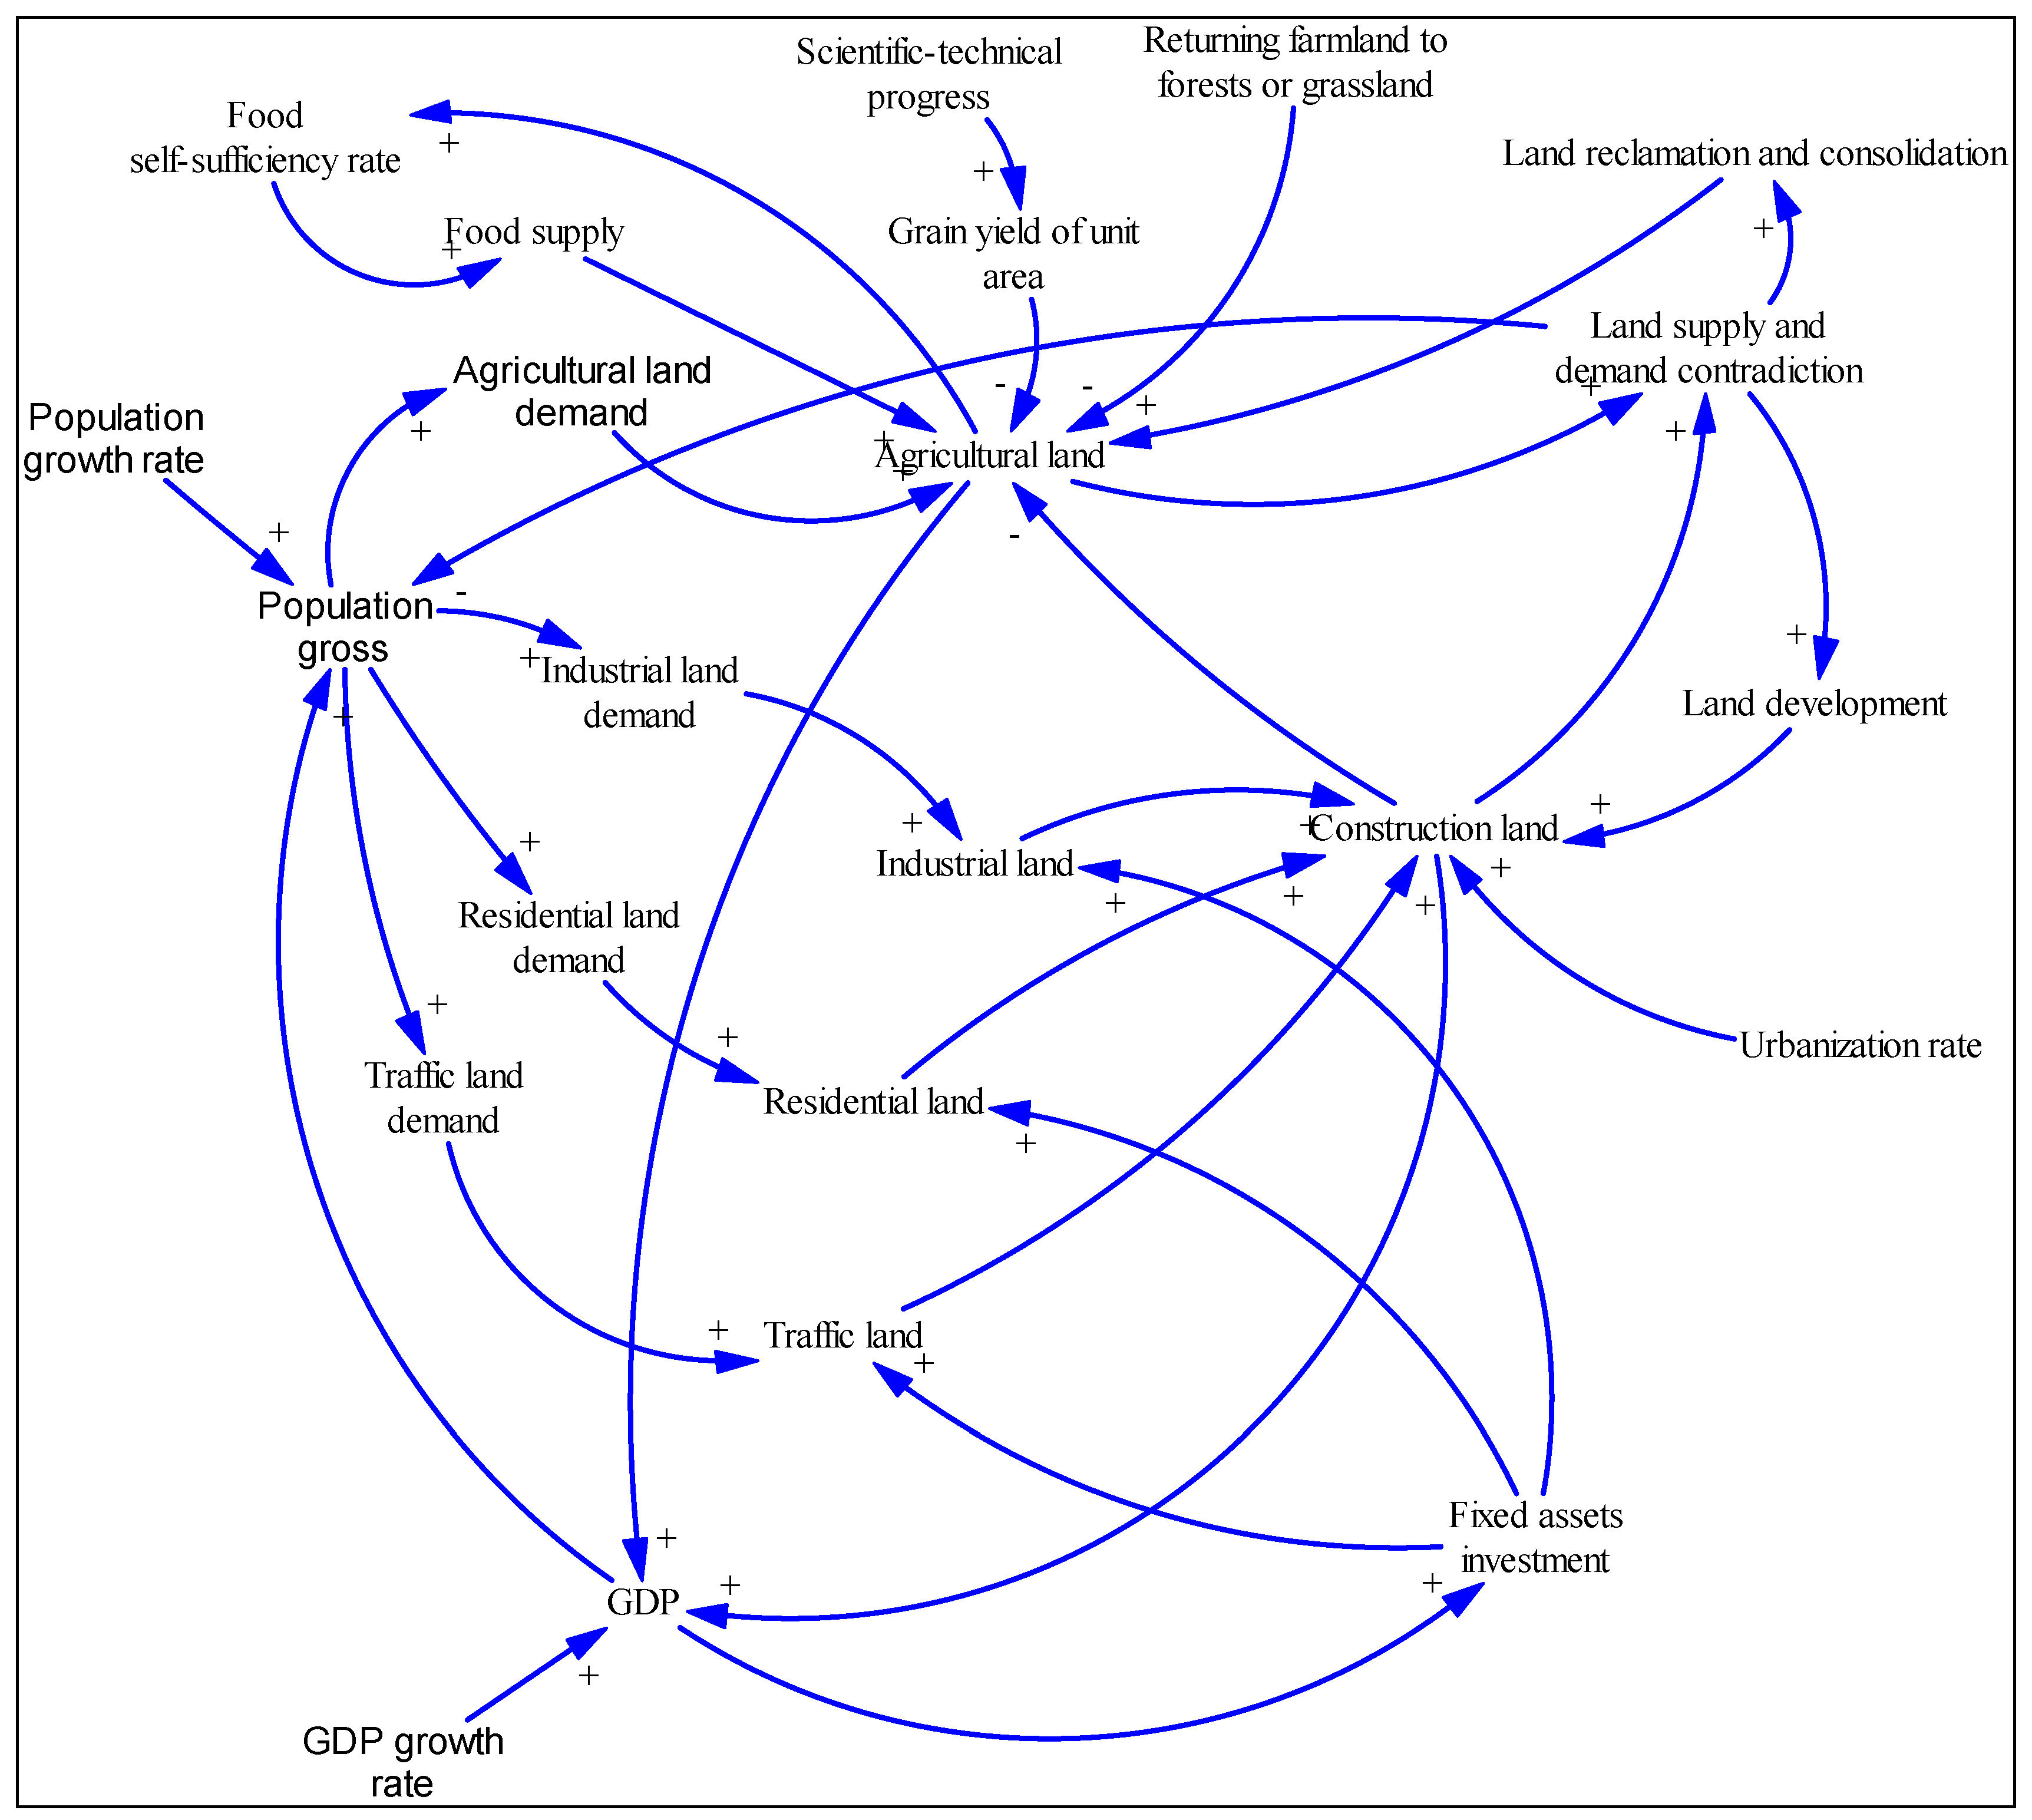
The SD model links population and land use demand directly by four land-uses—agricultural, residential, industrial, and transportation—considered essential for urban livability. These land uses are influenced directly by population growth rate, urbanization rate, GDP growth rate, investments in fixed assets, scientific-technological progress, and regional development policies. The main interactions between different factors and the overall structure of the SD model are presented in Figure 3.
In this study area, construction occupied a part of agricultural land (including the planted woodland for economic benefits) and water bodies (mainly small lakes and ponds). With the emphasis on ecosystem protection in Chengdu metropolitan area, some construction land closed to the mountain area transferred to the forest. Moreover, some rural construction reclaimed agricultural land. Unused land is in alpine areas, which are commonly above 3000 m elevation and cannot be changed to another land use type. The forest in mountain areas and rivers are forbidden to be occupied by construction. But the forest in plains can be changed easily [33]. Therefore, the proposed SD model structure can help us get the nature of the interactions between the physical processes, information flows, and local development policies to promote the dynamics of urban growth for Chengdu.

4.2. CLUE-s Model for Land Use Changes Simulation and Spatial Allocation

The CLUE-s model was developed based upon the CLUE model [34,35]. It is suitable to simulate land use changes and their effects at the regional scale. The model is composed of two modules. One is a non-spatial demand part, and the other is a spatially explicit allocation part. The non-spatial demand module computes every land use demand for each year. In this module, the demand computing methods are alternative. As for which methods to choose, we should consider the characters of the most significant land-use transitions occurring in the study area and the specified scenarios [18]. In this study, the SD model was chosen to calculate the land use demand prediction. The spatial allocation module assigns all the demands to each grid cell based on the computing results of non-spatial demand module. The conversion probabilities of each grid cell were calculated simultaneously by the demands, policy restrictions of study area, spatial location nature, and transition settings [24,36]. In the model, logistic regression was used to calculate the probability of a specific grid cell to be related to a land-use type based on land-use patterns and a set of driving factors. The logistic regression equation is as following:
log ( P i 1 P i ) = β 0 + β 1 , i + β 2 X 2 , i + β n X n , i
where P i is the probability of a grid cell occupied by the specific land-use type i , X represents the driving factors, and β is coefficient which can be estimated by logistic regression method. This method can help us to select the relevant driving factors from a larger set of factors that are assumed to influence the land-use pattern. Factors that make no significant contribution to explaining the land-use pattern were excluded from the final regression equation [18]. The fitness of the regression equation for each land-use type can be tested by the receiver operating characteristic (ROC) curve [37,38], which is between 0.5 and 1. With the increase of the ROC value, the ability for the regression equation to explain the land-use pattern is gradually increased [39]. Finally, the land-use pattern of each land-use type is obtained from the logistic regression results.

4.3. Integration of the SD Model with the CLUE-s Model

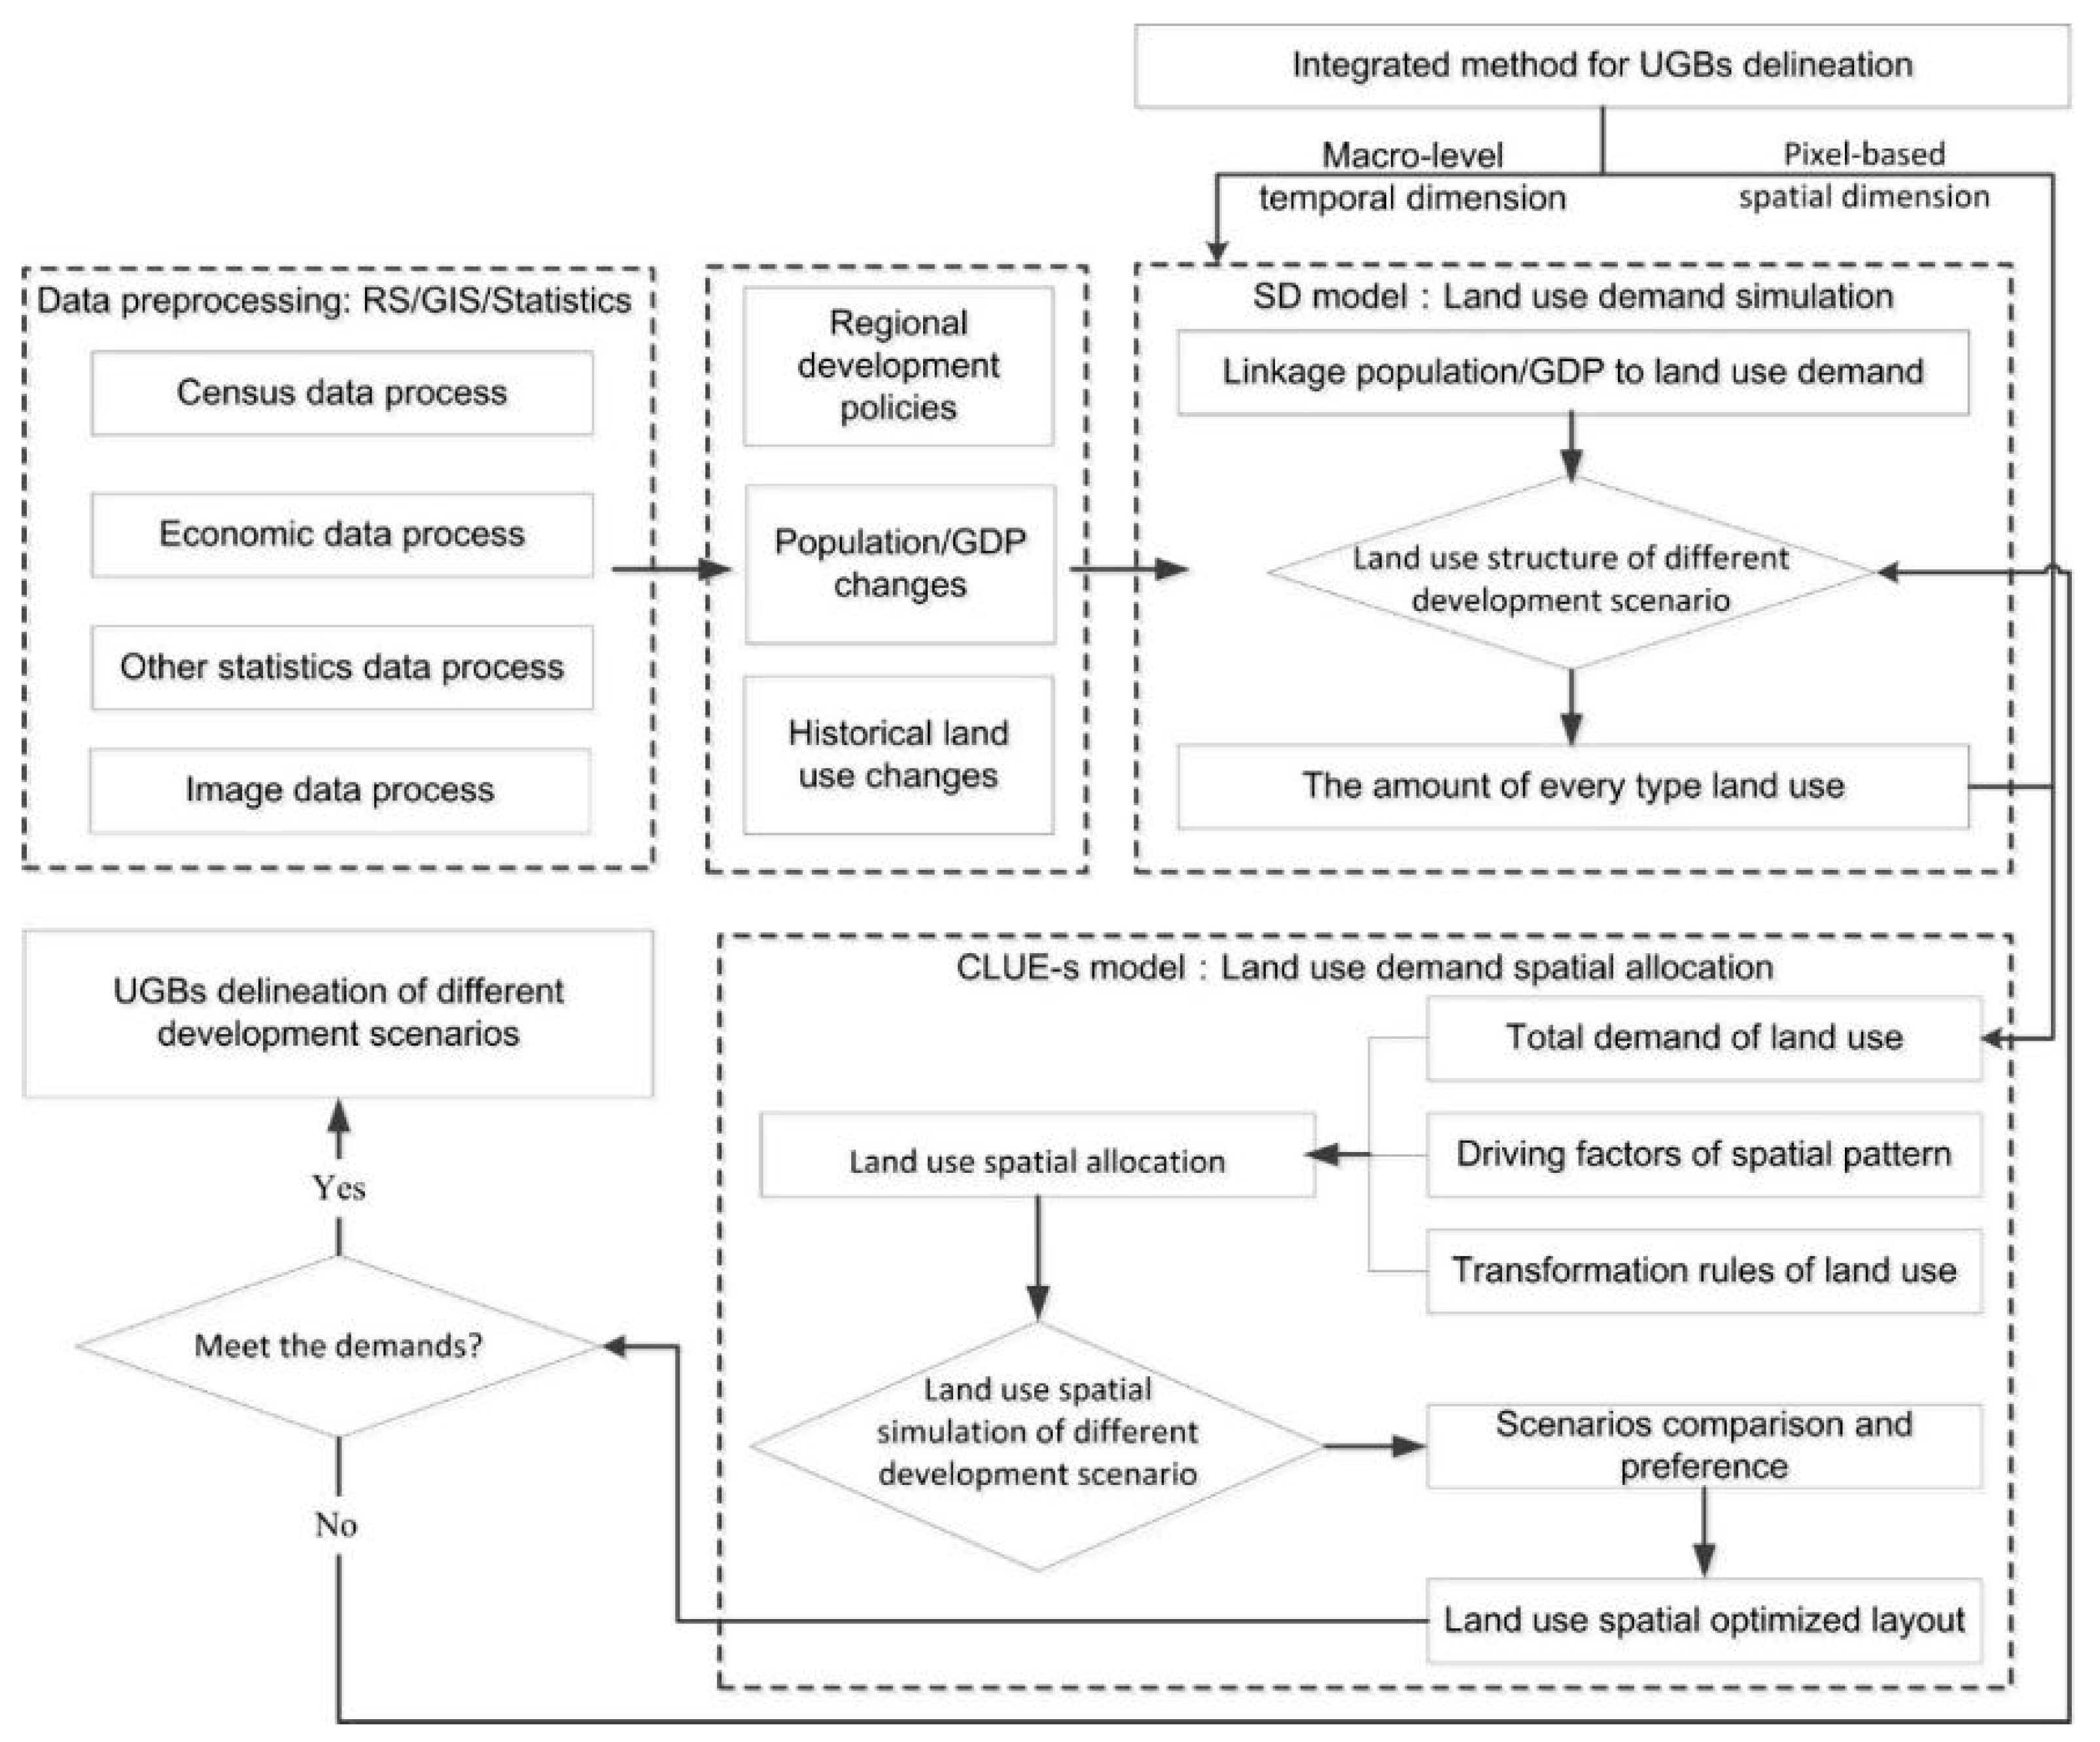
The SD model can predict land use demands well through time scales, but it lacks the ability to represent the spatial processes of land-use allocation. However, it cannot process and represent spatial data well, nor can it characterize the spatial distribution of and uses. The CLUE-s model can quantitatively analyze the relationship between regional land use change and the driving factors of the natural environment, social-economy, transportation, and ecology. It can better represent the land use change process under different spatial-temporal scales. Moreover, it can simulate the future land-use changes under different scenarios. The CLUE-s model is a strong tool for land-use decision-making. It can also support the urban-rural planning better through delimiting the spatial pattern of regional land-use. However, its ability to forecast the overall demands for various land-use types is still limited under certain social and economic conditions. In this study, therefore, integrating the SD and the CLUE-s model will lead to well projected population, land-use demands, and spatial patterns to delineate the UGBs under different developing scenarios for Chengdu (Figure 4).

4.4. Land Use Changes Simulation and UGBs Delimiting

Land Use Demand Projections under Multi-scenarios

Three scenarios were considered for Chengdu’s future land-use demands, including:
  • A high speed socio-economic development scenario (S1), which means historical socio-economic developing speed will continue and land-use demand growth is still high.
  • A moderate socio-economic development scenario (S2), which means that a comprehensive consideration of socio-economic development with ecological protection and land-use demands will be limited by a set of critical indicators.
  • The new normal socio-economic development scenario (S3), which means more strict ecological projection and decreasing socio-economic development speed and reducing land-use demands in the study area. These scenarios were designed based on the Chinese or Chengdu city government’s policies. The socio-economic development factors were derived from historical data analyses. The critical indicators and their values used in the model are listed in Table 1. These indicators were selected after considering economic development, population growth, urbanization, food supply, and scientific-technological progress. In the land use demands simulation and projection process in the SD model, 66 parameters affecting land-use demands were considered. The spatial boundary for simulation and projection was the study area boundary, and the time limit was from 2000 to 2030.
With the unique topographic features in the study area, the demands of the agricultural land and construction land were kept for a dynamic balance. Further, the water bodies or the forest lands were considered to be changing. The unused lands were considered as unchanged at 38 km2. All simulations assumed that the total area of land demands could not exceed the study area and were carried out by using Vensim PLE and STELLA9.0 to build the SD model.
To ensure the reliability of the land-use demands projection, we validated the SD model with the input data for the period of 2000–2013. The land-use data derived from the satellite image in 2000 was used as the base-year data, and the land-use data in 2005, 2009, and 2013 were used to validate the model. The validation details were well described by Youjia Liang [36,40].

5. Results and Analyses

The reliability verification of the SD model simulation results are shown in Table 2. The simulation of each land-use area in 2005 showed that the accuracy of the construction land area was the lowest, at 1.32%, and the others’ absolute values were less than 1%. The simulation results in 2009 showed that the accuracy of the construction land area was still the lowest, −1.51%, and the water bodies were 1.13%. The simulation results in 2013 showed that the accuracy of water bodies was the lowest, at −4.38%, and the others’ absolute values were less than 1.00%. The accuracy of projection results of all simulations was less than 5.00%. All these errors were within the margins of error of the study.
Thereby, the reliability of the SD model can be confirmed. Further, the different land-use demand projections under the three scenarios were calculated for the study area during 2013–2030. The projection results are presented in Table 3. This shows that agricultural land and forest land would decline, and that water bodies and the construction land area would increase in this period.

5.1. Spatial Simulation and Results

Based on the land-use demands projection, the CLUE-s model was used to allocate the demands at the local spatial scale. The land-use data of the study area in 2013 was used as the baseline input data to forecast land-use pattern from 2013 to 2030. In the simulation, various spatial factors were adopted to reflect the possible distribution changes of the land-use. These factors included DEM, slope, soil, distance to the city center, distance to the central towns, distance to main levels of roads, and population density. All the factors and land-use data were covered and resampled to the raster data with a resolution of 500 × 500 m. They were used to assess the suitability of a grid cell to a land-use type.
In this study, according to Verburg and Overmars’ study [24], a logistic regression was taken to determine the relation between each land-use type in 2013 and a set of factors. The β and ROC values were computed to explain the relationship and the spatial pattern of each land-use type with the selected factors. According to the ROC values, they were arranged from big to small. That was unused land (0.983) > forest land (0.951) > construction land area (0.868) > agricultural land (0.857) > water bodies (0.633). Except that the ROC value of water bodies was less than 0.7, the ROC values of other land-uses were greater than 0.8. The reason that the ROC value of water bodies is less than 0.7 was related to the resolution of the raster data. The resolution of 500 × 500 m filtered out a lot of rivers and ponds. According to the parameter setting requirements that the CLUE-s model would include the definition of conversion elasticities for land-use types, we organized the files needed for the model to run the multi-scenario simulation. Conversion elasticities were set according to the expert judgment of the conversion costs for different land-use types and the restrictions of the spatial development policies.
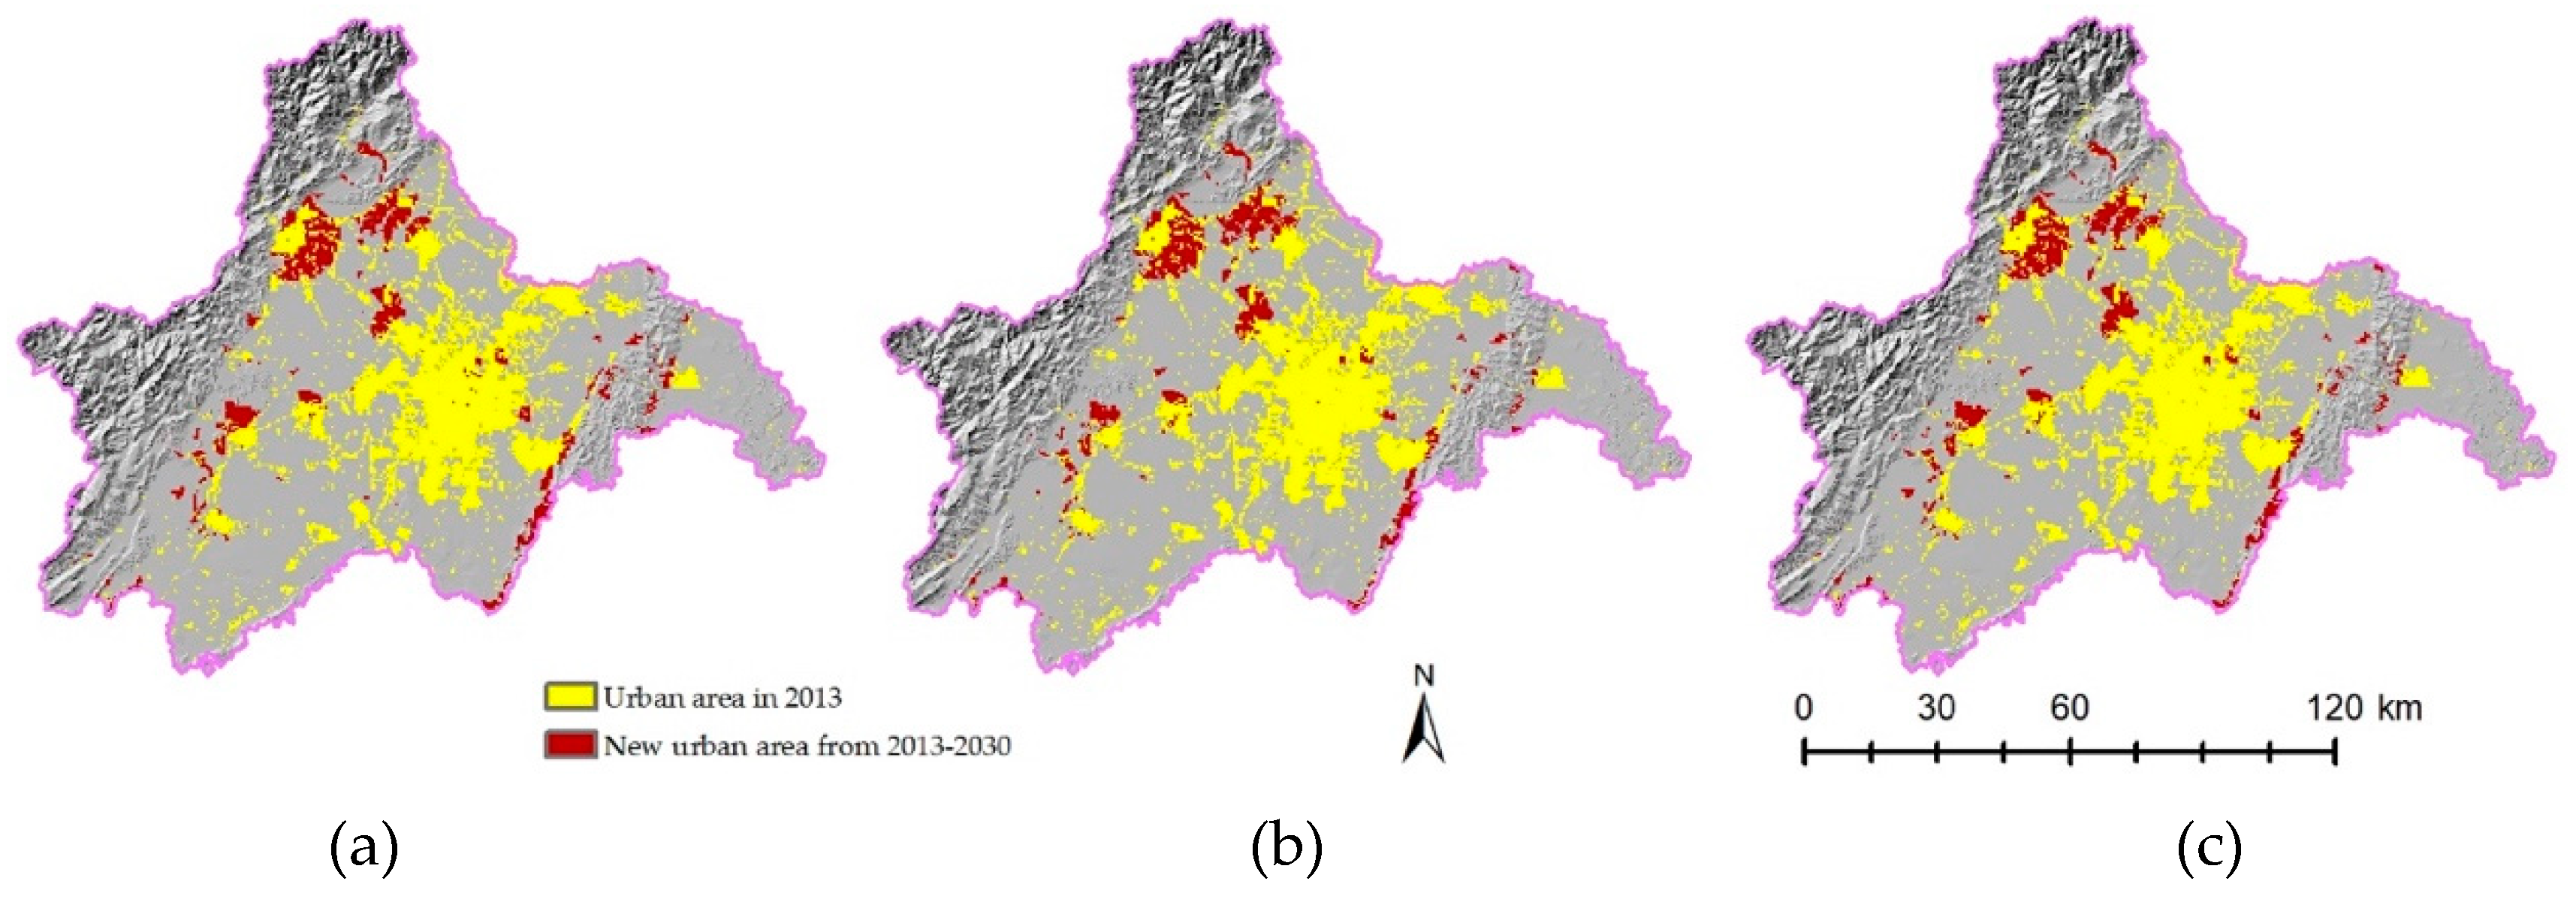
The simulations of land-use changes for multi-scenarios were taken and the spatial growth of urban area in the study area for every scenario is presented in Figure 5. Due to the parameter settings of the SD model for future population forecasts for the study area, the calculated results for each scenario were not very different. However, it is still possible to see through subtle differences in the maps where it can be an important growth point for the study area if the population will change in the future. From the maps, we can also see that the main spatial development axis is Dujiangyan–Pidu–Longquanyi in the future. This is consistent with the latest spatial planning of metro Chengdu. In addition, the satellite towns around Chengdu will be likely to experience more development in the future too.

5.2. UGBs Delineation

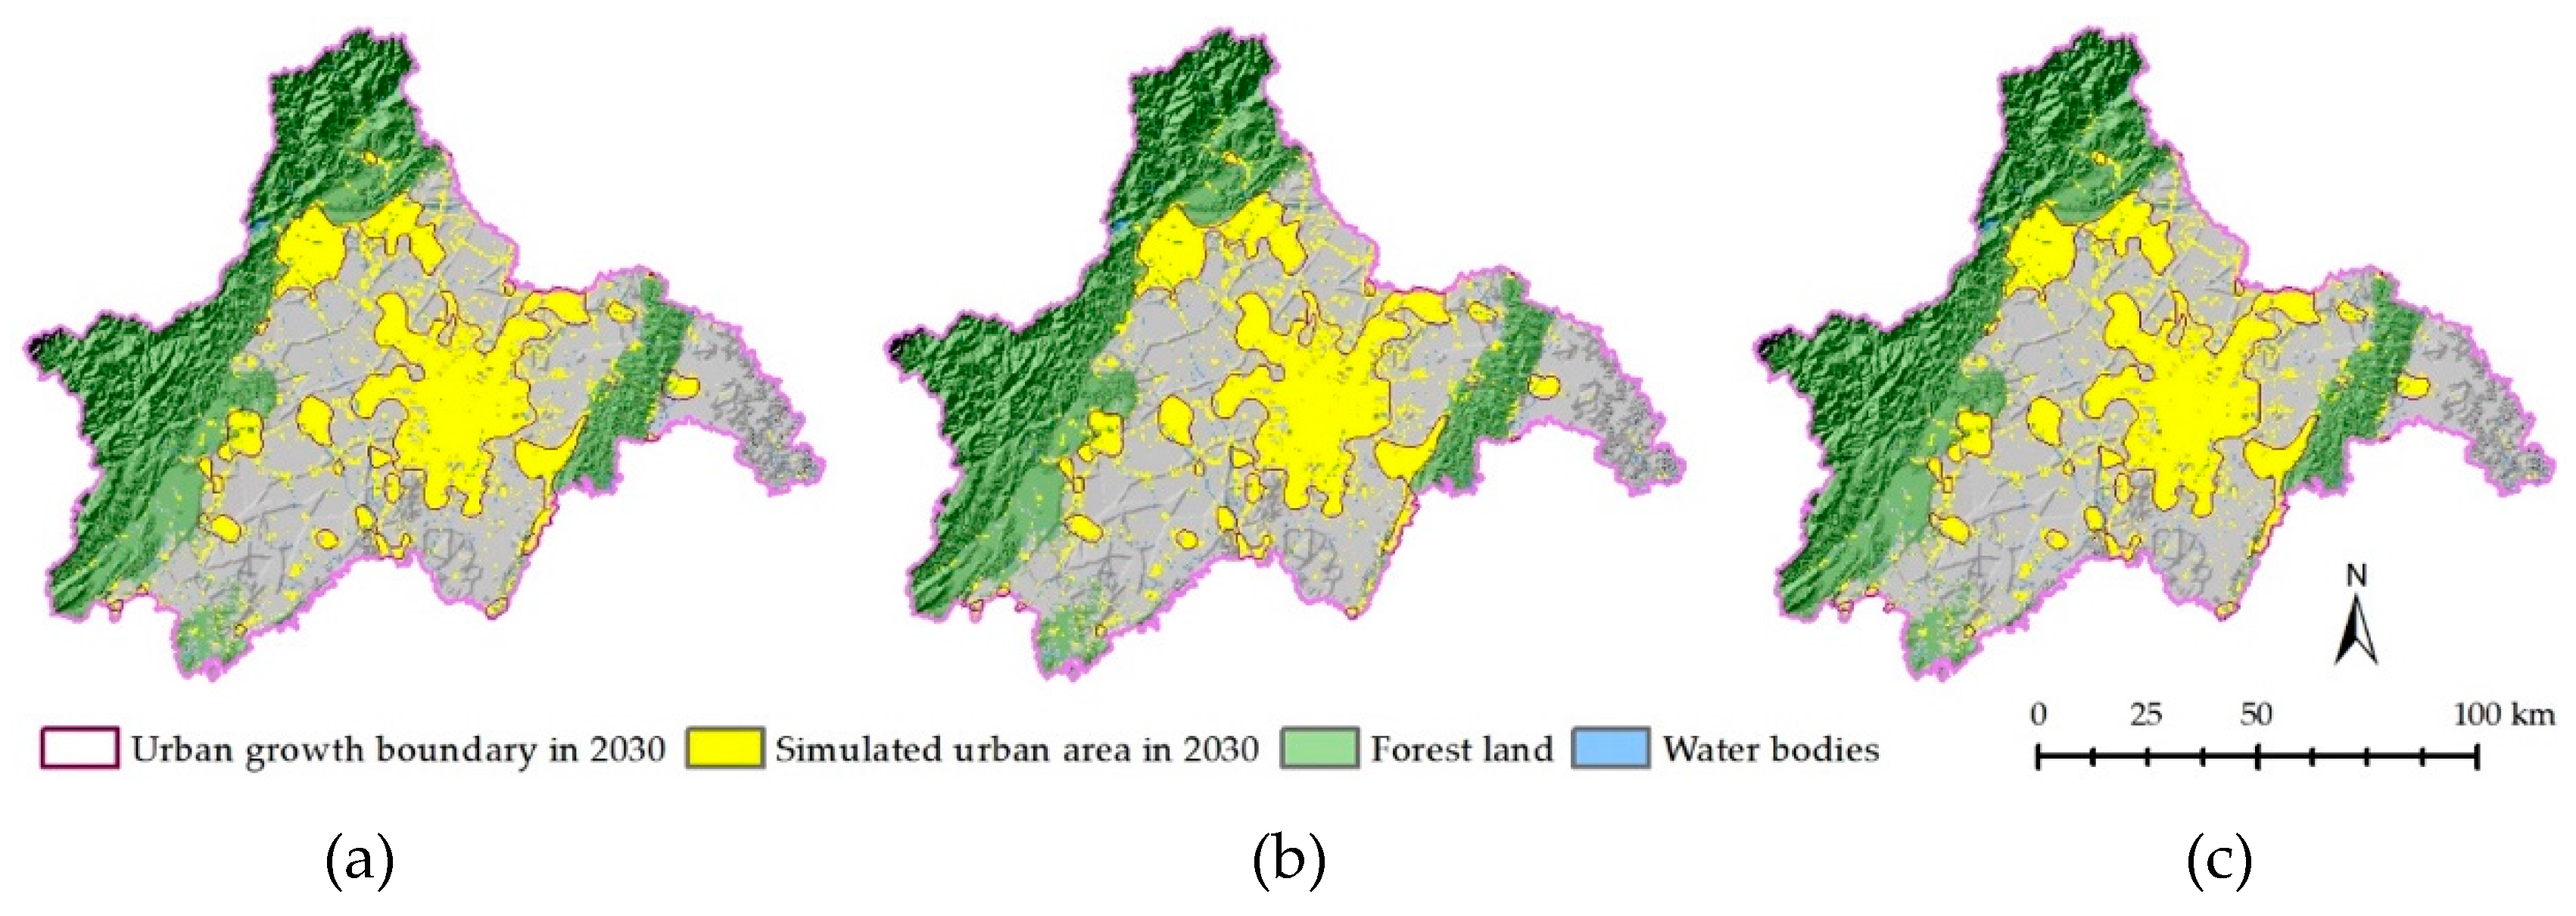
Based on the multi-scenario simulation results of land-use changes, the UGBs of the study area were delineated by using GIS software. In the process, sieve and focal majority tools were used to remove the small patches and to generalize the land boundaries. In this study, the patches with pixel counts smaller than 10 were eliminated. The focal window size was set to 7 × 7. Then, the simulated urban area was selected and converted to vector format using the same GIS software. The UGBs in 2030 are shown as examples to demonstrate the delineation results (Figure 6). If necessary, UGBs that meet the planning requirements can be established according to requirements of the planning period. Moreover, we can also establish the ecological and the agricultural space boundaries, which are considered as key steps in national territory spatial planning (NTSP), an effective way to help the central and local governments to make decision to achieve the sustainable development targets in region.
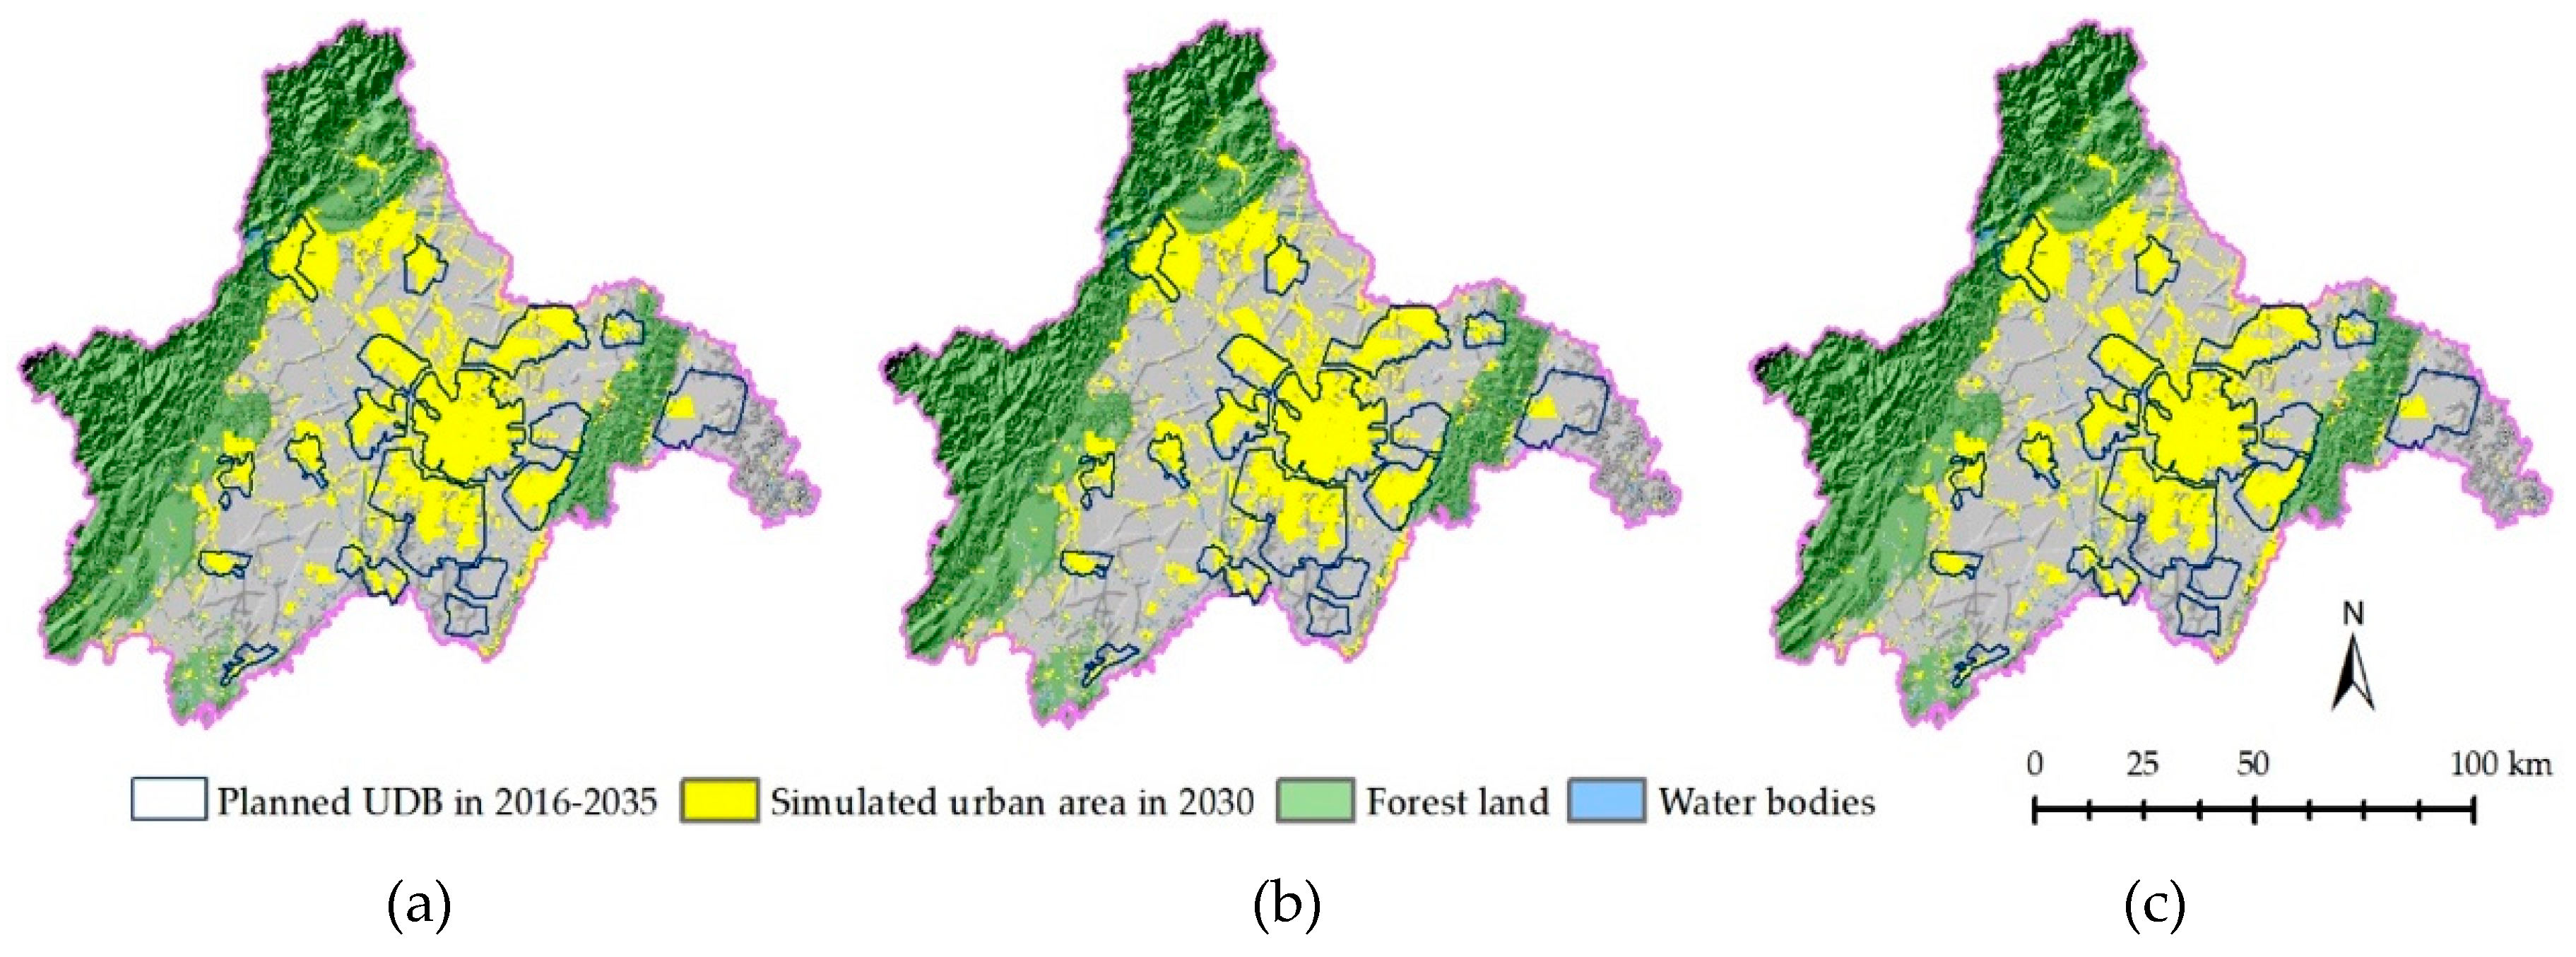
To illustrate the usability of the framework of integrated SD and CLUE-s model for UGBs delineation, we got the newest planned UDB of the study area for 2016–2035. Comparing the simulated urban area in 2030 with the planned UDB in 2035, we found that no matter which scenario simulation, it can basically reflect the main urban development direction in the study area. The difference between the two is mainly due to the fact that the former has a large development in Dujiangyan and Pengzhou in the Northwest of the study area, while the latter emphasizes the development to Jintang in the East, Jianyang in the southeast and Tianfu New District in the south (Figure 7). This is because in the process of UDB delineation, not only based on the objective conditional analysis, but also the analysis results must be appropriately adjusted according to the opinions of the governments and the public.

6. Conclusions and Discussion

The UGBs of Chengdu metropolis for base and future years were established in this study by integrating the SD and CLUE-s models, with support from remote sensing and GIS techniques. This method took the SD model’s advantage in population and land demand prediction under different macro-level policies with driving factors. These factors play key roles for urban development at a regional scale. The CLUE-s model’s advantage is to connect macro-level policies and micro-level pixel-based spatial factors [24,41]. These spatial factors were DEM, slope, soil, distance to city/town centers, distance to roads, and population density. We simulated the future spatial patterns of the land uses under three scenarios (i.e., a high-speed social-economic development scenario, a moderate social-economic development scenario and new normal social-economic development scenario) by using CLUE-s model and delimited the UGBs in GIS.
This method was successful in generating different urban spatial patterns under different socio-economic development scenarios. The results showed that this method was feasible to delineate UGBs and guide Chengdu’s major spatial development directions from Northwest to Southeast under three scenarios. This was consistent with the latest spatial planning of Chengdu. For population prediction using the SD model, the UGBs under three scenarios were similar, but there were some differences at certain locations. This study indicates that the method is a useful means for UGB delineation for regional and urban planning. The simulation processes are also useful for understanding Chengdu’s urban spatial development.
Subsequent research should consider as many restrictive factors as possible in the combined SD-CLUE-s model for UGBs delineation, i.e., nature reserves, national parks, permanent basic cropland, and red lines for ecological protection, etc. Also, more regional policies or specific local provisions should be considered for the linkage of population, land use, and land demand in the UGB simulation for useful insights into the intriguing balance between sustainable development’s social, economic, and environmental pillars. The delineation of the UGBs for metro Chengdu is based on the SD-CLUE-s model’s alternatives as to where urban growth should be encouraged or not permitted. The combined model framework can conveniently explore future urban growth patterns or multiple land use changes under various scenarios, especially if more detailed land-use sub-categories, economic sub-sectors, population sub-groups, and specific driving factors are used.
Finally, the combined model with its components may also be tested for other Chinese or international cases to further justify its applicability for UGB delineation beyond the Chengdu metro area. As the Chinese government vigorously promotes the national spatial planning of cities, this study provides a unique multi-model framework and insightful case study on UGB delineation for sustainable urban planning and development in China and beyond.

Author Contributions

Conceptualization, X.H., X.M. and G.S.; methodology, X.H.; writing—original draft preparation, X.H.; writing—review and editing, G.S., X.H. and X.M.; funding acquisition, X.M.

Funding

This research was funded by National Natural Science Foundation of China (51508484, 51178067).

Conflicts of Interest

The authors declare no conflict of interest.

References

  1. Baizhan, L.; Runming, Y. Urbanisation and its impact on building energy consumption and efficiency in China. Renew. Energy 2009, 34, 1994–1998. [Google Scholar]
  2. Liu, Y. Exploring the relationship between urbanization and energy consumption in China using ARDL (autoregressive distributed lag) and FDM (factor decomposition model). Energy 2009, 34, 1846–1854. [Google Scholar] [CrossRef]
  3. Trisurat, Y.; Alkemade, R.; Verburg, P.H. Projecting land-use change and its consequences for biodiversity in Northern Thailand. Environ. Manag. 2010, 45, 626–639. [Google Scholar] [CrossRef] [PubMed]
  4. Nelson, A.C.; Duncan, J.B. Growth Management Principles and Practices; Planners Press, American Planning Association: Chicago, IL, USA; Washington, DC, USA, 1995. [Google Scholar]
  5. Jun, M.J. The effects of Portland’s urban growth boundary on housing prices. J. Am. Plan. Assoc. 2006, 72, 239–243. [Google Scholar] [CrossRef]
  6. Liang, X.; Liu, X.; Li, X.; Chen, Y.; Tian, H.; Yao, Y. Delineating multi-scenario urban growth boundaries with a CA-based FLUS model and morphological method. Landsc. Urban Plan. 2018, 177, 47–63. [Google Scholar] [CrossRef]
  7. Long, Y.; Han, H.; Lai, S.-K.; Mao, Q. Urban growth boundaries of the Beijing Metropolitan Area: Comparison of simulation and artwork. Cities 2013, 31, 337–348. [Google Scholar] [CrossRef]
  8. Han, H.Y.; Lai, S.K.; Dang, A.R.; Tan, Z.B.; Wu, C.F. Effectiveness of urban construction boundaries in Beijing:an assessment. J. Zhejiang Univ. A 2009, 10, 1285–1295. [Google Scholar] [CrossRef]
  9. Li, X.; Gong, P. Urban growth models: Progress and perspective. Sci. Bull. 2016, 61, 1637–1650. [Google Scholar] [CrossRef]
  10. Ma, S.F.; Ai, B.; Ou, J. Spatial allocation of construction land with constrained cellular automata model. Sci. Geogr. Sin. 2013, 33, 1245–1251. [Google Scholar]
  11. Batty, M. Cellular automata and urban form: A primer. J. Am. Plan. Assoc. 1997, 63, 266–274. [Google Scholar] [CrossRef]
  12. Batty, M.; Xie, Y. Urban growth using cellular automata models. In GIS, Spatial Analysis, and Modeling; Maguire, D.J., Batty, M., Goodchild, M.F., Eds.; ESRI Press: Redlands, CA, USA, 2005; pp. 151–172. [Google Scholar]
  13. Batty, M.; Xie, Y.; Sun, Z. Modeling urban dynamics through GIS-based cellular automata. Comput. Environ. Urban Syst. 1999, 23, 205–233. [Google Scholar] [CrossRef] [Green Version]
  14. Batty, M. Cities and Complexity: Understanding Cities with Cellular Automata, Agent-Based Models, and Fractals; The MIT Press: Cambridge, MA, USA, 2007. [Google Scholar]
  15. Barros, J. Exploring urban dynamics in Latin American cities using an agent-based simulation approach. In Agent-Based Models of Geographical Systems; Springer: Dordrecht, The Netherlands, 2012; pp. 571–589. [Google Scholar]
  16. Barros, J.X. Urban Growth in Latin American Cities—Exploring Urban Dynamics through Agent-Based Simulation. Ph.D. Thesis, University of London, London, UK, 2004. [Google Scholar]
  17. Clarke, K.C.; Gaydos, L.J. Loose-coupling a cellular automaton model and GIS: Long-term urban growth prediction for San Francisco and Washington/Baltimore. Int. J. Geogr. Inf. Sci. 1998, 12, 699–714. [Google Scholar] [CrossRef] [PubMed]
  18. Verburg, P.H.; Soepboer, W.; Veldkamp, A.; Limpiada, R.; Espaldon, V.; Mastura, S.S. Modeling the spatial dynamics of regional land use: The CLUE-S model. Environ. Manag. 2002, 30, 391–405. [Google Scholar] [CrossRef] [PubMed]
  19. Pontius, R.G.; Cornell, J.D.; Hall, C.A. Modeling the spatial pattern of land-use change with GEOMOD2: Application and validation for Costa Rica. Agric. Ecosyst. Environ. 2001, 85, 191–203. [Google Scholar] [CrossRef]
  20. Long, Y.; Han, H.; Mao, Q. Establishing urban growth boundaries using constrained CA. J. Geogr. Sci. 2009, 64, 999–1008. [Google Scholar]
  21. Liu, J.; Zhang, G.; Zhuang, Z.; Cheng, Q.; Gao, Y.; Chen, T.; Huang, Q.; Xu, L.; Chen, D. A new perspective for urban development boundary delineation based on SLEUTH-InVEST model. Habitat Int. 2017, 70, 13–23. [Google Scholar] [CrossRef]
  22. Zheng, Q.; Yang, X.; Wang, K.; Huang, L.; Shahtahmassebi, A.; Gan, M.; Weston, M.; Zheng, Q.; Yang, X.; Wang, K.; et al. Delimiting urban growth boundary through combining land suitability evaluation and cellular automata. Sustainability 2017, 9, 2213. [Google Scholar] [CrossRef]
  23. Verburg, P.H.; van Berkel, D.B.; van Doorn, A.M.; van Eupen, M.; van den Heiligenberg, H.A. Trajectories of land use change in Europe: A model-based exploration of rural futures. Landsc. Ecol. 2010, 25, 217–232. [Google Scholar] [CrossRef]
  24. Verburg, P.H.; Overmars, K.P.; Milne, E.; Aspinall, R.J.; Veldkamp, T.A. Combining top-down and bottom-up dynamics in land use modeling: Exploring the future of abandoned farmlands in Europe with the Dyna-CLUE model. Landsc. Ecol. 2009, 24, 1167. [Google Scholar] [CrossRef]
  25. Wang, Y.; Li, X.; Zhang, Q.; Li, J.; Zhou, X. Projections of future land use changes: Multiple scenarios-based impacts analysis on ecosystem services for Wuhan city, China. Ecol. Indic. 2018, 94, 430–445. [Google Scholar] [CrossRef]
  26. Zhang, P.; Liu, Y.; Pan, Y.; Yu, Z. Land use pattern optimization based on CLUE-S and SWAT models for agricultural non-point source pollution control. Math. Comput. Model. 2013, 58, 588–595. [Google Scholar] [CrossRef]
  27. Castella, J.-C.C.; Verburg, P.H. Combination of process-oriented and pattern-oriented models of land-use change in a mountain area of Vietnam. Ecol. Model. 2007, 202, 410–420. [Google Scholar] [CrossRef]
  28. Trisurat, Y.; Eawpanich, P.; Kalliola, R. Integrating land use and climate change scenarios and models into assessment of forested watershed services in Southern Thailand. Environ. Res. 2016, 147, 611–620. [Google Scholar] [CrossRef] [PubMed]
  29. Henríquez-Dole, L.; Usón, T.J.; Vicuña, S.; Henríquez, C.; Gironás, J.; Meza, F. Integrating strategic land use planning in the construction of future land use scenarios and its performance: The Maipo River Basin, Chile. Land Use Policy 2018, 78, 353–366. [Google Scholar] [CrossRef]
  30. Zhou, R.; Zhang, H.; Ye, X.-Y.; Wang, X.-J.; Su, H.-L.; Zhou, R.; Zhang, H.; Ye, X.-Y.; Wang, X.-J.; Su, H.-L. The delimitation of urban growth boundaries using the CLUE-S land-use change model: Study on Xinzhuang Town, Changshu City, China. Sustainability 2016, 8, 1182. [Google Scholar] [CrossRef]
  31. Lee, S.Y. An integrated model of land use/transportation system performance: System dynamics modeling approach. Transp. Res. Part A 1997, 1, 79. [Google Scholar]
  32. Chengdu Bureau of Statistics; Chengdu Statistical Society; Chengdu Investigation Team of National Bureau of Statistics. Chengdu Statistical Yearbook; Peng, Y., Ed.; China Statistics Press: Beijing, China, 2016.
  33. He, X. The Study on Co-Evolution and Simulation of Population, Resouces, and Economy in Chengdu Metropolitan Area Based on GIS/RS; National Natural Science Foundation of China: Beijing, China, 2016.
  34. Veldkamp, A.; Fresco, L.O.O. CLUE-CR: An integrated multi-scale model to simulate land use change scenarios in Costa Rica. Ecol. Model. 1996, 91, 231–248. [Google Scholar] [CrossRef]
  35. Veldkamp, A.; Fresco, L.O. CLUE: A conceptual model to study the conversion of land use and its effects. Ecol. Model. 1996, 85, 253–270. [Google Scholar] [CrossRef]
  36. Liang, Y.J.; Xu, Z.M. An integrated analysis approach to LUCC at regional scale: A case study in the Ganzhou District of Zhangye City, China. Sci. Cold Arid Reg. 2012, 4, 320–329. [Google Scholar]
  37. Pontius, R.G., Jr. Statistical methods to partition effects of quantity and location during comparison of categorical maps at multiple resolutions. Photogramm. Eng. Remote Sens. 2002, 68, 1041–1050. [Google Scholar]
  38. Pontius, R.G.; Schneider, L.C. Land-cover change model validation by an ROC method for the Ipswich watershed, Massachusetts, USA. Agric. Ecosyst. Environ. 2001, 85, 239–248. [Google Scholar] [CrossRef]
  39. WU, G.P.; Zeng, Y.N.; Feng, X.Z.; Xiao, P.F.; Wang, K. Dynamic simulation of land use change based on the improved CLUE-S model: A case study of Yongding County, Zhangjiajie. Geogr. Res. 2010, 29, 460–470. [Google Scholar]
  40. Youjia, L.; Zhongmin, X.; Fanglei, Z. Land use scenario analyses by based on system dynamic model and CLUE-S model at regional scale: A case study of Ganzhou district of Zhangye city. Geogr. Res. 2011, 30, 564–576. [Google Scholar]
  41. Verburg, P.H.; Eickhout, B.; van Meijl, H. A multi-scale, multi-model approach for analyzing the future dynamics of European land use. Ann. Reg. Sci. 2008, 42, 57–77. [Google Scholar] [CrossRef]
Figure 1. The study area of Chengdu metropolitan area for UGBs delineation.
Sustainability 11 05919 g001
Figure 2. Land use maps of the study area in 2000, 2005, 2009, and 2013.
Sustainability 11 05919 g002
Figure 3. The relations and flows among different factors in the SD model.
Sustainability 11 05919 g003
Figure 4. Framework of integrated SD and CLUE-s model for UGBs delineation in the study area.
Sustainability 11 05919 g004
Figure 5. Urban growth simulation in the study area under (a) the high-speed social-economic development scenario (S1); (b) the moderate social-economic development scenario (S2); (c) the new normal social-economic development scenario (S3).
Sustainability 11 05919 g005
Figure 6. The UGBs for the study area under the three socio-economic development scenarios: (a) the high-speed social-economic development scenario (S1); (b) the moderate social-economic development scenario (S2); (c) the new normal social-economic development scenario (S3).
Sustainability 11 05919 g006
Figure 7. Comparison of the simulated urban area in 2030 with the planned UDB in 2016-2035 of the study area: (a) S1 with the planned UDB; (b) S2 with the planned UDB; (c) S3 with the planned UDB.
Sustainability 11 05919 g007
Table 1. The scenarios of socio-economic development in the study area.
Regional Factors2000–2013S1S2S3
Natural population growth rate (‰)1.721.51
GDP growth rate (%)13.413107
Fixed asset investment growth rate (%)20.11222015
Urbanization rate (%)69.4858280
Food self-sufficiency rate (%)59.27405550
Table 2. The simulation results verification of SD model in the study area (unit: km2).
Land Use Type200520092013
Actual ValuePredicted ValueErrorActual ValuePredicted ValueErrorActual ValuePredicted ValueError
Agricultural land64316403−0.44%600860120.06%548154980.30%
Forest land44,1844330.34%441444300.38%44274423−0.09%
Water bodies250249−0.40%1771791.13%219209−4.38%
Construction land9849971.32%14831461−1.51%19561952−0.22%
Table 3. The different land-use demands projection of every scenario in the study area (unit: km2).
BaseS1S2S3
Year2013202020252030202020252030202020252030
Agricultural land5481523251034999525451205013525051175010
Forest land4427440143954389440243954389440443984392
Water bodies219224228230226230232226229232
Construction land1956222623572464220123372448220223382449
Unused land38383838383838383838
Total areas12,12112,12112,12112,12112,12112,12112,12112,12112,12112,121