Article

Who Values Corporate Social Responsibility in the Korean Stock Market?

1
School of Business Administration, Soongsil University, 369 Sangdo-ro, Dongjak-gu, Seoul 06978, Korea
2
College of Business Administration, Kookmin University, 77, Jeongneung-ro, Seongbuk-gu, Seoul 02707, Korea
*
Author to whom correspondence should be addressed.
Sustainability 2019, 11(21), 5924; https://doi.org/10.3390/su11215924
Submission received: 20 September 2019 / Revised: 18 October 2019 / Accepted: 21 October 2019 / Published: 24 October 2019
(This article belongs to the Section Economic and Business Aspects of Sustainability)

Abstract

:
In this study, we explore the stock market’s response to new information that a firm has been included in the Dow Jones Sustainability Index (DJSI) in Korea. In addition, we investigate which investor group contributes to the changes, if any significant increase in returns is found, after a firm’s incorporation into the DJSI. This study aims to identify which investors value corporate social responsibility (CSR) in the Korean stock market and examine whether the government-led campaigns for CSR have affected private sector investors, as well as those from the public sector. We find statistically significant abnormal returns for firms after their first listing in the index, implying that investors in Korean markets consider a firm’s inclusion in the DJSI as good news for the firm value. Using a unique dataset from the Korea Exchange (KRX) on investors, we classify investors into four groups: individual investors, public pension funds, other institutional investors, and foreign investors. Unlike prior studies that focus only on the existence of abnormal returns, we investigate the trading behavior of each investor group for such announcements. We find that it is mainly the buying pressure of public pension funds that generates abnormal returns. By contrast, we cannot find statistically significant results for the other investor groups. This result implies that the government-led campaign for CSR has only had limited effects in the Korean stock market, and that awareness of CSR in the private sector should be improved.

1. Introduction

Over the past few decades, the importance of corporate sustainability, or corporate social responsibility (CSR) has increased not only in business but also in asset management in securities markets. There is no consensus on the concepts and categories that constitute CSR. Many researchers adopt Carroll’s [1] concept that CSR encompasses “the economic, legal, ethical, and discretionary expectations that society has of organizations.” Society expects firms to contribute to the realization of universal values, while also pursuing economic value. The question is whether CSR implementation is consistent with the firm’s primary goal of improving shareholder wealth and ultimately increasing firm value. Many empirical studies on the relationship between CSR and firm value report inconsistent results. Some studies report a positive relationship between CSR performance and firm value [2,3,4,5,6,7,8,9], while others find a negative [10,11,12,13] or irrelevant relationship [14,15,16].
As in Europe and North America, the importance of corporate sustainability has been increasing in Korea. Global Korean firms, conforming to global standards, have already adopted sustainable business practices as an integral element of their corporate strategies, regardless of the situation in Korea. Since the Korean government introduced “Green Growth”, as a new economic growth strategy in 2008, corporate sustainability has become well known, not only to companies but also to the general public. To implement its green growth strategy successfully, the Korean government has encouraged private enterprises to adopt corporate sustainability practices, and asked public pension funds, including the National Pension Fund that has about $600 billion in assets, to include corporate sustainability in their investment criteria for their asset management. However, it is not yet clear whether investors in the Korean stock market recognize CSR as a major screening criterion in their investments. Mentioned in the studies mentioned above, empirical research on the relationship between CSR and firm value in Korea shows inconsistent results. Several studies on Korean firms report a positive relationship [17,18], while others present a negative [19,20] or irrelevant relationship [21].
With this background, we pose two questions. First, how does the stock market respond to the information that a firm has been newly included in the DJSI in Korea? As we discussed above, it seems that the market responses to CSR performance are mixed in major markets. The second question is if we find any significant abnormal returns (ARs) for firms, which investors cause the increase in returns after the first inclusion in the CSR indices? We are especially interested in whether the abnormal returns, if there are any, are generated by public or private sector investors. We try to answer this question using a unique and detailed dataset on investor groups and their trading activities at the individual investor level offered by the Korea Exchange (KRX). If private sector investment contributions to abnormal returns are significant, we can agree that CSR is generally an important factor in investment criteria in the Korean stock market.
Several social rating agencies evaluate CSR performance and publish CSR indices or socially responsible investment (SRI) indices. SRI considers financial factors as well as the non-financial environment, social, and governance factors. CSR indices provide investors or fund managers with information about a firm’s CSR performance and help build CSR portfolios at a low cost. Several prior studies examine the effects of inclusion in CSR indices [22,23]. Consolandi et al. [22] and Curran and Moran [23] find positive abnormal returns for companies included in the Dow Jones Sustainability Stoxx Index (DJSSI) and in the FTSE4Good UK Index, respectively.
In our study, we use Korean firm data included in the various DJSIs: the DJSI World, DJSI Asia Pacific, and DJSI Korea. We first examine the stock price response to the announcement that the DJSI includes a firm listed in the Korean market for the first time. The DJSI World releases the changes in the list of companies in each index every September since it was first launched in 1999.
We find statistically significant abnormal returns for firms first included in DJSI World and DJSI Asia Pacific, however, no statistically significant abnormal returns for firms included in the DJSI Korea. We find no significant changes in the trading volumes and volatilities of the stock prices of the newly included firms, which can be factors of abnormal returns. These results imply that investors in the Korean market consider inclusion in the DJSI as good news for firm value, and increase their investment in those stocks.
Unlike prior studies, that focus only on the existence of abnormal returns, we investigate the trading behavior of each investor group for the CSR index announcements. We find that abnormal returns during the event window are mainly caused by the buying pressure of public pension funds. By contrast, we find no statistically significant results for the other investor groups. This result implies that the government-led campaign for CSR has only had limited effects in the Korean stock market and that private sector CSR awareness should be improved.
The remainder of this paper proceeds as follows. Section 2 reviews the literature on CSR. Section 3 describes our data and research methodology. Section 4 presents the descriptive statistics and the main results, and Section 5 concludes.

2. Literature Review and Hypotheses

We investigate whether the stocks of firms newly included in CSR stock indices generate better returns for the rest of the market. The existence of abnormal returns implies that CSR should be an important factor in business practices and a major investment criterion in Korea. CSR is a firm’s obligation to contribute to the universal goals and values of society. SRI considers these CSR activities when selecting a portfolio. In other words, SRI focuses its investment on firms that perform well in CSR. SRI has more limited asset selection than does conventional investment. Therefore, many researchers question whether SRI can outperform conventional investment despite these limitations. It seems that there is no consensus on the relationship between CSR and stock market performance yet.
Several studies find that SRI outperforms conventional investment [24,25,26,27,28,29]. Kempf and Osthoff [27] find that a trading strategy of going long in the equity portfolio with a high social responsibility score and short in the equity portfolio with a low social responsibility score leads to positive abnormal performance. Some studies comparing the performance of SRI funds and conventional mutual funds also confirm that SRI funds outperform general mutual funds [30,31,32]. Becchetti et al. [30] investigate the performance of socially responsible and conventional investment funds that are similar in terms of risk factors, and identify higher performance among SRI funds relative to conventional funds during the global financial crisis. They find that SRI funds play an “insurance role” during the 2007 global financial crisis.
Other studies argue that conventional investment outperforms SRI or SRI funds [33,34,35,36,37]. Leite and Cortez [34] find that French SRI funds underperform in comparison with conventional funds during non-crisis period, while the performances of the two funds are similar during market downturns. By contrast, many studies report that SRI has no significantly different performance from that of conventional investments or funds [38,39,40,41,42,43,44,45,46,47,48]. Bauer et al. [38] find no significant difference in a comparison of the risk-adjusted returns of 103 ethical mutual funds and conventional funds from the United States, the United Kingdom, and Germany. Hartzmark and Sussman [42] find evidence that investors marketwide value sustainability in the US mutual fund market, but do not find that high-sustainability funds outperform low-sustainability funds.
As an alternative to funds’ performance, several studies compare the performance of the CSR indices and benchmarks [49,50,51]. Lopez et al. [49] compare the performance of groups of firms included in the DJSI and those included in the Dow Jones Global Index (DJGI), which are not included in the DJSI, for 1998–2004, and find significant differences. They prove empirically that these performance differences are related to CSR practices. By contrast, Sliwinski and Lobza [50] find that investing in the CSR indices does not yield better results than investing in the respective conventional indices in the United States, Korea, and Poland.
Some studies focus on the stock price response to the announcements of the inclusion of firms in CSR indices [22,23], using event study techniques. Unlike studies comparing conventional funds and SRI funds, these studies agree that including CSR indices has positive effects on stock returns. Consolandi et al. [22] find statistically significant abnormal returns for companies included in the DJSSI from 2002 to 2006 and show empirically that inclusion in the CSR index positively affects stock prices. In an event study of companies included in the FTSE4Good UK Index, Curran and Moran [23] confirm the trend of accepting index inclusions (deletion) as positive (negative) in the market, but do not find statistical significance. Many studies investigate the relationship between CSR activities and corporate value in Korea [17,18,19,20,21]. Kim [17] finds that CSR activities are positively related to the corporate value. In a study comparing the KRX CSR index published by the KRX and the benchmark, Lee [18] reports that it outperforms the KOSPI200 benchmark, whereas Park [19] reports that these two indices do not have statistically significantly different performance. Similar to our study, in the literature on the effects of incorporating a CSR index, Park and Ok [20] reports that doing so has no effect on firm value, while Choi [21] reports that the CSR activities of firms lower capital costs.
In this study, we try to answer the fundamental question of whether CSR activities increase corporate value using Korean stock market data. More specifically, we investigate the effect of a firm’s inclusion in CSR indices on abnormal stock returns in the Korean stock market. In addition, unlike prior studies, we perform a detailed analysis on which investors generate the abnormal returns. This analysis may be useful for future policy to help promote corporate sustainability in Korea.
This study’s first hypothesis is that abnormal returns exist for Korean firms included in the CSR indices, as is the case with Consolandi et al. [22] and Curran and Moran [23], who find abnormal returns on European and U.K. companies included in the CSR indices, respectively.
Since introducing “Green Growth” as a new economic growth strategy, the Korean government has encouraged Korean firms and institutions to adopt sustainability practices. In particular, the Korean government has asked public pension funds, including the National Pension Fund, which is a dominant market participant in Korean stock market, to include corporate sustainability in their investment criteria for their asset management. Thus, it is expected that CSR is valued in Korean stock market and that news on inclusion in the CSR indices should generate abnormal returns.
The second hypothesis is related to which investor group contributes to abnormal returns. Public sector investors who are under the control of government are expected to use CSR as a major screening criterion in their investments, and to increase their investments in firms that are newly included in the CSR indices. Private sector investors such as individual investors, financial institutions and mutual funds are considered to pursue their profits over public interest. Therefore, it is not yet clear whether private sector investors recognize CSR as a major screening criterion in their investments. Our second hypothesis is that private as well as public sector investors value CSR in the Korean stock market.

3. Data and Methodology

3.1. The Unique KRX Dataset

This study examines whether CSR is recognized as a significant factor of firm value in the Korean stock market. We perform event study tests to find abnormal returns around the announcement of index inclusions. In addition, we investigate changes in the trading behavior of market participants to identify which investors value CSR.
For this study, we use a unique data set from the KRX. Unlike other major exchanges, the KRX offers a detailed dataset on investors. The KRX originally classifies investors into 11 groups and provides daily buying and selling data for each group for individual stocks. In general, these investor groups include the broad categories of individual, institutional, and foreign investors. While individual investors are mostly retail investors from the private sector, institutional investors include those from both the public and private sectors. To identify the influence of the government and the behavior of private sector investors, we classify institutional investors into two groups: public pension funds and other institutional investors. Public pension funds include government-related or government-funded investors such as the National Pension Fund, Government Employees Pension Fund, and Teachers Pension Fund. These funds are under the strong influence of government policy. Other institutional investors are investor groups from the private sector whose primary goal for investments is higher returns, and we consider these groups to be under less influence from other factors, including government policy. This group includes mutual funds, commercial and investment banks, and insurance companies.
In general, individual investors in the Korean stock market are considered noise traders who make investment decisions for short-term profits on speculative motivation, while institutional investors are long-term informed traders who trade based on information about firm value. In short, we reclassify investors into four groups: individual investors, public pension funds, other institutional investors, and foreign investors. With this dataset, we can identify investor groups with net buying or net selling around events in the stock market, and which investors contribute to abnormal returns. We collect the daily stock price data of individual firms and the trading data of each investor group from DataGuide, an electronic database in Korea.
Among the DJSI family, Korean firms are included in the DJSI World, DJSI Asia-Pacific, and DJSI Korea. We analyze Korean firms newly included in the three indices from 2009 to 2018. The DJSI World evaluates the top 2500 global firms in the current market value ranking and selects the top groups with high sustainability performance in each industry. The DJSI Asia-Pacific screens the top 600 firms in the Asia-Pacific region, and the DJSI Korea screens the top 200 firms in Korea. In 2009, in response to corporate interests and the social demand for sustainability management, the Korea Productivity Center developed and announced the DJSI Korea in collaboration with the S&P Dow Jones Indices and RobecoSAM.
Table 1 reports the number of Korean firms included in the DJSI World, DJSI Asia Pacific, and DJSI Korea from 2009 to 2018. The number of Korean firms included in the DJSI World during 1999–2008 is only 0–3; therefore, the period for the empirical analysis is from 2009, when all three indices existed. The number of firms newly included in the DJSI World is 37, while for DJSI Asia Pacific and DJSI Korea, we have 52 and 85, respectively. We obtained the list of firms in the DJSI from the RobecoSAM website [52].

3.2. Methodology

Using an event study, we examine the stock price response to news of a firm’s inclusion in the DJSI. An event study is a useful method to measure the effect of new information on firm value or stock price. We also investigate the changes in the risk or liquidity of the stocks newly included in the DJSI, which may be the factors generating the abnormal returns. Finally, we analyze investors’ trading behavior to determine which investor groups value CSR in their investments.

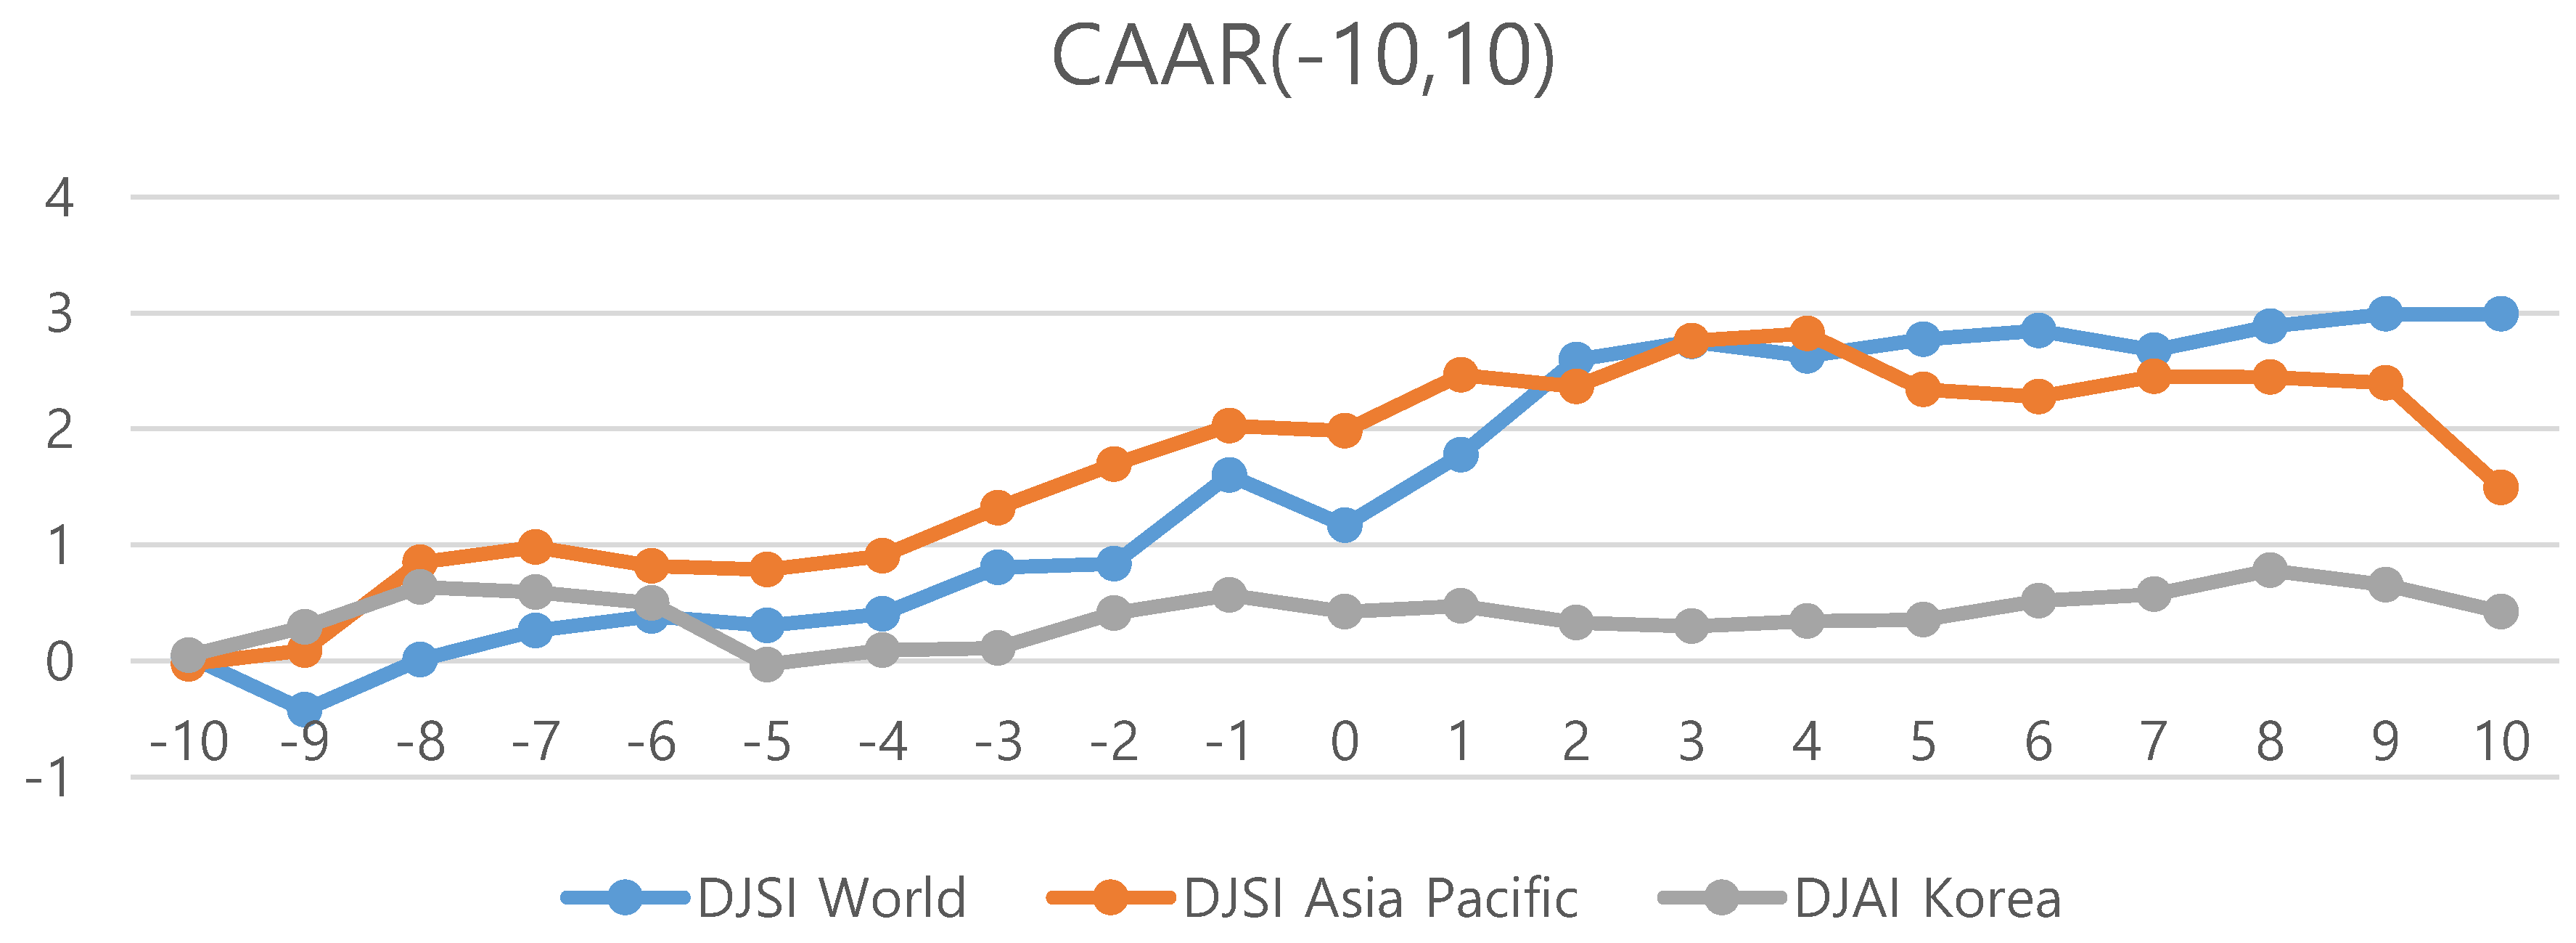
3.2.1. Estimation of Abnormal Returns

If the announcement that a company is included in the CSR index is good news, then this information will have a positive effect on stock prices. We estimate abnormal returns (AR) of stocks newly incorporated in the DJSI for the period 2009–2018. We calculate the AR as the difference between the actual and expected returns:
A R i , t = R i , t E ( R i , t ) ,
where R i , t is the actual return for stock i on day t , E ( R i , t ) is the expected return for stock i on day t. We calculate E ( R i , t ) using the market model of Brown and Warner [53], as follows:
E ( R i , t ) = ( α ^ i + β ^ i R m , t ) ,
where R m , t is the market return on day t , and α ^ i and β ^ i are the coefficients estimated through an ordinary least squares OLS regression model. The parameter estimation period for α ^ i and β ^ i is from 100 days before the announcement date (AD) to 10 days before the AD based on the DJSI AD.
Next, we calculate the average abnormal return (AAR), and the cumulative average abnormal return (CAAR) by summing up the AARs over the event window:
A A R t = ( 1 n ) i = 1 n A R i , t
C A A R ( t 1 , t 2 ) = t = t 1 t 2 A A R t .

3.2.2. Measuring Changes in Risk and Liquidity

In general, changes in risk or liquidity of an asset result in changes in returns. First, we examine whether there are changes in risk after inclusion in the indices, which may be sources for AR. We use standard deviation (SD) of the rate of return as a measure of risk. Next, we examine whether changes in trading volume affect the AR of Korean firms newly included in the DJSI. According to the improved liquidity hypothesis, stocks included in the index are more liquid and have lower transaction costs due to smaller bid-ask spreads. Thus, investors prefer stocks that are included in the index, causing stock prices to rise [54]. We analyze whether the increase in trading volume affects the stock prices of the companies newly included in the DJSI using the abnormal volume ( A V i t ), as in Harris and Gurel [55] and Hedge and McDermott [56]. A V i t represents the relative trading strength of the event period compared to the past trading strength. A V i t is:
A V i t = V i t V m t × V m V i ,
where V i and V m are the average trading volumes of stock i . and of the total KOSPI between 100 and 10 days preceding the AD. V i t and V m t are the trading volumes of stock i and of the total KOSPI in event period t . The average abnormal volume ( A A V t ) in the event time period t is:
A A V t = ( 1 n ) i = 1 n A V i , t .

3.2.3. Analysis of Investors’ Trading Behavior

To determine which investor’s trading activities are responsible for ARs, we calculate the net buying ratio (NBR) for each investor group. We compute the NBR of each investor group at time t by the net purchase volume as a percentage of the total trading volume:
N B R _ I N V E S T O R = B i t S i t B i t + S i t ,
where B i t is the number of purchases of stock i on day t , and S i t is the number of sales of stock i on day t . We also calculate and plot the cumulative NBR for a certain period to determine which investors purchase stocks that are newly included in the indices and cause the increases in stock prices.
In addition, we perform a multiple regression analysis to verify the results. We regress the cumulative abnormal returns (CAR) on the NBR of each investor. To solve the multicollinearity problem and to choose the optimal regression models, we use a stepwise regression [57]. Because the sum of the cumulative NBRs for all investor groups should be zero, we cannot use all of the cumulative NBRs as independent variables in the regression analysis.
Our basic regression model is:
C A R i ( t 1 , t 2 ) = β 0 + j = 1 k β j N B R _ I N V E S T O R j + ε ,
where C A R i ( t 1 , t 2 ) is the sum of the AR on stock i from t 1 to t 2 and N B R _ I N V S T O R j is the cumulative NBR of investor group j from t 1 to t 2 . K is the number of investor groups in the model. Note that k should be less than four because of the multicollinearity problem.

4. Empirical Results

4.1. Effects of Inclusion in CSR Indices

Using an event study, we investigate the stock price movement around the AD of firms newly included in the DJSI. Figure 1 shows the CAARs around the DJSI announcement. We examine the cumulative average abnormal returns (CAAR) with the event window for AD −10 to AD +10 to observe the behavior of ARs. The blue, red, and gray colors in the image correspond to the DJSI World, DJSI Asia Pacific, and DJSI Korea, respectively. The CAARs for the DJSI World and DJSI Asia Pacific increase from AD −4 to AD +3, meaning that news about inclusion in these indices has a positive influence on the stock prices. The CARR for DJSI Korea is also positive, even though it is lower than that of the other two indices.
We empirically examine the CAAR with various event windows and test the statistical significance of each CAAR. Table 2 reports the descriptive statistics on the CAAR for Korean companies included in the DJSI. We analyze the CAAR separately for the DJSI World, DJSI Asia Pacific, and DJSI Korea. Panel A reports the event window for AD −10 to +10 (as in Figure 1) and Panel B reports the event window for the AD when the CAAR rises in Figure 1. CAAR (−10,10) shows positive values for all companies included in all three indices, but only the DJSI World is statistically significant. By contrast, CAAR (−4,3) indicates statistically significant values for companies included in the DJSI World and DJSI Asia Pacific. These results are consistent with Consolandi et al. [17] and Curran and Moran [18]. The CAAR (−4,3) of companies included in the DJSI Korea shows positive values but is not statistically significant.

4.2. Changes in Risk and Liquidity

To determine the factors that affect the ARs of companies included in the DJSI, we examine the changes in risk and liquidity before and after inclusion in the indices. We divide the event window into the periods AD −4 to −1 and AD 0 to +3. Table 3 reports the standard deviation (SD) of stock prices and average abnormal volume (AAV) for the stocks of Korean companies included in the DJSI from 2009 to 2018. We use the SD to determine whether there are changes in the risk, and the AAV (as in Equation (6)) to determine whether there are changes in the liquidity. We compare the SDs of the two sub-periods, and the results of the F-test show no statistically significant difference in all three indices. In the t-tests comparing the AAVs of each period, we also find no significant difference. We confirm that the risk and liquidity of the stocks of firms included in the DJSI do not change after the announcement and that these factors do not affect the stock prices of the corresponding firms.

4.3. Trading Activities of Investor Groups

In this section, we explore the relationship between the trading activities of each investor group and the ARs. In the previous section, we confirmed that investors accept inclusion in CSR indices as good news and therefore, the CAARs are positive in the Korean market. This also implies that the buying pressure for the newly included stocks is higher in the market. More specifically, we examine which investor group actively buys the stocks of firms newly included in the CSR indices and therefore, which investor group values CSR in the Korean market.
We estimate the cumulative NBR by investor group for the period from 4 days before AD to 3 days after a firm is included in the DJSI. We calculate the NBR as the net purchase volume as a percent of the total trading volume for each investor group. Figure 2 shows the CAAR and cumulative NBR of each of the four investor groups for the companies included in the DJSI World, Asia Pacific, and Korea. In the DJSI World of Figure 2, the cumulative NBRs of public pension funds, other institutional, and foreign investors during the period are positive, while that of individual investors is negative. Notably, the NBR for public pension funds is the highest. In the DJSI Asia Pacific, the cumulative NBRs of public pension funds and foreign investors are positive, while the cumulative NBRs of public pension funds and other institutional investors are positive in the DJSI Korea. Common to all three indices, the cumulative NBR of public pension funds is positive, while that of individual investors is negative. Figure 2 shows that the trends of public pension funds are most similar to those of the CAARs.
Table 4 reports the descriptive statistics for the cumulative NBR by investor group for the stocks of firms included in the three DJSI indices. The NBR of public pension funds is positive for all three indices, while that of individual investors shows negative values for all three. This result indicates that in the Korean market public pension funds actively buy the stocks of firms included in the CSR indices, while individual investors tend to sell them.
Using a regression model with CAR as a dependent variable, and the NBRs as independent variables, we examine the effects of each investor group on the ARs. We analyze the correlations to see how CAR moves with the NBR of each investor group. Table 5 reports the correlations between CAR and the NBR for each investor group. The correlation results indicate a positive association between CAR and the NBR of public pension funds and other institutional investors for all three indices, whereas we find a negative association with the NBR of individual investors.
Table 6 reports the results of regressing CAR on the NBR of each investor group. To minimize multicollinearity and to determine the optimal model, we use stepwise regression. For the DJSI World, one independent variable, the NBR of individual investors, is eliminated. For the DJSI Asia Pacific and DJSI Korea, two independent variables, the NBRs of individual and other institutional investors, are removed.
The coefficients of the NBR of public pension funds are positive for all DJSI indices, which means that the trading activities of public pension funds have a positive effect on the stock prices of firms included in the DJSI. However, only the coefficient for the DJSI Korea is statistically significant. We have already identified in Table 4 that public pension funds consistently show positive NBRs for all DJSI indices. In addition, the correlation results in Table 5 indicate a positive association between CAR and the NBR of public pension funds for all three indices. Although not statistically significant in all indices, the results in Table 4, Table 5, and Table 6 suggest that trading activities have a positive effect on the stock prices of firms included in the DJSI.
By contrast, the coefficients of the NBR of foreign investors show positive values for all DJSI indices, but without any statistical significance. In Table 4, the signs of NBRs for foreign investors do not show consistency. This implies that, in general, foreign investors do not value CSR in their investments. This may be because a foreign investor group consists of heterogeneous investors. The foreign investor category of the KRX includes not only long-term pension funds but also short-term speculative investors whose primary goal is only short-term profit. The individual investor group is not selected as an independent variable in all stepwise regression models, which implies that individual investors’ trading has little relationship with the price movement of newly included stocks and they don’t value CSR either. In addition, the cumulative NBRs for individual investors are negative.
Summarizing the empirical results, we observe significant ARs for Korean firms incorporated in the DJSI around the AD, which are due mainly to the trading activities of public pension funds, and individual investors have a negative or negligible contribution.

5. Conclusions

Over the last decade, the importance of corporate sustainability has increased significantly in Korea. The Korean government has emphasized the “Green Growth” policy as a new economic development strategy and encouraged stock market participants to include corporate sustainability in their investment criteria. Given this situation, it is worth investigating whether investors in the Korean stock market value corporate sustainability.
This study first examines the stock price response of firms in the Korean market at their first inclusion in a CSR index. Using the DJSI World, DJSI Asia Pacific, and DJSI Korea, we confirm that significant abnormal returns exist in stocks after they are first included in the CSR indices. To eliminate the effects of other market factors on stock returns, we examine whether there are any changes in risk or liquidity for such stocks, and find no significant changes. These results mean that corporate sustainability is positively and significantly valued in the Korean stock market. This is consistent with the results of Consolandi et al. [17] and Curran and Moran [18] that find positive abnormal returns on companies included in CSR indices for European and UK companies, respectively. In particular, Consolandi et al. [17] suggest that the evaluation of CSR performance is a significant criterion for asset allocation activities.
Furthermore, we identify which investors are responsible for the increase in stock prices by investigating investors’ daily trading activities. Using investors’ daily trading data, we categorize investors into four groups: individual investors, public pension funds, other institutional investors, and foreign investors. We find that public pension funds are more active in buying the stocks of firms newly included in the DJSI, and therefore contribute to abnormal returns. Meanwhile, other investor groups, especially, individual investors, show little or no interest in CSR performance. No previous study has analyzed abnormal returns in terms of trading behaviors by investors’ types. This study contributes to the existing literature by confirming that abnormal returns of firms incorporated in the CSR index in Korea are largely due to the trading activities of public sector investors.
Nevertheless, some limitations still remain in this study. Existing studies investigating abnormal returns for firms included in the CSR indices comprehensively accept a firm’s inclusion in a CSR index as a measure of high CSR performance. However, questions on the reliability of CSR indices have been raised continuously. Recently, Arribas et al. [57] report that socially irresponsible companies are included in sustainable stock indices. Thus, the existence of abnormal returns in the stocks of Korean firms incorporated in DJSI may not guarantee the fact that firms with high CSR performance have higher returns. Therefore, further study is needed to verify whether the CSR performance of a firm is correctly valued in the stock market, using various measures for CSR performance.
To summarize the results, the participants in the Korean stock market in general place a high value on the CSR performance of a company; however, investors from the private sector, such as individual investors, mutual funds and financial institutions do not consider CSR as an important factor in investment yet. This suggests that Korea requires further efforts to promote CSR.

Author Contributions

The authors contributed to this paper as follows. Conceptualization, S.L.; software, I.K.; formal analysis, I.K.; investigation, S.L.; data curation, I.K.; methodology, S.L.; writing—original draft preparation, S.L.; visualization, I.K.; validation, C.-h.H.; writing—review and editing, C.-h.H.; supervision, C.-h.H.; project administration, C.-h.H.

Funding

This research received no external funding.

Conflicts of Interest

The authors declare no conflict of interest.

References

  1. Carroll, A.B. A Three-Dimensional Conceptual Model of Corporate Performance. Acad. Manag. Rev. 1979, 4, 497–505. [Google Scholar] [CrossRef]
  2. Brown, W.; Helland, E.; Smith, J. Corporate Philanthropic Practices. J. Corp. Financ. 2006, 12, 855–877. [Google Scholar] [CrossRef]
  3. Carini, C.; Comincioli, N.; Poddi, L.; Vergalli, S. Measure the Performance with the Market Value Added: Evidence from C SR Companies. Sustainability 2017, 9, 2171. [Google Scholar] [CrossRef]
  4. Cochran, P.L.; Wood, R.A. Corporate Social Responsibility and Financial Performance. Acad. Manag. J. 1984, 27, 42–56. [Google Scholar]
  5. Goyal, A. Corporate Social Responsibility as a Signaling Device for FDI. Int. J. Econ. Bus. 2006, 13, 145–163. [Google Scholar] [CrossRef]
  6. Herremans, I.; Akathaporn, P.; McInnes, M. An Investigation of Corporate Social Responsibility Reputation and Economic Performance. Account. Organ. Soc. 1993, 18, 587–604. [Google Scholar] [CrossRef]
  7. Malik, M. Value-enhancing capabilities of CSR: A brief review of contemporary literature. J. Bus. Ethics 2015, 127, 419–438. [Google Scholar] [CrossRef]
  8. Pava, M.; Krausz, J. The association between corporate social responsibility and financial performance: The paradox of social cost. J. Bus. Ethics 1996, 15, 321–357. [Google Scholar] [CrossRef]
  9. Richardson, A.J.; Welker, M. Social disclosure, financial disclosure and the cost of equity capital. Account. Organ. Soc. 2001, 26, 597–616. [Google Scholar] [CrossRef]
  10. Aupperle, K.E.; Carroll, A.B.; Hatfield, J.D. An Empirical Examination of the Relationship between Corporate Social Responsibility and Profitability. Acad. Manag. J. 1985, 28, 446–463. [Google Scholar]
  11. Brammer, S.; Brooks, C.; Pavelin, S. Corporate Social Performance and Stock Returns. Financ. Manag. 2005, 35, 97–116. [Google Scholar] [CrossRef]
  12. Langbein, J.; Posner, R. Social Investing and the Law of Trusts. Mich. Law Rev. 1980, 79, 72–112. [Google Scholar] [CrossRef]
  13. Wright, P.; Ferris, S. Agency Conflict and Corporate Strategy: The Effect of Divestment on Corporate Value. Strateg. Manag. J. 1997, 18, 77–83. [Google Scholar] [CrossRef]
  14. Alexander, G.J.; Buchholz, R.A. Corporate Social Responsibility and StockMarket Performance. Acad. Manag. J. 1978, 21, 479–486. [Google Scholar]
  15. Griffin, J.J.; Mahon, J.F. The corporate social performance and corporate financial performance debate: Twenty-five years of incomparable research. Bus. Soc. 1997, 36, 5–31. [Google Scholar] [CrossRef]
  16. Teoh, S.H.; Welch, I.; Wazzan, C.P. The Effect of Socially Activist Investment Policies on the Financial Markets: Evidence from the South African Boycott. J. Bus. 1999, 72, 35–89. [Google Scholar] [CrossRef] [Green Version]
  17. Kim, C. Corporate Social Responsibility and Corporate Value. Korea Secur. Assoc. 2009, 38, 507–545. [Google Scholar]
  18. Lee, S. Analysis of Performance of SRI index. Korean J. Financ. Eng. 2011, 10, 123–140. [Google Scholar]
  19. Park, J. Performance of SRI in the Korean stock market: With focus on KRX SRI Index. Int. Area Stud. Rev. 2013, 17, 267–288. [Google Scholar] [CrossRef]
  20. Park, J.; Ok, Y. Influence of Incorporation into the KRX SRI Eco on Corporate Value. Logos Manag. Stud. 2013, 11, 17–36. [Google Scholar]
  21. Choi, M. Relation between Corporate Social Responsibility, Governance Structure, and Cost of Capital. Korea Int. Account. Assoc. 2013, 51, 335–356. [Google Scholar]
  22. Consolandi, C.; Jaiswal-Dale, A.; Poggiani, E.; Vercelli, A. Global Standards and Ethical Stock Indexes: The Case of the Dow Jones Sustainability SToxx Index. J. Bus. Ethics 2009, 87, 185–197. [Google Scholar] [CrossRef]
  23. Curran, M.; Moran, D. Impact of the FTSEGood Index on firm price: An event study. J. Environ. Manag. 2007, 82, 529–537. [Google Scholar] [CrossRef]
  24. Bertrand, P.; Lapointe, V. How performance of risk-based strategies is modified by socially responsible investment universe? Int. Rev. Financ. Anal. 2014, 38, 175–190. [Google Scholar] [CrossRef]
  25. Brzeszczynski, J.; McIntosh, G. Performance of portfolios composed of British SRI stocks. J. Bus. Ethics 2014, 120, 335–362. [Google Scholar] [CrossRef]
  26. Eccles, R.G.; Ioannou, I.; Serafeim, G. The impact of corporate sustainability on organizational processes and performance. Manag. Sci. 2014, 60, 2835–2857. [Google Scholar] [CrossRef]
  27. Kempf, A.; Osthoff, P. The effect of socially responsible investing on portfolio performance. Eur. Financ. Manag. 2007, 13, 908–922. [Google Scholar] [CrossRef]
  28. Kim, Y.; Li, H.; Li, S. Corporate Social Responsibility and Stock Price Crash Risk. J. Bank. Financ. 2014, 65, 1–13. [Google Scholar] [CrossRef]
  29. Lean, H.H.; Ang, W.R.; Smyth, R. Performance and performance persistence of socially responsible investment funds in Europe and North America. N. Am. J. Econ. Financ. 2015, 34, 254–266. [Google Scholar] [CrossRef] [Green Version]
  30. Becchetti, L.; Ciciretti, R.; Dalo, A.; Herzel, S. Socially responsible and conventional investment funds: Performance comparison and the global financial crisis. Appl. Econ. 2015, 47, 2541–2562. [Google Scholar] [CrossRef]
  31. Henke, H. The effect of social screening on bond mutual fund performance. J. Bank. Financ. 2016, 67, 69–84. [Google Scholar] [CrossRef]
  32. Nakai, M.; Yamaguchi, K.; Takeuchi, K. Can SRI funds better resist global financial crisis? Evidence from Japan. Int. Rev. Financ. Anal. 2016, 48, 12–20. [Google Scholar] [CrossRef] [Green Version]
  33. Capelle-Blancard, G.; Monjon, S. The performance of socially responsible funds: Does the screening process matter? Eur. Financ. Manag. 2014, 20, 494–520. [Google Scholar] [CrossRef]
  34. Leite, P.; Cortez, M. Performance of European socially responsible funds during market crises: Evidence from France. Int. Rev. Financ. Anal. 2015, 40, 132–141. [Google Scholar] [CrossRef]
  35. Lesser, K.; Rößle, F.; Walkshäusl, C. Socially responsible, green, and faith-based investment strategies: Screening activity matters! Financ. Res. Lett. 2016, 16, 171–178. [Google Scholar] [CrossRef]
  36. Nainggolan, Y.; How, J.; Verhoeven, P. Ethical screening and financial performance: The case of Islamic equity funds. J. Bus. Ethics 2016, 137, 83–99. [Google Scholar] [CrossRef]
  37. Trinks, P.J.; Scholtens, B. The opportunity cost of negative screening in socially responsible investing. J. Bus. Ethics 2017, 140, 193–208. [Google Scholar] [CrossRef]
  38. Auer, B. Do socially responsible investment policies add or destroy European stock portfolio value? J. Bus. Ethics 2016, 135, 381–397. [Google Scholar] [CrossRef]
  39. Bauer, R.; Koedijk, K.; Otten, R. International evidence on ethical mutual fund performance and investment style. J. Bank. Financ. 2005, 29, 1751–1767. [Google Scholar] [CrossRef] [Green Version]
  40. Bauer, R.; Otten, R.; Rad, A. Ethical Investing in Australia: Is There a Financial Penalty? Pac. Basin Finance J. 2006, 14, 33–48. [Google Scholar] [CrossRef]
  41. Diltz, J.D. Does Social Screening Affect Portfolio Performance? J. Invest. 1995, 4, 64–69. [Google Scholar] [CrossRef]
  42. Hartzmark, S.; Sussman, A. Do Investors Value Sustainability? A Natural Experiment Examining Ranking and Fund Flows. J. Financ. 2019, 74. in press. [Google Scholar] [CrossRef]
  43. Ibikunle, G.; Steffen, T. European green mutual fund performance: A comparative analysis with their conventional and black peers. J. Bus. Ethics 2017, 145, 337–355. [Google Scholar] [CrossRef]
  44. Nofsinger, J.; Varma, A. Socially responsible funds and market crises. J. Bank. Financ. 2014, 48, 180–193. [Google Scholar] [CrossRef]
  45. Reddy, K.; Mirza, N.; Naqvi, B.; Fu, M. Comparative risk adjusted performance of Islamic, socially responsible and conventional funds: Evidence from United Kingdom. Econ. Model. 2017, 66, 233–243. [Google Scholar] [CrossRef]
  46. Revelli, C.; Viviani, J.L. Financial performance of socially responsible investing (SRI): What have we learned? A meta-analysis. Bus. Ethics Eur. Rev. 2015, 24, 158–185. [Google Scholar] [CrossRef]
  47. Statman, M. Socially Responsible Mutual Funds. Financ. Anal. J. 2000, 56, 30–39. [Google Scholar] [CrossRef]
  48. Xiao, Y.; Faff, R.; Gharghori, P. The financial performance of socially responsible investments: Insights from the Intertemporal CAPM. J. Bus. Ethics 2017, 146, 353–364. [Google Scholar] [CrossRef]
  49. Lopez, V.A.; Garcia, A.; Rodriguez, L. Sustainable Development and Corporate Performance: A study Based on the Dow Jones Sustainability Index. J. Bus. Ethics 2007, 75, 285–300. [Google Scholar] [CrossRef]
  50. Sliwinski, P.; Lobza, M. Financial performance of socially responsible indices. Int. J. Manag. Econ. 2017, 53, 25–46. [Google Scholar] [CrossRef]
  51. Pizzutilo, F. Measuring the under-diversification of socially responsible investments. Appl. Econ. Lett. 2017, 24, 1005–1018. [Google Scholar] [CrossRef]
  52. RobecoSAM Home Page. Available online: https://www.robecosam.com/csa/indices/djsi-index-family.html (accessed on 25 June 2019).
  53. Brown, S.; Warner, J. Using daily stock returns: The case of event studies. J. Financ. Econ. 1985, 14, 3–31. [Google Scholar] [CrossRef]
  54. Amihud, Y.; Mendelson, H. Asset Pricing and the Bid-Ask Spread. J. Financ. Econ. 1986, 17, 223–249. [Google Scholar] [CrossRef]
  55. Harris, l.; Gurel, E. Price and Volume Effects Associated with Changes in the S&P 500 List: New Evidence for the Existence of Price Pressures. J. Financ. 1986, 41, 815–829. [Google Scholar]
  56. Hedge, S.; McDermott, J. The Liquidity Effects of Revisions to the S&P 500 Index: An Empirical Analysis. J. Financ. Mark. 2003, 6, 413–459. [Google Scholar]
  57. Bendel, R.; Afifi, A. Comparison of Stopping Rules in Forward “Stepwise” Regression. J. Am. Stat. Assoc. 1977, 72, 46–53. [Google Scholar]
Figure 1. Cumulative Average Abnormal Return of firms included in the Dow Jones Sustainability Index (DJSI).
Sustainability 11 05924 g001
Figure 2. Cumulative average abnormal returns and cumulative net buying ratio for the DJSI World, DJSI Asia Pacific, and DJSI Korea (AD −4:AD +3).
Sustainability 11 05924 g002
Table 1. Number of Korean firms included in or excluded from the Dow Jones Sustainability Index (DJSI) World, DJSI Asia Pacific, and DJSI Korea (2009–2018).
YearDJSI WorldDJSI Asia-PacificDJSI Korea
InclusionExclusionNInclusionExclusionNInclusionExclusionN
200930613-1341-41
201080141612810249
2011201642309652
2012411930333352
2013402381405453
2014232232416554
2015122133416852
2016552125382945
2017312321396645
2018252004352839
Table 2. The cumulative average abnormal returns (CAAR) of Korean firms newly included in the DJSI (2009–2018).
IndexNMeanSDMax.Min.
Panel A: CAAR (−10,10)
DJSI World332.9901
(1.83) *
9.373531.9517−15.0899
DJSI Asia Pacific521.4951
(1.12)
9.653420.5259−24.3613
DJSI Korea850.4259
(0.38)
10.201138.7370−21.1914
Panel B: CAAR (−4,3)
DJSI World332.2944
(2.66) **
4.961314.1051−5.3946
DJSI Asia Pacific521.9735
(2.44) **
5.830514.2862−13.0974
DJSI Korea850.3280
(0.47)
6.333422.4571−30.6823
Note: The numbers in parentheses are the t-values and SD refers to the standard deviations of the CAAR. * and ** denote statistical significance at the 10% and 5% levels, respectively.
Table 3. Standard Deviation (SD) and Average Abnormal Volume (AAV) of Korean firms newly included in the DJSI (2009–2018).
IndexEvent WindowSDF-StatisticAAVt-Statistic
DJSI WorldAD −4~−12.07211.130.96530.18
AD 0~+32.20340.9520
DJSI Asia PacificAD −4~−12.62541.071.0496−1.28
AD 0~+32.71951.1434
DJSI KoreaAD −4~−12.48631.111.03650.92
AD 0~+32.35590.9873
Note: SD refers to the standard deviations of stock prices and AAV is the average abnormal volume of the stocks of Korean firms included in the DJSI for each event window.
Table 4. Descriptive statistics: Cumulative net buying ratio.
IndexVariableNMeanSDMAXMIN
DJSI WorldNBR_Indi33−0.11390.20470.2194−0.5683
NBR_Fore330.01910.20520.5560−0.2970
NBR_ Inst p e n s i o n 330.12010.4733DJSI World−0.8600
NBR_ Inst o t h e r 330.04080.22980.7645−0.2959
DJSI Asia PacificNBR_Indi52−0.07660.17720.3142−0.5104
NBR_Fore520.04030.23290.5560−0.4709
NBR_ Inst p e n s i o n 520.06440.46970.8889−0.8600
NBR_ Inst o t h e r 52−0.00290.20640.4471−0.5351
DJSI KoreaNBR_Indi85−0.03360.15970.4349−0.4257
NBR_Fore85−0.00410.24930.7343−0.6529
NBR_ Inst p e n s i o n 850.02870.53440.9735−1.0000
NBR_ Inst o t h e r 850.03830.25230.7902−0.6089
Note: NBR_Indi, NBR_Fore, NBR_ Inst p e n s i o n , and NBR_ Inst o t h e r are the cumulative net buying ratios for individual, foreign, public pension funds, and other institutional investors, respectively, for stock i over the event window.
Table 5. Correlations.
VariableDJSI WorldDJSI Asia PacificDJSI Korea
CARCARCAR
CAR111
NBR_Indi−0.3076 *−0.4408 ***−0.5349 ***
NBR_Fore0.0197−0.03890.0725
NBR_ Inst p e n s i o n 0.28120.3288 **0.3551 ***
NBR_ Inst o t h e r 0.07250.3762 ***0.3740 ***
Note: NBR_Indi, NBR_Fore, NBR_ Inst p e n s i o n , and NBR_ Inst o t h e r indicate the cumulative net buying ratio of individual, foreign, public pension funds, and other institutional investors for stock i over the event window, respectively. *, **, and *** denote statistical significance at the 10%, 5%, and 1% levels, respectively.
Table 6. Stepwise regression results.
IndexInterceptNBR_IndiNBR_Fore NBR _ Inst p e n s i o n NBR _ Inst o t h e r R2
DJSI World1.88387
(2.00) **
1.90202
(0.38)
2.90873
(1.46)
1.76236
(0.33)
0.085
DJSI Asia Pacific0.69979
(0.48)
7.24192
(0.92)
4.10831
(1.03)
0.0284
DJSI Korea0.32169
(0.49)
3.55605
(1.34)
4.48647
(3.59) ***
0.1452
Note: NBR_Indi, NBR_Fore, NBR_ Inst p e n s i o n , and NBR_ Inst o t h e r represent the cumulative net buying ratio of individual, foreign, pension funds, and other institutional investors, respectively, for stock i over the event window. Numbers in parentheses are the t-values. ** and *** denote statistical significance at the 5% and 1% levels, respectively.

