GIS-Based and Statistical Approaches in Archaeological Predictive Modelling (NE Romania)


Abstract
:1. Research Aims
2. Introduction
3. Archaeological Background and Study Area
4. Materials and Methods
5. Results and Discussion
6. Conclusions
Author Contributions
Funding
Acknowledgments
Conflicts of Interest
References
- Ștefan, D.; Sîrbu, V. Statistical tools in Landscape Archaeology. Archaeol. Calc. 2010, 21, 339–356. [Google Scholar]
- Verhagen, P.; Whitley, T.G. Integrating Archaeological Theory and Predictive Modeling: A Live Report from the Scene. J. Archaeol. Method Theory 2012, 19, 49–100. [Google Scholar] [CrossRef]
- Espa, G.; Benedetti, R.; De Meo, A.; Ricci, U.; Espa, S. GIS based models and estimation methods for the probability of archaeological site location. J. Cult. Herit. 2006, 7, 147–155. [Google Scholar] [CrossRef]
- Danese, M.; Masini, N.; Biscione, M.; Lasaponara, R. Predictive modeling for preventive Archaeology: Overview and case study. Cent. Eur. J. Geosci. 2014, 6, 42–55. [Google Scholar] [CrossRef]
- Howard, A.J.; Knight, D.; Coulthard, T.; Hudson-Edwards, K.; Kossof, D.; Malone, S. Assessing riverine threats to heritage assets posed by future climate change through a geomorphological approach and predictive modelling in the Derwent Valley Mills WHS, UK. J. Cult. Herit. 2016, 19, 387–394. [Google Scholar] [CrossRef] [Green Version]
- Balla, A.; Pavlogeorgatos, G.; Tsiafakis, D.; Pavlidis, G. Recent advances in archaeological predictive modeling for archaeological research and cultural heritage management. Mediterr. Archaeol. Archaeom. 2014, 14, 143–153. [Google Scholar]
- Balla, A.; Pavlogeorgatos, G.; Tsiafakis, D.; Pavlidis, G. Efficient predictive modelling for archaeological research. Mediterr. Archaeol. Archaeom. 2014, 14, 119–129. [Google Scholar]
- Raj, U.; Sinha, N.K.; Tewari, R. National-scale inventory and management of heritage sites and monuments: Advantages and challenges of using geospatial technology. Curr. Sci. India 2017, 113, 1934–1947. [Google Scholar] [CrossRef]
- Nsanziyera, A.F.; Rhinane, H.; Oujaa, A.; Mubea, K. GIS and Remote-Sensing Application in Archaeological Site Mapping in the Awsard Area (Morocco). Geosciences 2018, 8, 207. [Google Scholar] [CrossRef]
- Klehm, C.; Barnes, A.; Follett, F.; Simon, K.; Kiahtipes, C.; Mothulatshipi, S. Toward archaeological predictive modeling in the Bosutswe region of Botswana: Utilizing multispectral satellite imagery to conceptualize ancient landscapes. J. Anthropol. Archaeol. 2019, 54, 68–83. [Google Scholar] [CrossRef]
- Balla, A.; Pavlogeorgatos, G.; Tsiafakis, D.; Pavlidis, G. Locating Macedonian tombs using predictive modelling. J. Cult. Herit. 2013, 14, 403–410. [Google Scholar] [CrossRef]
- Perakis, K.G.; Moysiadis, A.K. Geospatial predictive modelling of the Neolithic archaeological sites of Magnesia in Greece. Int. J. Digit. Earth 2011, 4, 421–433. [Google Scholar] [CrossRef]
- Sánchez, J.C.; Pelgrom, J.; Stek, T.D. Comparing re-surveys in Isernia and Venosa (Molise and Basilicata, Italy). Mediterr. Archaeol. Archaeom. 2017, 17, 39–52. [Google Scholar] [CrossRef]
- Sharafi, S.; Fouladvand, S.; Simpson, I.; Barcelo Alvarez, J.A. Application of pattern recognition in detection of buried archaeological sites based on analysing environmental variables, Khorramabad Plain, West Iran. J. Archaeol. Sci. Rep. 2016, 8, 206–215. [Google Scholar] [CrossRef]
- Zhu, X.; Chen, F.; Guo, H. A Spatial Pattern Analysis of Frontier Passes in China’s Northern Silk Road Region Using a Scale Optimization BLR Archaeological Predictive Model. Heritage 2018, 1, 15–32. [Google Scholar] [CrossRef]
- Vaughn, S.; Crawford, T. A predictive model of archaeological potential: An example from northwestern Belize. Appl. Geogr. 2009, 29, 542–555. [Google Scholar] [CrossRef]
- Duke, D.; King, J. A GIS model for predicting wetland habitat in the Great Basin at the Pleistocene—Holocene transition and implications for Paleoindian archaeology. J. Archaeol. Sci. 2014, 49, 276–291. [Google Scholar] [CrossRef]
- Carleton, W.C.; Cheong, K.F.; Savage, D.; Barry, J.; Conolly, J.; Iannone, G. A comprehensive test of the Locally-Adaptive Model of Archaeological Potential (LAMAP). J. Archaeol. Sci. Rep. 2017, 11, 59–68. [Google Scholar] [CrossRef]
- Noviello, M.; Cafarelli, B.; Calculli, C.; Sarris, A.; Mairota, P. Investigating the distribution of archaeological sites: Multiparametric vs probability models and potentials for remote sensing data. Appl. Geogr. 2018, 95, 34–44. [Google Scholar] [CrossRef]
- Wachtel, I.; Zidon, R.; Garti, S.; Shelach-Lavi, G. Predictive modeling for archaeological site locations: Comparing logistic regression and maximal entropy in north Israel and north-east China. J. Archaeol. Sci. 2018, 92, 28–36. [Google Scholar] [CrossRef]
- Banerjee, R.; Srivastava, P.K.; Pike, A.W.G.; Petropoulos, G.P. Identification of painted rock-shelter sites using GIS integrated with a decision support system and fuzzy logic. ISPRS Int. J. Geo-Inf. 2018, 7, 326. [Google Scholar] [CrossRef]
- Canilao, M.A.P. Weight of evidence predictive modelling and potential locations of ancient gold mining settlements in Benguet in the 16th to 18th centuries. Philipp. J. Sci. 2017, 146, 187–192. [Google Scholar]
- Jarosław, J.; Hildebrandt-Radke, I. Using multivariate statistics and fuzzy logic system to analyse settlement preferences in lowland areas of the temperate zone: An example from the Polish Lowlands. J. Archaeol. Sci. 2009, 36, 2096–2107. [Google Scholar] [CrossRef]
- Verhagen, P.; Dragut, L. Object-based landform delineation and classification from DEMs for archaeological predictive mapping. J. Archaeol. Sci. 2012, 39, 698–703. [Google Scholar] [CrossRef]
- Mihu-Pintilie, A.; Nicu, I.C. GIS-based Landform Classification of Eneolithic Archaeological Sites in the Plateau-plain Transition Zone (NE Romania): Habitation Practices vs. Flood Hazard Perception. Remote Sens. 2019, 11, 915. [Google Scholar] [CrossRef]
- Kaimaris, D. Ancient theaters in Greece and the contribution of geoinformatics to their macroscopic constructional features. Sci. Cult. 2018, 4, 9–25. [Google Scholar] [CrossRef]
- Graves, D. The use of predictive modelling to target Neolithic settlement and occupation activity in mainland Scotland. J. Archaeol. Sci. 2011, 38, 633–656. [Google Scholar] [CrossRef]
- Kamermans, H. Smashing the crystal ball. A critical evaluation of the Dutch National Predictive Model (IKAW). Int. J. Humanit. Arts Comput. 2007, 1, 71–84. [Google Scholar] [CrossRef]
- Asăndulesei, A. Inside a Cucuteni Settlement: Remote Sensing Techniques for Documenting an Unexplored Eneolithic Site from Northeastern Romania. Remote Sens. 2017, 9, 41. [Google Scholar] [CrossRef]
- Nicu, I.C. Cultural heritage assessment and vulnerability using Analytic Hierarchy Process and Geographic Information Systems (Valea Oii catchment, North-eastern Romania). An approach to historical maps. Int. J. Disaster. Risk. Reduct. 2016, 20, 103–111. [Google Scholar] [CrossRef]
- Nicu, I.C.; Asăndulesei, A. GIS-based evaluation of diagnostic areas in landslide susceptibility analysis of Bahluieț River Basin (Moldavian Plateau, NE Romania). Are Neolithic sites in danger? Geomorphology 2018, 314, 27–41. [Google Scholar] [CrossRef]
- Nicu, I.C. Frequency ratio and GIS-based evaluation of landslide susceptibility applied to cultural heritage assessment. J. Cult. Herit. 2017, 28, 172–176. [Google Scholar] [CrossRef]
- Mihu-Pintilie, A.; Asăndulesei, A.; Stoleriu, C.C.; Romanescu, G. GIS methods for assessment of hydro-geomorphic risk and anthropogenic impact which affect the archaeological sites. Case study: Dealul Mare archaeological site, Moldavian Plateau (Romania). Acta Geobalcanica 2016, 2, 35–43. [Google Scholar] [CrossRef]
- Tencariu, F.-A.; Alexianu, M.; Cotiuga, V.; Vasilache, V.; Sandu, I. Briquetage and salt cakes: An experimental approach of a prehistoric technique. J. Archaeol. Sci. 2015, 59, 118–131. [Google Scholar] [CrossRef]
- Brigand, R.; Weller, O. Neolithic and Chalcolithic settlement patterns in central Moldavia (Romania). Doc. Praehist. 2013, 40, 195–207. [Google Scholar] [CrossRef]
- Brigand, R.; Weller, O. Neo-Eneolithic settlement pattern and salt exploitation in Romanian Moldavia. J. Archaeol. Sci. Rep. 2018, 17, 68–78. [Google Scholar] [CrossRef]
- Nicu, I.C. Hydrogeomorphic Risk Analysis Affecting Chalcolithic Archaeological Sites from Valea Oii (Bahlui)Watershed, Northeastern Romania: An Interdisciplinary Approach, 1st ed.; Springer: Cham, The Netherlands, 2016. [Google Scholar] [CrossRef]
- Nicu, I.C. Natural risk assessment and mitigation of cultural heritage sites in North-eastern Romania (Valea Oii river basin). Area 2019, 51, 142–154. [Google Scholar] [CrossRef]
- Nicu, I.C. Tracking natural and anthropic risks from historical maps as a tool for cultural heritage assessment: A case study. Environ. Earth Sci. 2017, 76, 330. [Google Scholar] [CrossRef]
- Ganciu, I. Heritage for Sale! The Role of Museums in Promoting Metal Detecting and Looting in Romania. Heritage 2018, 1, 437–452. [Google Scholar] [CrossRef] [Green Version]
- Bucur, N.; Barbu, N. Complexul de conditii fizico-geografice din <<Coasta Dealul Mare—Harlau>>. Probl. Geogr. 1954, 1, 137–153. [Google Scholar]
- Florea, N.; Munteanu, I. Sistemul Roman de Taxonomie a Solurilor (SRTS); Editura SITECH: Craiova, Romania, 2012. [Google Scholar]
- McCune, B.; Keon, D. Equations for potential annual direct incident radiation and heat load. J. Veg. Sci. 2002, 13, 603–606. [Google Scholar] [CrossRef]
- Jenness, J. Topographic Position Index (tpi_jen.avx) extension for ArcView 3.x, v. 1.2. Jenness Enterprises. Available online: http://www.jennessent.com/arcview/tpi.htm (accessed on 2 October 2019).
- Qi, W.; Yang, X.; Wang, Z.; Li, Z.; Yang, F.; Zheng, Z. Fast landform position classification to improve the accuracy of remote sensing land cover mapping. Earth Sci. 2018, 7, 23–33. [Google Scholar] [CrossRef]
- Nicu, I.C. Application of analytic hierarchy process, frequency ratio, and statistical index to landslide susceptibility: An approach to endangered cultural heritage. Environ. Earth Sci. 2018, 77, 79. [Google Scholar] [CrossRef]
- Youssef, A.M.; Al-Kathery, M.; Pradhan, B. Landslide susceptibility mapping at Al-Hasher Area, Jizan (Saudi Arabia) using GIS-based frequency ratio and index of entropy models. Geosci. J. 2015, 19, 113–134. [Google Scholar] [CrossRef]
- Rosian, G.; Csaba, H.; Kinga-Olga, R.; Botan, C.-N.; Gavrila, I.G. Assessing landslide vulnerability using bivariate statistical analysis and the frequency ratio model. Case study: Transylvanian Plain (Romania). Z. Geomorphol. 2016, 60, 359–371. [Google Scholar] [CrossRef]
- Rahmati, O.; Haghizadeh, A.; Pourghasemi, H.R.; Noormohamadi, F. Gully erosion susceptibility mapping: The role of GIS-based bivariate statistical models and their comparison. Nat. Hazards 2016, 82, 1231–1258. [Google Scholar] [CrossRef]
- Khoshtinat, S.; Aminnejad, B.; Hassanzadeh, Y.; Ahmadi, H. Groundwater potential assessment of the Sero plain using bivariate models of the frequency ratio, Shannon entropy and evidential belief function. J. Earth Syst. Sci. 2019, 128, 152. [Google Scholar] [CrossRef] [Green Version]
- Thapa, R.; Gupta, S.; Kaur, H.; Mandal, R. Assessment of manganese contamination in groundwater using frequency ratio (FR) modeling and GIS: A case study on Burdwan district, West Bengal, India. Model. Earth Syst. Environ. 2018, 4, 161–174. [Google Scholar] [CrossRef]
- Tehrany, M.S.; Kumar, L.; Jebur, M.N.; Shabani, F. Evaluating the application of the statistical index method in flood susceptibility mapping and its comparison with frequency ratio and logistic regression methods. Geomat. Nat. Haz. Risk 2019, 10, 79–101. [Google Scholar] [CrossRef]
- Sahana, M.; Hong, H.Y.; Sajjad, H.; Liu, J.Z.; Zhu, A.X. Assessing deforestation susceptibility to forest ecosystem in Rudraprayag district, India using fragmentation approach and frequency ratio model. Sci. Total Environ. 2018, 627, 1264–1275. [Google Scholar] [CrossRef]
- Monah, D.; Monah, F. The last great Chalcolithic civilization of Old Europe. In Cucuteni. The Last Great Chalcolithic Civilization of Old Europe; Mantu, C.M., Dumitroaia, G.H., Tsaravopoulos, A., Eds.; Athena Publishing & Printing House: Bucharest, Romania, 1997; pp. 15–98. [Google Scholar]
- Lazarovici, C.M.; Lazarovici, G.; Turcanu, S. Cucuteni: A Great Civilization of the Prehistoric World; Editura Palatul Culturii: Iaşi, Romania, 2009; pp. 1–350. [Google Scholar]
- Petrescu-Dîmbovița, M.; Valeanu, M.-C. Cucuteni–Cetățuie. Monografie Arheologică; Editura Constatin Mătasă: Piatra Neamț, Romania, 2004; p. 405. [Google Scholar]
- Enea, S.-C.; Boghian, D.; Ignatescu, S. Anthropomorphic and zoomorphic representations from the Cucuteni sites of Giurgesti and Costesti (Iasi County, Romania). In Cucuteni Culture within the European Neo-Eneolithic Context; Preoteasa, C., Nicola, C.-D., Eds.; Editura “Constantin Matasa”: Piatra-Neamt, Romania, 2016; pp. 533–580. [Google Scholar]
- Rajala, U. ‘We Would Never Have Thought to Go There’–The Changing Definitions of a Site in Central Italian Archaeology. Bull. Hist. Archaeol. 2006, 16, 19–27. [Google Scholar] [CrossRef]
- Kvamme, K.L. Development and testing of quantitative models. In Quantifying the Present and Predicting the Past: Theory, Method, and Application of Archaeological Predictive Modelling; Judge, W.J., Sebastian, L., Eds.; U.S. Department of Interior, Bureau of Land Management Service Center: Denver, CO, USA, 1988; pp. 325–428. [Google Scholar]
- Grøn, O. Some problems with modelling the positions of prehistoric hunter-gatherer settlements on the basis of landscape topography. J. Archaeol. Sci. Rep. 2018, 20, 192–199. [Google Scholar] [CrossRef]
- Mertel, A.; Ondrejka, P.; Šabatová, K. Spatial predictive modeling of prehistoric sites in the Bohemian-Moravian Highlands based on graph similarity analysis. Open Geosci. 2018, 10, 261–274. [Google Scholar] [CrossRef] [Green Version]
- Verhagen, P. Case studies in Archaeological Predictive Modelling. Ph.D. Thesis, Leiden University Press, Leiden, The Netherlands, 2007. [Google Scholar]
- Carrer, F. An ethnoarchaeological inductive model for predicting archaeological site location: A case-study of pastoral settlement patterns in the Val di Fiemme and Val di Sole (Trentino, Italian Alps). J. Anthropol. Archaeol. 2013, 32, 54–62. [Google Scholar] [CrossRef]
- Nicu, I.C. Is overgrazing really influencing soil erosion? Water 2018, 10, 1077. [Google Scholar] [CrossRef]


| Conditioning Factor | Class | No. of Pixels in Domain | Pixels % | Sites Pixels | Sites Pixels % | Frequency Ratio (FR) |
|---|---|---|---|---|---|---|
| Soils (type) | 1 Luvisols | 14,818,636 | 4.66 | 74,529 | 3.67 | 0.04 |
| 2 Cambicc Chernozem | 60,267,943 | 18.95 | 527,989 | 26.02 | 0.07 | |
| 3 Clay Chernozem | 15,907,541 | 5.00 | 10,129 | 0.50 | 0.01 | |
| 4 Chernozem | 74,671,552 | 23.47 | 371,852 | 18.33 | 0.04 | |
| 5 Entic Aluviosols | 24,407,123 | 7.67 | 107,480 | 5.30 | 0.04 | |
| 6 Phaeozems | 40,426,881 | 12.71 | 300,325 | 14.80 | 0.06 | |
| 7 Antrosols | 33,237,067 | 10.45 | 318,433 | 15.69 | 0.08 | |
| 8 Gleysols | 13,869,069 | 4.36 | 2134 | 0.11 | - | |
| 9 Regosols | 1,888,710 | 0.59 | - | - | - | |
| 10 Solonetz | 115,847 | 0.04 | - | - | - | |
| 11 Rendzina | 5,965,903 | 1.88 | 81,585 | 4.02 | 0.11 | |
| 12 Aluviosols | 13,567,024 | 4.27 | 82,384 | 4.06 | 0.05 | |
| 13 Stagnosol | 16,705,752 | 5.25 | 85,916 | 4.23 | 0.04 | |
| 14 Bare rock | 1,158,248 | 0.36 | 31,383 | 1.55 | 0.22 | |
| 15 Phaeozems | 1,089,677 | 0.34 | 34,935 | 1.72 | 0.26 | |
| HLI (Heat Load Index) | 0.097–0.59 | 4,898,405 | 1.54 | 54,351 | 2.68 | 0.28 |
| 0.59–0.64 | 35,352,785 | 11.12 | 252,849 | 12.46 | 0.18 | |
| 0.64–0.67 | 154,500,235 | 48.58 | 948,083 | 46.74 | 0.16 | |
| 0.67–0.71 | 108,268,154 | 34.04 | 641,492 | 31.62 | 0.15 | |
| 0.71–1.04 | 15,031,047 | 4.73 | 131,846 | 6.50 | 0.22 | |
| SPI (Slope Position Classification) | 1 Valley | 27,167 | 0.01 | 94 | 0 | 0.09 |
| 2 Toe slope | 162,659 | 0.05 | 1290 | 0.06 | 0.21 | |
| 3 Flat | 175,545,165 | 55.19 | 1,039,526 | 51.24 | 0.15 | |
| 4 Midslope | 142,172,529 | 44.70 | 986,466 | 48.63 | 0.18 | |
| 5 Upper slope | 115,513 | 0.04 | 1115 | 0.05 | 0.25 | |
| 6 Ridges | 27,593 | 0.01 | 130 | 0.01 | 0.12 |
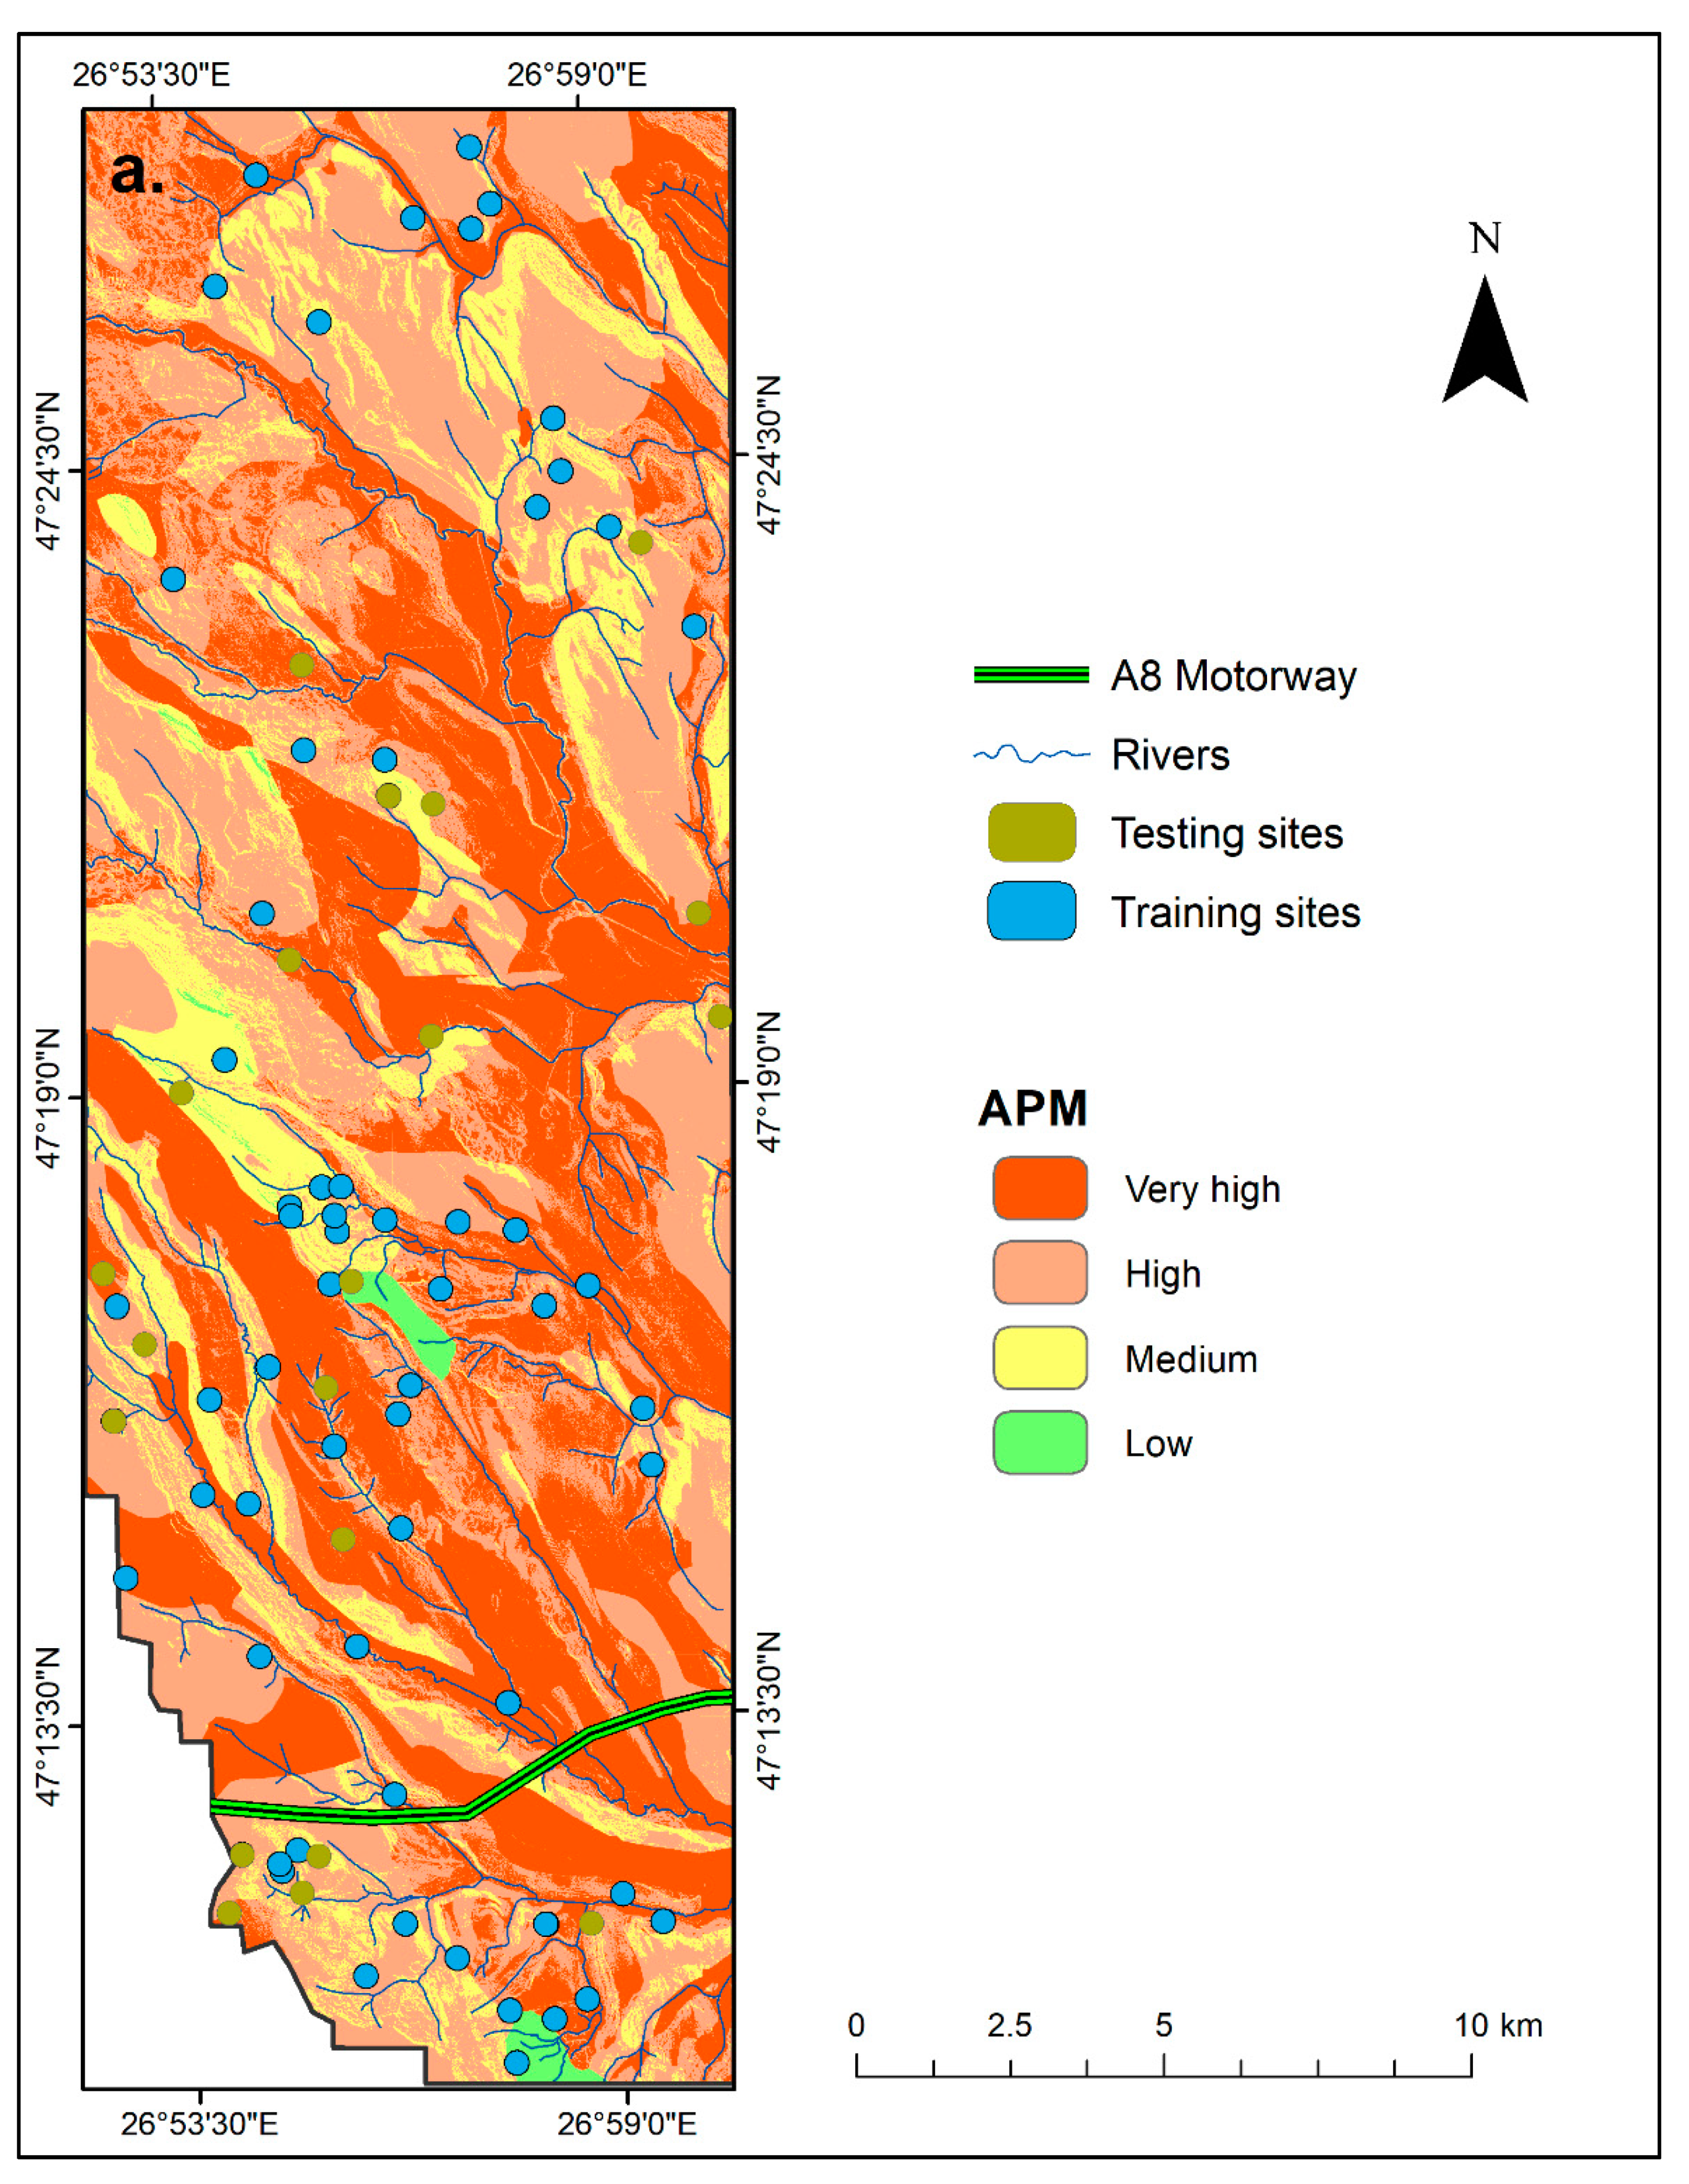
| Class | Pixel Number | Area (%) | Number of Sites | Sites (%) |
|---|---|---|---|---|
| Very high | 114,551,423 | 36 | 23 | 23 |
| High | 146,075,657 | 46 | 41 | 41 |
| Medium | 54,695,517 | 17.1 | 33 | 33 |
| Low | 2,766,013 | 0.9 | 3 | 3 |
| Total | 318,088,610 | 100 | 100 | 100 |
© 2019 by the authors. Licensee MDPI, Basel, Switzerland. This article is an open access article distributed under the terms and conditions of the Creative Commons Attribution (CC BY) license (http://creativecommons.org/licenses/by/4.0/).
Share and Cite
Nicu, I.C.; Mihu-Pintilie, A.; Williamson, J. GIS-Based and Statistical Approaches in Archaeological Predictive Modelling (NE Romania). Sustainability 2019, 11, 5969. https://doi.org/10.3390/su11215969
Nicu IC, Mihu-Pintilie A, Williamson J. GIS-Based and Statistical Approaches in Archaeological Predictive Modelling (NE Romania). Sustainability. 2019; 11(21):5969. https://doi.org/10.3390/su11215969
Chicago/Turabian StyleNicu, Ionut Cristi, Alin Mihu-Pintilie, and James Williamson. 2019. "GIS-Based and Statistical Approaches in Archaeological Predictive Modelling (NE Romania)" Sustainability 11, no. 21: 5969. https://doi.org/10.3390/su11215969