Article

Food Security and Dietary Quality in African Slums

Department of Agricultural Economics and Rural Development, University of Goettingen, Platz der Goettinger Sieben 5, 37073 Goettingen, Germany
*
Author to whom correspondence should be addressed.
Sustainability 2019, 11(21), 5999; https://doi.org/10.3390/su11215999
Submission received: 4 October 2019 / Revised: 22 October 2019 / Accepted: 22 October 2019 / Published: 28 October 2019

Abstract

:
More than half of Africa’s urban population lives in slums. Little is known about their nutritional situation, as slums are often underrepresented in standard surveys. This study analyzes issues of food security and dietary quality in East African slums using household-level and individual-level data collected in Nairobi and Kampala. The household food insecurity access scale (HFIAS) is used as a subjective measure of food security. Moreover, calorie availability and different dietary diversity scores are calculated based on 7-day food consumption recalls at the household level and 24-h dietary recalls at the individual level. The large majority of the slum households are food insecure and suffer from low dietary quality. Rates of undernourishment are considerably higher than what country-level statistics report, suggesting that slum dwellers deserve more explicit attention in initiatives to improve nutrition. Household-level indicators are significantly correlated with individual-level indicators for women and children. This means that household-level data, which are easier to collect, can proxy for individual nutrition up to a certain extent when individual-level data are unavailable. Regression models show that household income is one of the main factors explaining dietary patterns. Hence, facilitating access to lucrative employment is an important entry point for improving nutrition in slums.

1. Introduction

Most countries in Africa are experiencing rapid urbanization [1]. Unlike developed countries, where urbanization in the past coincided with strong economic growth, rural-urban migration in Africa is often associated with rising rates of urban poverty [2]. The rapid increase in the urban population combined with poor planning and weak economic growth means that African governments do not always manage to provide adequate basic services and decent living conditions [3]. Informal settlements, commonly known as slums, are proliferating in many African cities [3,4,5]. In 2014, an estimated 55% of the total urban population in Africa was living in slums [6]. Slum dwellers are particularly vulnerable to food insecurity, low dietary quality, and poor health. Unlike rural households that often grow food for subsistence consumption, food security in urban areas primarily depends on the households’ ability to purchase food. In other words, access to employment and cash income are likely the main factors influencing urban food security. In addition, slums are typically characterized by crowded and unhygienic living conditions and poor access to basic public services, including health and education [1,7]. While the general state of living conditions in slums is well documented, fairly little is known about the livelihoods of slum dwellers, including their dietary patterns and levels of malnutrition. The main reason is that informal settlements are typically underrepresented in standard household surveys. Here, we address this research gap with primary data collected in East African slums. In particular, we analyze issues of food security, dietary quality, and socioeconomic correlates in slums of Nairobi and Kampala, the capital cities of Kenya and Uganda.
Food security and dietary quality can be evaluated with various household-level and individual-level indicators, using food consumption measures, subjective self-assessments, or other types of data [8,9,10,11,12,13,14,15,16,17,18]. It is clear that no single indicator can adequately capture all dimensions of food security and dietary quality [10,19,20], but collecting all the data required for calculating a variety of indicators is hardly possible in most studies. Household-level food consumption data are often available from living standard measurement surveys [8,9], but these surveys typically do not contain information on intra-household food distribution. Dietary quality and nutrition can vary between different household members, so individual-level data are often preferred for more specific purposes, such as targeting nutrition interventions. Numerous studies have analyzed to what extent different food security and dietary quality indicators correlate. However, most of these studies have either compared different household-level indicators [12,16,21] or different individual-level indicators [14,15,22,23]. Only a few studies have compared household-level food security and dietary indicators with individual-level dietary and nutrition indicators [24,25,26,27,28,29], and those that did either focused on rural areas or used national data without much regional disaggregation. The situation in rural areas may differ from that in urban areas. We are not aware of any previous studies that have compared household-level and individual-level food security and dietary indicators in African slums. We do so and hence also contribute to the research direction on the use of dietary metrics. Better understanding the correlation between different indicators in particular contexts can help to identify suitable proxies for study situations in which only limited data are available or can be collected.
Specifically, in this study we address three research questions: (i) What is the situation of food security and dietary quality in African slums? (ii) Can household-level food security and dietary indicators be used as proxies for individual diets, especially the diets of women and children as the most vulnerable groups? (iii) What socioeconomic factors influence the dietary situation in African slums? We are particularly interested in understanding the role of different employment sources. Data for this study were collected in Nairobi and Kampala, two of the biggest cities in East Africa. The slums in these two cities cover a range of socioeconomic conditions, so that the results may offer some interesting lessons about African slums more generally.

2. Materials and Methods

2.1. Household Survey

The analysis is based on data from a household survey conducted in four different slums in Nairobi and Kampala between November 2016 and February 2017. The survey was part of a larger research project on value chains for food and nutrition security of vulnerable populations in East Africa carried out in cooperation with the International Center for Tropical Agriculture (CIAT) [30,31]. Nairobi and Kampala were purposively selected for this study, as they are among the largest cities in East Africa and both have sizeable populations living in slums. In Kenya and Uganda, more than 50% of the urban population is estimated to live in slums [6]. To select study participants, a multistage sampling procedure was used. At the first stage, all constituencies in Nairobi County and all divisions in Kampala District were listed and ordered based on average income and poverty levels using official statistics [32,33]. From these lists, the two poorest constituencies/divisions were purposively selected in each city; Mathare and Kibra (formerly Kibera) in Nairobi, and Kawempe and Nakawa in Kampala. All four locations are characterized by the absence of proper infrastructure, poor housing, overcrowding, high rates of unemployment, and poor health and sanitation services [5,7,30].
At the second stage, in each of the four locations we sampled the poorest wards and villages (village in this context refers to an administrative unit in metropolitan zones and should not be confused to represent rural areas). It should be noted that at this level reliable census data do not exist; hence information from the local administrative offices was used to select the wards and villages. In Nairobi, we selected three wards in Kibra (Laini Saba, Lindi, and Makina) and one village in Mathare (Mradi). In Kampala, we selected two villages in Kawempe (Bwaise I and Bwaise III) and two villages in Nakawa (Kinawataka and Banda). At the last stage, households were selected randomly using the random walk method. The random walk method was deemed appropriate because most households in these areas reside in temporary structures with no formal address. Sampling was based on households having at least one child aged 6–59 months [30]. In total, 600 households were interviewed: 300 in Nairobi and 300 in Kampala.
We designed a structured questionnaire, which was programmed in tablet computers for personal interviews. The questionnaire was carefully pretested. The interviews were conducted by teams of five enumerators in each of the two cities in local languages. The interviewers were trained and supervised by the researchers. The questionnaire contained modules on socioeconomic characteristics of the household, employment and income sources, food consumption patterns, and subjective food security assessments. The interviews were conducted either with the household head or the spouse. The food consumption details were discussed with the person in the household responsible for food purchases and food preparation. At the household level, food consumption data were collected using a 7-day recall period. We used a list of 112 food items typically consumed in the study areas, for which respondents reported the quantities eaten as well as the prices and sources. The list of food items used built on other recent surveys in Kenya, Uganda, and other African countries [24,34,35] and was verified and adjusted in questionnaire pre-tests prior to the main survey. Seven-day recall data with a food disaggregation of at least 60 items are considered suitable for deriving energy (calorie) consumption levels and other dietary indicators at the household level [10,15,19,20].
In addition to the 7-day recall at the household level, we collected individual-level food intake data for children and women through a 24-h dietary recall. The individual recalls were conducted twice on two nonconsecutive days, as suggested in the literature [24]. For the second visits, respondent households were traced based on the household head’s name, mobile phone number, and GPS coordinates, which were recorded during the first visit. Children included in the study were aged 6-59 months. In cases where households had more than one child in this age group, the child was selected randomly. Child-level dietary recalls were conducted with the mother or caregiver. Women included in the study were aged 15-49 years; in most cases the participating women were the mothers/caregivers of the selected child. In total, dietary recall data were obtained for 600 children (300 in Nairobi and 300 in Kampala) and 581 women (299 in Nairobi and 282 in Kampala).

2.2. Food Security Indicators

We use four indicators to evaluate food security at the household level. These include (i) the household dietary diversity score (HDDS), (ii) energy consumption per male adult equivalent (AE), (iii) the prevalence of undernourishment (PoU), and (iv) the household food insecurity access scale (HFIAS). These indicators are briefly described in the following.
HDDS is a simple count of the number of food groups consumed by a household within a specified recall period [36]. It was originally developed by the FANTA II Project [37] as a measure of household food access and has been widely used since then [16,19,24]. In our case, the recall period for the household-level data was 7 days. The HDDS classification is based on 12 food groups as shown in Table S1 (Supplementary Materials). Higher levels of HDDS indicate more dietary diversity. As households typically first try to satisfy their food energy needs before diversifying their diets, HDDS is also used as a food security proxy [19,38]. Yet there is no consensus in terms of a minimum HDDS threshold to classify food secure households [36]. Of course, the observed values also depend on the recall period: for a 7-day recall HDDS is systematically higher than for a 24-h recall. We use HDDS as a count measure with higher observed values indicating higher levels of food security, yet without assuming any particular threshold for food security or food insecurity.
Energy consumption is a widely used indicator for assessing food security when data on the quantities eaten of the different food items are available [8,15,19,36]. We used food composition tables for Kenya and Uganda [39,40] to convert the quantities consumed of the 112 food items into calories. The quantities consumed during the 7-day recall period were corrected for non-edible portions [24]. Total calories consumed in each household were then divided by 7 to obtain daily values and expressed per AE to facilitate comparison across households with different demographic structure. We use energy consumption per AE as a continuous measure. In addition, we use these energy values to derive the prevalence of undernourishment (PoU): households are classified as undernourished if their energy consumption is below the minimum threshold of 2400 kcal per day and AE, as suggested by FAO [41].
While HDDS and other food consumption-based measures are objective indicators of food security, it is sometimes argued that they do not sufficiently take into account the psychological dimensions of food insecurity such as worries about the possibility of food deprivation or limited dietary variation [19,42]. The HFIAS is a commonly used subjective measure of food insecurity that better accounts for such psychological dimensions. HFIAS captures people’s own perception about their food (in)security over a four-week recall period using a range of questions [18]. The HFIAS module in the survey questionnaire contained nine specific questions, which are shown in Table S2 (Supplementary Materials). These questions describe conditions that relate to three different domains of food insecurity, namely anxiety and uncertainty about the household food supply, insufficient food quality and variety, and insufficient food intake and hunger. If a particular condition occurred, the respondent was asked to specify if it occurred rarely (1), sometimes (2), or often (3) during the last four weeks. If a condition did not occur, a value of zero was assigned for the particular question. Adding up the values for all nine questions results in the HFIAS score that can take values between zero and 27; larger values indicate higher levels of food insecurity. Using the HFIAS responses, we also computed the household food insecurity access prevalence (HFIAP), following the method described by Coates et al. [18]. HFIAP is a categorical indicator that classifies households into four levels of food security, namely food secure, mildly food insecure, moderately food insecure, and severely food insecure.

2.3. Dietary Quality Indicators

Dietary quality is calculated at the individual level, using the 24-h dietary recall data from children and women living in the sample households. In particular, we calculate dietary diversity for children (CDD) and minimum dietary diversity for women (MDD-W), two commonly used indicators of individual dietary quality and micronutrient adequacy [36]. Both count the number of healthy food groups consumed during the 24-h recall period with food group classifications tailored to the dietary needs of the respective target group (Table S1, Supplementary Materials). The CDD considers seven different food groups. Children who consumed at least four out of these seven food groups are considered to have adequate micronutrient supply. CDD was specifically developed for children aged 6–23 months [11,17], but recent studies showed that the same food group classification is also useful for children above 23 months of age [24]. We use CDD for all children in our sample aged 6–59 months. MDD-W was specifically developed for women of reproductive age (15–49 years). It considers a total of ten food groups (Table S1); women who consumed at least five out of these ten food groups are considered to have adequate micronutrient supply.

2.4. Statistical Analyses

The first research question, namely to describe the food security and dietary quality situation in African slums, is addressed by showing mean values of the different household-level and individual-level indicators. The second research question, on the association between different indicators, is addressed through correlation analysis. Significant correlation coefficients would indicate that one indicator can be used as a proxy for the other. For this analysis, we reverse the HFIAS score, so that higher scores indicate higher levels of food security. This facilitates comparison with the other indicators, where higher values are always better than lower ones (except for PoU). We use Spearman’s correlation method, which is appropriate for both continuous and discrete variables.

2.5. Regression Models

The third research question, on the socioeconomic correlates of food security and dietary quality, is addressed with simple regression models. We start the analysis by regressing the food security and dietary indicators on a set of socioeconomic variables as follows:
F j = α + β X j + ε j
where F j is the food security indicator of household j , or the dietary quality indicator of the child and the woman living in that household, and X j is a vector of socioeconomic characteristics. α and β are parameters to be estimated, and ε j is a random error term. We estimate separate models for each of the dietary indicators. For energy consumption and the HFIAS score we use an ordinary least squares (OLS) estimator. Energy consumption in the regression models is log-transformed for better distributional fit. As for the correlation analysis, the HFIAS score is used in reversed form, to facilitate comparison with the other indicators. For HDDS, CDD, and MDD-W, we use a Poisson estimator [43], which was found more appropriate for the distribution of these count data variables.
In terms of socioeconomic characteristics, we include the following explanatory variables in equation (1): household size, dependency ratio (number of working age adults divided by number of children and old people living in the household), age, gender, and education of the household head, education of the spouse, household income, transfers received, and whether or not a serious health or economic shock was recently experienced. In the child dietary quality models, we additionally control for the gender and age of the respective child.
In urban households, income is primarily derived from employment or self-employed activities, so that access to different types of employment is expected to be an important determinant of food security and dietary quality. We analyze this by regressing the food security and dietary quality indicators on a set of employment variables as follows:
F j = α + γ E j + ε j
where E j is a vector of dummy variables indicating in what type of employment activity household j participates. We differentiate between self-employment, casual employment, and salaried employment. Further details about each of these employment categories are provided below. Salaried employment usually involves longer-term and more stable work in the formal sector, so we expect this type of employment to have more positive effects on food security and dietary quality than the other employment categories. This hypothesis will be tested.
Other household socioeconomic characteristics are not included in the models in equation (2), as they would confound the direct association between type of employment and food security/diets. Employment will likely affect diets primarily through income. On the other hand, the type of employment is likely influenced by education, gender, age, and other household and individual characteristics. The latter aspect is analyzed with additional probit models to explain which socioeconomic characteristics are associated with what type of employment. We use a multivariate probit [43], as the different employment types are likely correlated.

3. Results

3.1. Socioeconomic Characteristics

Table 1 shows general socioeconomic characteristics for the full sample, as well as separately for Nairobi and Kampala. As one would expect for slum areas, per capita income levels are very low, on average only 1.41 US dollars a day in purchasing power parity (PPP) terms for the full sample. Accordingly, poverty rates are high; 73% of the sample households fall below the poverty line of 1.90 dollars a day. Poverty rates in the slums of Kampala are significantly higher than they are in the slums of Nairobi. In terms of educational levels, the heads of most households have barely more than the eight years of primary education that are compulsory in East Africa. In Kampala, mean educational levels are even below eight years of schooling. In both cities, female adults have fewer years of schooling than male adults.

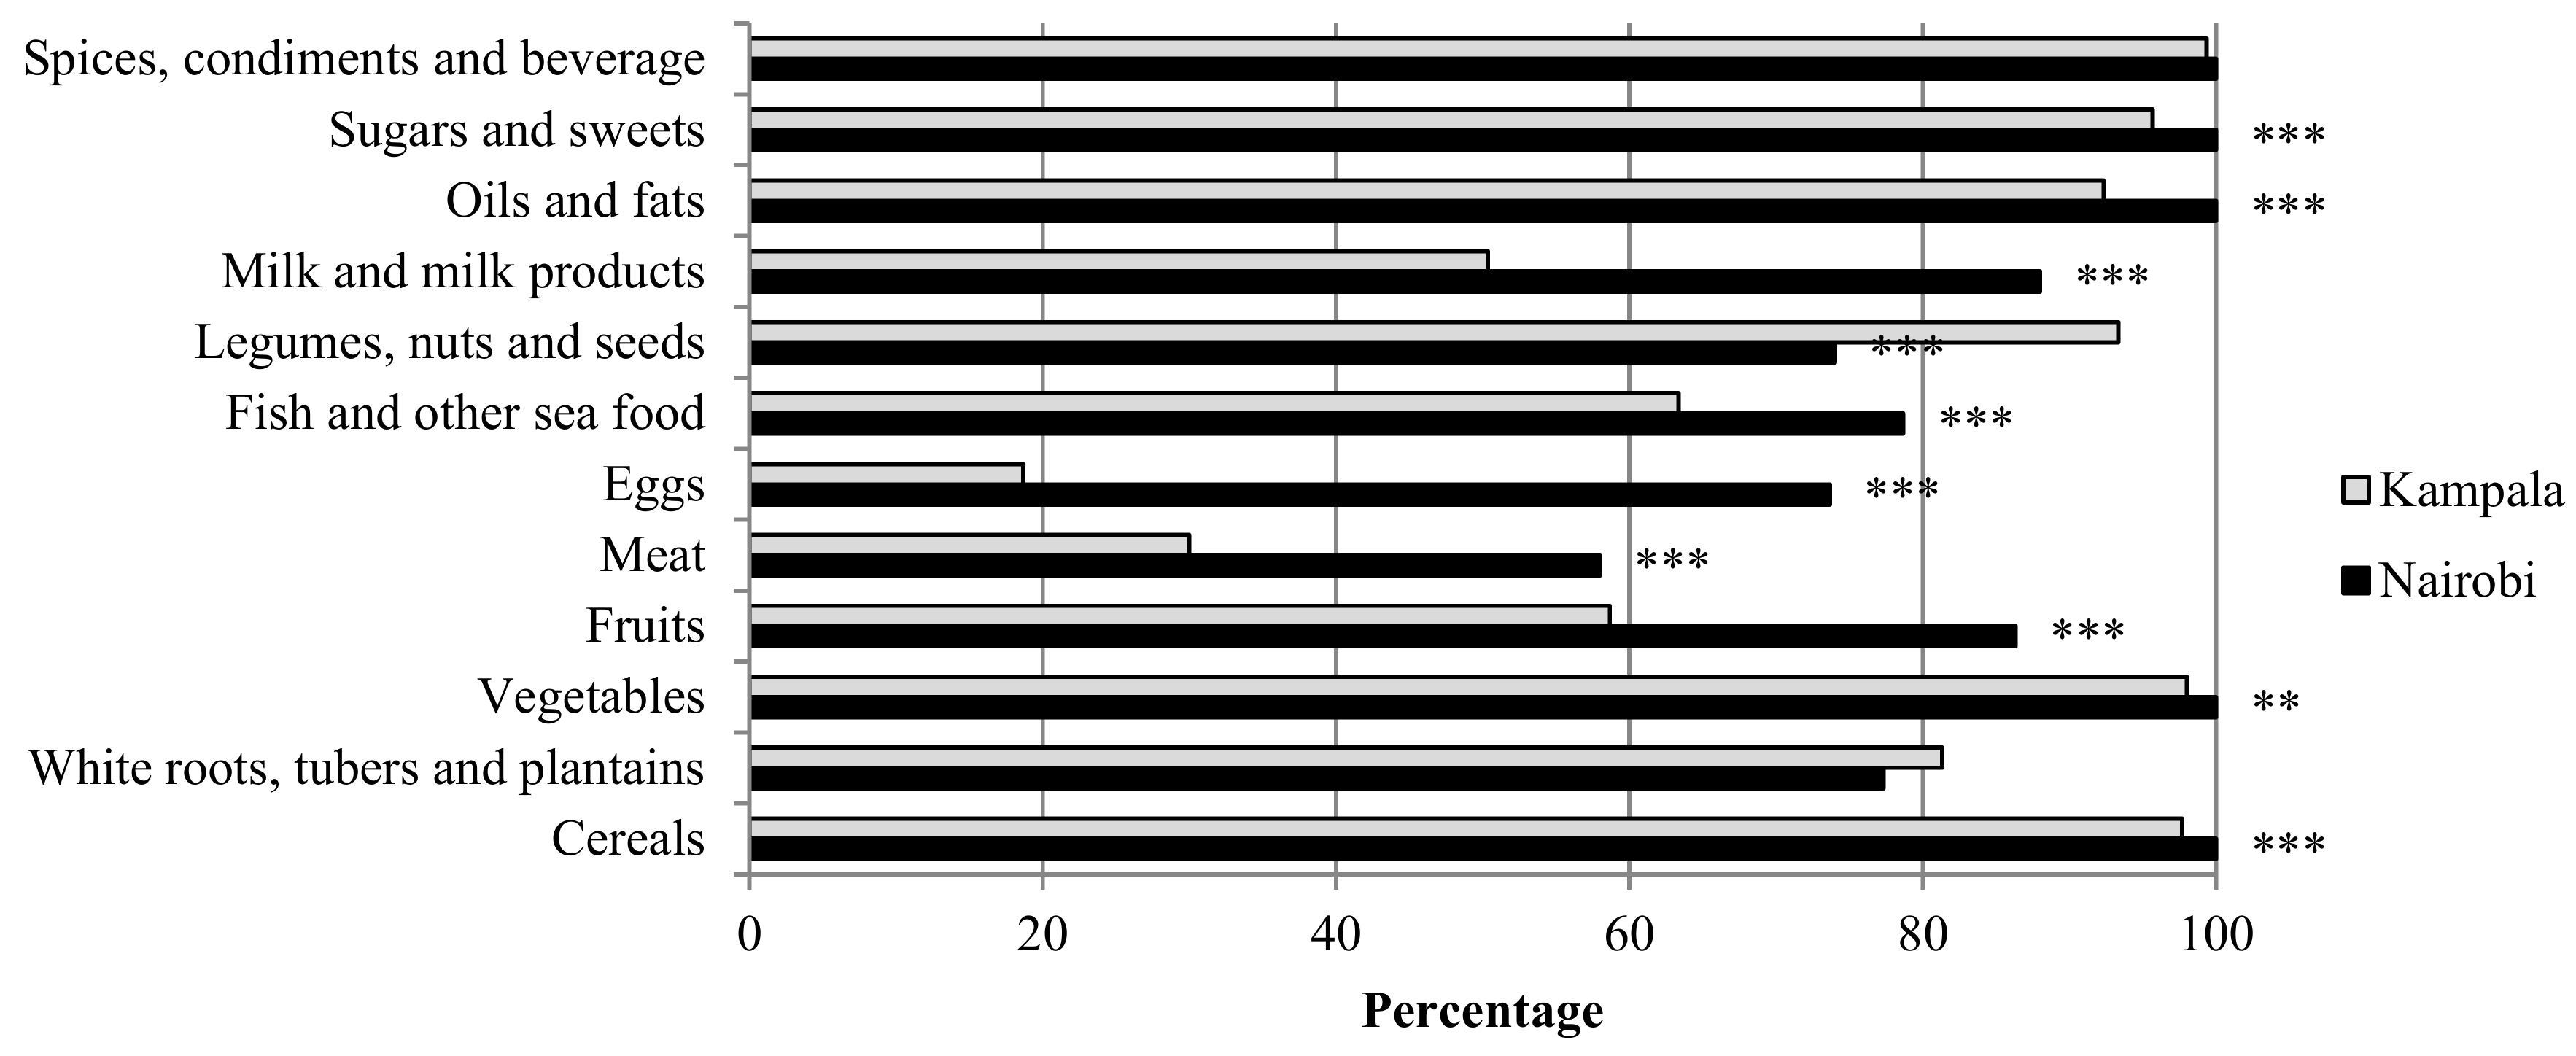
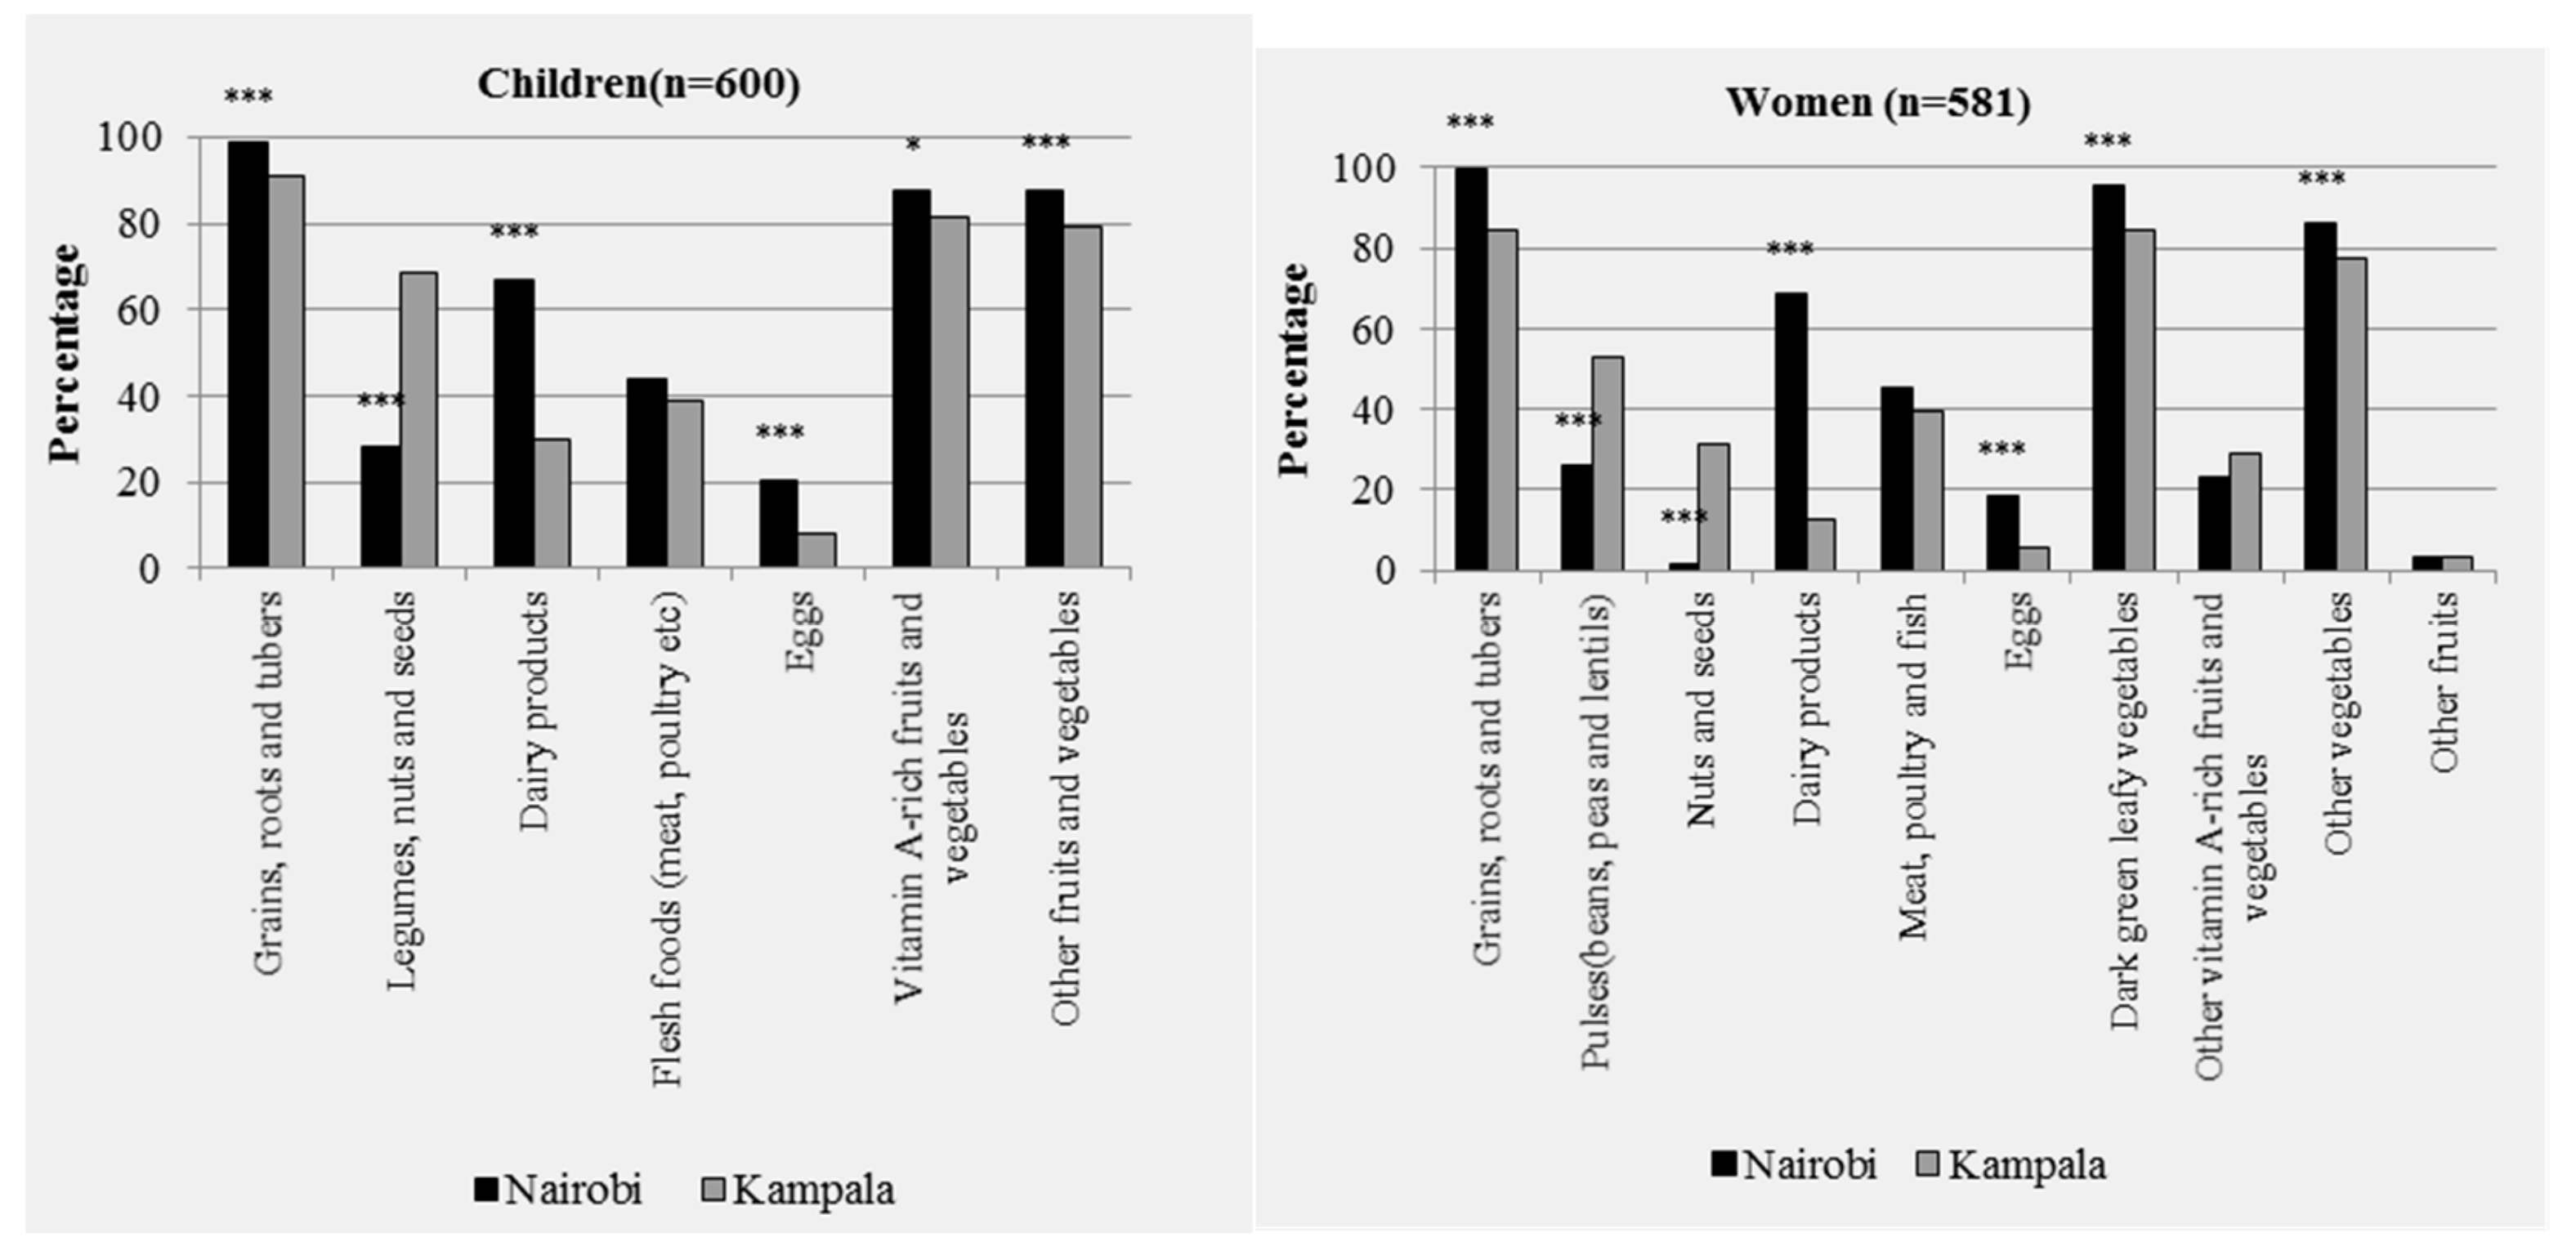
3.2. Food Security and Dietary Quality

Table 2 shows the different household-level and individual-level indicators of food security and dietary quality. On average, slum households in Nairobi consume around 2900 kcal per AE and day, whereas households in Kampala consume much less, only around 2400 kcal per AE and day. Based on these consumption levels, 31% of the sample households in Nairobi and 59% in Kampala are classified as undernourished.
The HDDS indicator confirms that slum households in Nairobi have somewhat better economic access to food and higher dietary diversity than slum households in Kampala. Figure 1 shows a breakdown of the different food groups consumed at the household level during the 7-day recall period. In both cities, almost all households consumed cereals and vegetables. Most households also consumed oils and fats, sugars and sweets, and spices condiments and beverages. On the other hand, several of the more nutritious food groups, such as fruits and animal source products, are consumed by a much lower proportion of households, especially in Kampala. In both settings, conscious vegetarianism is not commonly observed. Low consumption of meat and other animal source foods is mainly attributable to lack of access and affordability.
The HFIAS scores in Table 2 suggest that most households feel food insecure or at least vulnerable to food insecurity (the response distributions for each of the nine HFIAS questions are shown in Figure S1 in the Supplementary Materials). This is confirmed by the HFIAP indicator that classifies only 13% of the households in Nairobi and 7% of the households in Kampala as food secure. In other words, 87% and 93% of the households are classified as food insecure in Nairobi and Kampala, respectively. Many of them are categorized as severely food insecure (Table 2).
The individual-level dietary quality indicators for children and women are also shown in Table 2. They point at relatively low dietary quality and widespread micronutrient inadequacy. In Nairobi, 21% of the children and 40% of the women do not achieve the recommended minimum levels of dietary diversity (four food groups for children and five for women). In Kampala, the proportions of children and women below minimum thresholds of dietary diversity are 31% and 54% respectively. Figure 2 shows the consumption frequency of different food groups among children and women during the 24-h recall period. In line with the household-level analysis, cereals (grains) and vegetables are consumed by most individuals on a regular basis, whereas many of the other nutritious food groups, including fruits and animal source products, are consumed much less frequently, mainly due to lack of access and affordability.

3.3. Correlation between Indicators

In this subsection, we correlate the different food security and dietary indicators to better understand to what extent they match. We correlate all of the indicators used, but are particularly interested in the correlations between the household-level and the individual-level indicators, as this type of association has not been analyzed before in the context of African slums. Table 3 shows the correlation coefficients for the sample as a whole, and in the middle and lower parts also separately for Nairobi and Kampala. The household-level indicators (HDDS, energy consumption, PoU, and HFIAS) are all significantly correlated. For most of the indicators, the correlation coefficients are positive, as one would expect (note that the HFIAS score is used in reversed form for this analysis). Only PoU is negatively correlated with the other indicators, as PoU is a dummy variable that takes a value of one if the household is undernourished.
At the individual level, CDD and MDD-W are positively and significantly correlated, with correlation coefficients exceeding 0.5 (Table 3). In other words, the dietary quality of the child is closely related to the dietary quality of the mother. Interestingly, the correlations between the household-level and the individual-level indicators are also statistically significant. The correlations between household and individual dietary diversity scores range between 0.28 and 0.33 (Table 3). The correlations between HFIAS and the individual dietary diversity scores are in a similar range and even somewhat higher in Kampala.
The magnitude of correlation coefficients between different dietary and nutrition indicators is typically not very high [12,19,24,28], even when looking at the same individuals, because each indicator has a somewhat different focus. Hence, one cannot simply replace on indicator with another. However, the fact that many of the correlation coefficients in Table 3 are statistically significant and above 0.25 suggests that using household food security and dietary diversity indicators as proxies for individual dietary quality of women and children is acceptable when individual data are not available, as is often the case. Of course, some caution in interpretation is warranted. Only for PoU, the correlation coefficients are much smaller and not statistically significant in some cases. Due to the binary nature of the PoU variable, variation may be too limited to proxy for dietary quality.
We also analyzed the associations between the indicators through simple regression models with additional control variables included (Tables S3–S6). These additional results confirm significant associations between the household-level and individual-level indicators also after controlling for socioeconomic characteristics.

3.4. Socioeconomic Factors Influencing Food Security and Dietary Quality

Table 4 shows results from the regression models used to analyze the role of socioeconomic factors for food security and dietary quality for the full sample. Separate models for Nairobi and Kampala are shown in Table S7 (Supplementary Materials) with similar general findings. In several of the models in Table 4, male household head has a positive and significant coefficient, suggesting that male household heads have a positive effect on food security and dietary diversity. This may possibly be related to male adults having better access to more lucrative and more stable employment than female adults, an aspect that we will return to further below. Furthermore, we find that education of the household head has positive effects on food security at the household level. Interestingly, education of the household head is not significant in the individual-level models. Instead, education of the female adult seems to be more relevant for the dietary quality of women and children in the household. This is plausible: female education contributes to more decision-making power for women in the household, which has positive effects for intra-household food distribution and child nutrition [44,45].
Several other socioeconomic variables are also significant in some of the models in Table 4. But the most important driver of food security and dietary quality seems to be income, which is positive and significant in all household-level and individual-level models. This is unsurprising, as urban households primarily depend on food purchases for which cash income is needed, as mentioned before.

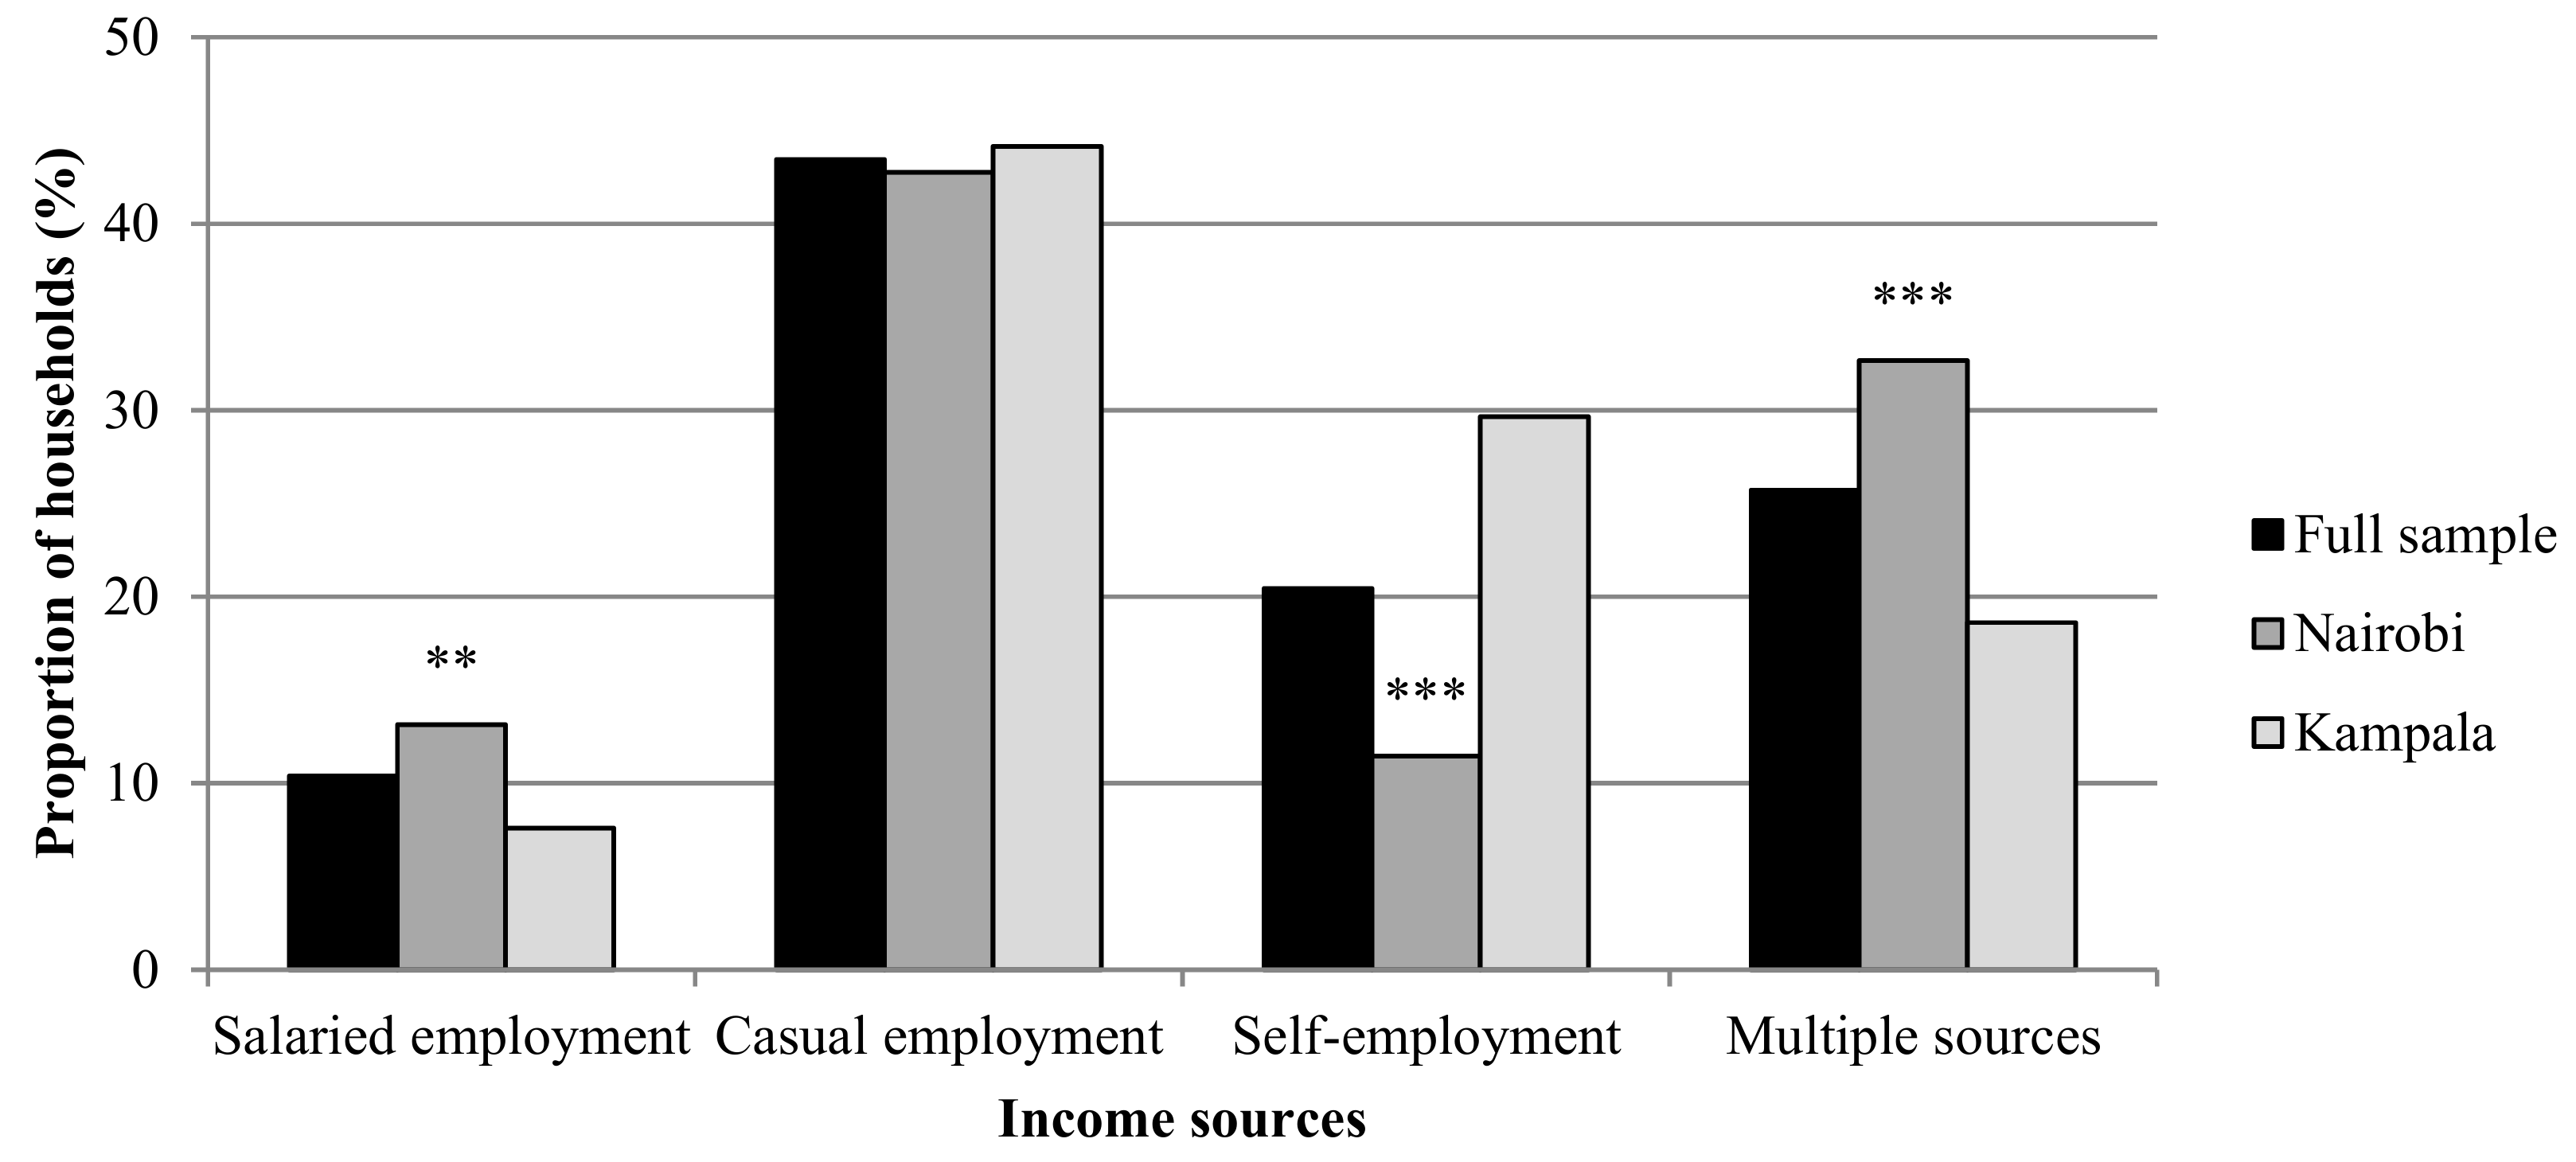
3.5. The Role of Employment Activities

Employment or self-employed activities are by far the most important sources of cash income for the households in the slums of Nairobi and Kampala. Figure 3 shows that most of the sample households depend entirely on casual employment, which is informal employment on a short-term basis in activities such as construction work, artisanal work, cleaning services, loading and unloading goods in local markets, and transportation, among others. Often, casual workers are only hired for a few hours or a few days, leading to high levels of insecurity and income fluctuation. Only around 10% of the households have more stable salaried employment, which usually involves formal and longer-term contractual arrangements. Typical salaried employment activities include working as a teacher, security guard, shop assistant, or officer, among others. Self-employment involves own small businesses, which are mostly informal in nature. Self-employment is more common in Kampala than in Nairobi, which is probably an indication of fewer employment opportunities for slum dwellers in Kampala. Households that derive income from various employment categories are classified to have “multiple sources” in Figure 3. The Figure uses household-level data and considers the income sources of all working household members. An additional breakdown of individual-level employment activities is shown in Table S8.
Table 5 shows results of the regression models with food security and dietary indicators as dependent and the employment categories as independent variables. We include dummy variables for salaried employment, self-employment, and multiple sources, and use casual employment as the baseline category. Salaried employment produces the largest positive coefficients, which are statistically significant in most of the models. That is, households with salaried employment are more food secure and have better dietary quality than other households, and especially in comparison to those that depend entirely on casual employment. This result is plausible, because salaried employment is usually better paid and ensures a more stable income stream than the other employment activities. The coefficients for self-employment and multiple sources in Table 5 are also positive and significant in most cases, clearly underlining that households that depend on casual employment alone are worst off in terms of food security and dietary quality. Very similar trends are also observed when running separate models for the subsamples from Nairobi and Kampala (Table S9).
Using a multivariate probit model, we also analyzed what socioeconomic factors determine households’ and individual’s access to different types of employment (Table S10). The results suggest that education is a crucial determining factor. More years of schooling significantly increase the likelihood of formal salaried employment, while reducing the likelihood of casual employment. Gender also plays an important role. Men are more likely to be involved in salaried employment than women; for self-employment it is the other way around.

4. Discussion and Conclusions

We have analyzed food security, dietary quality, and socioeconomic correlates in African slums, using representative data collected in the poorest neighborhoods of Nairobi and Kampala and various household-level and individual-level indicators. All indicators point at high levels of food insecurity and malnutrition. Based on the household food insecurity access scale (HFIAS), 87% and 93% of the households are food insecure in the slums of Nairobi and Kampala, respectively. This is similar to the findings of earlier studies that analyzed food insecurity in slums of Nairobi [3,46] and Windhoek, Namibia [47] using the HFIAS.
It should be mentioned that all dietary and food security indicators have their advantages and drawbacks [15,19,20]. Dietary diversity scores are easy to measure, but they do not take into account food quantities consumed. Indicators of calorie consumption account for food quantities, but they may be associated with larger measurement error, especially when building on recall data. The HFIAS takes into account psychological aspects of food insecurity, which the other indicators do not, but it remains a subjective measure, which needs to be kept in mind in interpretation. We used and compared several indicators within the same households and obtained consistent results, which adds to the overall robustness of our findings.
Using household-level food consumption data, we have found that 31% of the sample households in Nairobi and 59% in Kampala suffer from calorie deficiencies. We could not find comparable estimates for slums in the recent literature. However, our rates of calorie undernourishment are higher than those reported by FAO for both countries as a whole, namely 24% for Kenya and 41% for Uganda [48]. This comparison underlines that slum dwellers are particularly vulnerable to food insecurity and deserve special attention in food and nutrition policies.
Using individual-level dietary recall data, we have also calculated dietary diversity indicators for children and women. In the slums of both cities, more than 20% of the children do not reach the recommended minimum thresholds for balanced diets and micronutrient adequacy. For women, the rates are even higher; 40–50% of the women do not reach the recommended minimum dietary quality thresholds. For both children and women, dietary diversity is lower in Kampala than in Nairobi, as one would expect given lower average incomes in Kampala. We did not find other recent estimates of dietary diversity for slums in the literature. A recent study analyzed dietary diversity among smallholder farmers in rural Kenya [24]. In general, dietary diversity is higher in urban than in rural areas, because of better market infrastructure and more varied market supply in cities. However, market access also depends on personal incomes, and incomes are particularly low among slum dwellers. Our results suggest that dietary diversity in urban slums is similar to that in rural areas [24]. The proportion of women below the recommended dietary diversity threshold is even higher in urban slums than in rural areas.
We have also analyzed the association between the different food security and dietary quality indicators in order to see in how far they match. At the household level, the different food security indicators (HFIAS, energy consumption, and HDDS) are all significantly correlated with correlation coefficients > 0.4, so that they can be used as proxies for each other. At the individual level, we found positive, significant, and strong correlations (> 0.5) between CDD and MDD-W.
Furthermore, we have analyzed the associations between household-level and individual-level indicators. HFIAS, energy consumption, and HDDS are all positively and significantly correlated with CDD and MDD-W, which even holds after controlling for socioeconomic characteristics. Similar findings were also reported in other recent studies [24,26,27,29], but these other studies did not analyze the situation in urban slums. Most of the correlation coefficients between our household-level and individual-level measures were in a magnitude of 0.3, meaning that the associations are not very strong. This is not surprising, because the indicators are not meant to measure exactly the same issues. However, in the nutrition literature it is not uncommon to cautiously use one indicator as a proxy of another when the correlation is around 0.3 and statistically significant [16,22,24]. Hence, our results imply that—also in slum areas—household-level indicators can be used as proxies for the dietary quality of women and children when individual-level data are not available. While household-level indicators have clear limitations in capturing specific details of individual diets, the significant positive association is good news, because household-level data are more often available from standard surveys; they are easier and cheaper to collect than individual-level data. Especially HFIAS and HDDS are relatively undemanding in terms of data requirements.
We have used regression models to analyze socioeconomic factors that influence food security and dietary quality. Education was found to play an important role. While education of the household head has a positive effect on food security at the household level, dietary quality of children and women is influenced more by the educational level of the female adult in the household. Income from employment activities has a strong positive effect on all food security and dietary indicators, which is unsurprising given that poor urban households depend almost entirely on food purchases for their food security. Households with access to formal salaried employment have more healthy diets than other households and especially those that derive their income only from casual employment in the informal sector. More than 40% of the slum households depend entirely on casual employment, which is true in Nairobi and Kampala alike. Education was found to be an important determinant of access to formal salaried employment. Regardless of the educational level, men have better access to salaried employment than women. This means that facilitating access to education and strengthening the role of women will likely have positive effects on food security and nutrition in African slums. Although not analyzed here, public investments in infrastructure and efficient institutions may spur local economic growth and therefore help to create new and better employment opportunities.
Access to more lucrative and more stable employment and thus higher incomes for households living in slums may mean that some of these households will gradually relocate to more attractive neighborhoods of the cities. At this point, such relocations do not seem to happen very often. Many of the households in our sample had already stayed in the slums of Nairobi and Kampala for several years. But even when people manage to move out over time, the size of African slums will likely not decrease rapidly, simply because rural-urban migration will remain a common phenomenon for the decades ahead. Hence, improving food security and nutrition in African slums will most probably remain an important policy challenge for the foreseeable future.

Supplementary Materials

The following are available online at https://www.mdpi.com/2071-1050/11/21/5999/s1, Table S1: Food groups used to calculate dietary diversity scores, Table S2: Questions for household food insecurity access scale (HFIAS), Figure S1: Frequency of occurrence of nine items of the household food insecurity access scale (HFIAS), Table S3: Regression results of the association between HDDS and individual dietary indicators, Table S4: Regression results of the association between energy consumption and individual dietary indicators, Table S5: Regression results of the association between the prevalence of undernourishment and individual dietary indicators, Table S6: Regression results of the association between HFIAS and individual dietary indicators, Table S7: Socioeconomic factors influencing food security and dietary quality in Nairobi and Kampala, Table S8: Income earning activities of individual household members, Table S9: Effect of income sources on food security and dietary quality in Nairobi and Kampala, Table S10: Factors influencing participation in different employment activities for individual adults.

Author Contributions

Conceptualization, R.W., T.G., and M.Q.; Formal analysis, R.W.; Methodology, R.W.; Supervision, M.Q.; Writing—original draft, R.W.; Writing—review & editing, T.G. and M.Q.

Funding

This research was financially supported by the German Federal Ministry for Economic Cooperation and Development (BMZ) through the project “Making Value Chains Work for Food and Nutrition Security of Vulnerable Populations in East Africa” (grant number C-030-16), led by the International Center for Tropical Agriculture (CIAT). The article processing charge (APC) was funded by the University of Goettingen.

Acknowledgments

The authors thank the International Center for Tropical Agriculture (CIAT), especially Matthias Jager and Christine Chege, for their research cooperation.

Conflicts of Interest

The authors declare no conflict of interest.

References

  1. United Nations. World Urbanization Prospects: The 2018 Revision. Available online: https://esa.un.org/unpd/wup/Publications (accessed on 10 December 2018).
  2. Greif, M.J.; Dodoo, F.N.; Jayaraman, A. Urbanization, poverty and sexual behavior: The tale of five African cities. Urban Stud. 2011, 48, 947–957. [Google Scholar] [CrossRef] [PubMed]
  3. Kimani-Murage, E.W.; Schofield, L.; Wekesah, F.; Mohamed, S.; Mberu, B.; Ettarh, R.; Egondi, T.; Kyobutungi, C.; Ezeh, A. Vulnerability to food insecurity in urban slums: Experiences from Nairobi, Kenya. J. Urban Health 2014, 91, 1098–1113. [Google Scholar] [CrossRef] [PubMed]
  4. Tacoli, C. Food (in) security in rapidly urbanizing, low-income contexts. Int. J. Environ. Res. Public Health 2017, 14, 1554. [Google Scholar] [CrossRef] [PubMed]
  5. APHRC. Population and Health Dynamics in Nairobi’s Informal Settlements: Report of the Nairobi Cross-Sectional Slums Survey (NCSS) 2012; APHRC: Nairobi, Kenya, 2014. [Google Scholar]
  6. World Bank. Population Living in Slums (% Of Urban Population). The World Data Bank. Available online: https://data.worldbank.org/indicator/EN.POP.SLUM.UR.ZS?viewchart (accessed on 5 June 2018).
  7. UN-Habitat. State of the World’s Cities 2010/2011: Bridging the Urban Divide; UN-Habitat: Nairobi, Kenya, 2010; Available online: https://unhabitat.org/books/state-of-the-worlds-cities-20102011-cities-for-all-bridging-the-urban-divide/ (accessed on 15 July 2018).
  8. Zezza, A.; Carletto, C.; Fiedler, J.L.; Gennari, P.; Jolliffe, D. Food counts. Measuring food consumption and expenditures in household consumption and expenditure surveys (HCES). Introduction to the special issue. Food Policy 2017, 72, 1–6. [Google Scholar] [CrossRef]
  9. Upton, J.B.; Cissé, J.D.; Barrett, C.B. Food security as resilience: Reconciling definition and measurement. Agric. Econ. 2016, 7, 135–147. [Google Scholar] [CrossRef]
  10. Carletto, C.; Zezza, A.; Banerjee, R. Towards better measurement of household food security: Harmonizing indicators and the role of household surveys. Glob. Food Sec. 2013, 2, 30–40. [Google Scholar] [CrossRef]
  11. FAO; FHI 360. Minimum Dietary Diversity for Women (MDD-W): A Guide for Measurement; FAO: Rome, Italy, 2016. [Google Scholar]
  12. Maxwell, D.; Vaitla, B.; Coates, J. How do indicators of household food insecurity measure up? An empirical comparison from Ethiopia. Food Policy 2014, 47, 107–116. [Google Scholar] [CrossRef]
  13. Headey, D.D. The impact of the global food crisis on self-assessed food security. World Bank Econ. Rev. 2013, 27, 1–27. [Google Scholar] [CrossRef]
  14. Ruel, M.T.; Harris, J.; Cunningham, K. Diet quality in developing countries. In Diet Quality; Humana Press: New York, NY, USA, 2013; pp. 239–261. [Google Scholar]
  15. De Haen, H.; Klasen, S.; Qaim, M. What do we really know? Metrics for food insecurity and undernutrition. Food Policy 2011, 36, 760–769. [Google Scholar] [CrossRef] [Green Version]
  16. Kennedy, G.; Berardo, A.; Papavero, C.; Horjus, P.; Ballard, T.; Dop, M.; Delbaere, J.; Brouwer, I.D. Proxy measures of household food consumption for food security assessment and surveillance: comparison of the household dietary diversity and food consumption scores. Public Health Nutr. 2010, 13, 2010–2018. [Google Scholar] [CrossRef] [Green Version]
  17. WHO; UNICEF; USAID; FANTA; AED; UC DAVIS; IFPRI. Indicators for Assessing Infant and Young Child Feeding Practices Part 2: Measurement; WHO: Geneva, Switzerland, 2010. [Google Scholar]
  18. Coates, J.; Swindale, A.; Bilinsky, P. Household Food Insecurity Access Scale (Hfias) For Measurement of Household Food Access: Indicator Guide (v. 3); Food and Nutrition Technical Assistance Project; Academy for Educational Development: Washington, DC, USA, 2007. [Google Scholar]
  19. Headey, D.; Ecker, O. Rethinking the measurement of food security: From first principles to best practice. Food Secur. 2013, 5, 327–343. [Google Scholar] [CrossRef]
  20. Barrett, C.B. Measuring food insecurity. Science 2010, 327, 825–828. [Google Scholar] [CrossRef] [PubMed]
  21. Hoddinott, J.; Yohannes, Y. Dietary Diversity as A Household Food Security Indicator; Food and Nutrition Technical Assistance Project (FANTA); Academy for Educational Development: Washington, DC, USA, 2002. [Google Scholar]
  22. Kennedy, G.L.; Pedro, M.R.; Seghieri, C.; Nantel, G.; Brouwer, I. Dietary diversity score is a useful indicator of micronutrient intake in non-breast-feeding Filipino children. J. Nutr. 2007, 137, 472–477. [Google Scholar] [CrossRef] [PubMed]
  23. Savy, M.; Martin-Prével, Y.; Traissac, P.; Delpeuch, F. Measuring dietary diversity in rural Burkina Faso: Comparison of a 1-day and a 3-day dietary recall. Public Health Nutr. 2007, 10, 71–78. [Google Scholar] [CrossRef] [PubMed]
  24. Fongar, A.; Gödecke, T.; Aseta, A.; Qaim, M. How well do different dietary and nutrition assessment tools match? Insights from rural Kenya. Public Health Nutr. 2019, 22, 391–403. [Google Scholar] [CrossRef]
  25. Bühler, D.; Hartje, R.; Grote, U. Matching food security and malnutrition indicators: evidence from Southeast Asia. Agric. Econ. 2018, 49, 481–495. [Google Scholar] [CrossRef]
  26. Kang, Y.; Hurley, K.M.; Ruel-Bergeron, J.; Monclus, A.B.; Oemcke, R.; Wu, L.S.; Mitra, M.; Phuka, J.; Klemm, R.; West, K.P.; et al. Household food insecurity is associated with low dietary diversity among pregnant and lactating women in rural Malawi. Public Health Nutr. 2019, 22, 697–705. [Google Scholar] [CrossRef]
  27. Cisse-Egbuonye, N.; Ishdorj, A.; McKyer, E.L.; Mkuu, R. Examining nutritional adequacy and dietary diversity among women in Niger. Mater. Child Health. J. 2017, 21, 1408–1416. [Google Scholar] [CrossRef]
  28. Koppmair, S.; Kassie, M.; Qaim, M. Farm production, market access and dietary diversity in Malawi. Public Health Nutr. 2017, 20, 325–335. [Google Scholar] [CrossRef]
  29. Tiwari, S.; Skoufias, E.; Sherpa, M. Shorter, Cheaper, Quicker, Better: Linking Measures of Household Food Security To Nutritional Outcomes in Bangladesh, Nepal, Pakistan, Uganda, and Tanzania; World Bank Policy Research Working Paper No. 6584; The World Bank: Washington, DC, USA, 2014. [Google Scholar]
  30. Wanyama, R.; Gödecke, T.; Chege, C.G.K.; Qaim, M. How important are supermarkets for the diets of the urban poor in Africa? Food Secur. 2019. [Google Scholar] [CrossRef]
  31. Wanyama, R.; Gödecke, T.; Jager, M.; Qaim, M. Poor consumers’ preferences for nutritionally enhanced foods. Br. Food J. 2019, 212, 755–770. [Google Scholar] [CrossRef]
  32. Kenya National Bureau of Statistics. Spatial Dimensions of Well-Being in Kenya. Where are the Poor? From Counties to Wards; KNBS: Nairobi, Kenya, 2015.
  33. Uganda Bureau of Statistics. National Population and Housing Census 2014, Sub-County Report. Volume I Central Region; UBOS: Kampala, Uganda, 2014.
  34. Sibhatu, K.T.; Qaim, M. Farm production diversity and dietary quality: Linkages and measurement issues. Food Secur. 2018, 10, 47–59. [Google Scholar] [CrossRef]
  35. Khonje, M.G.; Qaim, M. Modernization of African food retailing and (un)healthy food consumption. Sustainability 2019, 11, 4306. [Google Scholar] [CrossRef]
  36. Kennedy, G.; Ballard, T.; Dop, M.C. Guidelines for Measuring Household and Individual Dietary Diversity; FAO: Rome, Italy, 2010. [Google Scholar]
  37. Swindale, A.; Bilinsky, P. Household Dietary Diversity Score (HDDS) For Measurement of Household Food Access. Indicator Guide (v.2); FHI 360/Food and Nutrition Technical Assistance Project: Washington, DC, USA, 2006. [Google Scholar]
  38. FAO. Food Security Indicators. Available online: http://www.fao.org/economic/ess/ess-fs/ess-fadata/en/#.W9rH4NVKjIU (accessed on 1 June 2018).
  39. Sehmi, J.K. National Food Composition Tables and The Planning Of Satisfactory Diets In Kenya; Kenya Government Press: Nairobi, Kenya, 1993.
  40. Hotz, C.; Abdelrahman, L.; Sison, C.; Moursi, M.; Loechl, C. A Food Composition Table for Central and Eastern Uganda; HarvestPlus: Washington, DC, USA, 2012. [Google Scholar]
  41. FAO. Human Energy Requirements. Report of a Joint FAO/WHO/UNU Expert Consultation, Rome, 17–24 October 2001; FAO Food and Nutrition Technical Report Series No. 1; FAO: Rome, Italy, 2001. [Google Scholar]
  42. Desiere, S.; D’Haese, M.; Niragira, S. Assessing the cross-sectional and inter-temporal validity of the Household Food Insecurity Access Scale (HFIAS) in Burundi. Public Health Nutr. 2015, 18, 2775–2785. [Google Scholar] [CrossRef] [Green Version]
  43. Greene, W.H. Econometric Analysis, 7th ed.; Prentice Hall: Upper Saddle River, NJ, USA, 2012. [Google Scholar]
  44. Debela, B.L.; Demmler, K.M.; Rischke, R.; Qaim, M. Maternal nutrition knowledge and child nutritional outcomes in urban Kenya. Appetite 2017, 116, 518–526. [Google Scholar] [CrossRef]
  45. Sharaunga, S.; Mudhara, M.; Bogale, A. Effects of ‘women empowerment’ on household food security in rural KwaZulu-Natal province. Dev. Policy Rev. 2016, 34, 223–252. [Google Scholar] [CrossRef]
  46. Faye, O.; Baschieri, A.; Falkingham, J.; Muindi, K. Hunger and food insecurity in Nairobi’s slums: An assessment using IRT models. J. Urban Health 2011, 88, 235–255. [Google Scholar] [CrossRef]
  47. Crush, J.; Nickanor, N.; Kazembe, L. Informal food deserts and household food insecurity in Windhoek, Namibia. Sustainability 2019, 11, 37. [Google Scholar] [CrossRef]
  48. FAO; IFAD; UNICEF; WFP; WHO. The State of Food Security and Nutrition in the World 2018. Building Climate Resilience for Food Security and Nutrition; FAO: Rome, Italy, 2018. [Google Scholar]
Figure 1. Proportion of households consuming different food groups during 7-day recall period (n = 600). Differences between households in Nairobi and Kampala were tested for statistical significance; * P < 0.1, ** P < 0.5, *** P < 0.01.
Sustainability 11 05999 g001
Figure 2. Proportion of children and women consuming different food groups during 24-h recall period. Differences between Nairobi and Kampala were tested for statistical significance; * P < 0.1, ** P < 0.5, *** P< 0.01.
Sustainability 11 05999 g002
Figure 3. Income sources of slum households (n = 600). Differences between Nairobi and Kampala were tested for statistical significance; * P < 0.1, ** P < 0.5, *** P < 0.01.
Sustainability 11 05999 g003
Table 1. Sample characteristics and description of variables.
VariablesDescriptionFull SampleNairobiKampala
MeanSDMeanSDMeanSD
Male head=1 if household head is male, 0 otherwise0.670.470.850.360.490.50
AgeAge of the household head (years)35.7210.7135.848.6335.6012.46
Household sizeNumber of household members4.901.895.091.914.842.33
Dependency ratioDependency ratio1.380.981.110.641.641.18
Education Education level of household head (years)8.683.549.632.647.704.12
Female education Education level of female adult (years)8.173.088.842.327.483.58
Shock=1 if household experienced any shock (theft, serious illness etc.) during last five years, 0 otherwise0.660.480.500.500.810.39
IncomeIncome per capita per day ($PPP)1.411.231.991.260.830.88
Poor=1 if per capita income is below the international poverty line of 1.9$PPP0.730.440.560.500.900.30
Child ageAge of the reference child (months)26.5814.9128.1114.5125.0615.17
Child gender=1 if the reference child is male, 0 otherwise0.470.500.470.500.480.50
Observations 600 300 300
Mean values are shown with standard deviation in parentheses. PPP, purchasing power parity. SD, standard deviation.
Table 2. Food security and dietary quality indicators.
IndicatorHousehold (n = 600)Children (n = 600)Women (n = 581)
NairobiKampalaNairobiKampalaNairobiKampala
MeanSDMeanSDMeanSDKampalaSDMeanSDMeanSD
Energy consumption (kcal/day/AE)2927 ***103524441135
Prevalence of undernourishment (%)31.33 ***46.4659.3349.20
HDDS (12FG)10.35 ***1.458.791.90
HDDS range5–12-1–12-
HFIAS (score)10.22 *** 6.9814.777.59
HFIAP category (%)
Food secure13.33 ***34.056.6724.99
Mildly food insecure33.67 ***47.3317.6738.20
Moderately food insecure6.67 **24.982.3315.12
Severely food insecure46.33 ***49.9573.3344.30
CDD (7FG) 4.33 ***1.273.961.24
CDD range 1–7 1–7
Children not achieving MDD (%) 21.33 ***41.0331.0046.33
MDD-W (10FG) 4.67 ***1.274.211.50
MDD-W range 1–8 1–8
Women not achieving MDD (%) 40.00 **49.0754.3349.90
Observations300 300300 300 299 282
AE, adult equivalent; CDD, dietary diversity for children; FG, food group; HDDS, household dietary diversity score; HFIAP, household food insecurity access prevalence; HFIAS, household food insecurity access scale; MDD; minimum dietary diversity; MDD-W, minimum dietary diversity for women; n, sample size; SD, standard deviation. Table S1 shows the FG classifications. Differences between Nairobi and Kampala were tested for statistical significance; * P < 0.1, ** P < 0.5, *** P < 0.01.
Table 3. Correlation between food security and dietary quality indicators.
IndicatorHDDSEnergy ConsumptionPoUHFIAS (Reversed)CDD
Full sampleEnergy consumption0.468 ***1.000
PoU−0.332 ***−0.732 ***1.000
HFIAS (reversed)0.537 ***0.399 ***−0.299 ***1.000
CDD0.284 ***0.210 ***−0.142 ***0.330 ***1.000
MDD-W0.331 ***0.249 ***−0.169 ***0.364 ***0.531 ***
NairobiEnergy consumption0.467 ***1.000
PoU−0.307 ***−0.692 ***1.000
HFIAS (reversed)0.431 ***0.344 ***−0.248 ***1.000
CDD0.222 ***0.171 **−0.116 *0.260 ***1.000
MDD-W0.322 ***0.262 ***−0.153 **0.274 ***0.511 ***
KampalaEnergy consumption0.331 ***1.000
PoU−0.225 ***−0.743 ***1.000
HFIAS (reversed)0.491 ***0.340 ***−0.243 ***1.000
CDD0.290 ***0.166 **−0.0910.354 ***1.000
MDD-W0.255 ***0.166 **−0.125 *0.387 ***0.527 ***
CDD, dietary diversity for children; HDDS, household dietary diversity score; HFIAS, household food insecurity access scale; MDD-W, minimum dietary diversity for women; PoU, prevalence of undernourishment. * P < 0.1, ** P < 0.5, *** P < 0.01.
Table 4. Socioeconomic factors influencing food security and dietary quality (full sample).
Variables(1)(2)(3)(4)(5)
HDDSSEEnergy Consumption (log)SEHFIAS (Reversed)SECDDSEMDD-WSE
Male household head0.593 ***0.1980.0180.0491.323 *0.740−0.0010.1380.253 *0.153
Age of the household head (years)−0.0040.0080.003 *0.0020.0290.0300.0010.0050.0060.006
Household size0.082 *0.045−0.057 ***0.0100.0580.195−0.0070.032−0.0020.036
Dependency ratio−0.1190.0970.0180.019−0.536 *0.298−0.0380.064−0.0870.072
Education of household head (years)0.073 ***0.0250.017 ***0.0060.275 **0.113−0.0060.0180.0060.021
Female education (years)0.046 *0.026−0.0020.0070.214 *0.1180.035 *0.0210.041 *0.024
Income (per capita per day) 0.241 ***0.0540.035 **0.0141.760 ***0.2990.151 ***0.0460.111 **0.050
Transfers 0.1710.243−0.0500.0700.4361.0660.0580.2010.586 ***0.185
Shock −0.2150.140−0.0320.036−1.874 ***0.619−0.0610.110−0.1120.128
Age of reference child (months) 0.016 ***0.003
Gender of the child (Male=1) 0.0540.100
Kampala (reference: Nairobi)−0.751 ***0.159−0.162 ***0.043−0.3570.720−0.0700.121−0.1160.144
Observations600 600 600 600 581
Values shown are marginal effects. The energy consumption and HFIAS models were estimated with ordinary least squares. The HDDS, CDD, and MDD_W models were estimated with a Poisson estimator. CDD, dietary diversity for children; HDDS, dietary diversity score; HFIAS, household food insecurity access scale; MDD-W, minimum dietary diversity for women; SE, robust standard error. * P < 0.1, ** P < 0.5, *** P < 0.01.
Table 5. Effects of employment and income sources on food security and dietary quality.
Variables(1)(2)(3)(4)(5)
HDDSSEEnergy Consumption (log)SEHFIAS (Reversed)SECDDSEMDD-WSE
Salaried employment1.141 ***0.2170.143 ***0.0525.431 ***1.0600.2630.1670.382 **0.186
Self-employment0.1370.2140.0590.0502.451 ***0.8370.407 ***0.1340.289 *0.161
Multiple sources1.322 ***0.1660.098 **0.0444.968 ***0.7160.480 ***0.1310.670 ***0.144
Observations587 587 587 587 569
The employment categories are dummy variables with casual employment being the reference. Values shown are marginal effects. The energy consumption and HFIAS models were estimated with ordinary least squares. The HDDS, CDD, and MDD-W models were estimated with a Poisson estimator. CDD, dietary diversity for children; HDDS, dietary diversity score; HFIAS, household food insecurity access scale; MDD-W, minimum dietary diversity for women; SE, robust standard error. * P < 0.1, ** P < 0.5, *** P < 0.01.

