Abstract
(1) Background: As countries with troubled histories, China, Japan, and Korea have, in recent times, attempted to overcome political and economic differences in a bid to forge strong trade relationships. However, Non-Tariff Measures (NTMs) have emerged in recent times, which has the potential to complicate matters. (2) Method: Our study analyzes the impact that two forms of NTM, technical barriers to trade (TBT) and sanitary and phytosanitary measures (SPS), have on Japanese and Korean exports to China. In order to effectively measure their impact, we utilize a modified version of the Gravity model and the Poisson Pseudo Maximum Likelihood method (PPML). Using three measures (coverage ratio, frequency index, and the dummy variable) to determine their impact, our study displayed a range of findings. (3) Results: The key results from our study showed that from a coverage ratio perspective, our research clearly demonstrates that Chinese TBT measures, reduce Japan and Korea’s manufacturing and total exports as a whole, while Chinese SPS measures encourage Korean agricultural exports. Moreover, the frequency index results and dummy variable estimations in the main also supported the coverage ratio findings with SPS measures promoting Korean agricultural goods exports. (4) Conclusions: Our research highlights the important role the TBT measures have played to shelter China’s emerging industrial sector from the rigors of highly competitive Korean and Japanese exporters. In doing so, the Chinese government is able to actively pursue some of its key sustainable development strategies such as “Made in China 2025” and “Industrial 4.0”.
1. Introduction
The China, Japan, Korea (CJK) relationship has grown to be one of the most important trilateral relationships in the world. With significant impacts on economic welfare, security, and peace these countries profoundly influence the East Asian region and more broadly, the world. Built around their own distinct relative comparative advantages (see Appendix A Table A1) and industrial structures the economic relationship between these countries is large, contributing to unprecedented growth in trade and foreign direct investment (FDI) over the last three decades.
Political sensitivities based around unresolved historical issues and regional rivalries have at times, threatened to derail this progress. However, unlike other contemporary examples (United States—Cuba, India—Pakistan and North and South Korea) where politics have damaged or even ceased economic relations [1,2], the CJK relationship has successfully developed. China’s decision to immerse itself within the global economic system from the mid-1980s and its entry into the World Trade Organization in 2001 has seen its political relationship with Japan become increasingly dominated by a dynamic and positively evolving economic partnership.
From Japan’s perspective, its economic engagement with China has been important in recent years, as the country pursues a large-scale externally-driven strategy that will allow it to recover from the economic downturn of the 1990s. While Korea on the other hand, has used its growing domestic capabilities to engage in high levels of industrial process-orientated trade. In contrast, China views both Japan and Korea as an important means from which it can catapult itself to the frontier of industrial technologies and therefore transition itself from a low to a high income country.
Another key aspect of the CJK relationship is its ongoing Free Trade Agreement (FTA) negotiations, which will provide significant economic and geopolitical benefits to the three Northeast Asian countries as well as fostering new opportunities for global multilateral trade [3]. Since the idea for yearly summits between the three countries was first proposed in 1999, efforts have been made to get a FTA across the line. Despite an agreement to speed up the negotiations in April 2019, ongoing geopolitical disagreements continue to hinder substantive progress from being made. In addition to the CJK FTA, there are also opportunities for the countries to join the Chinese lead Regional Cooperative Economic Partnership (RCEP) initiative, which has the potential to drive multilateral trade growth in the Asian region [3]. The RCEP trade proposal is at present not in force, with negotiations still very much ongoing, however, a decision by the Trump administration to pull out of the Trans Pacific Partnership (TPP) trade deal, there is now greater optimism that a deal may be struck.
Despite growth in its economic relations with Japan and Korea, China has in recent times taken steps to balance its ideological trade liberalization agenda, which has seen it sign 16 FTAs, as of September 2019 [4] and lead the RCEP negotiations, with the demands of higher levels of domestic pressure. As such, the Chinese government has sought to combat lower tariff levels with an increasing number of alternative measures. These non-tariff barriers (NTB) have sought to protect its domestic marketplace from the competitive pressures that are exerted on it by increased import competition (see Appendix A Table A2). As data World Trade Organization Integrated Trade Intelligence Portal (WTO I-TIP) states, as of 2015, China has the 4th highest number of non-tariff measures (NTM) notifications in the world, and as a consequence, it requires a detailed and comprehensive system in order to manage them (see Appendix A Table A3 and Table A4). Among the different measures, TBT (Technical Barriers to Trade) and SPS (Sanitary and Phytosanitary measures) are the most common forms. SPS measures established the fundamental rules and requirements surrounding food safety as well as animal and plant health standards, while TBT measures are technical regulations and standards that define acceptable product characteristics relating to design, size, and performance elements as well as the way it is labelled or packaged [5].
As a WTO member, China is legally able to implement a range of protective measures, under the WTO TBT/SPS Agreement, that can protect not only human, animal and plant health but also deal with environmental, wildlife, and human safety factors. However, despite having the authorization to implement such measures, their rapidly growing use has caught the eye of international trade scholars with several important empirical studies being developed by [6,7,8,9,10,11]. These studies, while providing a comprehensive overview of the key economic issues relating to their modelling and measurement, have also created ample room for further discussion with results differing depending on the objects, time frames, and methodological parameters used.
Our study utilizes an adapted Gravity model and the Poisson Pseudo Maximum Likelihood (PPML) methodology to analyze the potential impact TBT and SPS measures have on Japanese and Korean exports to China. Our research differs from other studies by embracing the concepts of supply and demand by using disaggregated data, at the Harmonized Commodity Description and Coding Systems (HS) 2-digit level, which is related with China’s imports and Japanese and Korea’s exports. In addition, China has a large amount of processing trade with Japan and South Korea, that is, Japan and South Korea produce medium- and high-value-added products and components and ship them to China for processing, assembly and export to other countries. As a result, much of Japan and South Korea’s exports to China come from exports in processed goods. Since processed good exports are almost unaffected by NTMs, it is important that we use the export in processed goods as a control variable when analyzing the impact of NTMs on exports to China. Considering that there is a strong positive correlation between exports in processed goods and China’s global export volume, this study takes China’s global export volume as a proxy variable for the export in processed goods, in an attempt to control the impact of trade in processed goods on Korean and Japanese exports to China. Coverage ratios and frequency indexes and a dummy variable is also used for the TBT and SPS measures, at the HS 4-digit level, so as to quantify the industry-specific impacts that NTMs may have. Given the important geopolitical and economic relationships of our target countries, our research provides a crucial assessment of the impact of NTM on trade in East Asia.
The rest of the study is organized as follows. Section 2 examines the key literature associated with this study. Section 3 outlines our empirical approach and methodological framework. This is followed in Section 4 by a detailed analysis of the data and results, before offering some important policy offerings and concluding thoughts are given in Section 5.
2. Literature Review
As the dynamics of trade policy have changed in recent years, so have the focus of academic scholars with many choosing to take aim at the impact that TBT and SPS measures have export outcomes. With several studies emerging that have a key role in helping model [12]) and measure [6]) the impacts of non-tariff measures. There are of course a myriad of other related studies, which have helped to improve our understanding of these forms of policy initiatives [8,9]). An assessment of the literature shows that our understanding of non-tariff instruments has evolved significantly over time. While initially thought of as non-tariff barriers (NTBs), subsequent research has seen them referred to as NTMs as they are potentially able to hamper or encourage trade [6]). Part of this assessment has had various methodological approaches adopted, ranging from large econometric studies using panel and cross sectional data [13]), large computable general equilibrium models [14]) or sector- or policy-specific econometric studies [15]). Moreover, from an empirical perspective, different proxies have been used to measure NTMs such as frequency indexes and coverage ratios [8,9,16], which have shown mixed results as to the impact the measures have on trade flows. While the findings tend to be negative if NTMs are proxied by ad-valorem equivalent (AVE) [17]. Data use is also an important consideration, [18] finding that data aggregated at the HS-4 digit level have been found to have a positive impact on trade flows, while Beckman and Arita [19] showed that data using the HS-6 digit level was seen to have a negative impact.
In addition to the different methodological approaches taken, several sector-based studies have shown that NTMs have a negative impact on trade. In this regard, Alaeibakhsh and Ardakani [20] found that SPS regulations negatively affected the trade of pistachios products from Iran, while Hoda et al. [21] noted that the SPS measures imposed on Egyptian exports negatively influence the probability that a firm would export products to a new location. In other works [22,23], NTMs have helped to encourage trade. More specifically, Moenius [24] found that from an Organisation for Economic Co-operation and Development OECD perspective, bilaterally-shared and country-specific product TBT standards are on average trade-promoting. More prolific however, are the number of studies that provide evidence of the mixed effects of NTMs on trade. In this regard, Xiong and Beghin [10] found no specific evidence that EU SPS measures have a significant negative trade impact on African groundnut exports. While, Choi et al. [25] found that the impact of TBT measures on international trade flows between China, Japan and Korea was also insignificant.
Another key aspect of the literature highlighted the role that different NTMs or economic development levels have on the results themselves. In this instance, the fewer NTMs under examination, the clearer the policy implications [26]. Moreover, De Frahan and Vancauteren [27] showed that TBT measures can help to facilitate greater trade flows, while SPS measures are more prohibitive in nature [28]. From an economic development perspective, several studies have highlighted the negative effect that NTMs have on the trade flows of developing countries [29,30]. Moreover, Maskus et al. [31] found that developing country exporters face additional costs when modifying their manufacturing processes in order to adhere with specific foreign regulations. They argue that such costs highlight the poorer nation’s inability to deal with the complex administrative, technical and scientific complexities of the foreign regulatory requirements. In contrast to this, De Frahan and Vancauteren [27] showed the positive impact that harmonized food regulations could have on the trade flows of developed countries. The literature also highlighted the important role that firm size plays in overcoming regulatory provisions. For example, Decreux et al. [32] showed that large industrial players were better equipped to deal with the NTMs associated with the EU—South Korea free trade agreement.
Given the predominantly developing country focus and the contrasting academic perspectives, it is imperative that a more detailed assessment is carried out to ascertain the impact that SPS and TBT measures have on trade flows between the key east Asian economies of Japan and Korea. In addition, China’s enthusiastic adoption of such measures, and its, at times, sensitive relationship with these countries validates this need. By examining these countries, this study also helps to establish a means of providing a future assessment of the before and after effects of the Korea—China FTA.
3. Empirical Framework and Data
3.1. Empirical Model
As mentioned above, with the general reduction in global tariff levels, NTMs have become an increasingly important trade policy tools. As such, Researchers also pay more attention to the impact of NTMs on trade flows [5,8,9,15,25]. On the basis of these previous studies, the following empirical model is constructed to explore the impact of TBT and SPS measures on Japanese and Korean exports to China.
—product category j of HS2-digit level, from HS01–97, since no data for HS77, so = 1, 2, …, 96;
is year from 2002 to 2014;
TC represents the target country (Japan and Korea)’s exports to China.
In this instance, is the error term. For the purpose of this study we use the Pseudo Poisson Maximum Likelihood (PPML) estimation methodology. As proposed by various authors [32,33,34], the PPML method allows us to deal with the presence of zero export flows as well as any serious heteroskedasticity problems. Therefore, the empirical analysis is conducted using the PPML method.
3.2. Dependent and Independent Variables
3.2.1. Dependent Variable
The dependent variable, which represents the nominal export value of product from the target country (Japan or Korea) to China in year . We obtained the data from the Korea International Trade Association (hereafter KITA).
3.2.2. Independent Variables
Export Supply—
Export supply refers to the total nominal export value of product from the target country to the world in year excluding those exports to China. The variable was calculated using data provided by KITA. It represents the supply capacity of each individual country’s products (HS codes 01–97) to the world. The greater the value, which means the target country’s products enjoy a comparative advantage in the global market, the more likely to expect an increase in their exports to China.
Import Demand—
Import demand is defined as the nominal value of China’s imports of product from the world in year excluding those from the target countries. The variable was also calculated using data provided by KITA. This variable represents China’s gross import demand for product j in year t. With China experiencing significant improvements in living standards, import demand is rising and as a consequence, Japan and Korea will export more in order to meet this higher demand.
China’s Total Exports to the World—
This variable in defined as the total nominal value of product exported by China to the World in year using data obtained from KITA. When one considers the high level of trade in processed products that occurs between China and the target countries, there is an expectation that there will be a corresponding shift between the target countries’ exports to China and China’s exports to the world.
Tariff and Non-Tariff Measures Imposed by China—
Using data obtained from the World Bank and WTO, denotes the tariff and non-tariff measures imposed by China on product at year . First, we use the applied average weighted tariff to measure any potential impact of the tariff may have and expect that a reduction in the tariff level will promote an increase in exports from the target country (imports of China). In addition, we consider three ways (six different variables) to examine the SPS and TBT measures. Firstly, a coverage ratio (the coverage ratio measures the percentage of trade value subjected to NTMs for the target country’s products; measured by way of a coverage ratio are defined as SPSC and TBTC). Secondly, a frequency index (the frequency index represents the percentage of products subjected to NTMs; it is measured by way of a frequency index and are defined as SPSF and TBTF). Thirdly, a quantity-impact measure (measured by way of a dummy variable, equal to one, if China notifies at least one TBT or SPS measure and are defined as DSPS and DTBT). Given the interpretation of most of China’s notifications is done at the HS4-digit level, the SPS and TBT coverage ratios, frequency indexes and dummy variables calculated in this study is also at the HS4-digit level (1257 products) from 2002 to 2014. Once this is done, they are then aggregated according to the HS2-digit level format. In specific formulaic terms, the coverage ratio of product category at the year of is defined as:
—product item of HS4-digit level; = 1, 2, …, 1257;
—product category j of HS2-digit level; = 1, 2, …, 96;
—2002–2014.
In this instance, is a product item at the 4-digit HS code level in which it forms part of product category which represents the broader 2-digit HS code level. If a particular NTM is applied to a product at the year of , the dummy variable . takes the value of one or zero; and is the value of the target country’s exports for product ; The sum of () represents the export value of product category at the year of .
Second, the frequency index is calculated as the share of the number of import item in a certain product category that are affected by NTMs. In formulaic terms, the frequency index for product category in the year is denoted as being:
—product item of HS4-digit level; = 1, 2, …, 1257;
—product category j of HS2-digit level; = 1, 2, …, 96;
—2002–2014.
In this instance, denotes a specific product item at the 4-digit HS code level in which it forms part of product category which represents the broader 2-digit HS code level. is defined in the same manner as equation (2), and is also a dummy variable which is equal to one if there is an import of product . or zero if no measure is present.
The coverage ratio and frequency index are used to measure the restrictiveness of trade measures. Their respective values both range from 0 and 100, however as they interpret the restrictiveness of trade measures from different perspectives, the coverage ratio in terms of depth, and the frequency index in terms of range, then the calculated values for the two approaches are different. The quantity-impact measure is usually based on the frequency or coverage index, along with a dummy variable which is equal to one if an NTM is present. That is to say, this variable will be equal to one if the coverage ratio or frequency index is not zero at the HS4-digit level.
To show the depth and range of restrictiveness in a simplistic manner, we calculated the coverage ratios and frequency indexes of the products affected by TBT and SPS measures at the HS2-digit level (96 products) for the period from 2002 to 2014 (see Appendix A Table A5 and Table A6). Among the Chinese notifications for these NTMs, the TBT measures (at the HS2-digit level) affected 92.36 percent of all Japan exports, 94.55 percent of all Korean exports in 2008 and 93.37 percent of Korean and 96.09 percent of Japan in 2009; while SPS measures affected 20.22 percent of Japan’s total exports in 2010 and 18.82 in 2009 while 19.26 percent of Korea’s total exports in 2010 and 19.65 percent in 2011.
Other Related Variables
includes two control variables: real exchange rate (RER) and Internet that appear in related gravity models. For the real exchange rate, it is calculated by using the nominal exchange rate of the Chinese yuan vis-à-vis a particular target country’s currency and the Consumer Price Index (2010 = 100) data of related countries. A rise in RER represents a devaluation of the currency of the target country, which makes their exports cheaper and more attractive, then an increase in their exports will be expected. While the Internet variable is defined as the number of internet users per 100 people in China, which represents the developmental level of social infrastructure in China. Our research assumes that social infrastructure development helps to promote a target country’s exports to China. The data for the Internet variable was obtained from the World Bank, while the nominal exchange rate and Consumer Price Index (2010 = 100) data for China and Japan and Korea were obtained from the International Monetary Fund.
3.3. Data
Descriptive statistics for the variables included in the study are shown in Table 1. As mentioned earlier, for the NTMs that we have focused on, the minimum value of coverage ratio and frequency index is 0 and the maximum value is 100, and the mean value of TBT is greater than that of the SPS measures in terms of both the coverage ratio and frequency index. This indicates that when compared with SPS measures, China imposes more TBT measures. As Table 1 shows, the dependent variable and independent variables (especially those related to trade flow) show high dispersions, therefore this study utilized the PPML methodology to conduct the empirical analysis.

Table 1.
Descriptive statistics for the variables included in the study.
4. Empirical Analysis and Discussion
4.1. Analysis of Results
By using variables identified within the literature, our research empirically examined the impact that TBT and SPS measures have on target countries’ exports to China. Following an initial analysis of cross-correlation patterns among the explanatory variables (see Appendix A: Table A7) we were able to ascertain that of the variables measured, Tariff and Internet were shown to display high levels of correlation (in this case a correlation of more than 0.8). As a consequence of these multicollinearity concerns, we chose to analyze the effects of Tariff and Internet separately. Moreover, we assessed the effect of TBT and SPS measures by examining not only the product sample as a whole (HS 01–97) but also into agricultural (HS 01–24) and manufactural (HS 25–97) goods categories. This allowed us to ascertain if differences existed between the effects of TBT and SPS measures on the particular industries. The results for this analysis using both the coverage ratio and frequency index measures are shown in Table 2, Table 3 and Table 4, while the results using the dummy variables are shown in Table A8, Table A9 and Table A10. Overall, the results displayed a high-level of explanatory power with values ranging from 0.75 to 0.96. Before discussing the implications of our findings, time will first be taken to provide a brief analysis of other independent variables’ results.
Table 2.
Estimation results of total sample.
Table 3.
Estimation results of Japan.
Table 4.
Estimation results of South Korea.
In regards to target country export supply (EXTS) and Chinese import demand (IMDC) the results were found to be positive and statistically significant in all the models, which was in line with our initial projections. While in other results, the coefficient estimates for China’s total exports to the world (EXPC) were positive and highly significant for the whole sample and manufacturing industry. This suggests that there is a corresponding relationship between movements in Japan and Korea’s exports to China and China’s exports to the world. This finding illustrates the nature of the process-orientated trade occurs in the manufacturing sectors between China and Japan-Korea. As Table A2 shows, the top ten HS2-digit level product exports, are all from the manufacturing sector, and make-up an overwhelming share of target countries’ total export base (89.43% for Korea and 85.27% for Japan) which definitely has a bearing on the overall results.
The coefficient results of the Tariff variable were negative and statistically significant (from −0.17 to −0.16) for the total sample (as shown in Table 2, Table A8) which is line with our initial expectation that the reduction of tariff level will promote China’s imports. The results for the Internet, were found to be statistically significant and positive (from 0.12 to 0.47) for the agricultural sector of Korea and manufacturing sector of Japan which was supportive of our initial projections while statistically significant but negative for Japan’s agricultural exports. The real exchange rate, was found to be statistically insignificant for the manufacturing sector of Japan while insignificant and negative for Korea. This final result was surprising and is in contrast to our initial expectation that assumed a depreciation in the value of the target countries’ currency would lead to an increase in demand for target countries’ exports. For the country specific effects, the coefficient estimates of the country dummy variable for Japan in Table 2 and Table A8 were found to be statistically significant and negative, which suggested that Korean exports had a comparative advantage and were doing better than Japanese exports to China. This is an important finding as it eludes to a greater more systemic problem of the state of the Japanese economy which for some time now has been wallowing in a pit of poor economic performance.
Next is the analysis results of our main concern variables, TBT and SPS measures on the target country’s exports to China. Firstly, in regards to coverage ratio estimation results, TBT was found to be negative (from −0.05 to −0.08) and statistically significant for both the manufacturing sector and the sample as a whole and Korea respectively but insignificant for the manufacturing exports of Japan (from −0.03 to -0.02). While the SPS measure was positive (0.06) and statistically significant for the agricultural results of Korea, but was insignificant and negatively signed (−0.01) for Japan. The TBT findings in this respect support the conclusions of the empirical analysis by Devadson et al. [35], who highlighted the negative impact that these measures had on ASEAN industrial exports to China. In summary, the coverage estimation results show that TBT measures imposed by China, have an inhibitory effect on both the manufacturing exports and total exports of Japan and South Korea, while China’s SPS measures are conducive to the promotion of South Korea’s agricultural exports. In summary, the impact of the TBT measures on the sample as a whole and in particular manufacturing goods is negative. This applies to all three cases, i.e., the Total, Japan and Korean results. While on the other hand, the SPS measures were found to have a positive impact on the manufacturing sector for the Total, Japan and Korean results. Within the same scope, there is no conflict between any of the countries results. Equally, in terms of the agricultural sector, the SPS measures had a positive effect on Korean exports while the other two cases are statistically insignificant. Finally, the results also showed a positive impact of SPS measures on manufacturing exports for all three cases. These two results seem reflect similar explanations. More specifically, when China applies a higher level of SPS measures, the Chinese people become increasingly aware of the SPS issues related to food safety. We assume that this increased public concern for food safety would lead to a change in consumer habits whereby local consumers move away from purchasing domestic agricultural products or products from less developed countries to more developed countries including Japan and Korea. In addition, the positive impact of the SPS measure of agriculture exports of Korea bears the same explanation.
Second, we developed a frequency index as part of the assessment, taking into account the endogenous issues inherent in coverage ratio. In this instance, Table 2, Table 3 and Table 4 demonstrate that the TBT measures are statistically insignificant for the manufacturing sector of the sample as a whole and for Korea in particular, but are statistically significant and negatively signed for Japan which is in direct contrast to the coverage ratio findings. While the SPS estimation results are similar with the coverage ratio findings. To sum up, the estimation results of frequency index show that SPS measures promote Korean agricultural goods exports and reduce Japan’s manufacturing goods exports.
Finally, we use the dummy variable method for further analysis. The coefficient estimates of TBT and SPS using dummy variable are shown in Appendix A Table A8, Table A9 and Table A10. The results show the TBT measure to be statistically insignificant and negatively signed for the manufacturing sector findings of Japan and Korea, while the SPS measures are positive and statistically significant for Korean agricultural goods exports and statistically insignificant and negatively signed for Japan’s agricultural sector, which is the same as the SPS coverage ratio and frequency index findings.
4.2. Discussion and Policy Implications
The results from our study present a number of important issues that warrant further discussion. As the three largest economies in Asia, China, Korea, and Japan play an important role in not just the region but also the wider global economy. Despite experiencing many setbacks throughout their long histories, in recent times, progress has been made and stronger economic and diplomatic ties are being forged, albeit relatively slowly. A key part of this evolving relationship has been growth in their respective trading relationships. Since China joined the WTO in 2001, the level of trade between the countries has grown significantly (see Figure 1).
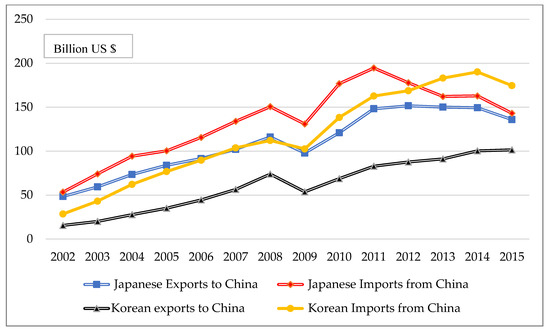
Figure 1.
Trading between China and its Partners Japan and Korea (2002-2015). Source: UN Comtrade [36].
Given the significant developments in the level of trade that has occurred between China and two of its most important trade partners, the Chinese government has sought to implement measures that not only enhance opportunities (such as the China—Korea FTA, CJK FTA and RCEP), but also protect vulnerable domestic industries. The highly competitive Korean and Japanese manufacturing sectors in particular have, in recent years, expanded their corporate activities in China. Given declines in tariff related barriers, as part of its WTO involvement, the Chinese government has responded to these additional competitive pressures by implementing a range of non-tariff measures such as TBT or SPS requirements. Previous empirical studies have shown that the impact of TBT and SPS measures has shown mixed results, with studies suggesting that trade can be both repressed or increased as a consequence of their implementation. However, in the case of this study, we have found that from a coverage ratio perspective, Chinese TBT measures, negatively impact (repress) both Japan and Korea’s manufacturing exports to China. This supports our initial expectation and the findings of a previous study [35] and is indicative of the threat they pose to China’s growing domestic industrial base. As a country of rapid economic development, the Chinese government is consciousness of the fact that it needs to temper foreign direct investment with a desire to provide sound employment opportunities for its citizens. Given that most of its industrial strength lies in low-skilled, low-tech areas [37], it is imperative that its domestic industry has sufficient breathing space in order to transition its industries into a more hi-tech sphere. TBT help to provide this space by increasing production costs for Japanese and Korean exporters and in doing so, improve the price competitiveness of domestic firms. The barriers also act as a safeguard for Chinese firms in that it can give them the access to the additional time they need to enhance not only their technical capabilities but also the human resource and management skills required to drive these hi-tech businesses forward. From a Japanese and Korean perspective, these non-tariff measures present a different set of challenges than previous tariff-related forms of Chinese trade policy. As these new measures require a range of improvisations, including technical adjustments, it is important that business take the steps it deems necessary to address the particular issues it is confronted with. From an agricultural perspective, our results in the main showed that Chinese SPS measures help to promote Korean agricultural exports. In recent years, the Chinese economy has leapt to life. Inclusion in the WTO, market liberalization policies, and a more global outlook has helped to create an increasingly well-informed burgeoning middle class. Within this domain lie well-educated consumers that have a strong grasp on and awareness of health and food safety standards. As such, they demand higher quality products. Within the agricultural sector, despair at the poor quality of domestic produce has seen Chinese consumers embrace foreign suppliers. However, in order to guarantee their access to food products that are safe and of a high standard, the Chinese government has implemented a myriad of SPS requirements. Their impact has not only put the onus on domestic producers to up their game but it has also helped to improve the quality of produce exported to China. In the case of Korea, these SPS measures reflect both improvements in its agricultural product quality but also an increase exposure of and liking for Korean produce, spurred on by the indelible attributes of the so-called Korean wave.
The results from the study also raise a number of other important issues relating to the formation of a possible China—Japan—Korea FTA. By identifying the impact that non-tariff barriers have on Japanese and Korean exports to China, this study has helped to bring to the fore important areas of consideration, particularly from a trade negotiation perspective. Given tariff rates have fallen to historic lows across almost all sectors, NTMs have become an important negotiating tool. As TBT requirements negatively impact manufacturing imports, the Japanese and Korean governments may seek concessions in other industry segments. The NTMs may also stimulate domestic opposition to any future among the three countries. For there is a mountain of evidence that demonstrates the negative impact that domestic labor unions and interest groups have can have on international trade negotiation outcomes [38,39,40,41,42,43,44] As such, any formal agreement between the three countries would have to clearly account for the costs or measures that are associated with these non-tariff requirements. In addition, for any agreement to be reached other political issues would need to be dealt with. Recently, attempts have been made in this regard, with the Japanese government offering a hard fought apology over the treatment of so-called comfort women during its 1910–1945 occupation of Korea. However, other problems still remain such as a need for Japan to apologize for its invasion and war with China during the Japanese colonial period. Once these matters are resolved and the issues regarding NTMs are effectively understood then a FTA may be possible. In the meantime, the trading relationship between China and its Japanese and Korean partners will continue to evolve.
5. Conclusions
This study provided an in depth appraisal of the impact that TBT and SPS measures have on Japanese and Korean exports to China. As most studies have had a developing country focus, our research provides added impetus to the knowledge we have on more developed East Asian economies. By establishing a well-structured methodology that incorporated clearly defined variables our study utilized an adapted gravity model and the PPML method in order to conduct this assessment. In conjunction with this, our analysis also included the use of a coverage ratio and frequency indexes in order to better understand the effect of these NTMs.
Overall, our model displayed a high-level of explanatory power with values ranging from 0.75 to 0.96, while our results were in many regards in line with expectations. The results from our study showed that from a coverage ratio perspective, our findings show that Chinese TBT measures, reduced both Japan and Korea’s manufacturing and total exports, while Chinese SPS measures actually encouraged Korean agricultural exports. While the frequency index results in the main supported the coverage ration findings with SPS measures promoting Korean agricultural goods exports and depressing Japan’s manufacturing goods exports. Finally, our dummy variable estimations found SPS measures help to stimulate growth in Korean agricultural goods exports. Overall, our results demonstrate that TBT measures help to provide a very much developing Chinese industrial sector from the rigors of highly competitive Korean and Japanese exporters. By protecting the domestic manufacturers, the Chinese government is able to actively pursue some of its key development strategies such as “Industrial 4.0” and “Made in China 2025”. The results also highlight the rise of the Chinese consumer and the extra demands that they require, particularly in terms of agricultural products. There greater awareness of health and safety standards is forcing serious exporters to enhance the quality of the products they manufacture.
The study has provided an important assessment of how certain NTMs impact Korean and Japanese exports to China. These countries share a colorful past and with the greater Asian region experiencing significant growth their future from an international trade perspective is an important factor in this growth. Understanding how these types of measures impact the export of agricultural and manufacturing products will play a key role in shaping any future CJK FTA.
Author Contributions
J.W. (Jie Wu), Y.L. and J.K. designed the experiments and collected and analyzed the data; J.W. (Jie Wu) and J.W. (Jacob Wood) wrote the paper.
Funding
We acknowledge the support of the National Natural Science Foundation of China (Nos. 71573233, 71803068, 71911540483). We also aknowledge the support of a James Cook University Singapore Research Fund.
Conflicts of Interest
The authors declare no conflict of interest.
Appendix A
Table A1.
Industries Revealed Competitive Advantage Index in 2010.
Table A1.
Industries Revealed Competitive Advantage Index in 2010.
| Country | Food | Textile | Wood | Paper | Chemicals | Plastic | Minerals | Metals | Machinery | Electrical | Transport | Miscellaneous Manufacturing. |
|---|---|---|---|---|---|---|---|---|---|---|---|---|
| China | 0.85 | 1.44 | 1.13 | 1.21 | 0.99 | 0.99 | 1.05 | 1.18 | 1.10 | 1.13 | 1.16 | NA |
| Japan | 0.63 | 0.81 | NA | 1.00 | 0.90 | 0.94 | 0.81 | 0.90 | 1.12 | 1.11 | 1.06 | 1.01 |
| Korea | 0.72 | 1.04 | 0.75 | 0.93 | 1.12 | 1.07 | 0.90 | 0.97 | 0.98 | 1.15 | 1.13 | 1.03 |
Source: Revealed Comparative Advantages (RCA) database [45].
Table A2.
Top 10 Harmonized Commodity Description and Coding Systems (HS) code exports for the sum of 2002–2014 (in thousand USD).
Table A2.
Top 10 Harmonized Commodity Description and Coding Systems (HS) code exports for the sum of 2002–2014 (in thousand USD).
| Description | HS Code | Japan | South Korea | ||
|---|---|---|---|---|---|
| Total: 1,329,641,214 | Share | Total: 1,176,580,023 | Share | ||
| Electrical, electronic equipment | 85 | 317,894,031 | 23.91% | 342,739,620 | 29.13% |
| Nuclear reactors, boilers, machinery, etc. | 84 | 289,052,900 | 21.74% | 142,850,549 | 12.14% |
| Vehicles other than railway, tramway | 87 | 114,345,325 | 8.60% | 51,033,246 | 4.34% |
| Optical, photo, technical, medical, etc. apparatus | 90 | 98,509,245 | 7.41% | 161,923,812 | 13.76% |
| Iron and steel | 72 | 87,343,859 | 6.57% | 43,995,865 | 3.74% |
| Organic chemicals | 29 | 76,298,104 | 5.74% | 113,437,432 | 9.64% |
| Plastics and articles thereof | 39 | 74,128,793 | 5.58% | 87,046,842 | 7.40% |
| Copper and articles thereof | 74 | 32,832,807 | 2.47% | 19,925,193 | 1.69% |
| Articles of iron or steel | 73 | 21,753,643 | 1.64% | 9,173,031 | 0.78% |
| Mineral fuels, oils, distillation products, etc. | 27 | 21,621,843 | 1.63% | 80,071,083 | 6.81% |
Source: Korea International Trade Association (KITA) database [46].
Table A3.
TBT Measures.
Table A3.
TBT Measures.
| Laws and Regulations | Relevant Government Bodies |
|---|---|
| The law on Import and Export Commodity inspection, the Regulations for the Implementation of the Law on Import and Export Commodity Inspection | General Administration of Quality Supervision, Inspection and Quarantine (AQSIQ) |
| The Law on Food Safety, the regulations for the Implementation of the Law on Food Safety | Ministry of Health (MOH), AQSIQ, State Food and Drug Administration (SFDA) |
| The Law on Product Quality | AQSIQ |
| The Law on the Prevention and Control of Environmental Pollution by Solid Waste | Ministry of Environmental Protection (MOEP) |
| The Standardization Law, the Regulations for the Implementation of the Standardization Law | AQSIQ, Standardization Administration of the People’s Republic of China |
| The Drug Administration Law, the Regulations for the Implementation of the Drug Administration Law, the Regulations on Supervision and Management to Medical Instruments | SFDA |
| The Regulations on Certification and Accreditation | AQSIQ, the Certification and Accreditation Administration of the People’s Republic of China |
| The Telecommunications Regulations | The Ministry of Industry and Information Technology (MIIT) |
Table A4.
SPS Measures.
Table A4.
SPS Measures.
| Primary Laws and Regulations | Relevant Government Bodies |
|---|---|
| The Law of the People’s Republic of China on Entry and Exit Animal and Plant Quarantine; and other relevant laws and regulations. | AQSIQ, MOH, SFDA, SFA |
| The Regulations for the Implementation of the Law of the People’s Republic of China on Entry and Exit Animal and Plant Quarantine; | |
| The Food Safety Law of the People’s Republic of China; | |
| The Regulations for the Implementation of the Food Safety Law of the People’s Republic of China |
Table A5.
The range (1) and depth (2) of restrictiveness of the trade measures (calculated at the HS2-digit level): Japan.
Table A5.
The range (1) and depth (2) of restrictiveness of the trade measures (calculated at the HS2-digit level): Japan.
| Types of Measure | Year | Number of Affected Products (1) | Total No. | Restrictiveness = (1)/Total Number of Products | Affected Imports (Thousand US $) (2) | Total Imports (Thousand US $) | Restrictiveness = (2)/Total Number of Products |
|---|---|---|---|---|---|---|---|
| TBT | 2002 | 10 | 96 | 10.42% | 14,591,519 | 38,155,903 | 38.24% |
| 2003 | 36 | 96 | 37.50% | 43,451,501 | 54,942,295 | 79.09% | |
| 2004 | 31 | 96 | 32.29% | 60,083,246 | 70,562,552 | 85.15% | |
| 2005 | 40 | 96 | 41.67% | 63,627,726 | 76,179,581 | 83.52% | |
| 2006 | 42 | 96 | 43.75% | 69,545,611 | 88,330,841 | 78.73% | |
| 2007 | 39 | 96 | 40.63% | 85,157,265 | 102,154,358 | 83.36% | |
| 2008 | 49 | 96 | 51.04% | 108,861,645 | 117,872,822 | 92.36% | |
| 2009 | 43 | 96 | 44.79% | 96,478,547 | 102,911,697 | 93.75% | |
| 2010 | 40 | 96 | 41.67% | 114,867,609 | 141,522,756 | 81.17% | |
| 2011 | 42 | 96 | 43.75% | 141,486,070 | 155,026,705 | 91.27% | |
| 2012 | 37 | 96 | 38.54% | 108,221,464 | 137,663,475 | 78.61% | |
| 2013 | 21 | 96 | 21.88% | 92,610,605 | 123,773,585 | 74.82% | |
| 2014 | 10 | 96 | 10.42% | 79,239,258 | 120,544,644 | 66.52% | |
| SPS | 2002 | 16 | 96 | 16.67% | 525,391 | 38,155,903 | 1.38% |
| 2003 | 10 | 96 | 10.42% | 148,349 | 54,942,295 | 0.27% | |
| 2004 | 15 | 96 | 15.63% | 311,351 | 70,562,552 | 0.44% | |
| 2005 | 5 | 96 | 5.21% | 5,142,100 | 76,179,581 | 6.75% | |
| 2006 | 2 | 96 | 2.08% | 20,622 | 88,330,841 | 0.02% | |
| 2007 | 1 | 96 | 1.04% | 3,877 | 102,154,358 | 0.00% | |
| 2008 | 19 | 96 | 19.79% | 23,828,419 | 117,872,822 | 20.22% | |
| 2009 | 6 | 96 | 6.25% | 19,367,778 | 102,911,697 | 18.82% | |
| 2010 | 17 | 96 | 17.71% | 22,229,378 | 141,522,756 | 15.71% | |
| 2011 | 22 | 96 | 22.92% | 21,808,806 | 155,026,705 | 14.07% | |
| 2012 | 5 | 96 | 5.21% | 37,216 | 137,663,475 | 0.03% | |
| 2013 | 12 | 96 | 12.50% | 8,884,657 | 123,773,585 | 7.18% | |
| 2014 | 15 | 96 | 15.63% | 786,672 | 120,544,644 | 0.65% |
Table A6.
The range (1) and depth (2) of restrictiveness of the trade measures (calculated at the HS2-digit level): South Korea.
Table A6.
The range (1) and depth (2) of restrictiveness of the trade measures (calculated at the HS2-digit level): South Korea.
| Types of Measure | Year | Number of Affected Products (1) | Total No. | Restrictiveness= (1)/Total Number of Products | Affected Imports (Thousand US $) (2) | Total Imports (Thousand US $) | Restrictiveness=(2)/Total Number of Products |
|---|---|---|---|---|---|---|---|
| TBT | 2002 | 9 | 96 | 9.38% | 4,897,842 | 23,753,587 | 20.62% |
| 2003 | 35 | 96 | 36.46% | 24,242,667 | 35,109,712 | 69.05% | |
| 2004 | 32 | 96 | 33.33% | 37,591,767 | 49,763,173 | 75.54% | |
| 2005 | 38 | 96 | 39.58% | 48,073,125 | 61,914,983 | 77.64% | |
| 2006 | 42 | 96 | 43.75% | 53,634,645 | 69,458,632 | 77.22% | |
| 2007 | 40 | 96 | 41.67% | 62,230,740 | 81,985,180 | 75.90% | |
| 2008 | 50 | 96 | 52.08% | 86,412,269 | 91,388,901 | 94.55% | |
| 2009 | 43 | 96 | 44.79% | 83,312,523 | 86,703,249 | 96.09% | |
| 2010 | 39 | 96 | 40.63% | 91,546,401 | 11,6837,836 | 78.35% | |
| 2011 | 42 | 96 | 43.75% | 126,171,961 | 134,185,005 | 94.03% | |
| 2012 | 38 | 96 | 39.58% | 108,962,728 | 134,322,565 | 81.12% | |
| 2013 | 22 | 96 | 22.92% | 116,809,984 | 145,869,500 | 80.08% | |
| 2014 | 10 | 96 | 10.42% | 96,642,405 | 145,287,700 | 66.52% | |
| SPS | 2002 | 15 | 96 | 15.63% | 1,157,437 | 23,753,587 | 4.87% |
| 2003 | 10 | 96 | 10.42% | 116,042 | 35,109,712 | 0.33% | |
| 2004 | 15 | 96 | 15.63% | 272,527 | 49,763,173 | 0.55% | |
| 2005 | 5 | 96 | 5.21% | 6,171,236 | 61,914,983 | 9.97% | |
| 2006 | 2 | 96 | 2.08% | 28,672 | 69,458,632 | 0.04% | |
| 2007 | 2 | 96 | 2.08% | 103,375 | 81,985,180 | 0.13% | |
| 2008 | 19 | 96 | 19.79% | 10,666,527 | 91,388,901 | 11.67% | |
| 2009 | 5 | 96 | 5.21% | 9,632,934 | 86,703,249 | 11.11% | |
| 2010 | 17 | 96 | 17.71% | 22,500,593 | 11,6837,836 | 19.26% | |
| 2011 | 21 | 96 | 21.88% | 26,373,274 | 134,185,005 | 19.65% | |
| 2012 | 5 | 96 | 5.21% | 88,563 | 134,322,565 | 0.07% | |
| 2013 | 12 | 96 | 12.50% | 12,163,914 | 145,869,500 | 8.34% | |
| 2014 | 13 | 96 | 13.54% | 998,503 | 145,287,700 | 0.69% |
Table A7.
Explanatory variables (by natural logarithm) correlations.
Table A7.
Explanatory variables (by natural logarithm) correlations.
| IMDC | EXTS | EXPC | Tariff | TBTF | TBTC | SPSF | SPSC | DSPS | DTBT | RER | Internet | |
|---|---|---|---|---|---|---|---|---|---|---|---|---|
| IMDC | 1 | |||||||||||
| EXTS | 0.653 *** | 1 | ||||||||||
| EXPC | 0.566 *** | 0.666 *** | 1 | |||||||||
| Tariff | −0.219 *** | −0.086 *** | −0.229 *** | 1 | ||||||||
| TBTF | 0.233 *** | 0.236 *** | 0.251 *** | −0.099 *** | 1 | |||||||
| TBTC | 0.212 *** | 0.216 *** | 0.224 *** | −0.095 *** | 0.954 *** | 1 | ||||||
| SPSF | −0.008 | −0.125 *** | −0.114 *** | 0.033 | 0.001 | 0.013 | 1 | |||||
| SPSC | -0.017 | −0.127 *** | −0.119 *** | 0.035 | 0.005 | 0.019 | 0.971 *** | 1 | ||||
| DSPS | 0.031 | −0.082 *** | −0.072 *** | 0.017 | 0.011 | 0.022 | 0.957 *** | 0.915 *** | 1 | |||
| DTBT | 0.305 *** | 0.310 *** | 0.320 *** | −0.097 *** | 0.940 *** | 0.869 *** | −0.033 | −0.031 | −0.010 | 1 | ||
| RER | 0.0356 | −0.042 * | 0.023 | −0.054 ** | −0.006 | −0.018 | 0.000 | 0.000 | 0.002 | −0.010 | 1 | |
| Internet | 0.246 *** | 0.097 *** | 0.263 *** | −0.839 *** | 0.030 | 0.030 | 0.009 | 0.002 | 0.036 | 0.021 | 0.090 *** | 1 |
Note: * p <0.05, ** p <0.01, *** p < 0.001
Table A8.
Estimation results of total sample using dummy variables.
Table A8.
Estimation results of total sample using dummy variables.
| Whole Sample (HS01–97) | Agriculture (HS01–24) | Manufacture (HS25–97) | ||||
|---|---|---|---|---|---|---|
| EXTS | 0.49 *** | 0.49 *** | 1.06 *** | 1.06 *** | 0.46 *** | 0.46 *** |
| (0.02) | (0.02) | (0.04) | (0.04) | (0.02) | (0.02) | |
| IMDC | 0.41 *** | 0.41 *** | 0.19 *** | 0.20 *** | 0.42 *** | 0.42 *** |
| (0.03) | (0.03) | (0.03) | (0.03) | (0.03) | (0.03) | |
| EXPC | 0.13 *** | 0.13 *** | 0.03 | 0.03 | 0.13 *** | 0.13 *** |
| (0.03) | (0.03) | (0.05) | (0.05) | (0.03) | (0.03) | |
| Tariff | −0.16 ** | −0.28 * | −0.16 ** | |||
| (0.08) | (0.17) | (0.08) | ||||
| DTBT | −0.01 | 0.00 | −0.13 | −0.12 | 0.01 | 0.02 |
| (0.09) | (0.09) | (0.11) | (0.11) | (0.09) | (0.09) | |
| DSPS | 0.13 | 0.12 | 0.10 | 0.09 | 0.19 ** | 0.18 ** |
| (0.09) | (0.09) | (0.10) | (0.10) | (0.09) | (0.09) | |
| RER | −0.34 * | −0.50 ** | −0.56 | −0.53 | −0.33 * | −0.49 ** |
| (0.18) | (0.21) | (0.35) | (0.45) | (0.18) | (0.21) | |
| Internet | 0.09 ** | 0.07 | 0.09 ** | |||
| (0.04) | (0.11) | (0.04) | ||||
| country==JP | −0.90 ** | −1.29 ** | −1.59 * | −1.53 | −0.86 ** | −1.25 ** |
| (0.43) | (0.52) | (0.85) | (1.12) | (0.42) | (0.52) | |
| Constant | −0.32 | 0.00 | −2.62 | −3.49 | 0.04 | 0.35 |
| (0.92) | (0.98) | (1.84) | (2.26) | (0.91) | (0.98) | |
| Pseudo log likelihood | −375,000,000 | −374,000,000 | −3,250,000 | −3,270,000 | −353,000,000 | −352,000,000 |
| Number of observations | 2496 | 2496 | 624 | 624 | 1872 | 1872 |
| R2 | 0.88 | 0.89 | 0.75 | 0.75 | 0.88 | 0.88 |
Standard errors in parentheses; * p < 0.10, ** p < 0.05, *** p < 0.01.
Table A9.
Estimation results of Japan: Interacted dummies with sanitary and phytosanitary (SPS) and technical barriers to trade (TBT).
Table A9.
Estimation results of Japan: Interacted dummies with sanitary and phytosanitary (SPS) and technical barriers to trade (TBT).
| Whole Sample (HS01–97) | Agriculture (HS01–24) | Manufacture (HS25–97) | ||||
|---|---|---|---|---|---|---|
| EXTS | 0.54 *** | 0.54 *** | 1.15 *** | 1.16 *** | 0.51 *** | 0.51 *** |
| (0.02) | (0.02) | (0.05) | (0.04) | (0.02) | (0.02) | |
| IMDC | 0.33 *** | 0.33 *** | 0.29 *** | 0.30 *** | 0.34 *** | 0.34 *** |
| (0.03) | (0.03) | (0.04) | (0.03) | (0.03) | (0.03) | |
| EXPC | 0.14 *** | 0.13 *** | 0.19 *** | 0.21 *** | 0.14 *** | 0.13 *** |
| (0.03) | (0.03) | (0.06) | (0.05) | (0.03) | (0.03) | |
| Tariff | −0.25 *** | 0.41 ** | −0.24 *** | |||
| (0.08) | (0.18) | (0.08) | ||||
| DTBT | −0.05 | −0.04 | 0.00 | 0.08 | −0.03 | −0.01 |
| (0.09) | (0.09) | (0.14) | (0.12) | (0.09) | (0.09) | |
| DSPS | 0.06 | 0.05 | −0.09 | −0.07 | 0.12 ** | 0.10 * |
| (0.05) | (0.05) | (0.12) | (0.10) | (0.05) | (0.05) | |
| RER | −0.60 *** | −0.72 *** | −1.17 ** | −0.19 | −0.58 *** | −0.70 *** |
| (0.19) | (0.22) | (0.51) | (0.53) | (0.19) | (0.23) | |
| Internet | 0.12 *** | −0.42 *** | 0.12 *** | |||
| (0.04) | (0.10) | (0.04) | ||||
| Constant | 0.03 | −0.33 | −8.55 *** | −9.73 *** | 0.37 | 0.01 |
| (0.57) | (0.52) | (1.66) | (1.34) | (0.57) | (0.53) | |
| Pseudo log likelihood | −132,000,000 | −132,000,000 | −1,110,000 | −1,020,000 | −122,000,000 | −121,000,000 |
| Obs.# | 1248 | 1248 | 312 | 312 | 936 | 936 |
| R2 | 0.95 | 0.96 | 0.87 | 0.91 | 0.95 | 0.95 |
Standard errors in parentheses; * p < 0.10, ** p < 0.05, *** p < 0.01.
Table A10.
Estimation results of Korea: Interacted dummies with SPS and TBT.
Table A10.
Estimation results of Korea: Interacted dummies with SPS and TBT.
| Whole Sample (HS01–97) | Agriculture (HS01–24) | Manufacture (HS25–97) | ||||
|---|---|---|---|---|---|---|
| EXTS | 0.36 *** | 0.36 *** | 0.99 *** | 0.99 *** | 0.32 *** | 0.32 *** |
| (0.04) | (0.04) | (0.05) | (0.05) | (0.04) | (0.04) | |
| IMDC | 0.53 *** | 0.53 *** | 0.12 *** | 0.12 *** | 0.55 *** | 0.55 *** |
| (0.03) | (0.03) | (0.03) | (0.03) | (0.03) | (0.03) | |
| EXPC | 0.17 *** | 0.17 *** | −0.07 | −0.08 | 0.17 *** | 0.17 *** |
| (0.04) | (0.04) | (0.06) | (0.06) | (0.04) | (0.04) | |
| Tariff | −0.10 | −0.77 *** | −0.11 | |||
| (0.13) | (0.17) | (0.13) | ||||
| DTBT | −0.02 | −0.02 | −0.20 | −0.19 | −0.01 | −0.00 |
| (0.16) | (0.16) | (0.14) | (0.14) | (0.16) | (0.16) | |
| DSPS | 0.16 | 0.16 | 0.21 * | 0.23 * | 0.24 | 0.24 |
| (0.19) | (0.19) | (0.12) | (0.12) | (0.20) | (0.20) | |
| RER | −0.09 | −0.14 | 0.11 | −0.97 * | −0.09 | −0.16 |
| (0.28) | (0.37) | (0.38) | (0.50) | (0.27) | (0.36) | |
| Internet | 0.03 | 0.45 *** | 0.04 | |||
| (0.08) | (0.09) | (0.08) | ||||
| Constant | −2.43 * | −2.46 | −1.89 | 1.18 | −2.03 | −1.99 |
| (1.38) | (1.69) | (2.22) | (2.59) | (1.35) | (1.66) | |
| Pseudo log likelihood | −226,000,000 | −226,000,000 | −1,620,000 | −1,610,000 | −213,000,000 | −213,000,000 |
| Obs.# | 1248 | 1248 | 312 | 312 | 936 | 936 |
| R2 | 0.84 | 0.84 | 0.74 | 0.75 | 0.84 | 0.84 |
Standard errors in parentheses; * p < 0.10, ** p < 0.05, *** p < 0.01
References
- Hirschman, A. National Power and the Struggle of Foreign Trade; University of California Press: Berkeley, CA, USA, 1945. [Google Scholar]
- Polachek, S.W. Conflict and trade. J. Confl. Resolut. 1980, 24, 55–78. [Google Scholar] [CrossRef]
- Madhur, S. China-Japan-Korea FTA: A Dual Track Approach to a Trilateral Agreement. J. Econ. Integr. 2013, 28, 375–395. [Google Scholar] [CrossRef]
- China FTA Network. China’s Free Trade Agreements. Available online: http://fta.mofcom.gov.cn/english/index.shtml (accessed on 1 September 2019).
- Ghodsi, M.; Gruebler, J.; Reiter, O.; Stehrer, R. Database and Analysis Linking NTMs in Goods and Services and Global Supply Chains: How Do Different Types of Non-Tariff Measures Affect Trade and Productivity? Vienna Institute for International Economic Studies Working Paper; Institute for International Economic Studies: Vienna, Austria, 2016. [Google Scholar]
- Grant, J.H.; Arita, S. Sanitary and Phyto-Sanitary Measures: Assessment, Measurement, and Impact; IATRC Commissioned Paper. In Proceedings of the International Agricultural Trade Research Consortium, Washington, DC, USA, 3–5 December 2017. [Google Scholar]
- Santeramo, F.G.; Lamonaca, E. The Effects of Non-tariff Measures on Agri-food Trade: A Review and Meta-analysis of Empirical Evidence. J. Agricul. Econ. 2019, 70, 595–617. [Google Scholar] [CrossRef]
- Wood, J.; Wu, J.; Li, Y.; Jang, H. The Economic Impact of SPS Measures on Agricultural Exports to China: An Empirical Analysis Using the PPML Method. Soc. Sci. 2017, 6, 51. [Google Scholar] [CrossRef]
- Wood, J.; Wu, J.; Li, Y.; Kim, J. TBT and SPS Impacts on Korean exports to China: Empirical analysis using the PPML method. Asian-Pac. Econ. Lit. 2017, 31, 96–114. [Google Scholar] [CrossRef]
- Xiong, B.; Beghin, J.C. Does European aflatoxin regulation hurt groundnut exporters from Africa? Eur. Rev. Agric. Econ. 2012, 39, 589–609. [Google Scholar] [CrossRef]
- Xiong, B.; Beghin, J.C. Disentangling demand-enhancing and trade-cost effects of maximum residue regulations. Econ. Inequal. 2014, 52, 1190–1203. [Google Scholar] [CrossRef]
- Webb, M.; Strutt, A.; Gibson, J.; Walmsley, T. Modelling the impact of non-tariff measures on supply chains in the Asia-Pacific Region. In Proceedings of the 20th Annual Conference on Global Economic Analysis, West Lafayette, IN, USA, 7–9 June 2017. [Google Scholar]
- Beghin, J.C.; Maertens, M.; Swinnen, J. Nontariff Measures and Standards in Trade and Global Value Chains. Annu. Review Res. Econ. 2015, 7, 425–450. [Google Scholar] [CrossRef]
- Walmsley, T.; Strutt, A. Improving the Modelling of Non-Tariff Measures in a CGE Framework. In Proceedings of the 22nd Annual Conference on Global Economic Analysis, Warsaw, Poland, 19–21 June 2019. [Google Scholar]
- Ferro, E.; Otsuki, T.; Wilson, J.S. The effect of product standards on agricultural exports. Food Policy 2015, 50, 68–79. [Google Scholar] [CrossRef]
- Bora, B.; Kuwahara, A.; Laird, S. Quantification of Non-Tariff Measures; Policy Issues in International Trade and Commodities Study Series; United Nations: Nova Iorque, NY, USA, 2002. [Google Scholar]
- Arita, S.; Beckman, J.; Mitchell, L. Reducing transatlantic barriers on US-EU agri-food trade: What are the possible gains? Food Policy 2017, 68, 233–247. [Google Scholar] [CrossRef]
- Schlueter, S.W.; Wieck, C.; Heckelei, T. Regulatory policies in meat trade: Is there evidence for least trade-distorting sanitary regulations? Am. J. Econ. 2009, 91, 1484–1490. [Google Scholar] [CrossRef]
- Beckman, J.; Arita, S. Modeling the Interplay between Sanitary and Phytosanitary Measures and Tariff-rate Quotas under Partial Trade Liberalization. Am. J. Agric. Econ. 2016, 99, 1078–1095. [Google Scholar] [CrossRef]
- Alaeibakhsh, S.; Ardakani, Z. Quantifying the Trade Effects of SPS and TBT Agreements on Exports of Pistachios from Iran. World Appl. Sci. J. 2012, 16, 637–641. [Google Scholar]
- Hoda, E.E.; Rana, H.; Chahir, Z. Do SPS measures matter for margins of trade? Evidence from firm-level data. Appl. Econ. 2016, 48, 1949–1964. [Google Scholar]
- Cardamone, P. The effect of preferential trade agreements on monthly fruit exports to the European Union. Eur. Rev. Agric. Econ. 2011, 38, 553–586. [Google Scholar] [CrossRef]
- Swann, P.; Temple, P.; Shurmer, M. Standards and trade performance: The UK experience. Econ. J. 1996, 106, 1297–1313. [Google Scholar] [CrossRef]
- Moenius, J. Information versus Product Adaptation: The Role of Standards in Trade; Kellogg School of Management Working Paper; Northwestern University: Evanston, IL, USA, 2004. [Google Scholar]
- Choi, B.Y.; Bang, H.K.; Lee, B.R.; Yoo, S.B. A Proposal to Lower Non-Tariff Barriers of China, Japan and Korea; KIEP: Sejong, Korea, 2015. [Google Scholar]
- Li, Y.; Beghin, J.C. A meta-analysis of estimates of the impact of technical barriers to trade. J. Policy Model. 2012, 34, 497–511. [Google Scholar] [CrossRef]
- De Frahan, B.H.; Vancauteren, M. Harmonisation of food regulations and trade in the Single Market: evidence from disaggregated data. Eur. Rev. Agric. Econ. 2006, 33, 337–360. [Google Scholar] [CrossRef]
- Crivelli, P.; Gröschl, J. The impact of sanitary and phytosanitary measures on market entry and trade flow. World Econ. 2016, 39, 444–473. [Google Scholar] [CrossRef]
- Anders, S.; Caswell, J.A. Standards-as-barriers versus standards-as-catalysts: Assessing the impact of HACCP implementation on U.S. seafood imports. Am. J. Agric. Econ. 2009, 91, 310–321. [Google Scholar] [CrossRef]
- Disdier, A.C.; Marette, S. The combination of gravity and welfare approaches for evaluating non-tariff measures. Am. J. Agric. Econ. 2010, 92, 713–726. [Google Scholar] [CrossRef]
- Maskus, K.E.; Otsuki, T.; Wilson, J.S. The Cost of Compliance with Product Standards for Firms in Developing Countries: An Econometric Study; World Bank Policy Research Working Paper; World Bank: Washington, DC, USA, 2005. [Google Scholar]
- Decreux, Y.; Milner, C.; Péridy, N. Some New Insights into the Effects of the EU-South Korea Free Trade Area: The Role of Non-Tariff Barriers. J. Econ. Integr. 2010, 25, 783–817. [Google Scholar] [CrossRef]
- Santos Silva, J.M.C.; Tenreyro, S. The Log of Gravity. Rev. Econ.Stat. 2006, 88, 641–658. [Google Scholar] [CrossRef]
- Santos Silva, J.M.C.; Tenreyro, S. Further Simulation Evidence on the Performance of the Poisson Pseudo-Maximum Likelihood Estimator. Econ. Lett. 2011, 112, 220–222. [Google Scholar] [CrossRef]
- Devadason, E.S.; Chennayah, S. Proliferation of Non-tariff measures in China-The Relevance for ASEAN. Singap. Econ. Rev. 2014, 59, 1–28. [Google Scholar] [CrossRef]
- UN Comtrade. International Trade and Statistics Database. Available online: https://comtrade.un.org/ (accessed on 1 September 2019).
- Wang, J.; Mei, L. Dynamics of Labor-Intensive Clusters in China: Relying on Low Labor Costs or Cultivating Innovation; International Institute for Labor Studies: Geneva, Switzerland, 2009. [Google Scholar]
- Matschke, X.; Sherlund, S. Do labor issues matter in the determination of U.S. trade policy? An empirical reevaluation. Am. Econ. Rev. 2006, 96, 405–421. [Google Scholar] [CrossRef][Green Version]
- Dur, A.; De Bièvre, D. The Question of Interest Group Influence. In Opening EU-Governance to Civil Society Gains and Challenges; Connex: Mannheim, Germany, 2008; pp. 25–43. [Google Scholar]
- Baumgartner, F.; Berry, J.; Hojnacki, M.; Kimball, D.; Leech, B. Lobbying and Policy Change. Who wins, Who Loses and Why? The University of Chicago Press: London, UK, 2009. [Google Scholar]
- Capling, A.; Low, P. Government, Non-state actors and trade policy making. In Negotiating Preferentially or Multilaterally; CUP: New York, NY, USA, 2010. [Google Scholar]
- Griswold, G. Unions, Protectionism, and U.S Competitiveness. Cato J. 2010, 30, 191–196. [Google Scholar]
- De Bièvre, D.; Eckhardt, J. Interest groups and EU anti-dumping policy. J. Eur. Pub. Policy 2011, 18, 339–360. [Google Scholar] [CrossRef]
- Gamboa, R. Interest Groups in Foreign Trade Negotiations: Chile, Colombia and Peru in a Comparative Perspective; Working Paper; World Trade Institute: Bern, Switzerland, 2013. [Google Scholar]
- Revealed Comparative Advantages (RCA) database, CEPII. Available online: https://unctadstat.unctad.org/EN/RcaRadar.html (accessed on 1 September 2019).
- Korea International Trade Association (KITA) database. Available online: http://www.kita.org/ (accessed on 1 September 2019).

© 2019 by the authors. Licensee MDPI, Basel, Switzerland. This article is an open access article distributed under the terms and conditions of the Creative Commons Attribution (CC BY) license (http://creativecommons.org/licenses/by/4.0/).