1. Introduction
Between 1995 and 2015, India halved the proportion of population without access to improved drinking water [
1]. However, improved water can still have a high total dissolved solids (TDS) content, particularly related to salinity [
2] as well as pathogens. This results in the need to purify the water before it is safe for consumption.
To purify the water, urban consumers in India have several options. Tap water can be boiled at home using domestic boilers or cookers, be purchased in a bottle or be purified at home using a domestic reverse-osmosis (RO) device. All these options will be associated with some negative environmental impacts related to climate change, natural resource use, and water availability and quality. The global market for RO devices is growing as well as consumer awareness of environmental issues, but until now there has been a lack of scientific evidence on the impacts of consuming water from RO devices as compared to the alternatives. Existing comparative Life Cycle Assessment (LCA) studies on drinking water were primarily based on Western markets (EU/USA) [
3,
4,
5]. Focusing on carbon footprint alone, the meta-analysis by Fantin, Scalbi, Ottaviano and Masoni [
4] determined that tap water has lower impact than bottled water. Garfí, Cadena, Sanchez-Ramos and Ferrer [
5] looked at several water provisioning systems in Barcelona (Spain) including a RO device and concluded that this system was significantly less impactful on the environment than bottled water and on par with tap water. Garfí’s study however did not include the impacts from the production of the device itself. Drinking water straight from the tap is not a possibility in India, while boiled water was not considered in the analysis of Garfí. There was one study conducted in Vietnam, which concluded that bottled water was environmentally preferable to boiled water [
6]. However, this study did not include a RO device and some key variables affecting this relative comparison differed substantially to systems available in India: (i) the source of heating used in the boiled water system and (ii) the type of bottled-water system available to the consumer. Tandon, et al. [
7] surveyed eight local bottling companies in India and evaluated their water and energy footprint but did not compare the results to the RO system.
In this study, we analyzed and compared environmental impacts of several drinking-water provisioning systems in India: an in-home RO device marketed under the Pureit® brand (manufactured by Unilever), purchased bottled water, and in-home boiling of water. The RO device was the most complex device in the Pureit® portfolio at the time of the study and it was chosen over other systems (such as gravity-fed purification systems) to represent a worst-case scenario in terms of impacts.
2. Materials and Methods
LCA is a scientific approach that allows for a systematic comparison of the environmental impacts of products, processes, and systems. To avoid shifting of environmental burdens, the approach covers a broad range of environmental impacts considered over the whole product life cycle. Standard attributional LCA methodology was applied, following the principles of ISO14040 standard (ISO, 2006). The methodology consists of four phases: the goal and scope definition, inventory analysis, impact assessment, and interpretation of results.
2.1. Goal and Scope Definition
The main goal of this study was to compare the potential environmental impacts of the following systems for providing safe domestic potable water in India:
The uniform unit for comparison (functional unit) was chosen as “the provision of 20 m3 of microbiologically safe water at home”. This functional unit represents the approximate volume of purified water provided by the considered RO device during its minimum expected lifespan of 5 years. Results can be easily scaled to 1 L of water by dividing the result by a factor of 20,000.
System Boundaries
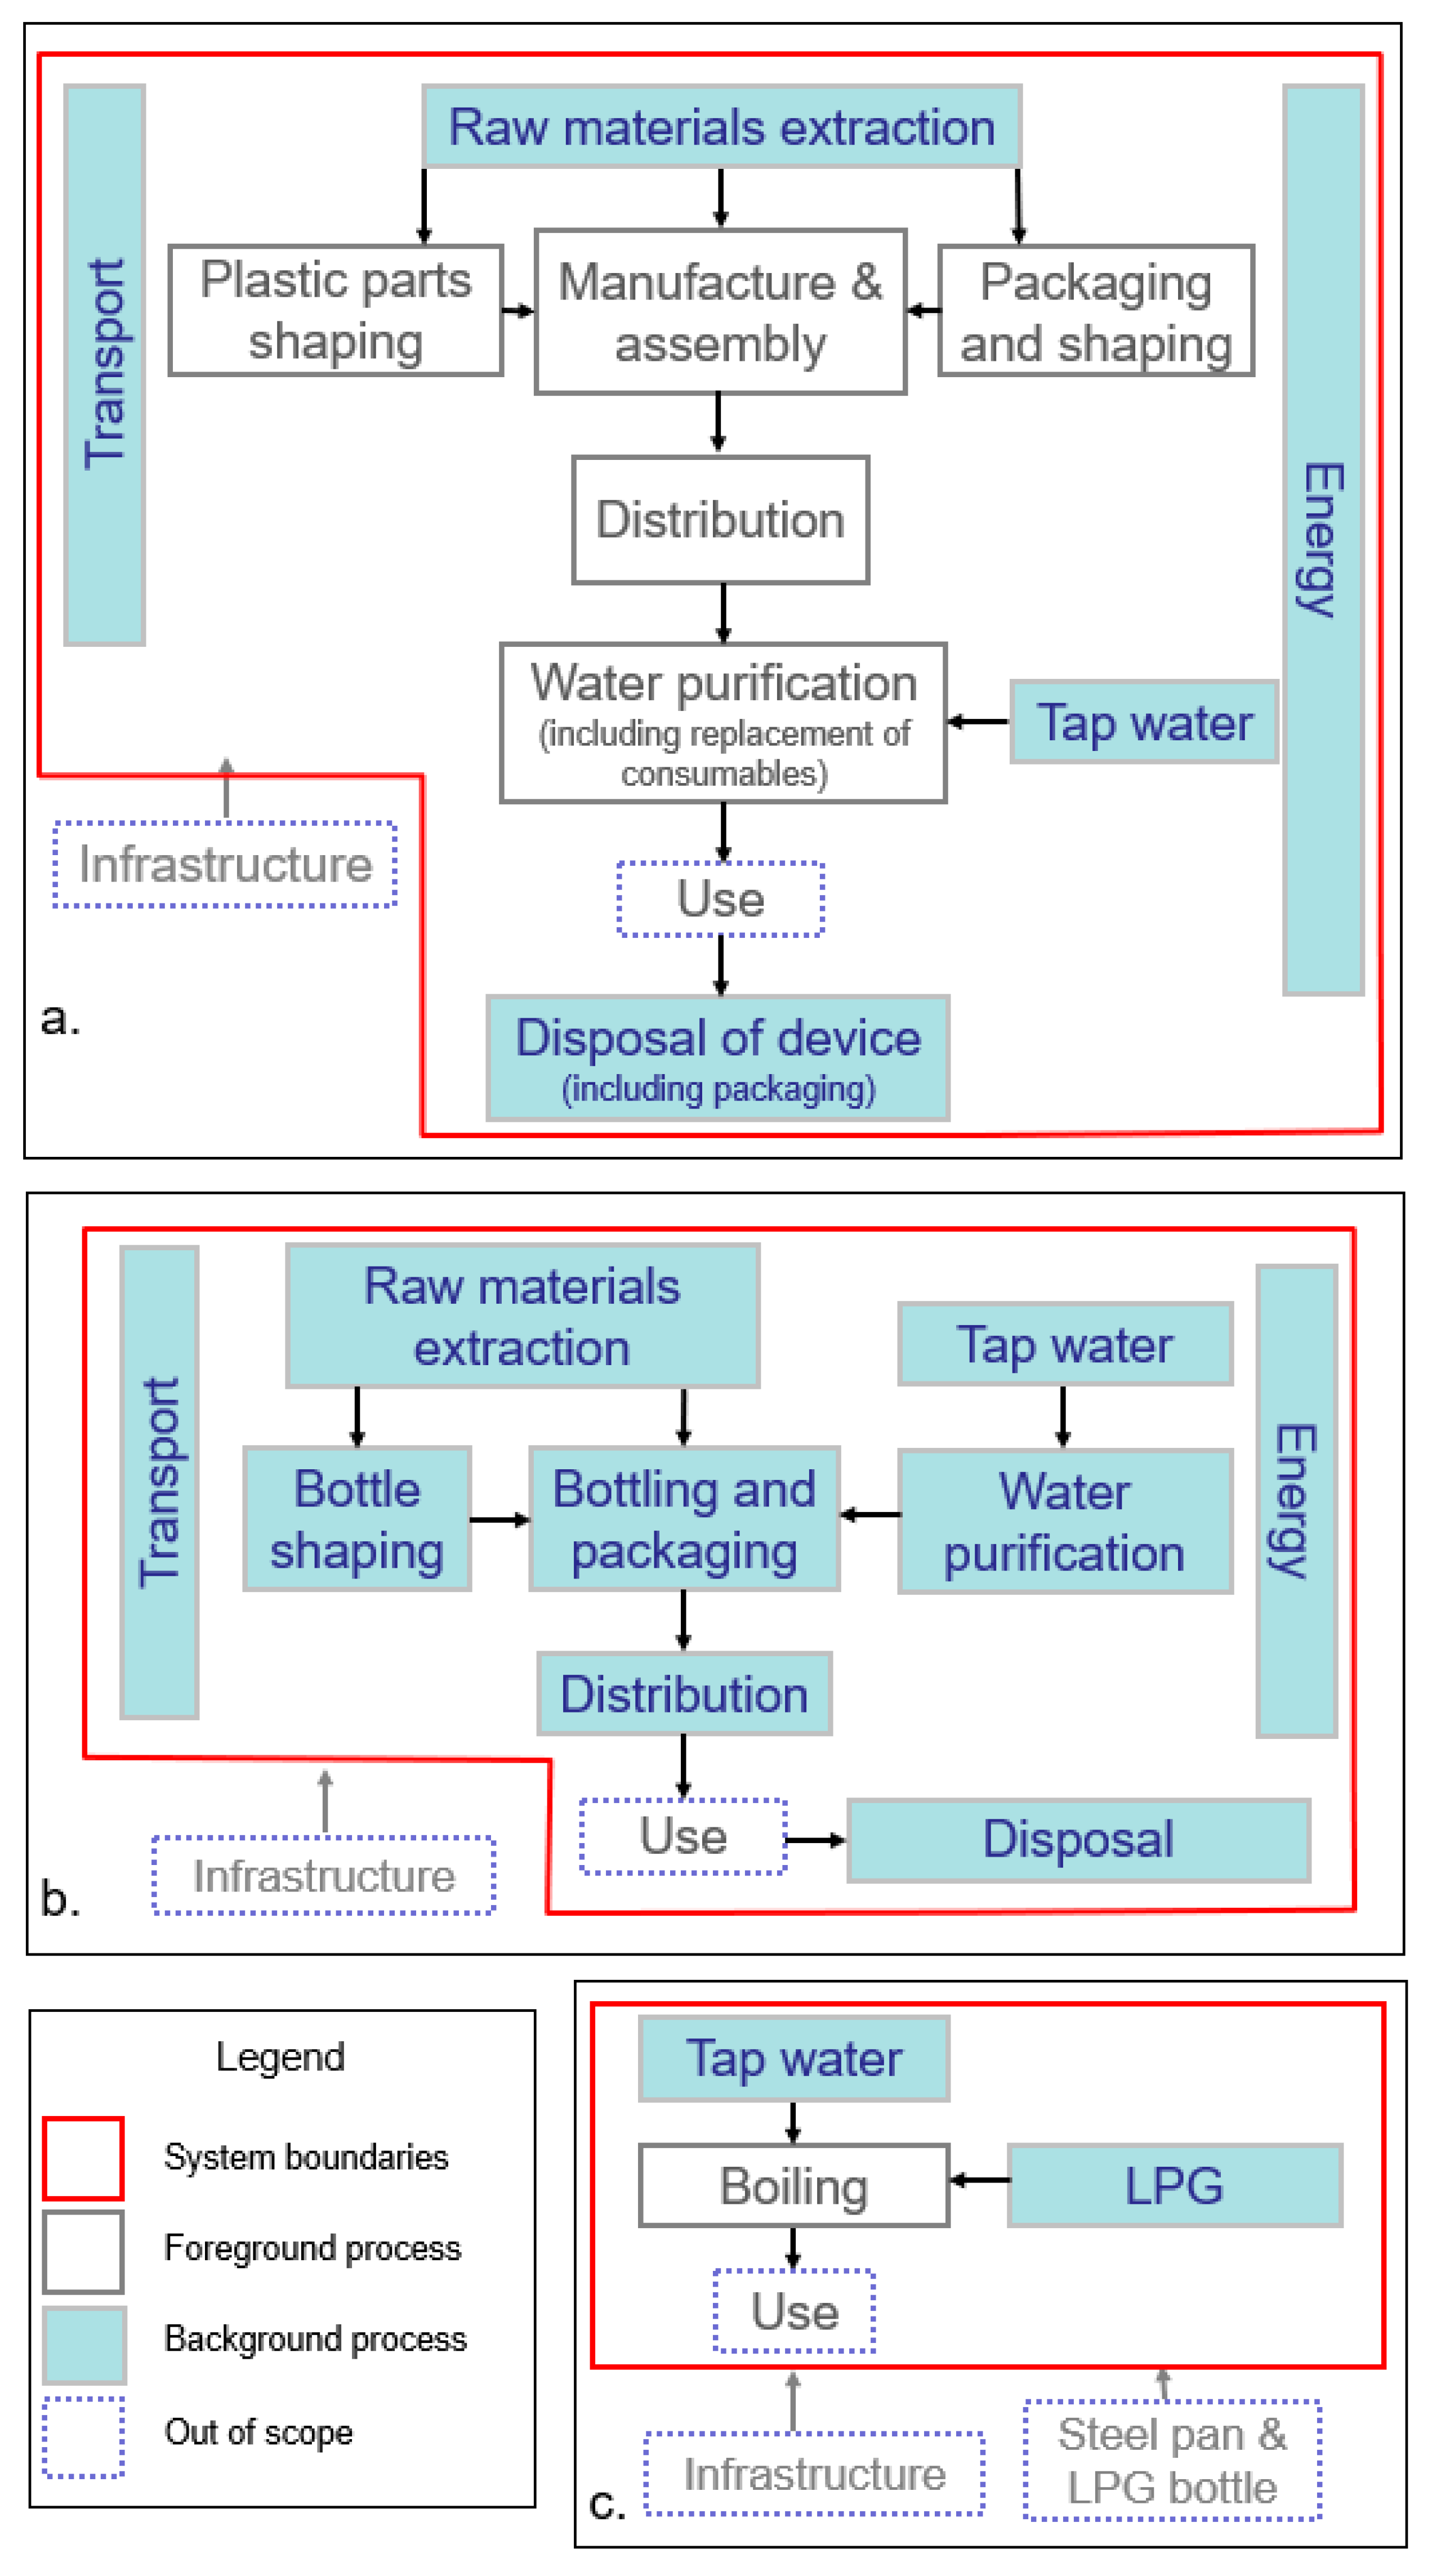
The life cycle stages and boundaries for the three safe drinking-water provision systems are shown in
Figure 1. The study covered the raw material production, manufacturing, transport, consumer use, and disposal. The work covered at least 95% of the input and output flows for all systems. Key aspects of the system boundaries are as follows:
RO device. Includes primary data on the energy and material use for the molding and assembly of the device, consumables and its packaging, distribution of the device to retail, tap water production, water and electricity use of the device at home under typical conditions, disposal of the device, consumables and packaging.
Bottled water. Includes tap water production, purification and desalination of tap water at the bottling plant, the manufacture and transport of empty bottles, the bottling and packaging operations, distribution to retail, and the disposal of bottle and other packaging after use.
Boiled water. Covers the manufacturing, distribution and burning of Liquified Petroleum Gas (LPG), and tap water production. The impact contribution from both the lidded steel cooking pan and the steel LPG container are considered to be minimal—they are reused a large number of times for various cooking purposes and can last up to 15–20 years [
9]. For this reason, they were excluded from the analysis.
A cut-off approach was applied for recycling: for all the materials that would be recycled at the end of life no credit was allocated but also no burden from their disposal. All impacts from the recycling process downstream would be allocated to the product using recycled material while all the upstream impacts are allocated to the primary product from which the recycled material is derived.
Activities such as refrigeration, heating or any other use of the water by the consumer beyond drinking it at room temperature were excluded from the system boundary. It was considered that these will be equivalent for the three systems.
Wastewater treatment has been left out of scope due to the limited coverage of wastewater treatment plants in India [
10].
Due to negligible expected impacts and the fact that these impacts will be similar for the three analyzed systems, infrastructure systems (buildings) were outside of the analysis for foreground datasets (which have been modelled directly). However, some background datasets sourced from the third-party ecoinvent database [
11] will include these by default.
2.2. Inventory Analysis
2.2.1. Process Flows of the Three Systems
A summary of process inputs and outputs of the three systems is shown on
Table 1 (
Table A1,
Table A2 and
Table A3 include further details,
Table A4 is based on 1 L of water and
Appendix A.3 is a full description of the systems). Unless stated otherwise, ecoinvent v 2.2 database was used as a source of life cycle inventory data [
11]. GaBi 6.4 LCA software by Thinkstep [
12] was used to model the three systems. Several adaptations were made to make generic ecoinvent datasets more relevant to the Indian context. This is further explained in
Appendix B.
2.2.2. Water Life Cycle Inventory
The Quantis water database [
13] was used to calculate the water life cycle inventory (“blue” and “green” water as per Hoekstra, et al. [
14]). Approximately 36% of the water ingested after drinking is lost to the atmosphere through “insensible water loss”—invisible vaporization from lungs and skin under normal perspiration conditions [
15]. It is, therefore, reasonable to consider that the other 64% will be returned to the same watershed and therefore will not count towards the blue water consumption. It was also assumed that water from pipeline leakages will return to the same watershed and therefore it does not contribute to the blue water consumption.
The tap water used in the boiled water system and the RO device will be withdrawn—in most cases—from the same watershed that it returns to. This was also assumed for the case where the bottled water is transported only 100 km (best-case scenario—see
Section 2.4 Sensitivity analysis). Therefore, the direct blue water (at the point of use) consumed will be the same for those three systems. However, in the worst-case bottled-water scenario where it is transported for 1300 km before reaching the consumer, it can be assumed that water is transferred to another watershed. In this case, all water considered will be consumed as blue water.
2.3. Impact Assessment
ReCiPe v1.08 methodology (Hierarchic) at the midpoint level (without normalization and weighting) was the method chosen for impact assessment. The following impacts were considered for detailed analysis and presentation in the paper: climate change (excluding biogenic carbon), freshwater eutrophication, terrestrial acidification, fossil depletion, and photochemical oxidant formation. These impact categories were selected for illustration as they cover aspects of water quality, resource use, and climate—issues relevant for studied systems and relevant in India.
Green and blue water consumption inventories were considered to be impact categories following the data and methodology of the Quantis water database [
13] and the Hoekstra, Chapagain, Aldaya and Mekonnen [
14] method. According to this method, green water refers to the rainwater consumed (evaporated) and blue water refers to the volume of surface and groundwater consumed as a result of the production of a good. This is different from the ReCiPe Water Depletion impact category, which accounts for the water use (abstracted) from lakes, rivers, wells, and unspecified origin.
2.4. Sensitivity Analysis
We performed sensitivity analysis to test the impact of uncertain model parameters on the study conclusions.
Table 2 and
Table 3 describe different scenarios that were used in the sensitivity analysis and
Appendix A.3 contains the reasoning and references for these choices. Each column represents one scenario that was considered. These were developed to verify that the main study conclusions are independent of model uncertainties.
3. Results
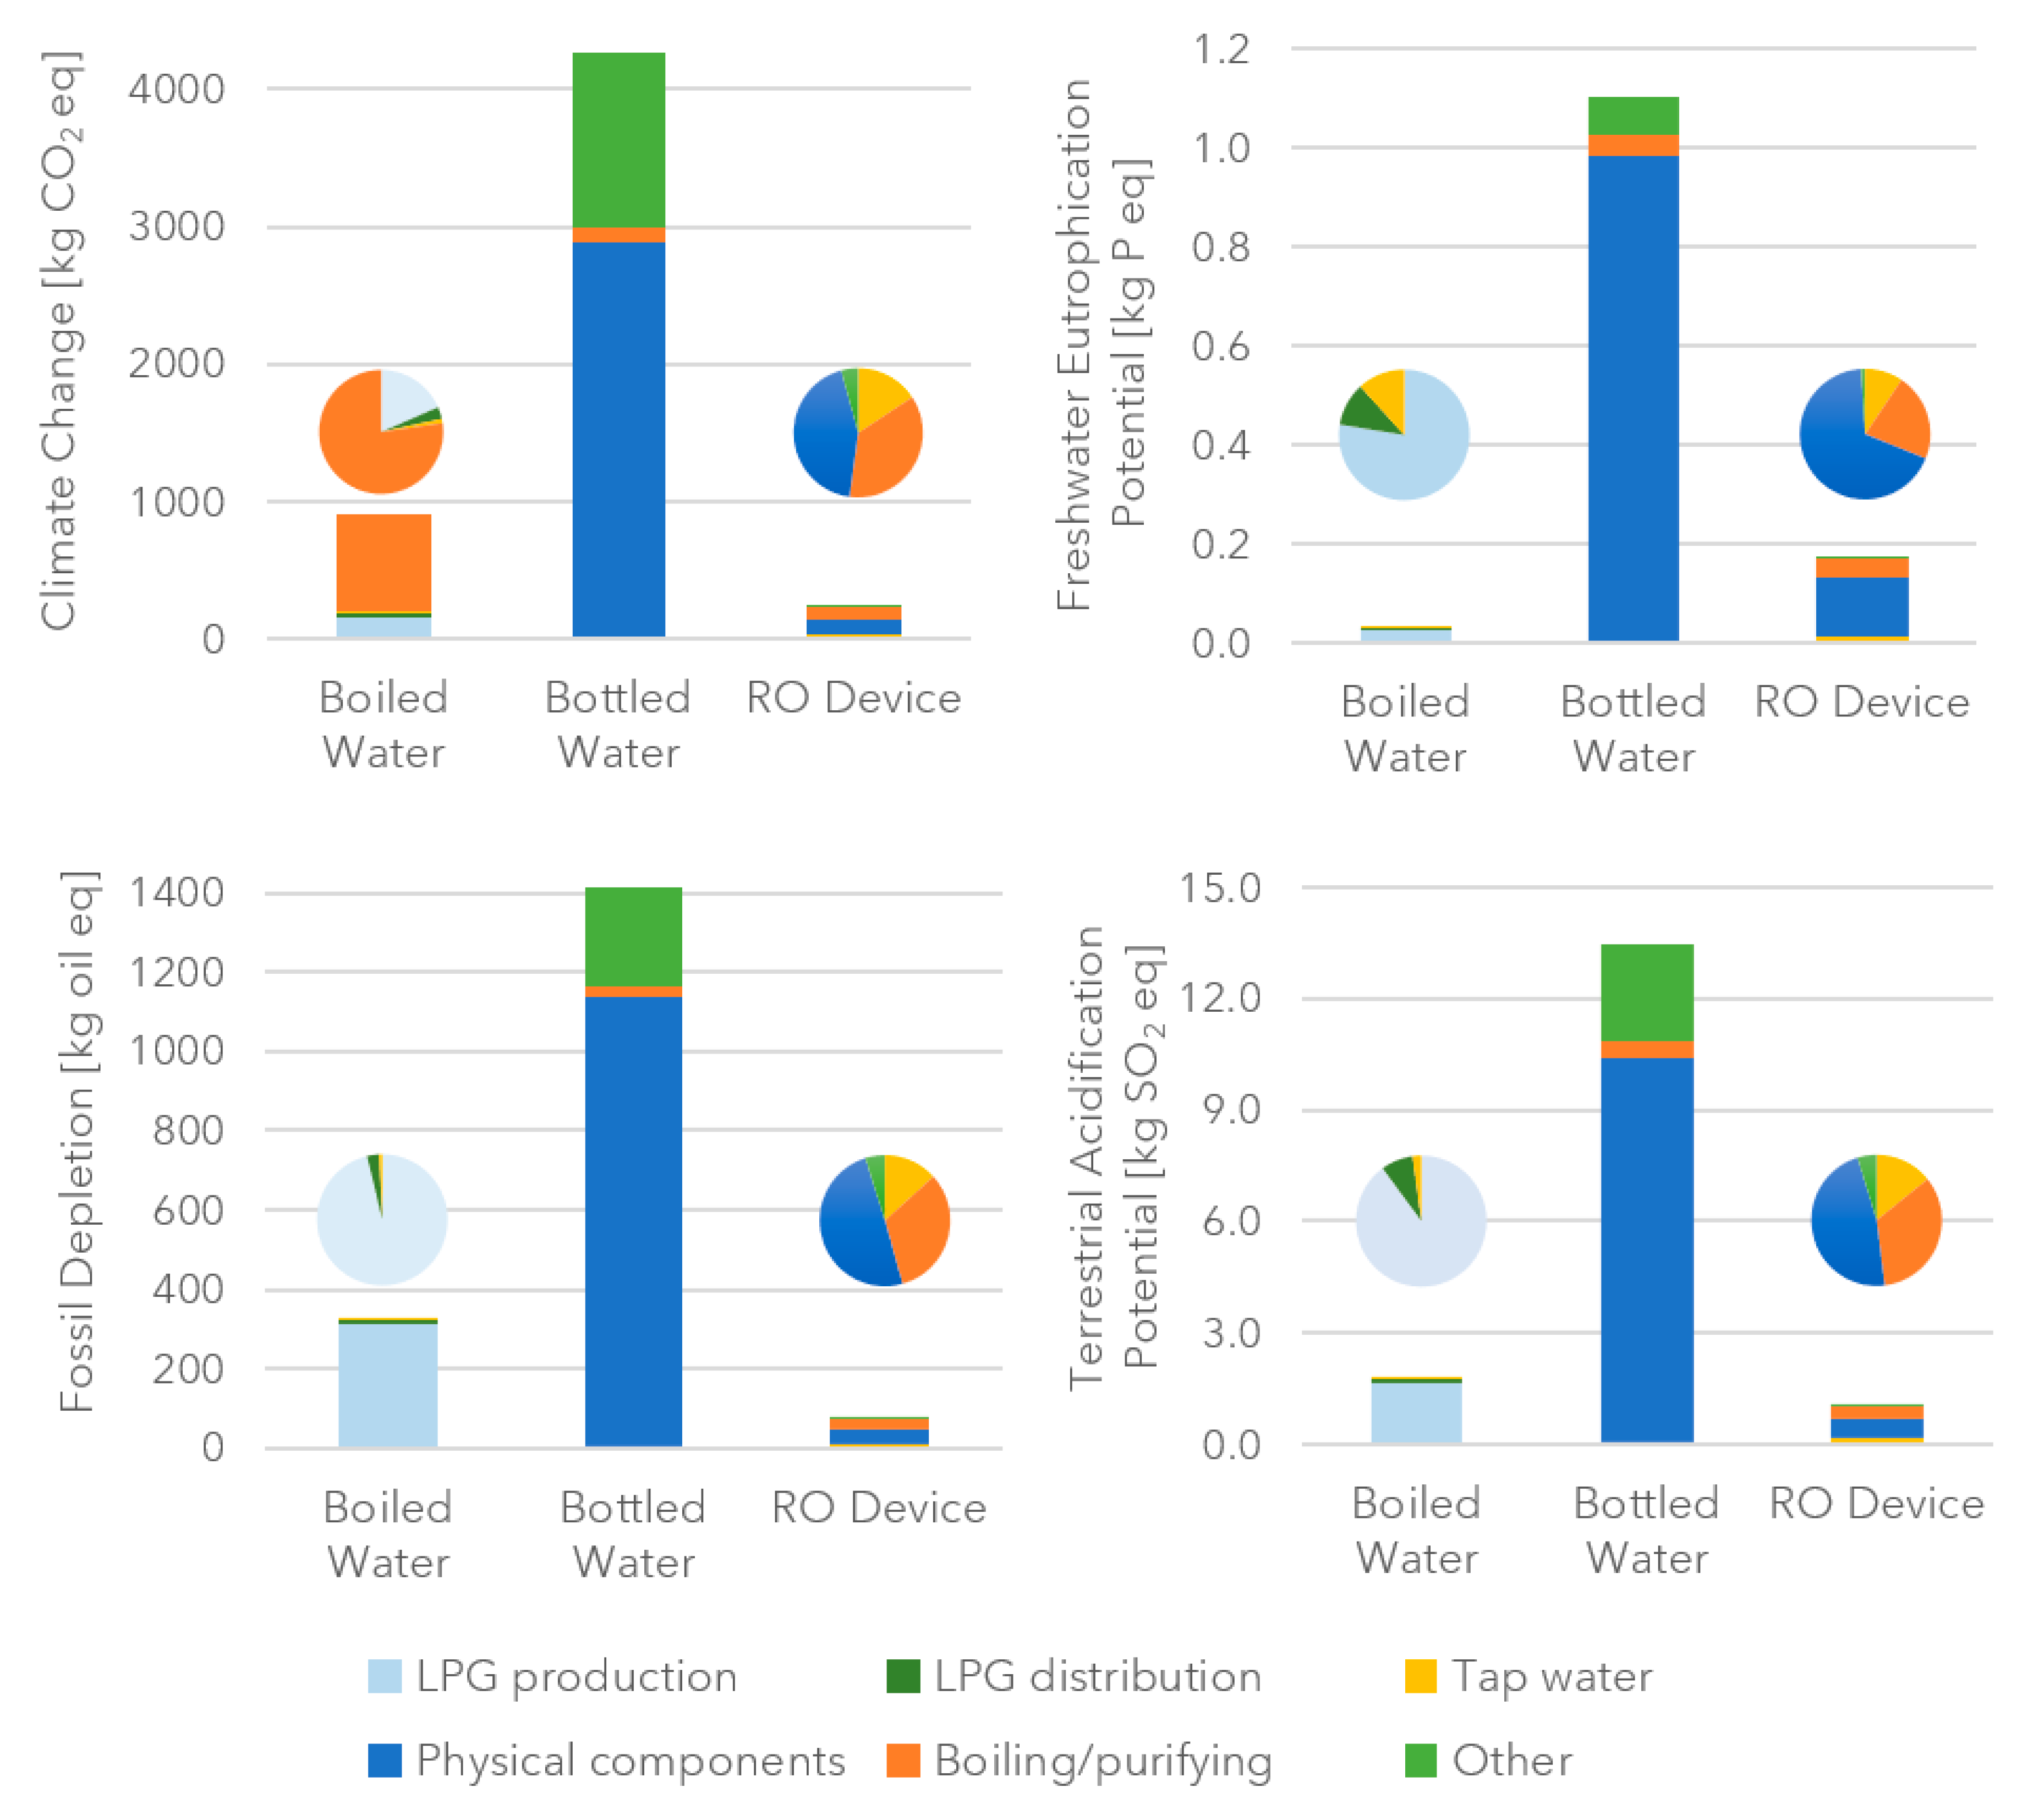
Figure 2 summarizes the outcomes of the environmental impact assessment for the three systems under study and four impact categories: climate change, freshwater eutrophication potential, fossil depletion, and terrestrial acidification potential. The full list of ReCiPe results can be found in the
Appendix C. Results of water quantity assessment are presented in
Table 4.
3.1. RO Device
The use of the RO device was associated with the lowest climate change impact and fossil energy depletion out of the analyzed systems. The major contributors to the climate change impact category were the raw materials and the manufacturing of the main unit and consumables (44% in total), the electricity used in purification process (36%) and the tap water (16%). The relatively high contribution of tap water stems from the fact that four liters of tap water are required in a RO device to provide one liter of purified water. The fossil resource use was driven by the electricity use for purification (32%) and the production of the main unit components (49%). Freshwater eutrophication potential of the RO device was higher than that of boiling and this was mainly driven by the “physical components” (68%) out of which the main contribution was from the production of electronic components (56% of the total impact), especially its copper elements, as copper mining is associated with the emissions of sulfidic mine tailings [
18].
3.2. Bottled Water
Bottled water was found to be associated with the highest environmental impacts for nearly all considered impact categories. Most of these impacts were driven by the production of the bottle and the cap—73% in case of the climate change impact, 89% for freshwater eutrophication potential, 77% of terrestrial acidification potential and 80% for fossil resource depletion. The blue and green water consumption were also driven by bottle and cap manufacturing (78%) either by the raw materials (PET) or the electricity used in plastic shaping processes.
3.3. Boiled Water
The boiled water system had lower climate change and fossil depletion impacts than the bottled water, but higher than the RO device. Most of the climate change and fossil depletion impacts in the boiled water system could be attributed to the production (22%) and the burning (77%) of LPG. As the use of a covered pot was assumed for boiling the water, the evaporation losses were considered minimal. No difference was therefore found in the direct blue water use. The highest overall total water consumption was three times higher for the bottled water than the boiled water and the RO device. Also, freshwater eutrophication potential was the lowest for the boiled water and mainly associated with the production and the distribution of LPG, specifically electricity used in this process. This strong correlation with electricity was caused by the high proportion of energy produced in India by coal power plants (68% of the energy produced [
19]) and the nitrogen oxides emissions associated with coal burning [
20]. Terrestrial eutrophication potential was within the same range as for the RO device.
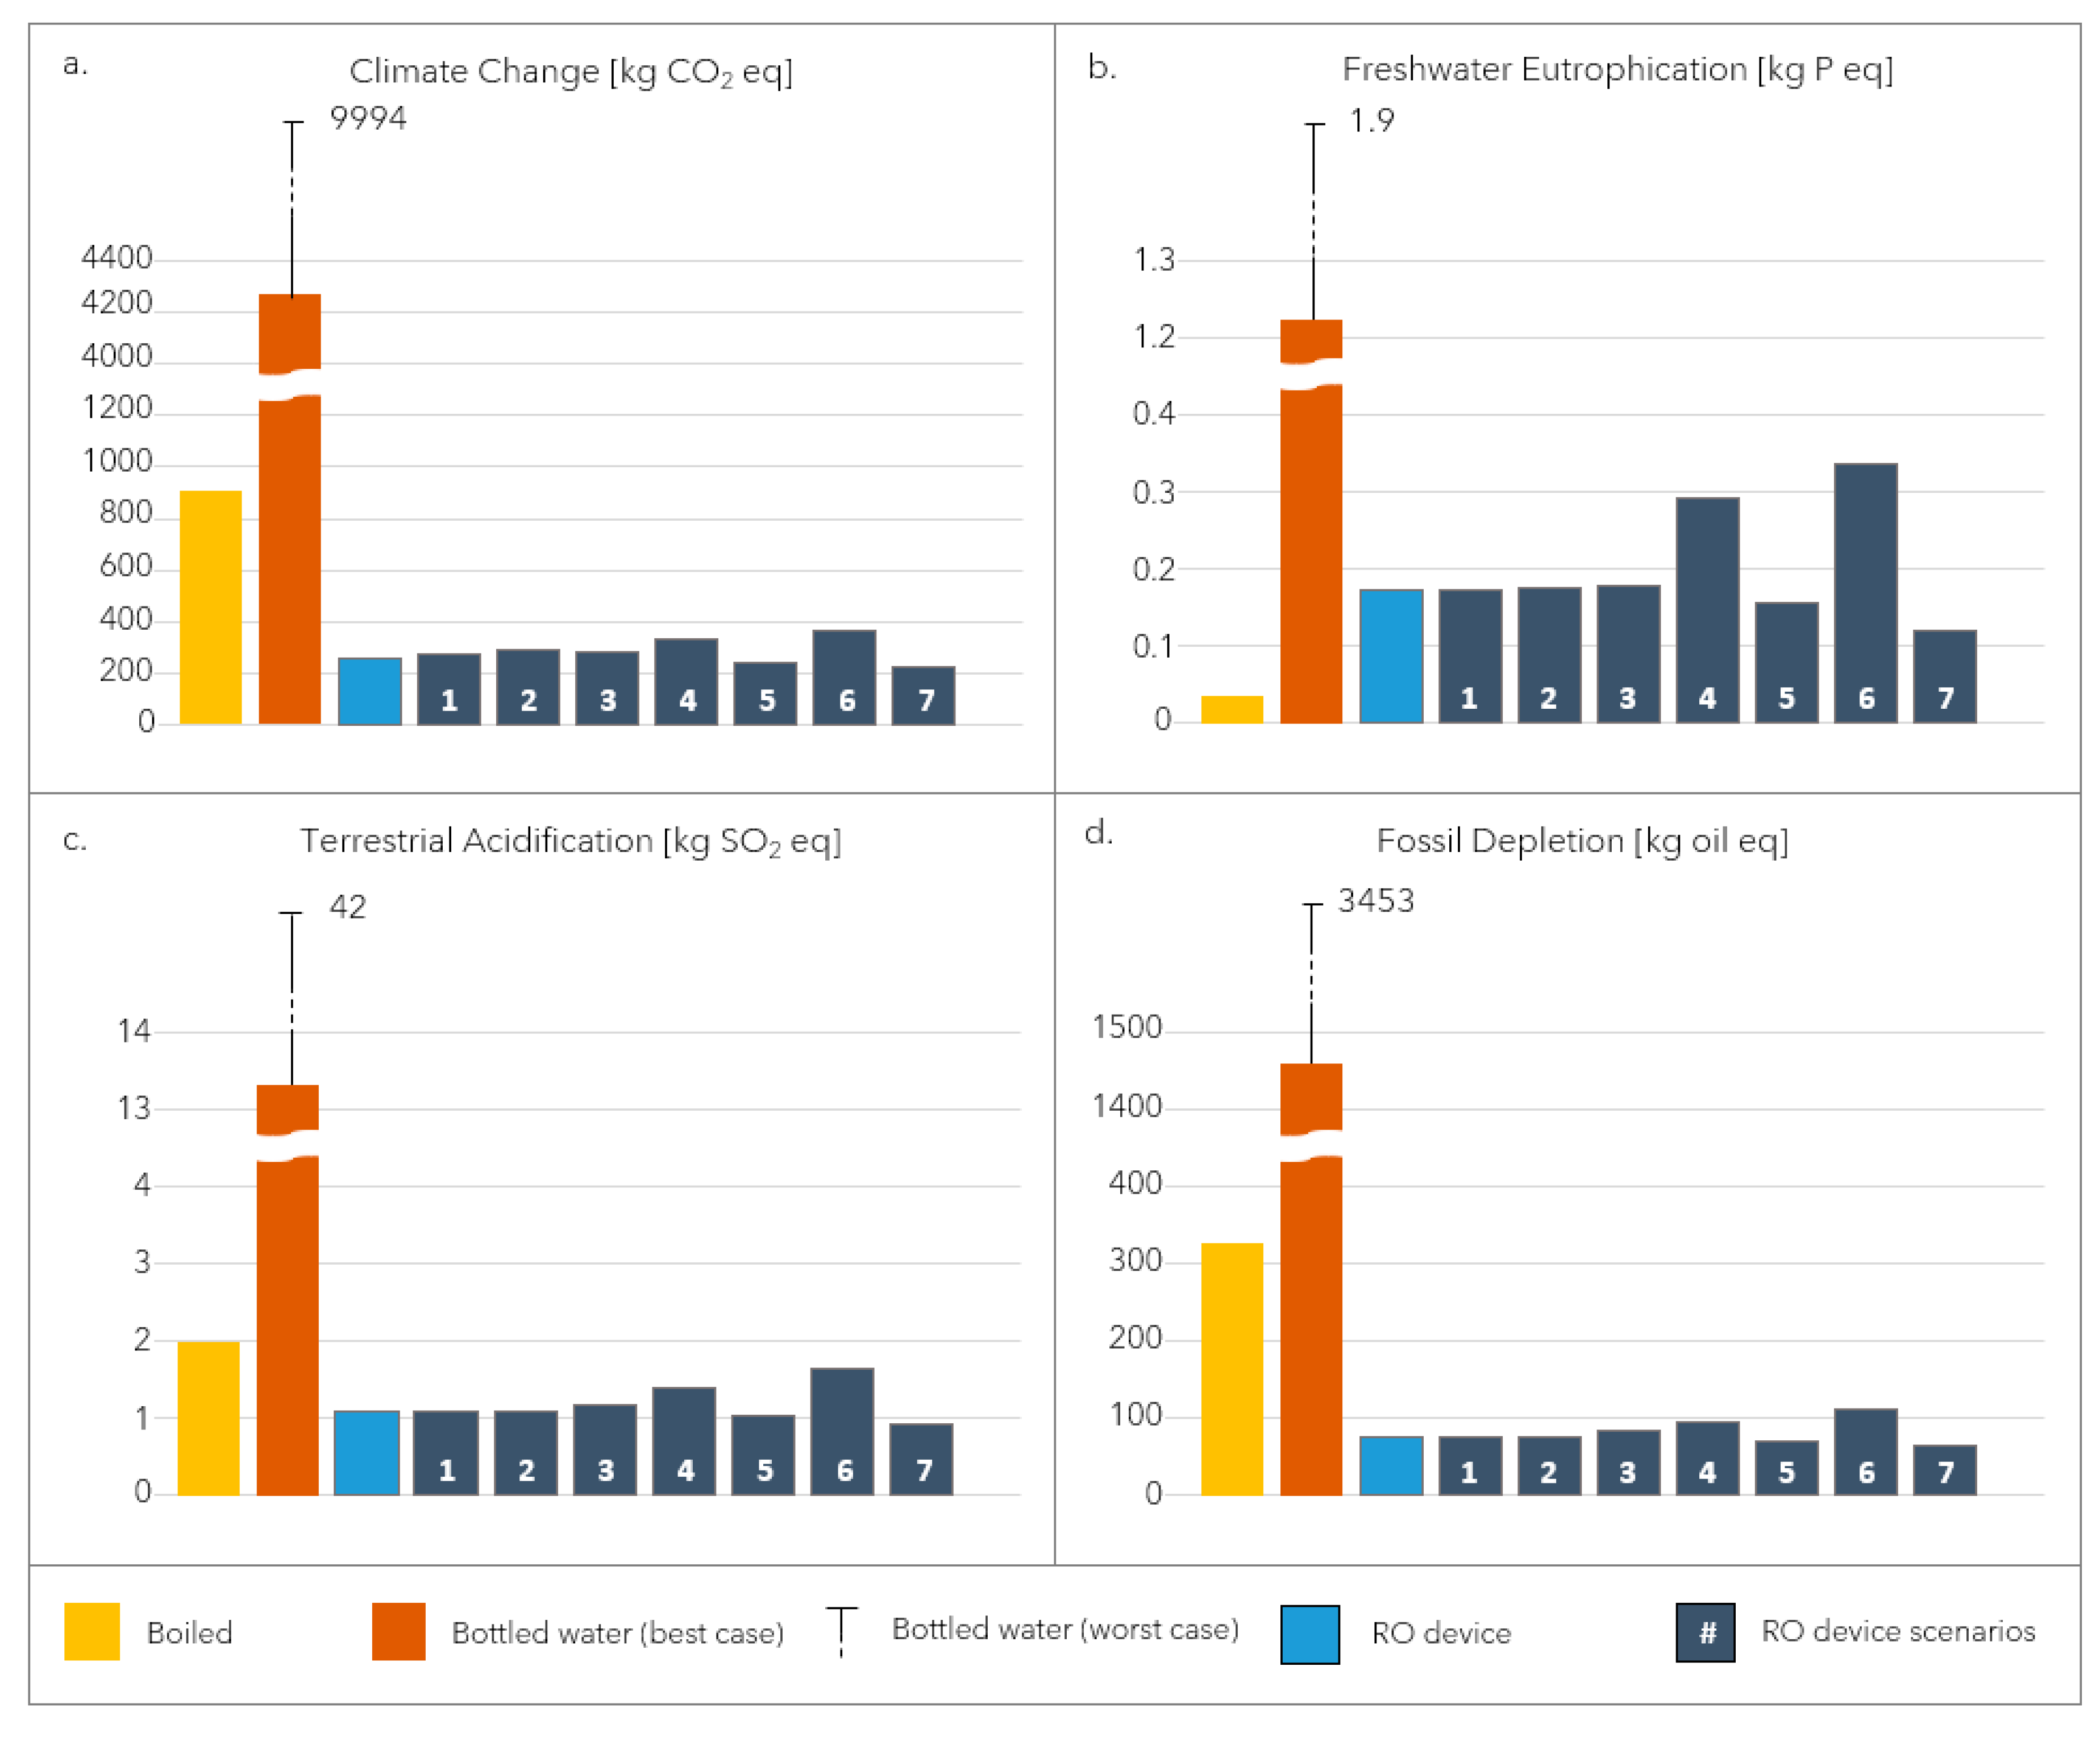
3.4. Sensitivity Analysis
Figure 3 shows the results of the sensitivity analysis. Due to the conservative choice of baseline scenario for bottled water, all other bottle scenarios resulted in impact increases (
Figure 3 only includes and error bar for the maximum result; full details can be found in
Table A6). Despite the wide choice of favorable and disadvantageous scenarios for the RO device, the overall conclusions from the impact analysis remain unchanged. Even for terrestrial acidification (
Figure 3c), where it had been concluded that the difference between boiled water and RO device was within the same range, the most favorable scenarios for the RO device do not increase significantly the difference between the systems.
4. Discussion
4.1. Largest Remaining Uncertainties and Their Potential Impacts on Conclusions
Results of this study are associated with a degree of uncertainty. Life cycle inventories of manufacturing operations were originally based on technologies from developed countries. To adapt these datasets to local conditions, the Indian electricity mix was introduced in the place of original data for electricity supply. However, the mix was built from energy production datasets representative of European technologies. These may have different efficiencies to Indian technology. A possible and relevant underestimation of impacts may occur in the case of bottled water. The water purification requirements were representative of Oregon (USA) industries which would be expected to operate with higher efficiency than small manufacturers in India. These assumptions are expected to underestimate the impacts of bottled water. In the case of electricity, underestimations would be constant across all the systems, while the ones related to bottled-water purification would mean that the difference between this system and the others is even greater than the results shown here and therefore it would not affect the conclusions.
Garfí, Cadena, Sanchez-Ramos and Ferrer [
5] included domestic reverse osmosis as a scenario in their LCA study of drinking water in Barcelona. However, the study only included electricity in the consumer use phase and not the production of the device itself. The present study looked at the production of a complex device with a digital display and ultraviolet lamp, including the necessary replacement parts. Due to the presence of additional components, manufacturing of this device is expected to cause higher environmental impacts than a basic reverse osmosis device. This uncertainty also contributes to the magnification of the finding that the consumption of water from a RO device will be associated with lower fossil fuel related environmental impacts than the consumption of bottled water.
The use of tap water in the inventory may represent an overestimate in those cases where the bottled-water manufacturer directly uses surface or groundwater; however this is not considered to be significant since in all the existing bottled-water studies, the main contributors to the environmental impacts are the primary packaging (plastic production and shaping) and the transport/distribution [
21].
4.2. Functional Differences not Considered in the Choice of Functional Unit
The three systems analyzed here deliver drinking water to the consumer, but there are subtle differences between them that were not reflected in the choice of the functional unit in this study. The boiled water system does not address the consumer need to reduce the TDS content and improve the taste. Boiled water will therefore not be a viable alternative for consumers concerned about the taste of water. The bottled water, on the other hand, may be more convenient to use than other alternatives, as it can be consumed straight from the bottle and does not require the maintenance of any device from the consumer. The convenience of bottled water is also certainly higher for consumers wishing to carry their water out-of-home as the other two systems require the consumer to carry their own container. Bottled water can also be purchased out-of-home in case of sudden need.
4.3. Impacts not Considered in the Analysis
There are also additional impacts that may differ between the systems analyzed and are not considered in the current choice of environmental impact categories. When not disposed properly, single use bottles contribute to the accumulation of plastic litter, an increasingly recognized problem in Indian cities and in the World’s oceans [
22]. Although the total water consumption of the RO device is lower than that of the bottled water, the direct water use at the household level is significantly higher. It takes 4 L of tap water to provide only 1 L of drinking water at the household level. As most of this water goes back to the same watershed, it does not deprive the ecosystem out of water and does not contribute to the local water scarcity. However, many consumers in India are facing water scarcity due to irregular water supply to their homes. In 2007, only 17.9% of people living in the biggest seven Indian cities had access to running tap water round the clock [
23]. Most consumers can only access tap water on certain days. Using excessive amounts of tap water deprives them of water available for other uses and may also deprive other people connected to the same upstream water supply system. Current LCIA methodologies for water use do not adequately address such social issues.
The impact of visits for repair or maintenance of the device were not considered. In particular, up to five visits are expected over the product lifetime to replace consumables. As these are likely to cover several devices per visit its impact was considered negligible compared to other components of the system.
5. Conclusions
The magnitude of the difference between the best-case bottled water and the other two systems allows us to conclude that this system is the most impactful for most of the impact categories studied, except blue water consumption. When looking at blue water consumption, bottled water was found to have higher impact in the scenario of transportation to another watershed. This conclusion complements the results found for climate change by Fantin, Scalbi, Ottaviano and Masoni [
4] whose meta-analysis determined that bottled water had significantly higher impacts than tap water.
The comparison of the RO device system to boiled water system does not allow for a declaration of definitive superiority of either system since there are trade-offs between impact categories. Boiled water revealed to be more impactful in impact categories closely linked to the burning of fossil fuels: climate change and fossil depletion. The RO device, on the other hand, showed higher impacts on water quality (eutrophication) and water consumption. For terrestrial acidification potential, small difference of impacts does not allow for differentiation of impacts between the two systems.
The three systems in this report show different environmental trade-offs which need to be considered when choosing a purification method but ultimately the best option may be determined by other issues such as accessibility, price, convenience, or reliability. As mentioned in the introduction, boiled water has been included to reflect a lower income alternative (where taste may not be a priority), but it might not be the method of choice for the consumers of bottled water and/or the RO device system.
Future research in this area should assess the home delivery water system, where consumers subscribe to a regular service providing them 20 L polycarbonate (returnable and reusable) bottles of safe drinking water. This is yet another popular alternative for higher income households which was not included in this study due to the lack of Indian-specific data, particularly in relation to the distribution and collection of the bottles, which has been found to be a very important contributor by Franklin Associates [
24].
Author Contributions
Conceptualization, T.G.-S. and S.S.; Data curation, T.G.-S. and A.G.; Formal analysis, T.G.-S. and M.K.; Methodology, T.G.-S., M.K., H.K. and J.C.; Writing—original draft, T.G.-S.; Writing—review & editing, T.G.-S., M.K., H.K., J.C., A.G. and S.S.
Funding
This research was funded by Unilever R&D.
Conflicts of Interest
In the interest of transparency, we report that the authors of this paper are/have been employed by the company that makes Pureit Ultima®.
Appendix A
Appendix A.1. Detailed Life Cycle Inventories
Table A1.
Life cycle inventory of water from the reverse-osmosis (RO) device in India (premium segment unit). Functional unit: 20,000 L of drinking water at consumer’s home. Due to commercial sensitivities, some of the detail has been aggregated.
Table A1.
Life cycle inventory of water from the reverse-osmosis (RO) device in India (premium segment unit). Functional unit: 20,000 L of drinking water at consumer’s home. Due to commercial sensitivities, some of the detail has been aggregated.
| | Process | Unit | Quantity |
|---|
| Inputs at consumer home | Tap water (adapted with Indian electricity mix) | kg (=L) | 80,000 |
| Electricity | MJ | 336 |
| Pureit®: 1 main device, 5 sets of consumables | Acrylonitrile butadiene styrene copolymer, ABS, at plant | kg | 4.25 |
| Polypropylene, granulate, at plant | kg | 3.92 |
| Other polymers | kg | 0.43 |
| Electronic components | kg | 0.28 |
| Pump and other hardware | kg | 2.6 |
| Plastic molding and metal shaping | kg | 7.17 |
| Electricity | MJ | 75.5 |
| Inbound transport | Ship and lorry | tkm | 30.3 |
| Packaging | Paper and board | kg | 3.15 |
| Polystyrene expandable part (EPS) | kg | 0.14 |
| Other polymers | kg | 0.04 |
| Other | CaO, MgO | kg | 1.15 |
| Activated carbon | kg | 1.8 |
| Outbound transport | Lorry and van | tkm | 29.6 |
| Waste (to sanitary landfill/municipal incineration depending on scenario) | Plastics | kg | 8.78 |
| Packaging cardboard and paper | kg | 3.15 |
| Other municipal solid waste | kg | 5.83 |
| Output water | Purified water | kg | 20,000 |
| Water rejected during the reverse osmosis (flowing down the drain) | kg | 60,000 |
Table A2.
Life cycle inventory of bottled water in India (best-case scenario). Functional unit: 20,000 L of drinking water at consumer’s home.
Table A2.
Life cycle inventory of bottled water in India (best-case scenario). Functional unit: 20,000 L of drinking water at consumer’s home.
| | Process | Unit | Quantity |
|---|
| Bottle | polyethylene terephthalate, granulate, bottle grade (adapted with Indian electricity mix) | kg | 360.0 |
| injection molding | kg | 360.1 |
| stretch blow molding | kg | 360.0 |
| Cap | polypropylene, granulate | kg | 28.0 |
| Injection molding | kg | 28.0 |
| Bottle and cap inbound transport | transport, lorry 16–32 t, EURO3 | tkm | 740.0 |
| Secondary pack | packaging film, LDPE | kg | 67.2 |
| kraft paper, unbleached | kg | 1.4 |
| Tertiary pack | packaging film, LDPE | kg | 13.3 |
| Corrugated board, recycling fiber, single wall | kg | 60.1 |
| Secondary and tertiary pack inbound transport | transport, lorry 16–32 t, EURO3 | tkm | 14.0 |
| Bottling plant: reverse osmosis | Tap water (adapted with Indian electricity mix) | kg | 25,000 |
| Electricity | kWh | 101.1 |
| Ozone, liquid, at plant | g | 7 |
| Distribution transport * | Operation freight train diesel/electricity (adapted for India) | tkm | 2053 |
Table A3.
Life cycle inventory of boiled water in India. Functional unit: 20,000 L of drinking water at consumer’s home.
Table A3.
Life cycle inventory of boiled water in India. Functional unit: 20,000 L of drinking water at consumer’s home.
| | Process | Unit | Quantity |
|---|
| Inputs at consumer home | Tap water (adapted with Indian electricity mix) | kg (=L) | 20,000 |
| propane/butane at consumer (LPG) (adapted with Indian electricity mix and specific transport *) | kg | 251 |
| LPG transport * | operation, freight train, diesel | tkm | 116 |
| operation, freight train, electricity | tkm | 65 |
| operation, transoceanic freight ship | tkm | 249 |
| transport, van <3.5 t | tkm | 4 |
| transport, lorry 3.5–16 t, fleet average | tkm | 83 |
| Emissions from burning * | Outputs | | |
| Carbon dioxide ** | kg | 698.293 |
| Carbon monoxide | kg | 3.861 |
| Methane | kg | 0.006 |
| Nitrogen oxides | kg | 0.322 |
| Nitrous oxide | kg | 0.004 |
| NMVOC (non-methane volatile organic compounds) | kg | 0.429 |
| Soot | kg | 0.001 |
Appendix A.2. Simplified Inventory Based on 1 L Purified Water
Table A4.
Simplified life cycle inventory for the three drinking-water provisioning systems in India. Functional unit: supply of 1 L of safe, drinking water at the consumer’s home.
Table A4.
Simplified life cycle inventory for the three drinking-water provisioning systems in India. Functional unit: supply of 1 L of safe, drinking water at the consumer’s home.
| | Process | Flow | Unit | System under Study |
|---|
| | | | | Reverse-Osmosis Device | Bottled Water | Boiled Water |
| | Water | Tap water | kg | 4.00 | 0.13 | 1.00 |
| Inputs | Energy | Liquefied Petroleum Gas (LPG) | kg | | | 1.26 × 10⁻² |
| Electricity | kWh | 5.77 × 10⁻³ (of which 4.71 × 10⁻³ at home) | 5.06 × 10⁻³ | |
| Inbound transport | Train and truck | tkm | 1.52 × 10⁻³ | 4.06 × 10⁻² | 2.59 × 10⁻² |
| Bottle materials | Virgin polyethylene terephthalate (PET) | kg | | 1.80 × 10⁻² | |
| Polypropylene (PP) (lid) | kg | | 1.40 × 10⁻³ | |
| Reverse-Osmosis Device—consumable materials | Acrylonitrile Butadiene styrene | kg | 2.15 × 10⁻⁴ | | |
| PP | kg | 1.95 × 10⁻⁴ | | |
| Other polymers | kg | 3.00 × 10⁻⁵ (includes packaging) | | |
| Electronic parts | kg | 1.50 × 10⁻⁵ | | |
| Pump and other hardware | kg | 2.60 × 10⁻⁴ | | |
| Shaping | Plastic molding and metal shaping | kg | 3.60 × 10⁻⁴ | 3.74 × 10⁻² | |
| Packaging | Low Density Polyethylene film | kg | | 4.03 × 10⁻³ | |
| Paper and board | kg | 1.95 × 10⁻⁴ | 3.08 × 10⁻³ | |
| Outbound transport | Train and truck | tkm | 1.48 × 10⁻³ | 1.03 × 10⁻⁴ | |
| Other | Ozone | kg | | 3.50 × 10⁻⁷ | |
| CaO, MgO | kg | 6.00 × 10⁻⁵ | | |
| Outputs | Combustion | CO2 | kg | | | 3.49 × 10⁻² |
| Other (CO, CH4, NO, N2O, NMVOC, soot) | kg | | | 2.30 × 10⁻⁴ |
| Purification | Wastewater | kg | 3.00 | 2.60 × 10⁻⁴ | |
Appendix A.3. Description of the Systems and Their Inventories
Appendix A.3.1. RO Device
All data for the RO device (Pureit Ultima) were supplied by the manufacturer (Unilever) and are representative of the technology in 2014. The device consists of a plastic casing which houses the storage tank, RO system, pump, and ultraviolet lamp parts. The device contains a digital display to inform the user about the purity of the water and when to change the consumable filters (called “germ kill kits”). The RO device is connected both to the mains electricity and to a source of pressurized water (tap). The data provided by the manufacturer included quantities of materials for manufacturing the device, consumables, and packaging with their inbound transport distances, electricity use during the manufacturing of the device and consumables as well as details about the expected lifespan. The data collected included water use for manufacturing as well as water and electricity use at the consumer’s home (four liters of tap water for each liter of purified water). Some of the parts, such as electronic components, were sourced from a third-party manufacturer, ecoinvent database v 2.2 was therefore used to estimate their impacts. The following end of life scenarios were considered in the sensitivity analysis:
100% recycled: the RO device, consumables, and packaging are all recycled. Following the cut-off approach, no impacts are allocated to this scenario.
100% landfill: all the components and packaging are collected and landfilled. The relevant Swiss ecoinvent sanitary landfill operation datasets were used to estimate the impact of this scenario.
100% incineration: everything is collected and incinerated. The Swiss ecoinvent municipal incineration datasets were used for this scenario.
The Indian electricity mix was modelled using ecoinvent electricity generation datasets (e.g., “UCTE: electricity, hard coal, at power plant”) with the following proportions: 67.94% coal, 12.42% hydropower, 10.31% natural gas, 3.16% nuclear, 1.16% oil, 2.73% waste 2.27% wind power, and with 21.14% distribution losses. These percentages are a simplification of the International Energy Agency [
19] electricity production statistics for India in 2011. To obtain 1 L of purified water, the RO device uses 4.7 Wh of electricity.
Appendix A.3.2. Bottled Water
Purified water was considered for the bottled-water scenario. As opposed to mineral water which is usually packaged close to the source with minimal treatment, packaged purified water undergoes an industrial purification process. We considered that the purification plant will be using municipal tap water as input into the process and the water was bottled in 1 L virgin PET bottles with a PP cap.
Purification
The purification steps were modelled according to the system illustrated by Franklin Associates [
24] for the Oregon Department of Environmental Quality. These data were based on technical manuals for the industry and are representative of the Indian producers. The purification and desalination steps considered included energy inputs and consumables for the following processes:
Water filtration (also called sand filtration or pre-filtration).
Reverse osmosis with an 80% recovery rate of purified water, also considering organic emissions.
Ozone treatment including the use of liquid ozone.
Ultraviolet treatment.
Filling operations including the cleaning of the bottles using a pressurized rinse.
To obtain 1 L of purified water, 5 Wh of electricity are required in this system.
Primary Packaging
Two options for primary packaging of bottled water were considered:
From Tandon, Kolekar and Kumar [
7], 1 L PET bottle of an average 22.4 g and 1.6 g for a screw cap (in this study it was assumed that the cap was made from PP instead of PET, after consulting with a packaging expert).
A “best-case scenario” 18 g PET bottle with a 1.4 g PP cap from the EcoGreen Line 1 L natural water bottle made by San Benedetto [
17]. To reduce the impact of variability of bottles on conclusions, this scenario has been used throughout the study as a conservative baseline acting at the disadvantage of hypothesis that bottled water will have higher impacts than the other two alternatives (see results of sensitivity analysis).
The ecoinvent 2.2 “injection molding” process was used for the screw cap and the bottle pre-form. The “stretch blow molding” process was used to consider blowing of the preforms into bottles, assuming that the bottles were manufactured offsite and transported to the factory, following Tandon, Kolekar and Kumar [
7].
Secondary and Tertiary Packaging
Two different options were considered for the secondary and tertiary pack of bottled water.
A cardboard case for 12 bottles packed in a pallet with shrink wrap (Tandon, Kolekar, and Kumar [
7]).
A “best-case scenario” lighter option using a secondary shrink wrap and tertiary shrink wrap and pallet liners from the San Benedetto EcoGreen Line [
17]. To reduce the impact of variability in the secondary and tertiary packaging of bottles on conclusions, this scenario has also been used as a conservative baseline throughout the study (see the results of the sensitivity analysis).
Distribution
Two distribution distances and two modes of transport were independently modelled. Tandon, Kolekar and Kumar [
7] state that in the state of Maharashtra, most of the industries studied distribute their products locally. Therefore 100 km and a truck (EURO 3 16–32 t from ecoinvent) were considered. However, according to Bhushan [
16], around 50% of the bottling plants in India are in Tamil Nadu and the demand is greater in the most affluent Western states. The other scenarios considered were therefore 1300 km distance between Tamil Nadu and Mumbai by either road or rail, as 35% of India’s internal freight is via railways [
3].
Disposal
The disposal rates mentioned in
Section 2.2.1 are valid for the secondary and tertiary packaging of this system. Following the advice of packaging experts, the following rates were used for the bottle and cap:
PET bottle: 4% to incineration, 16% to landfill and 80% to recycling
PP cap: 15% to incineration and 85% to landfill
Appendix A.3.3. Boiled Water
Because the RO device considered in this study belongs to the premium segment and therefore is only available to urban consumers with higher income levels, we have assumed the use of LPG for boiling the water as a low-income alternative. This assumption also provides a conservative baseline to the RO device as LPG stoves are among the less impactful systems of cooking in India for the impact categories considered here [
26]. The data on the amount of LPG fuel used to boil the water (12.5 g per liter of water) were generated empirically in India, as part of an externally reviewed claims dossier by the RO device manufacturer (Unilever confidential, 2013). The assessment considered a lidded 5 L pan as a conservative scenario (the lid facilitates increased heat preservation during the process) and measured the amount of LPG needed to bring it to the boil for 1 min on the stove (timings follow the recommendations of the Environmental Protection Agency [
8]).
The “propane/butane, at refinery” ecoinvent dataset was used as a basis for the LPG fuel. This inventory has a similar mix propane/butane to that specified by Gas India [
27] (60/40). For distribution and direct emissions from combustion, data from LPG burning in Indian stoves detailed in Jungbluth [
9] were used, except for the direct CO
2 emissions which were not included and therefore were accounted for following the approach of Hill, Walker, Choudrie and James [
25]. As mentioned in
Section 2.1, the pan, lid, and LPG cylinder were outside of the scope of this study.
Appendix B
Adaptation of Inventories
Some life cycle inventories were adapted to better reflect Indian conditions. Wherever the ecoinvent processes allowed (e.g., on the inputs to the “tap water, at user” process), the default electricity mix was substituted by a custom built Indian electricity mix using ecoinvent electricity production datasets at a ratio consistent with the International Energy Agency [
19] statistics on “Electricity and Heat” production for 2011 in India. This is considered to be a relevant step as the contribution analysis showed that electricity was the major contributor to most impact categories. The ecoinvent dataset for a EURO 3 16–32 t (24 t as average, with 17 t payload) truck was chosen based on [
28]. Both datasets were substituted in the background where possible and used as the default truck on the main transport stages. Where no specific distance was given, a 100 km and an empty return were used.
Appendix C
Comparative Results for All ReCiPe v1.08 Impact Categories
Table A5.
Comparison of safe drinking-water systems in India using the full suite of impact categories from ReCiPe v1.08 Midpoint (H) methodology. Functional unit: 20,000 L of drinking water at consumer’s home. Also includes the relative results (% relative to maximum value (bottled water between the three scenarios).
| Impact Category | Unit | RO Device (Recycled) | Bottled Water | Boiled Water |
|---|
| Agricultural land occupation | m2a | 1.85 × 101 (7%) | 2.51 × 10² | 1.35 (1%) |
| Climate change, default, excl biogenic carbon | kg CO2-Equiv. | 2.59 ×10² (6%) | 4.27 × 10³ | 9.05 × 10² (21%) |
| Climate change, incl biogenic carbon | kg CO2-Equiv. | 2.55 × 10² (6%) | 4.28 × 10³ | 9.05 ×10² (21%) |
| Fossil depletion | kg oil eq | 7.60 × 101 (5%) | 1.46 × 10³ | 3.26 ×10² (22%) |
| Freshwater ecotoxicity | kg 1.4-DB eq | 7.85 (17%) | 4.57 × 101 | 2.46 (5%) |
| Freshwater eutrophication | kg P eq | 1.74 × 10⁻⁴ (14%) | 1.25 | 3.49×10⁻² (3%) |
| Human toxicity | kg 1.4-DB eq | 2.30 × 10² (18%) | 1.26 × 10³ | 7.55×101 (6%) |
| Ionizing radiation | kg U235 eq | 3.13 × 101 (8%) | 3.73 × 10² | 2.16×101 (6%) |
| Marine ecotoxicity | kg 1.4-DB eq | 7.25 (17%) | 4.28 × 101 | 2.79 (7%) |
| Marine eutrophication | kg N-Equiv. | 1.40 × 10⁻⁴ (9%) | 1.53 | 5.92×10⁻² (4%) |
| Metal depletion | kg Fe eq | 7.33 × 101 (59%) | 1.24 × 10² | 5.34 (4%) |
| Natural land transformation | m2 | 2.91 × 10⁻² (5%) | 5.57 × 10⁻⁴ | 4.87×10⁻⁴ (87%) |
| Ozone depletion | kg CFC-11 eq | 9.60 × 10⁻⁶ (2%) | 5.08 × 10⁻⁴ | 1.24×10⁻⁴ (24%) |
| Particulate matter formation | kg PM10 eq | 3.98 × 10⁻⁴ (8%) | 4.78 | 6.09×10⁻⁴ (13%) |
| Photochemical oxidant formation | kg NMVOC | 7.71 × 10⁻⁴ (6%) | 1.23 × 101 | 2.27 (18%) |
| Terrestrial acidification | kg SO2 eq | 1.09 (8%) | 1.42 × 101 | 2.00 (14%) |
| Terrestrial ecotoxicity | kg 1.4-DB eq | 2.13 × 10⁻⁴ (5%) | 4.41 | 1.33 (30%) |
| Urban land occupation | m2a | 3.70 (16%) | 2.34 × 101 | 2.41 (10%) |
| Water depletion | m3 | 1.19 × 10³ (13%) | 9.30 × 10³ | 3.16 ×10² (3%) |
References
- World Health Organization; UNICEF. Progress on Sanitation and Drinking Water–2015 Update and MDG Assessment—9241509147. Available online: http://apps.who.int/iris/handle/10665/177752 (accessed on 1 December 2016).
- Wright, N.C.; Winter, V.A.G. Justification for community-scale photovoltaic-powered electrodialysis desalination systems for inland rural villages in India. Desalination 2014, 352, 82–91. [Google Scholar] [CrossRef]
- Indian Railways. Indian Railways Yearbook (2014–2015); Ministry of Railways (Railway Board): New Delhi, India, 2015.
- Fantin, V.; Scalbi, S.; Ottaviano, G.; Masoni, P. A method for improving reliability and relevance of LCA reviews: the case of life-cycle greenhouse gas emissions of tap and bottled water. Sci Total Environ. 2014, 476–477, 228–241. [Google Scholar] [CrossRef] [PubMed]
- Garfí, M.; Cadena, E.; Sanchez-Ramos, D.; Ferrer, I. Life cycle assessment of drinking water: Comparing conventional water treatment, reverse osmosis and mineral water in glass and plastic bottles. J. Clean. Prod. 2016, 137, 997–1003. [Google Scholar] [CrossRef]
- Homäki, K.; Nielsen, P.H.; Sathasivan, A.; Bohe, E.L.J. Life cycle assessment and environmental improvement of residential and drinking water supply systems in Hanoi, Vietnam. Int. J. Sustain. Dev. World Ecol. 2003, 10, 27–42. [Google Scholar] [CrossRef]
- Tandon, S.A.; Kolekar, N.; Kumar, R. Water and Energy Footprint Assessment of Bottled Water Industries in India. Nat. Resour. 2014, 5, 68–72. [Google Scholar] [CrossRef] [Green Version]
- Environmental Protection Agency. Emergency Disinfection of Drinking Water. Available online: https://www.epa.gov/sites/production/files/2015-11/documents/epa816f15003.pdf (accessed on 22 June 2016).
- Jungbluth, N. Life Cycle Assessment for the Use of Liquefied Petroleum Gas and Kerosene as Cooking Fuels in India. Master Thesis, Technischen Universität Berlin, Berlin, Germany, 1995. [Google Scholar]
- Government of India. Census of India 2011. In Housing Stock, Amenities & Assets in Slums; Ministry of Home Affairs; Registrar General and Census Commissioner of India: New Delhi, India, 2011. [Google Scholar]
- Frischknecht, R.; Jungbluth, N.; Althaus, H.-J.; Doka, G.; Dones, R.; Heck, T.; Hellweg, S.; Hischier, R.; Nemecek, T.; Rebitzer, G.; et al. The ecoinvent Database: Overview and Methodological Framework (7 pp.). Int. J. Life Cycle Assess. 2005, 10, 3–9. [Google Scholar] [CrossRef]
- GaBi, version 6.4; Thinkstep: Stuttgart, Germany, 2015.
- Vionnet, S.; Lessard, L.; Offutt, A.; Lévová, T.; Humbert, S. Quantis Water Database; Technical Report v1 for Quantis: Laussanne, Switzerland, 2012. [Google Scholar]
- Hoekstra, A.; Chapagain, A.; Aldaya, M.; Mekonnen, M. The Water Footprint Assessment Manual—Setting the Global Standard; Earthscan Ltd.: London, UK, 2011; p. 203. [Google Scholar]
- Brown, D.; Edwards, H.; Seaton, L.; Buckley, T. Lewis’s Medical-Surgical Nursing: Assessment and Management of Clinical Problems, 4th ed.; Elsevier Health Sciences APAC: Chatswood, Australia, 2014. [Google Scholar]
- Bhushan, C. The structure and economics of the Indian bottled water industry. Available online: http://www.frontline.in/static/html/fl2307/stories/20060421006702300.htm (accessed on 5 July 2016).
- EPD Environmental Product Declaration of Natural, Low Mineral Content Water San Benedetto in PET Bottles—EcoGreen Line. Available online: http://gryphon.environdec.com/data/files/6/9965/epd536en_rev1.pdf (accessed on 17 June 2015).
- Hawkins, T.R.; Singh, B.; Majeau-Bettez, G.; Strømman, A.H. Comparative Environmental Life Cycle Assessment of Conventional and Electric Vehicles. J. Ind. Ecol. 2013, 17, 53–64. [Google Scholar] [CrossRef]
- International Energy Agency India: Electricity and Heat for 2011. Available online: http://www.iea.org/statistics/statisticssearch/report/?country=INDIA&product=electricityandheat&year=2011 (accessed on 30 April 2015).
- World Resources Institute Sources of Eutrophication: Where Do Nutrients Come from? Available online: http://www.wri.org/our-work/project/eutrophication-and-hypoxia/sources-eutrophication (accessed on 18 June 2015).
- Jungbluth, N. Comparison of the Environmental Impact of Drinking Water vs. Bottled Mineral Water. Available online: http://aquadoc.typepad.com/waterwired/files/bottled_water_impact_lca.pdf (accessed on 5 August 2015).
- Eriksen, M.; Lebreton, L.C.M.; Carson, H.S.; Thiel, M.; Moore, C.J.; Borerro, J.C.; Galgani, F.; Ryan, P.G.; Reisser, J. Plastic Pollution in the World’s Oceans: More than 5 Trillion Plastic Pieces Weighing over 250,000 Tons Afloat at Sea. PLOS ONE 2014, 9, e111913. [Google Scholar] [CrossRef] [PubMed]
- Abdul, S.; Sharma, R.N. Water Consumption Patterns in Domestic Households in Major Cities. Econ. Polit. Wkly 2007, 42, 2190–2197. [Google Scholar]
- Franklin Associates. Life Cycle Assessment of Drinking Water System: Bottle Water, Tap Water, and Home/office delivery Water. Revised Final Peer-Reviewed LCA Report. Available online: http://www.deq.state.or.us/lq/pubs/docs/sw/LifeCycleAssessmentDrinkingWaterReportOnly.pdf (accessed on 19 April 2015).
- Hill, N.; Walker, H.; Choudrie, S.; James, K. 2012 Guidelines to Defra/DECC’s GHG Conversion Factors for Company Reporting: Methodology Paper for Emission Factors; Department for Environment, Food and Rural Affairs: London, UK, 2012.
- Singh, S.; Gupta, G.P.; Kumar, B.; Kulshrestha, U.C. Comparative study of indoor air pollution using traditional and improved cooking stoves in rural households of Northern India. Energy Sustain. Dev. 2014, 19, 1–6. [Google Scholar] [CrossRef]
- Gas India Benefits of Propane over LPG. Available online: http://www.gasindia.in/technical-specification.html (accessed on 19 May 2015).
- World Bank India: Road Transport Service Efficiency Study. Available online: https://openknowledge.worldbank.org/handle/10986/8356 License: CC BY 3.0 IGO (accessed on 20 May 2015).
© 2019 by the authors. Licensee MDPI, Basel, Switzerland. This article is an open access article distributed under the terms and conditions of the Creative Commons Attribution (CC BY) license (http://creativecommons.org/licenses/by/4.0/).

 ,
, 


