Global Spatial Distributions of and Trends in Rice Exposure to High Temperature
Abstract
1. Introduction
2. Materials and Methods
2.1. Basic Idea and Research Framework
2.2. Data Collection
2.3. Methods
2.3.1. Potential Rice Distribution Estimation
2.3.2. High Temperature Hazard Intensity Calculation
2.3.3. Barycenter Shift of Potential Rice and High Temperature Hazard Distributions
2.3.4. Estimation of High Temperature Exposure
3. Results
3.1. Changes in the Area and Barycenter of Rice Suitability Zones
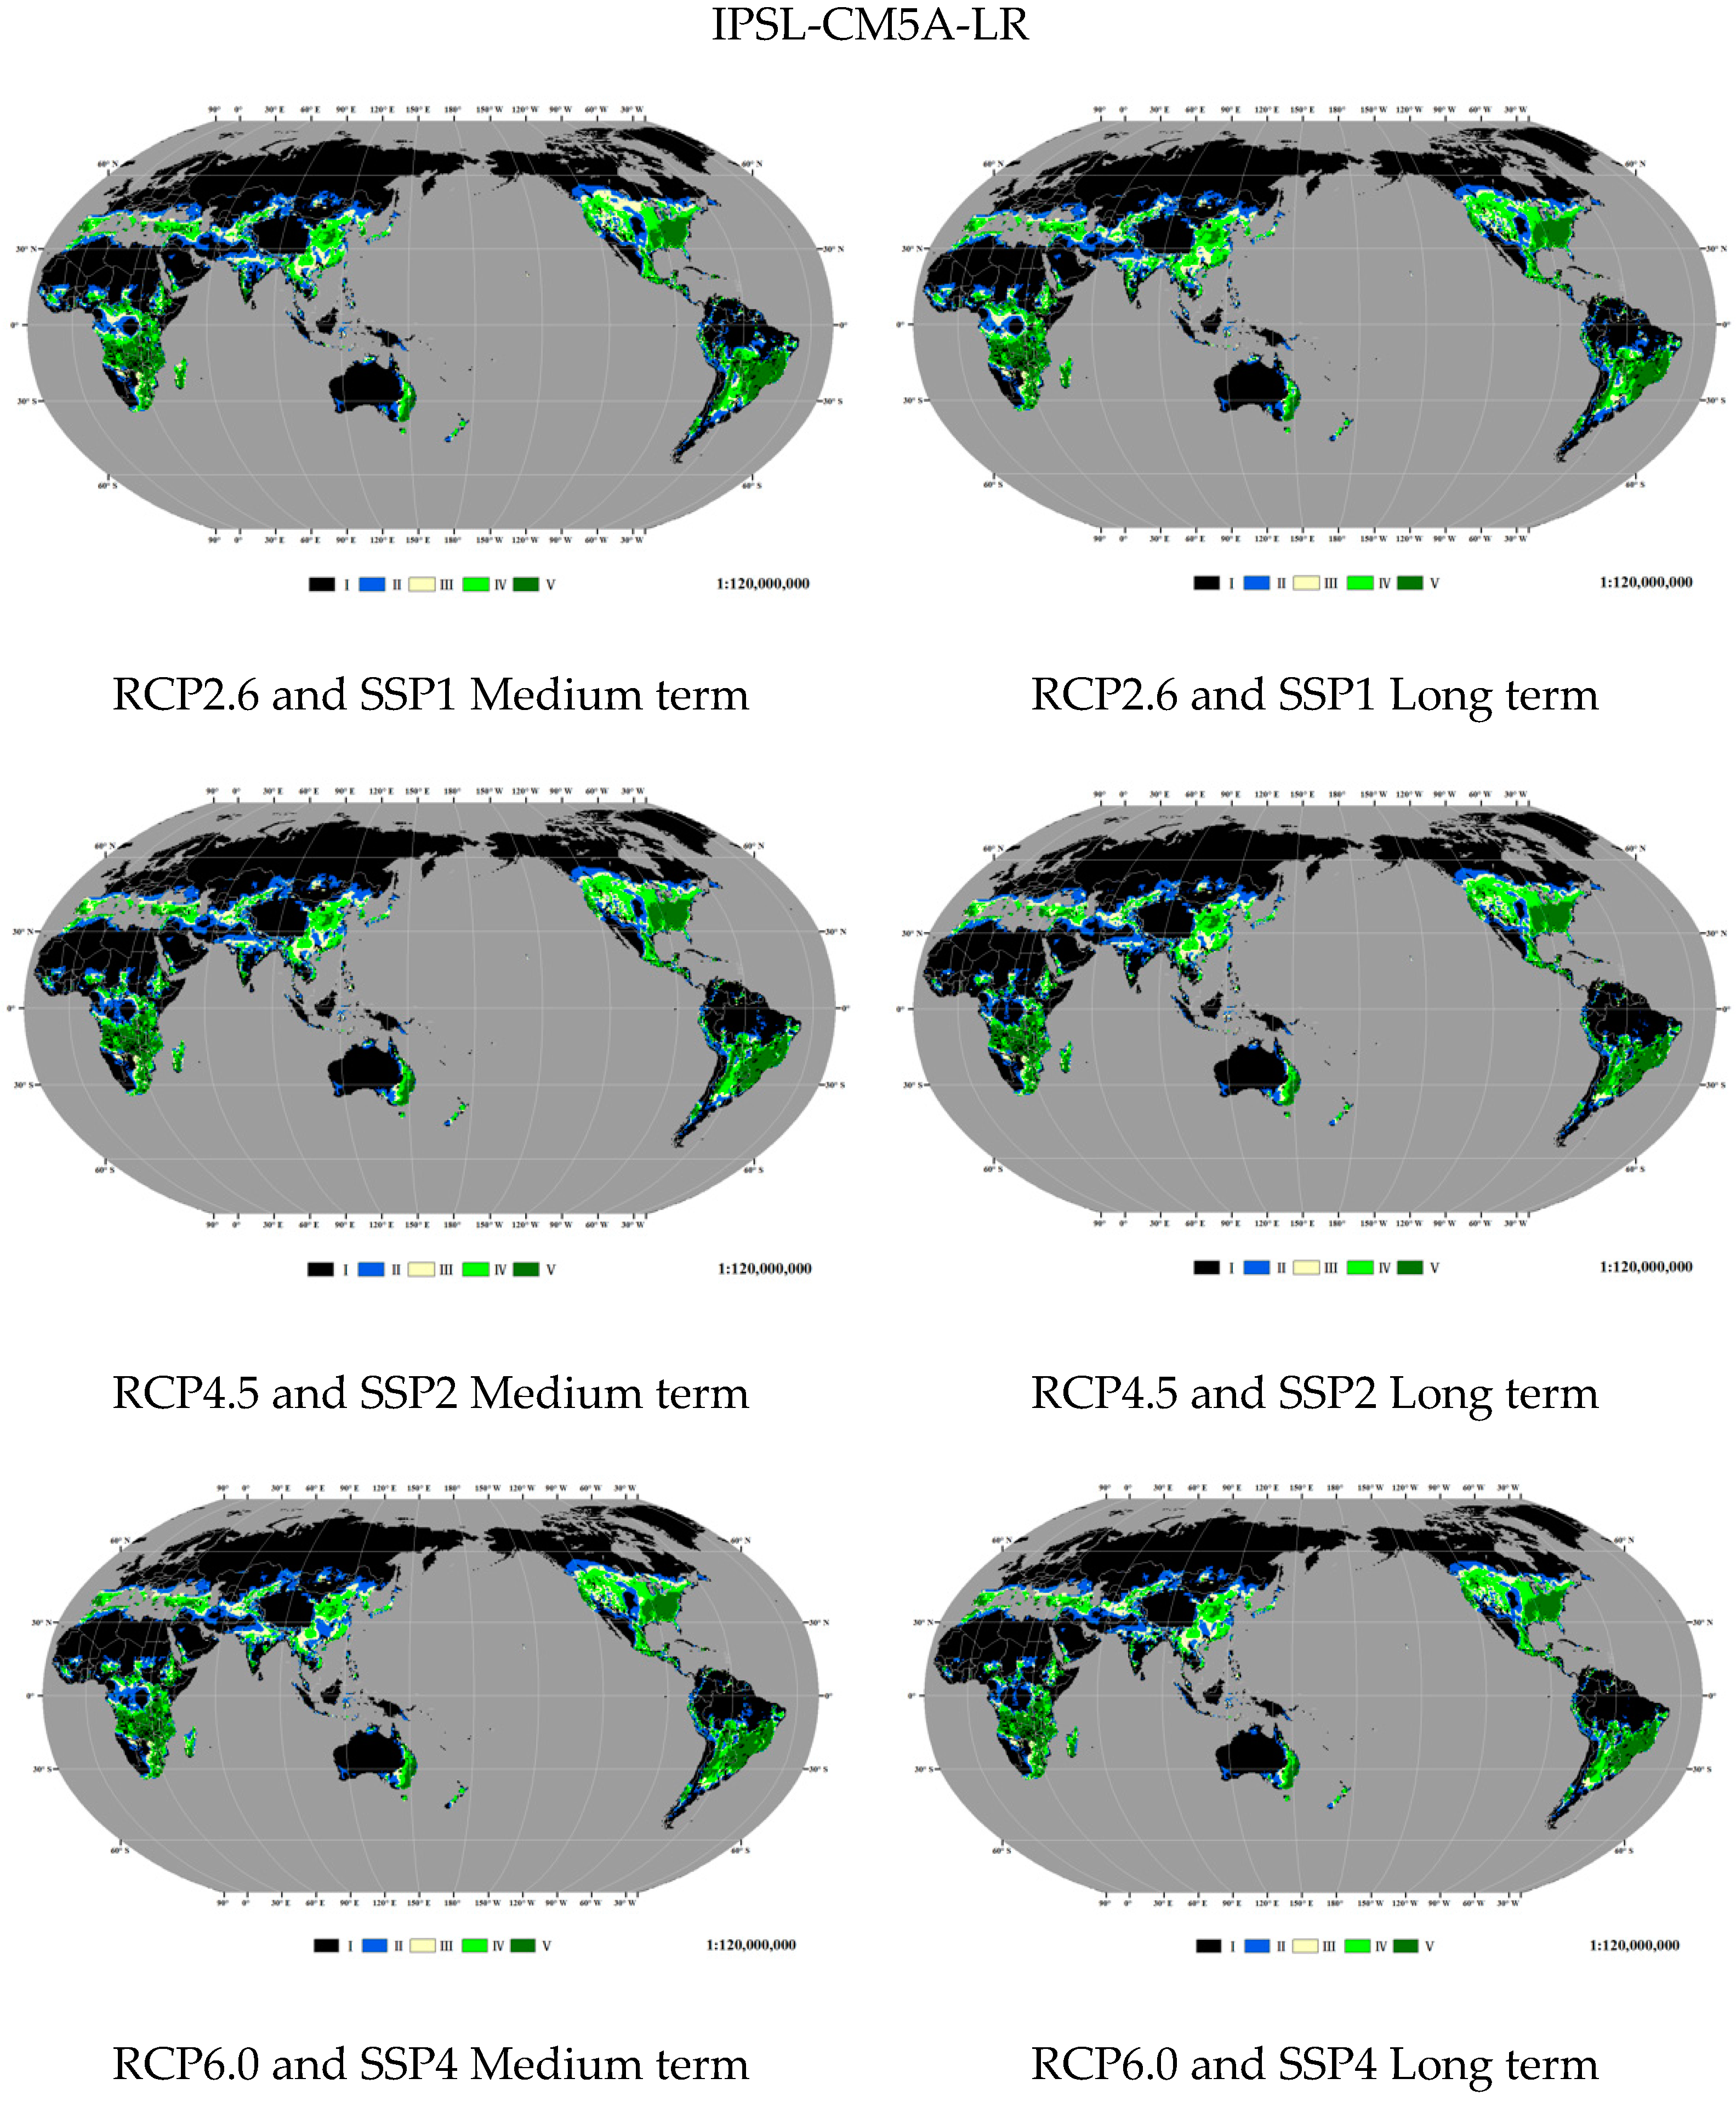
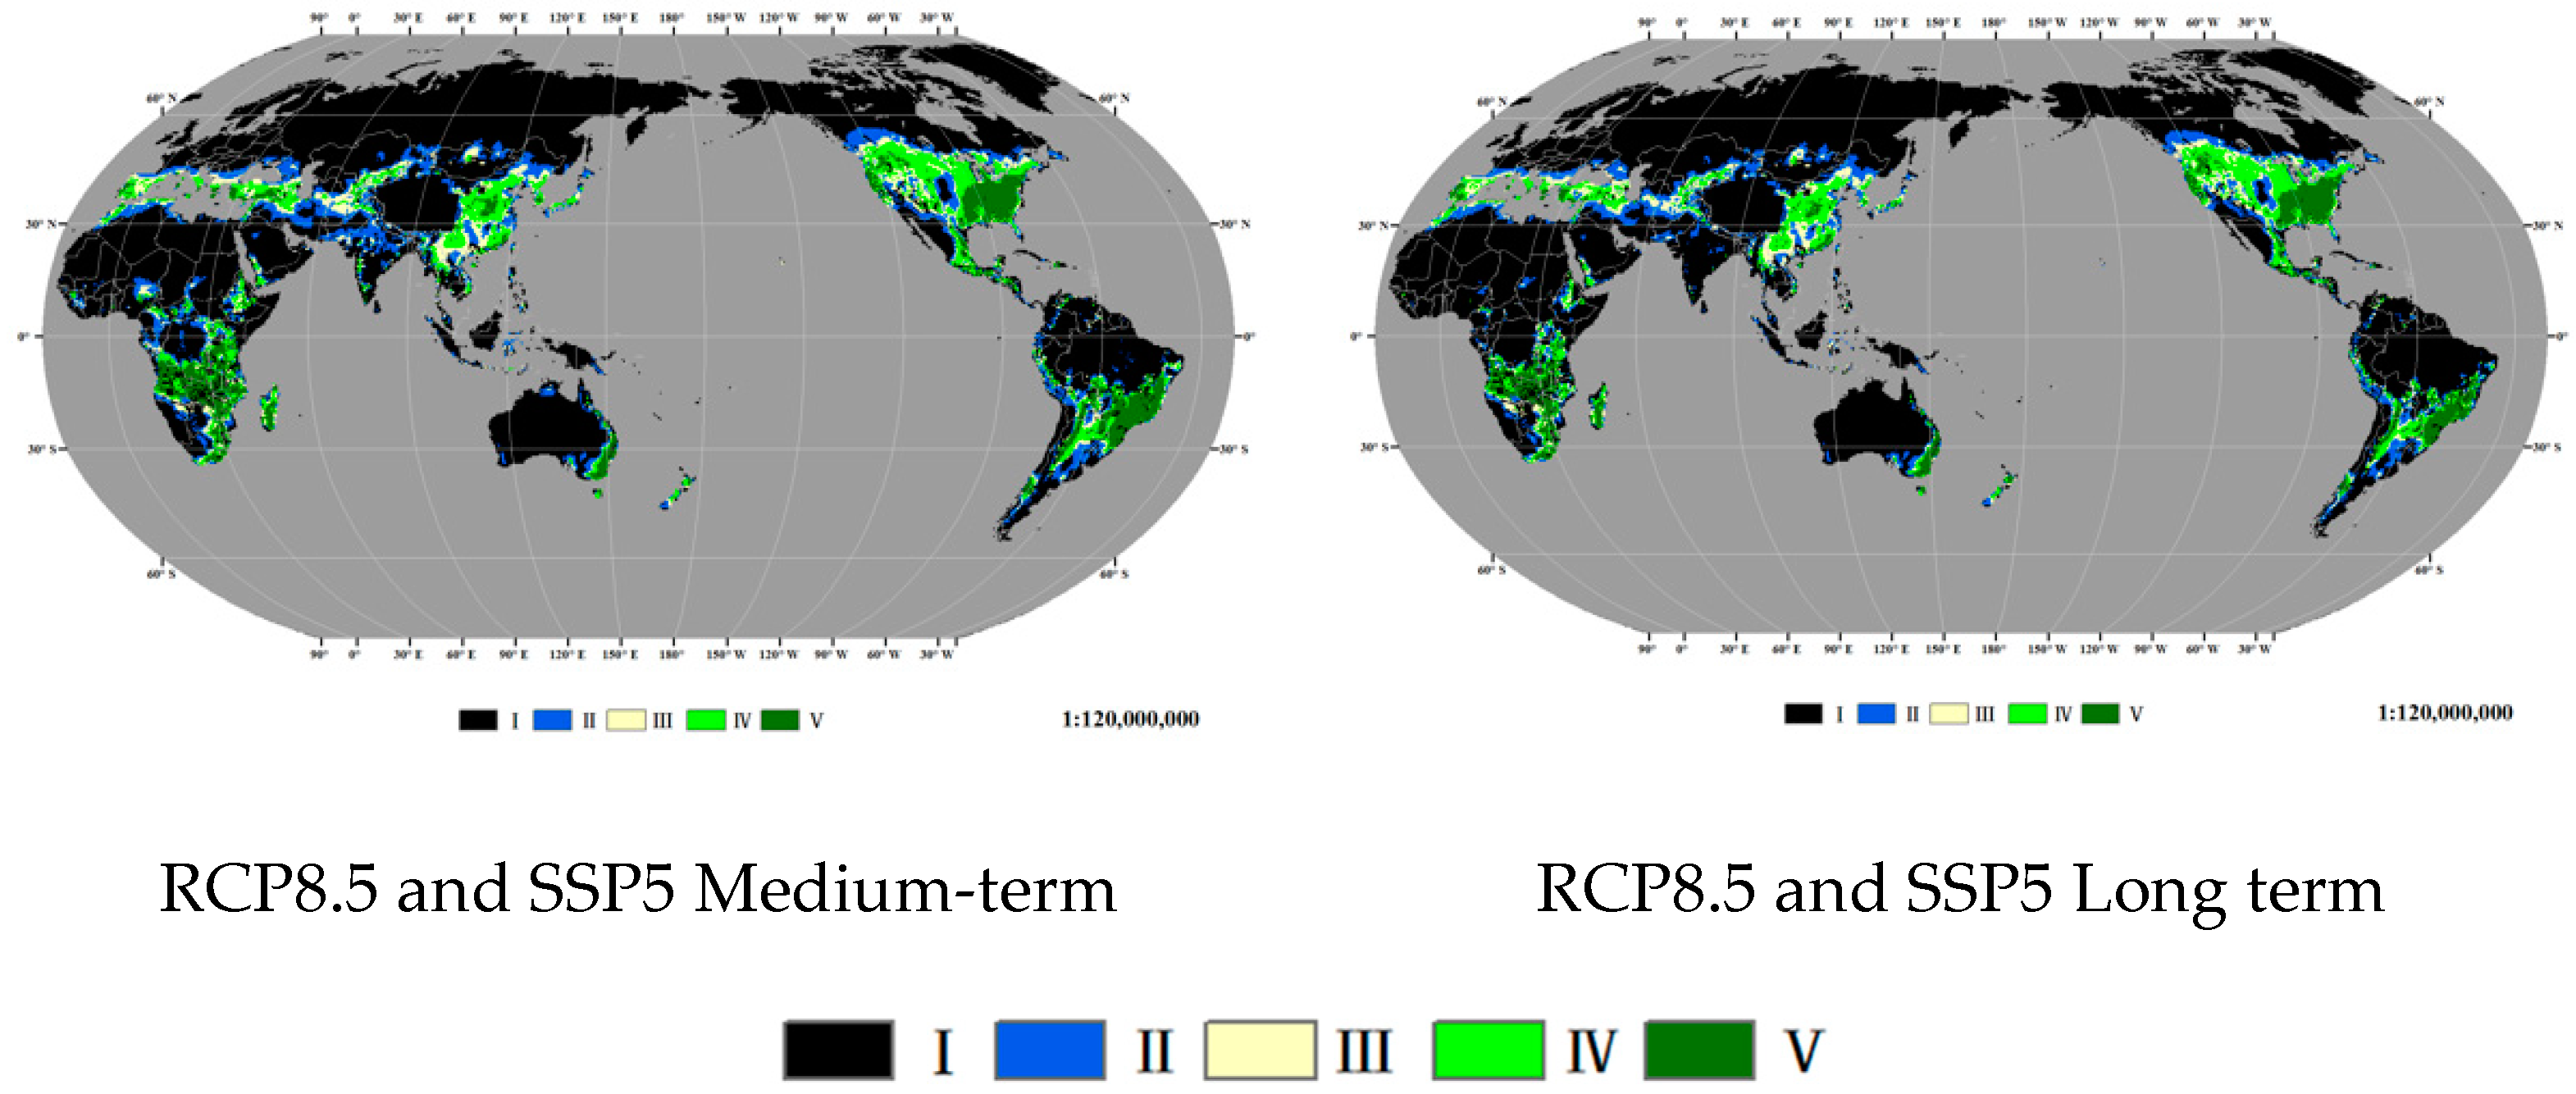
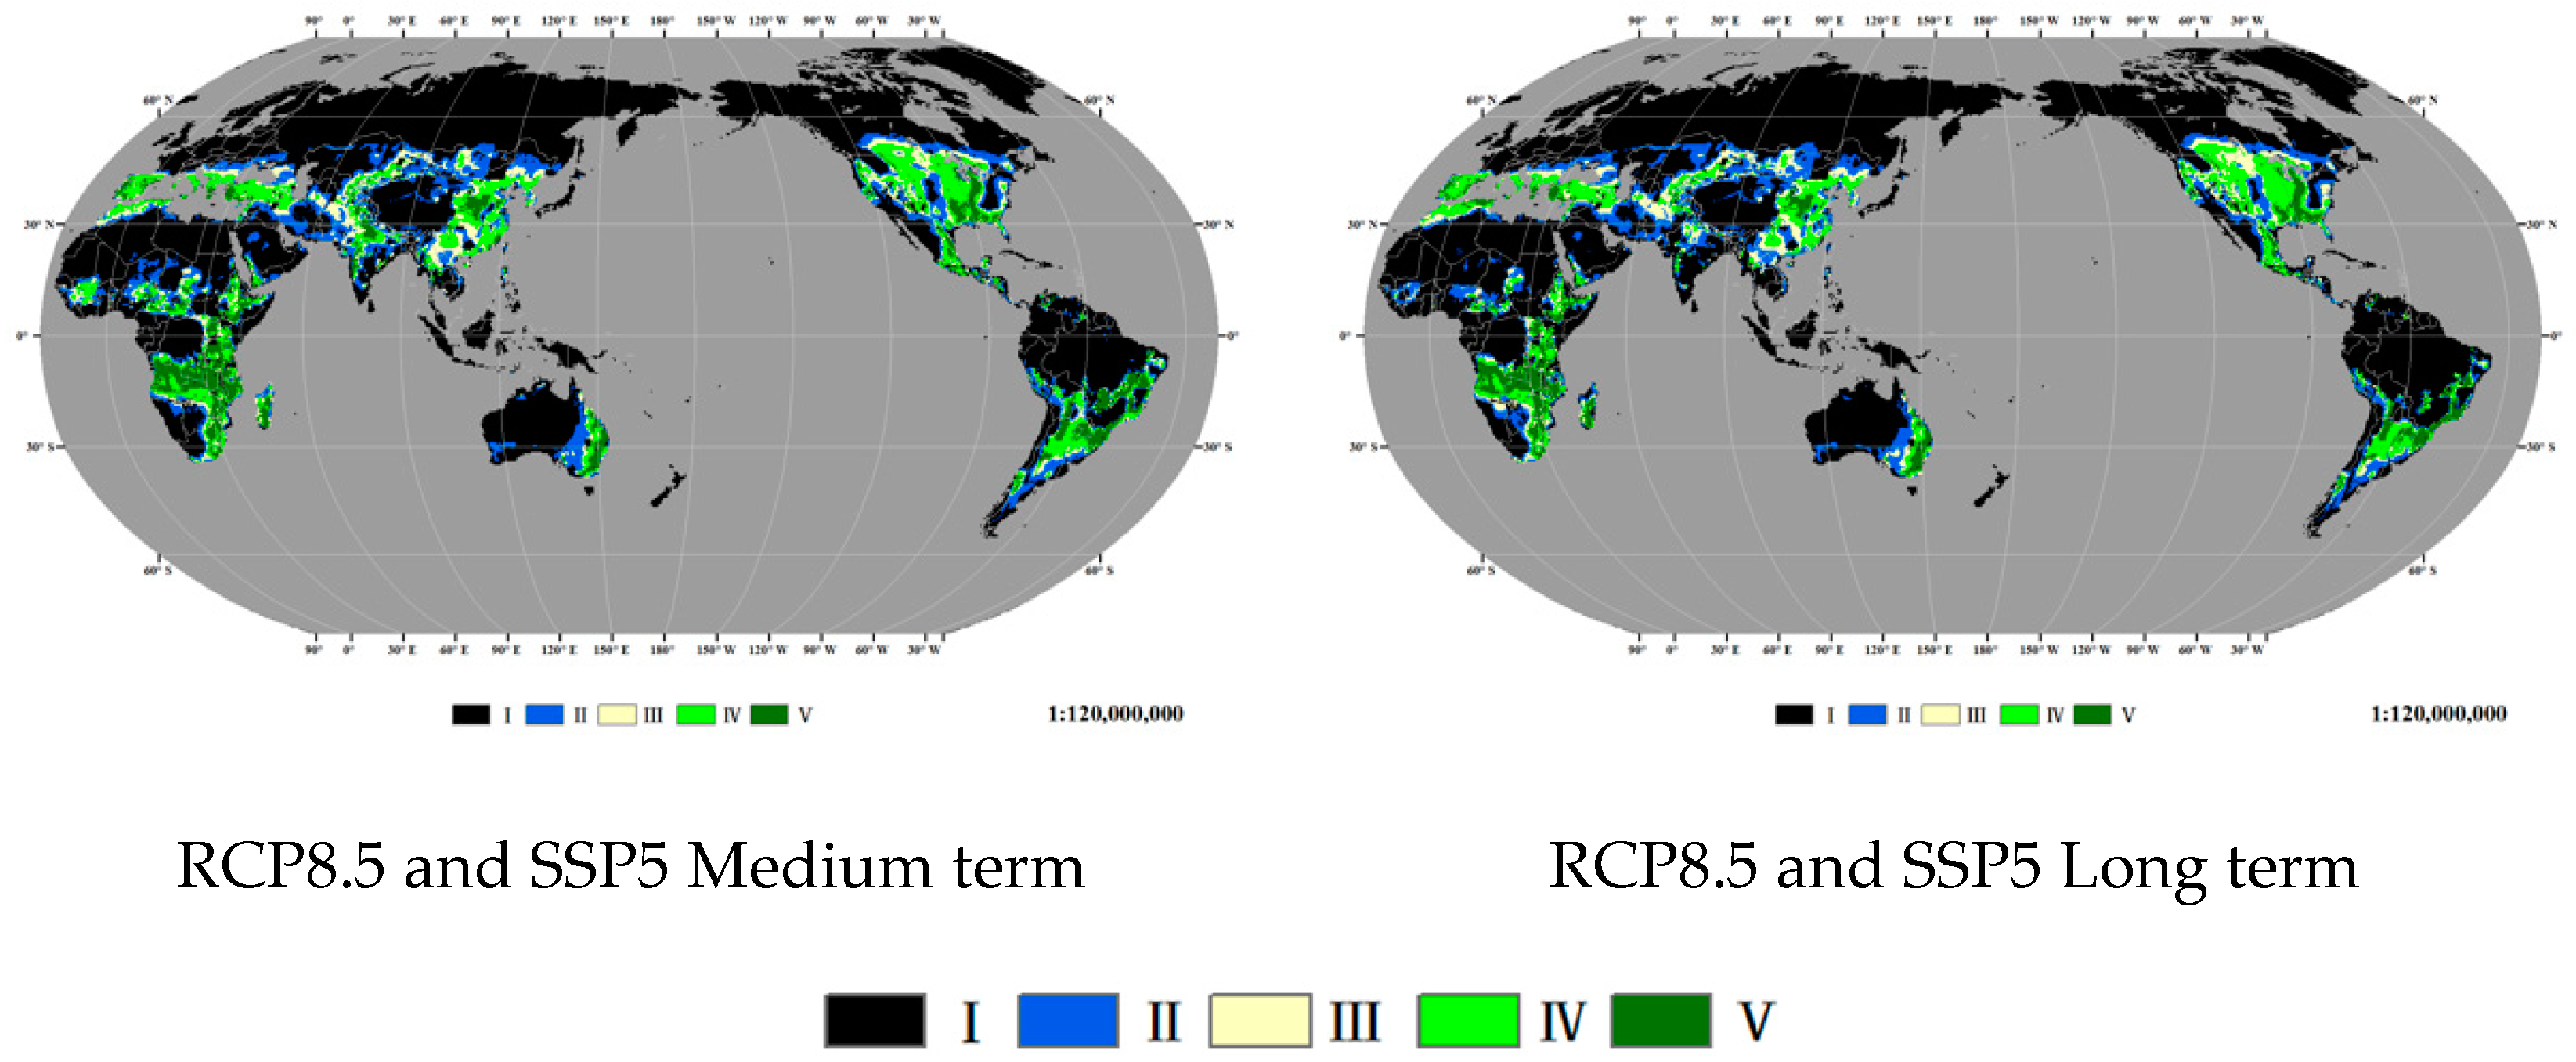
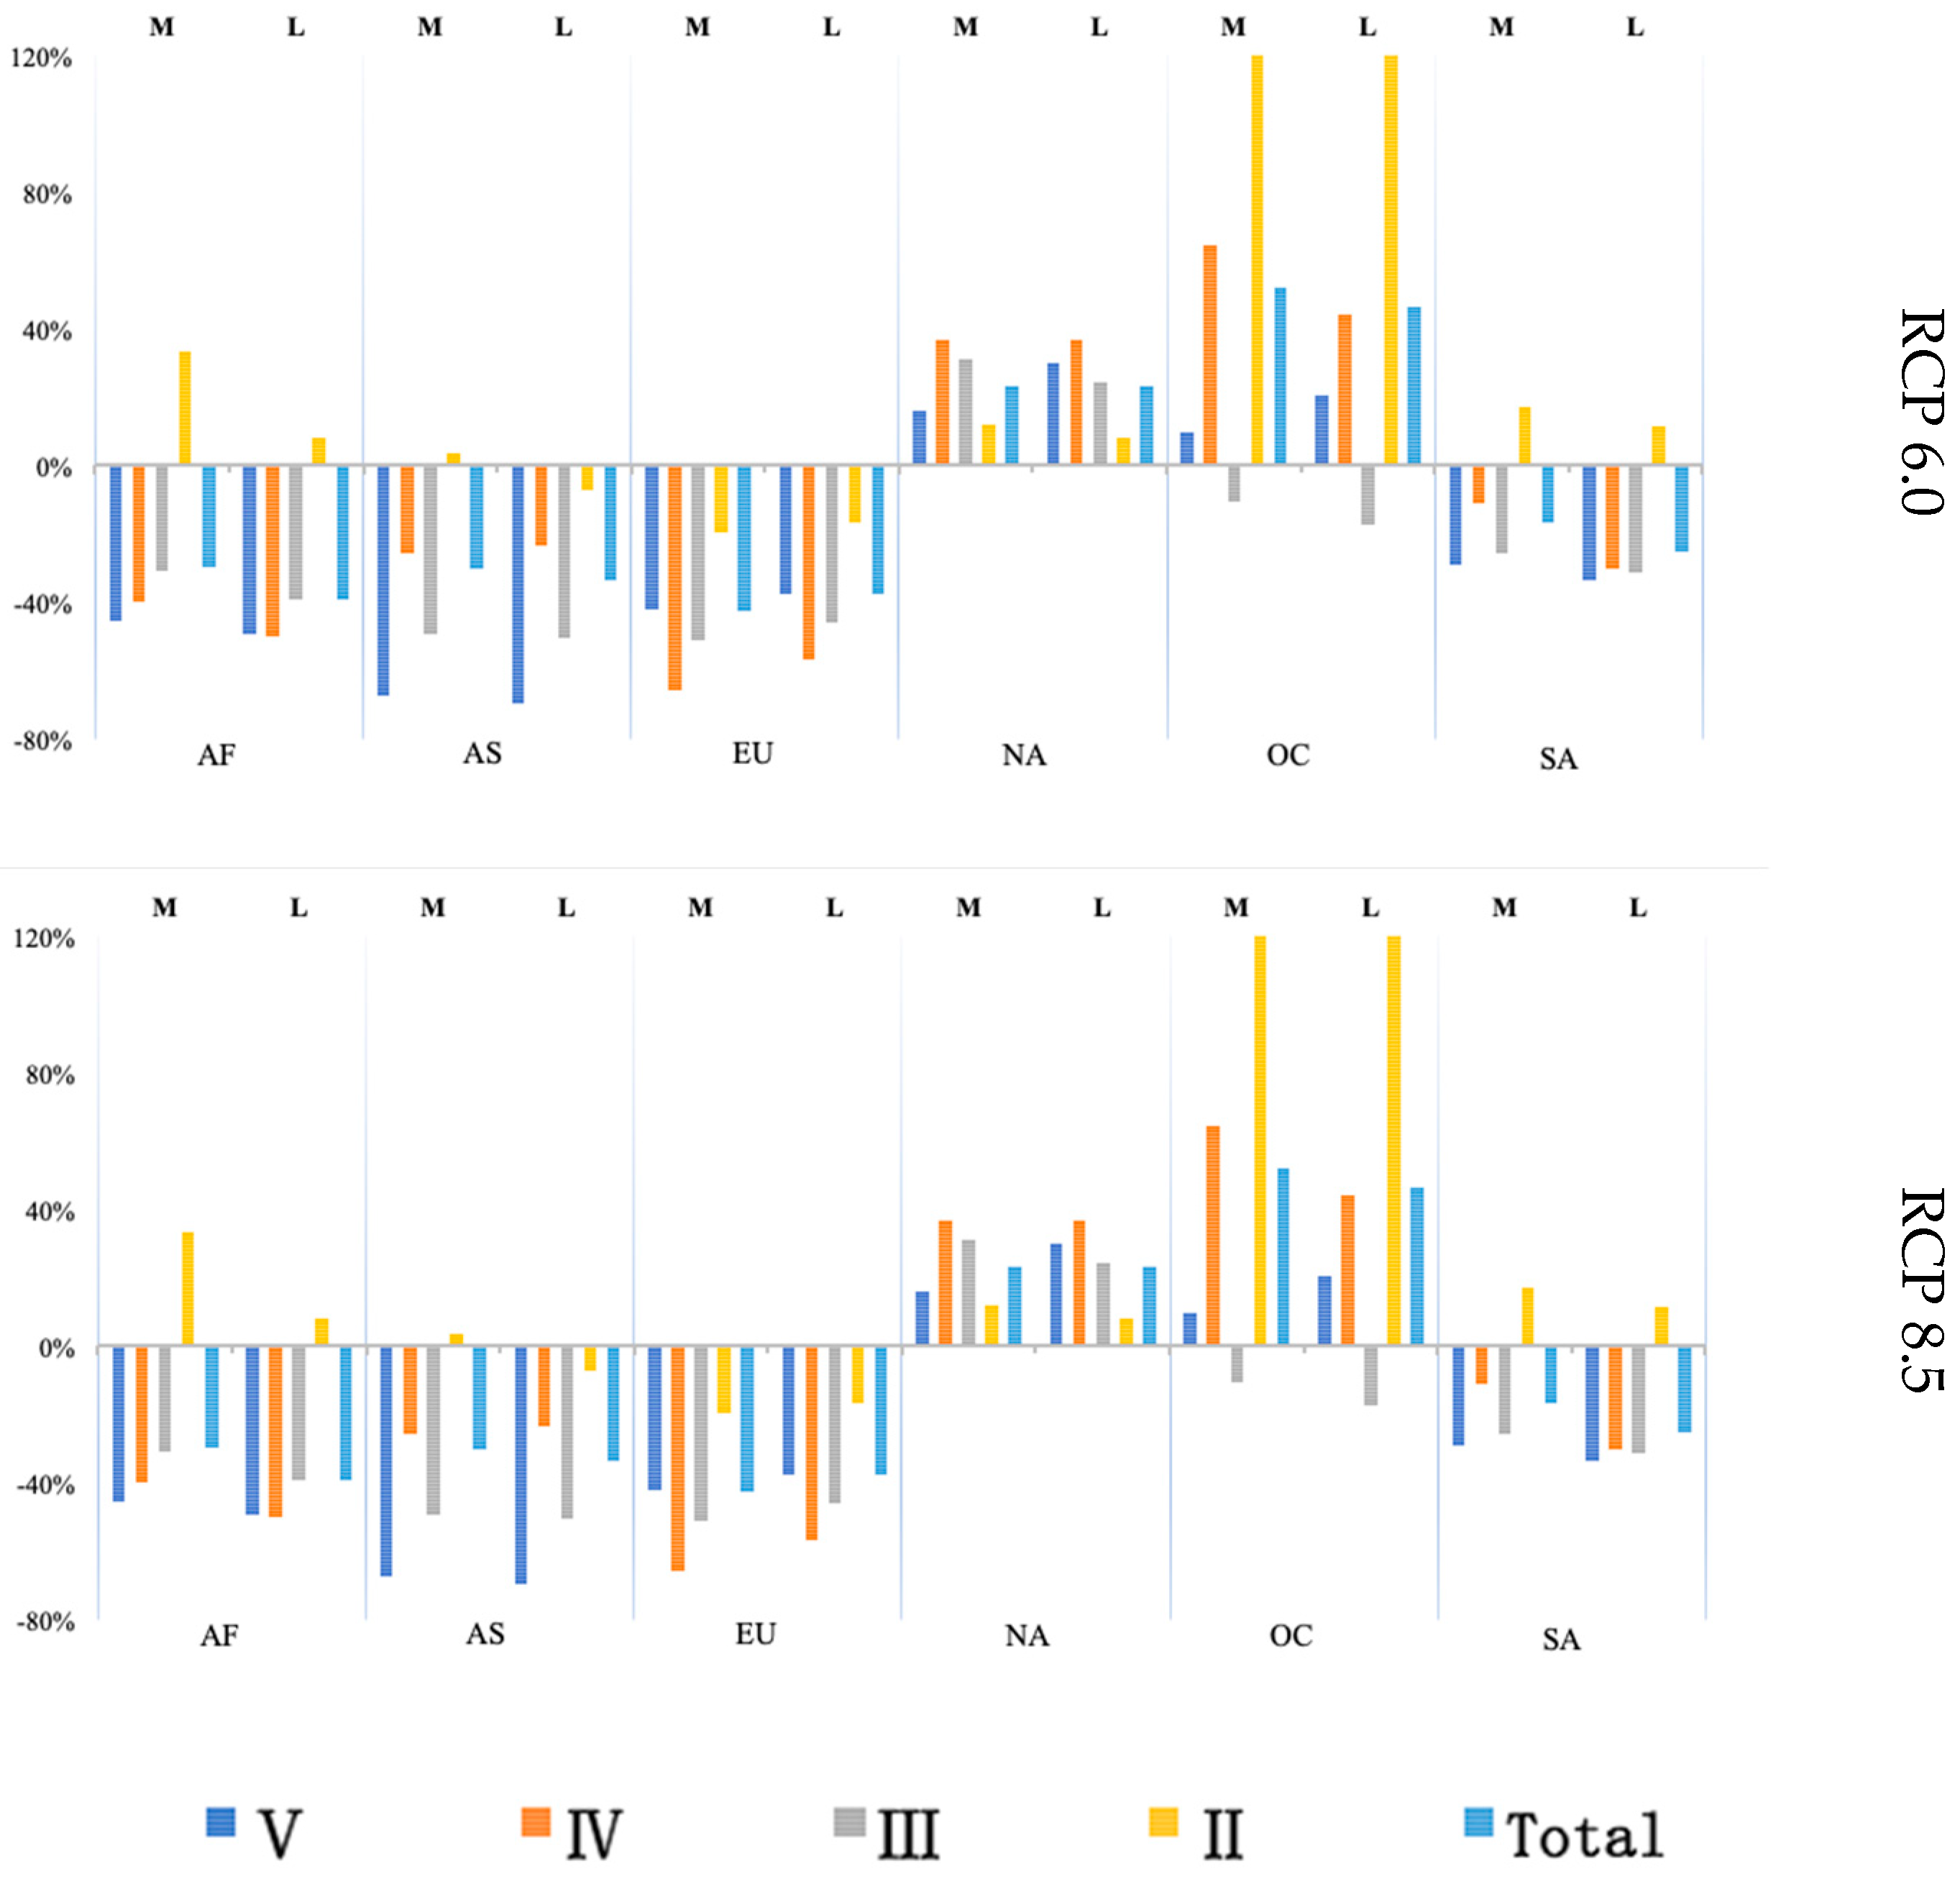
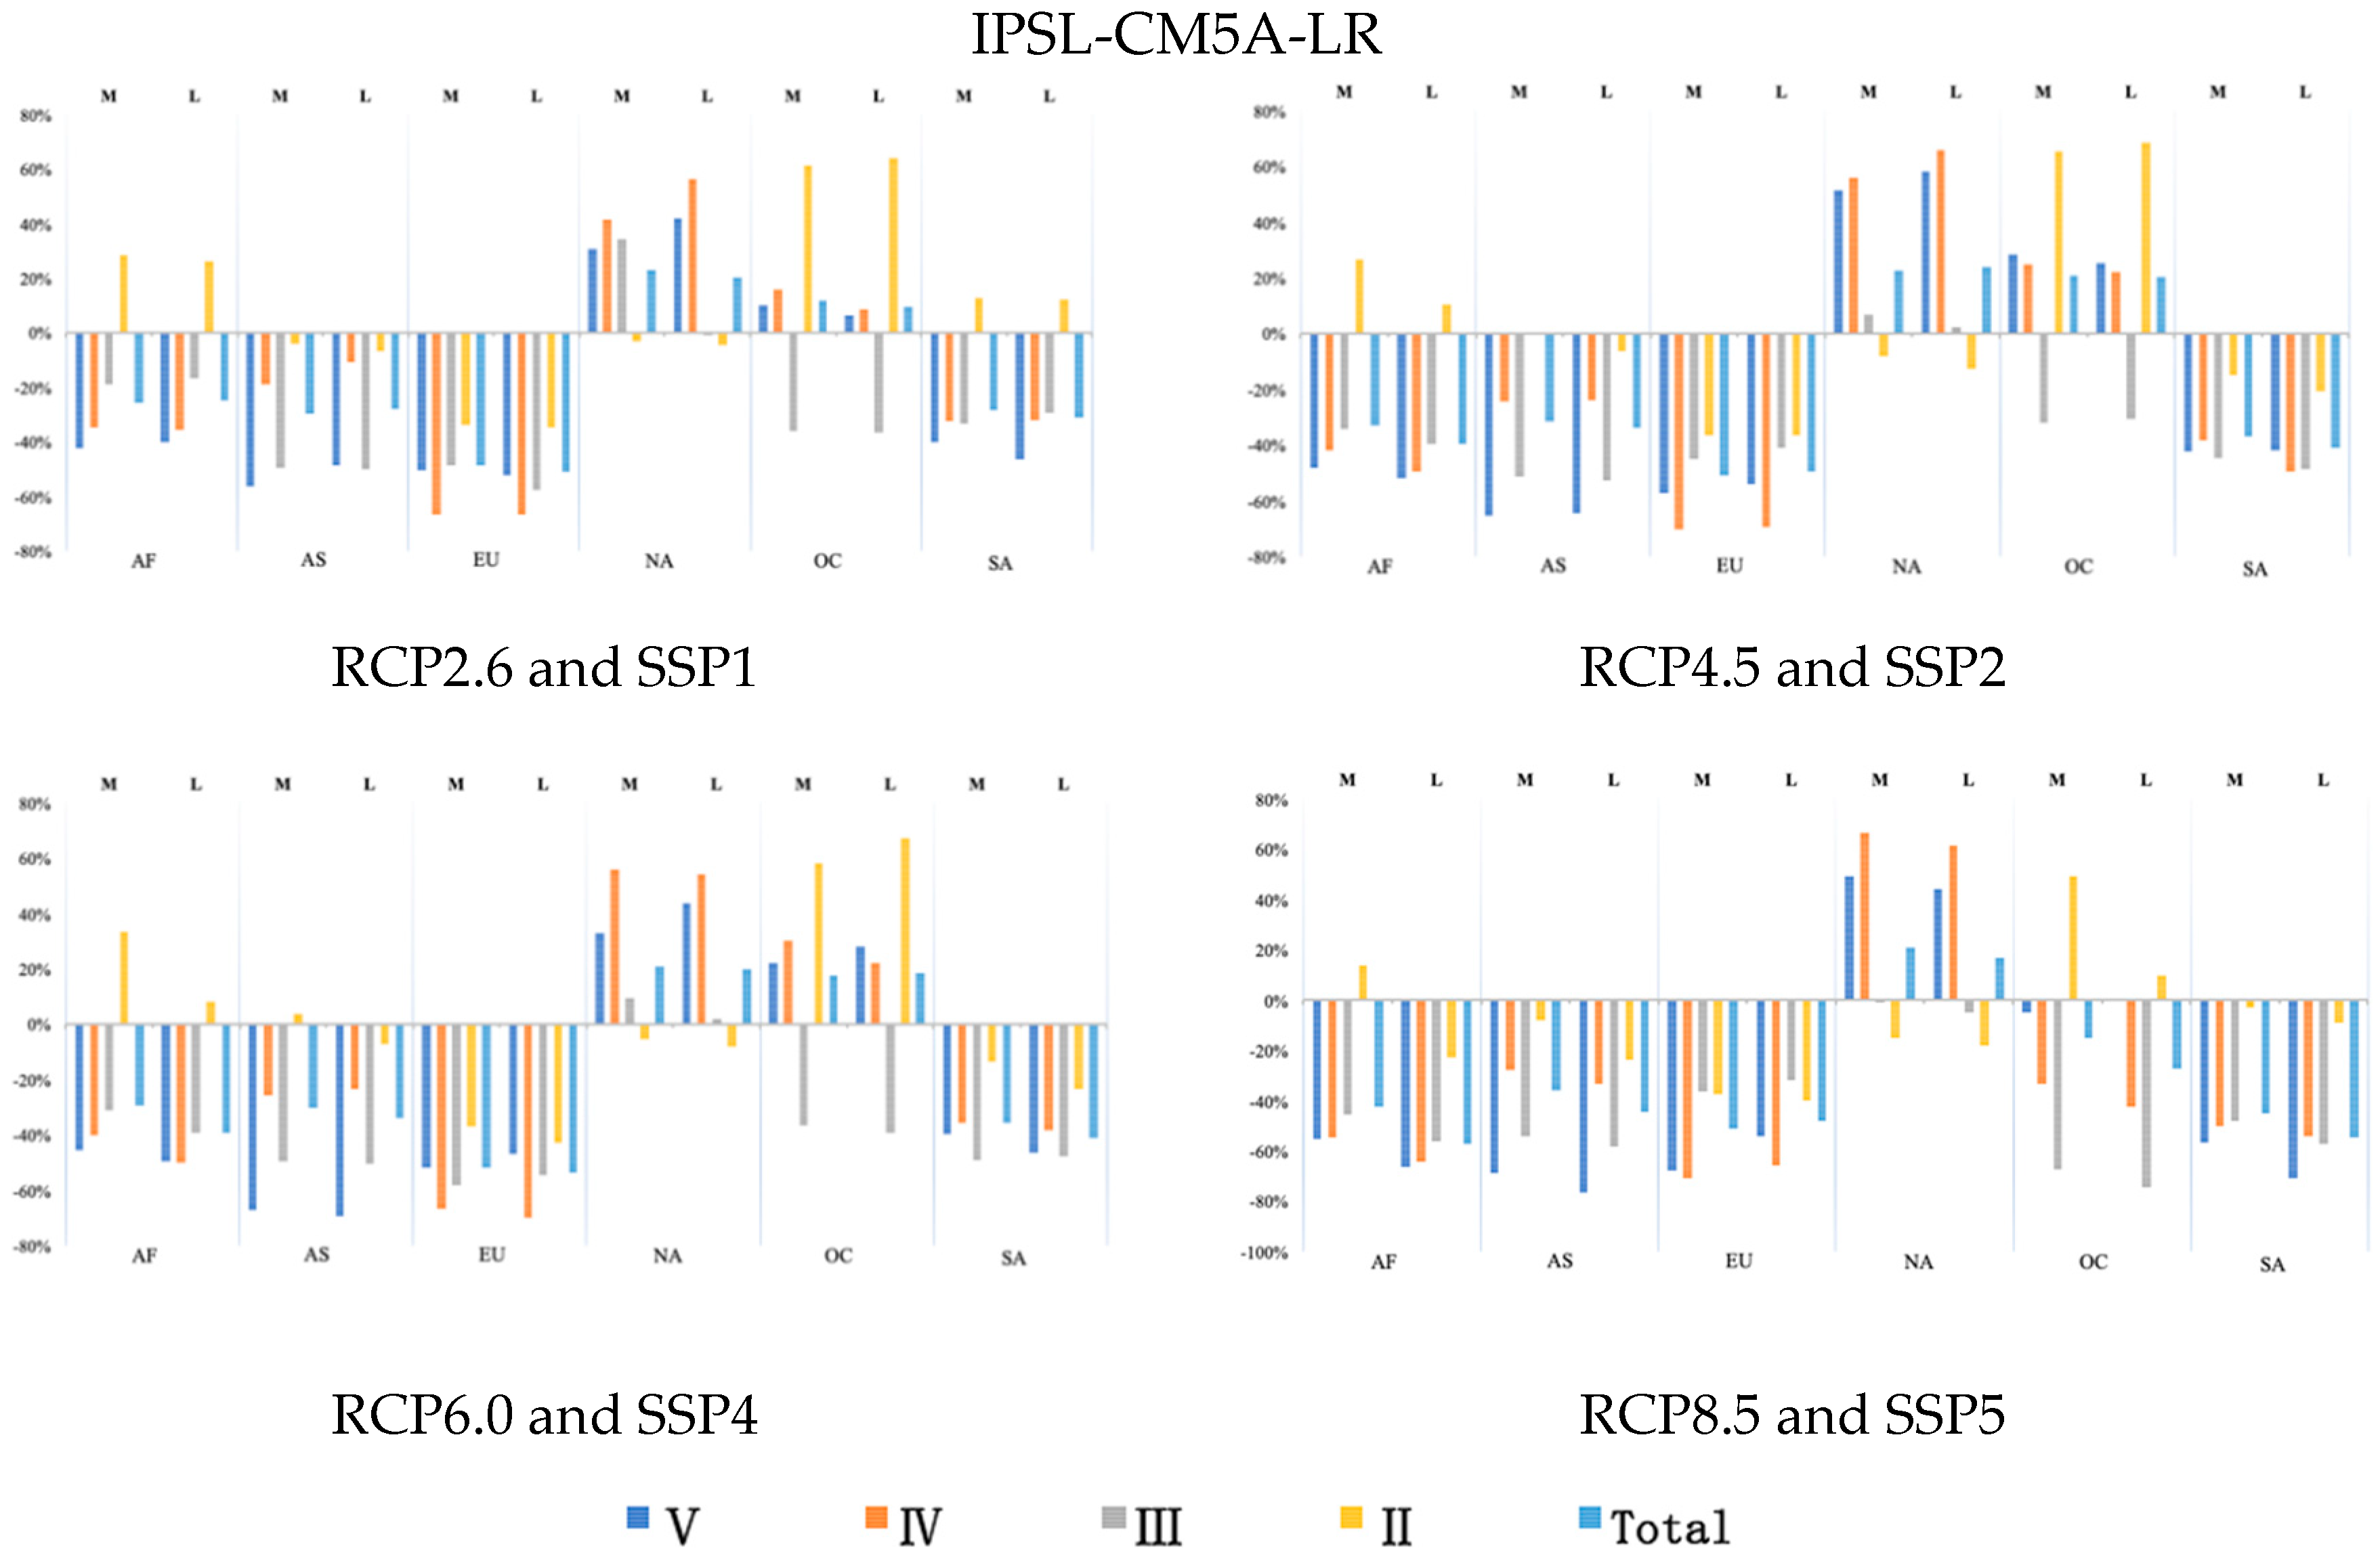
- Compared with the baseline period, the areas of the rice habitat suitability zones in Europe, Asia, Africa and South America decreased over all periods. Among them, the suitable areas of all grades in Europe showed a continuous downward trend, which decreased by 40% to 65%. The areas of the grade II and V zones in Asia decreased by over 45%, while the areas of the grade IV zones first decreased and then increased. The areas of the grade IV and V zones in Africa decreased by 30% to 40%, respectively, while the areas of the grade II zone increased significantly. The areas of the grade III to V zones in South America showed continuously decreasing trends, which decreased by 30% to 50%, and the decrease was faster from RCP2.6 to RCP8.5.
- Compared with the baseline period, the areas of the rice habitat suitability zones in North America and Oceania increased. Between them, the areas of the grade IV and V zones in North America increased significantly, by 40% to 60%, while the areas of the grade II zones increased by over 50% in Oceania. However, under the RCP8.5 and SSP5 scenarios, the areas of the rice moderate suitability zones decreased by over 60%.
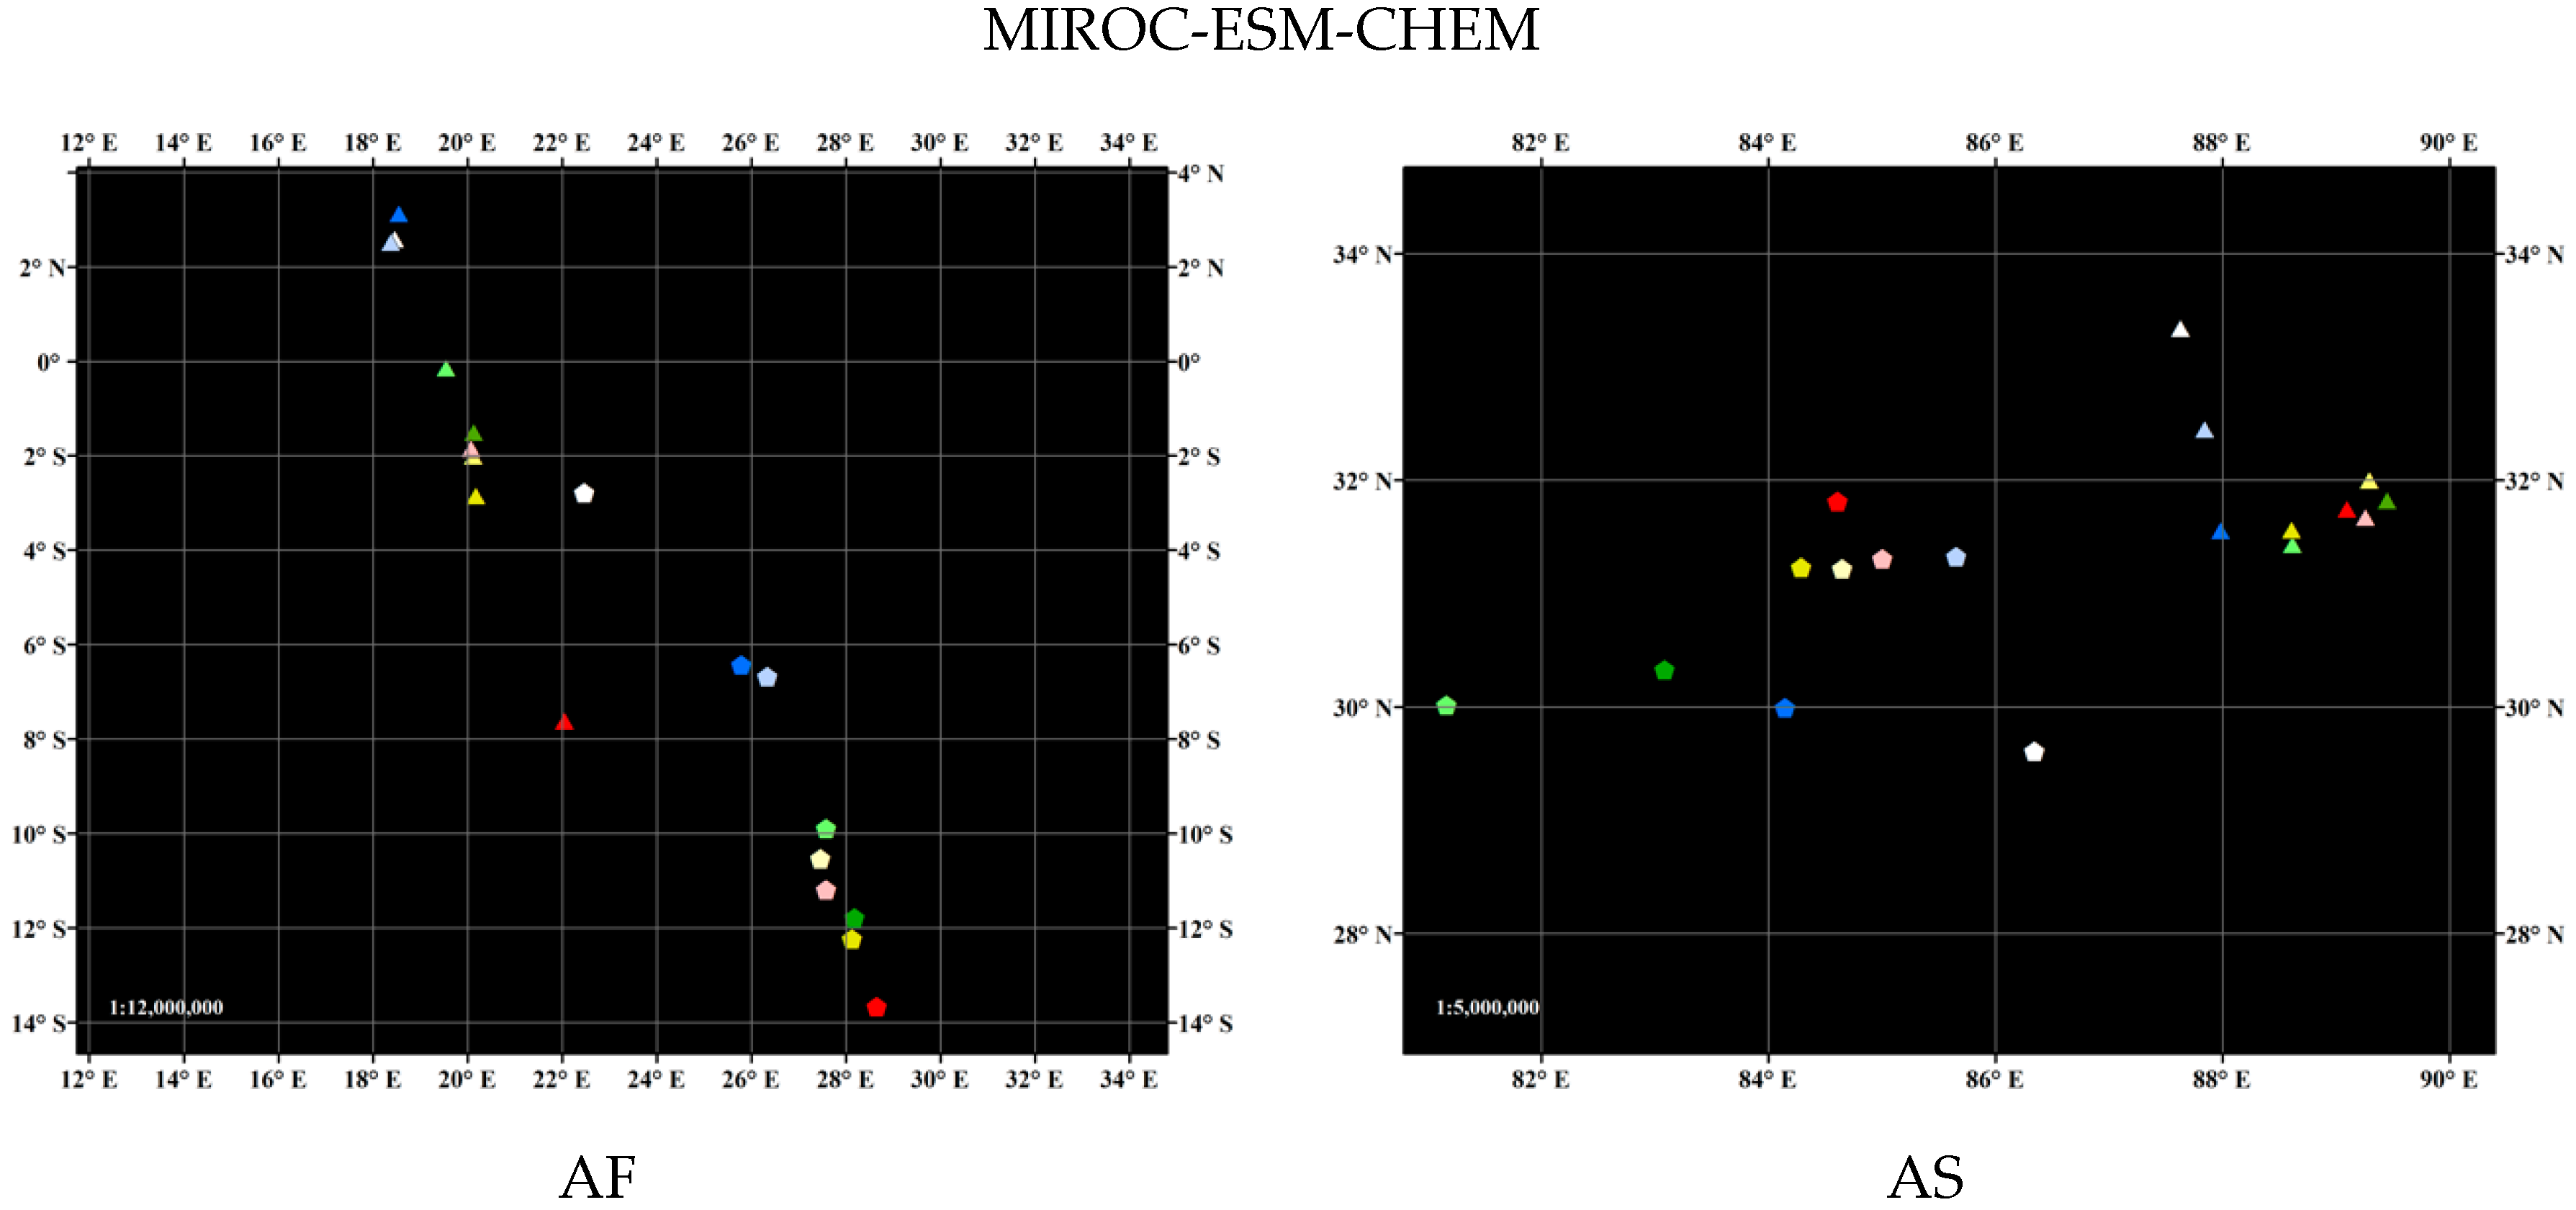
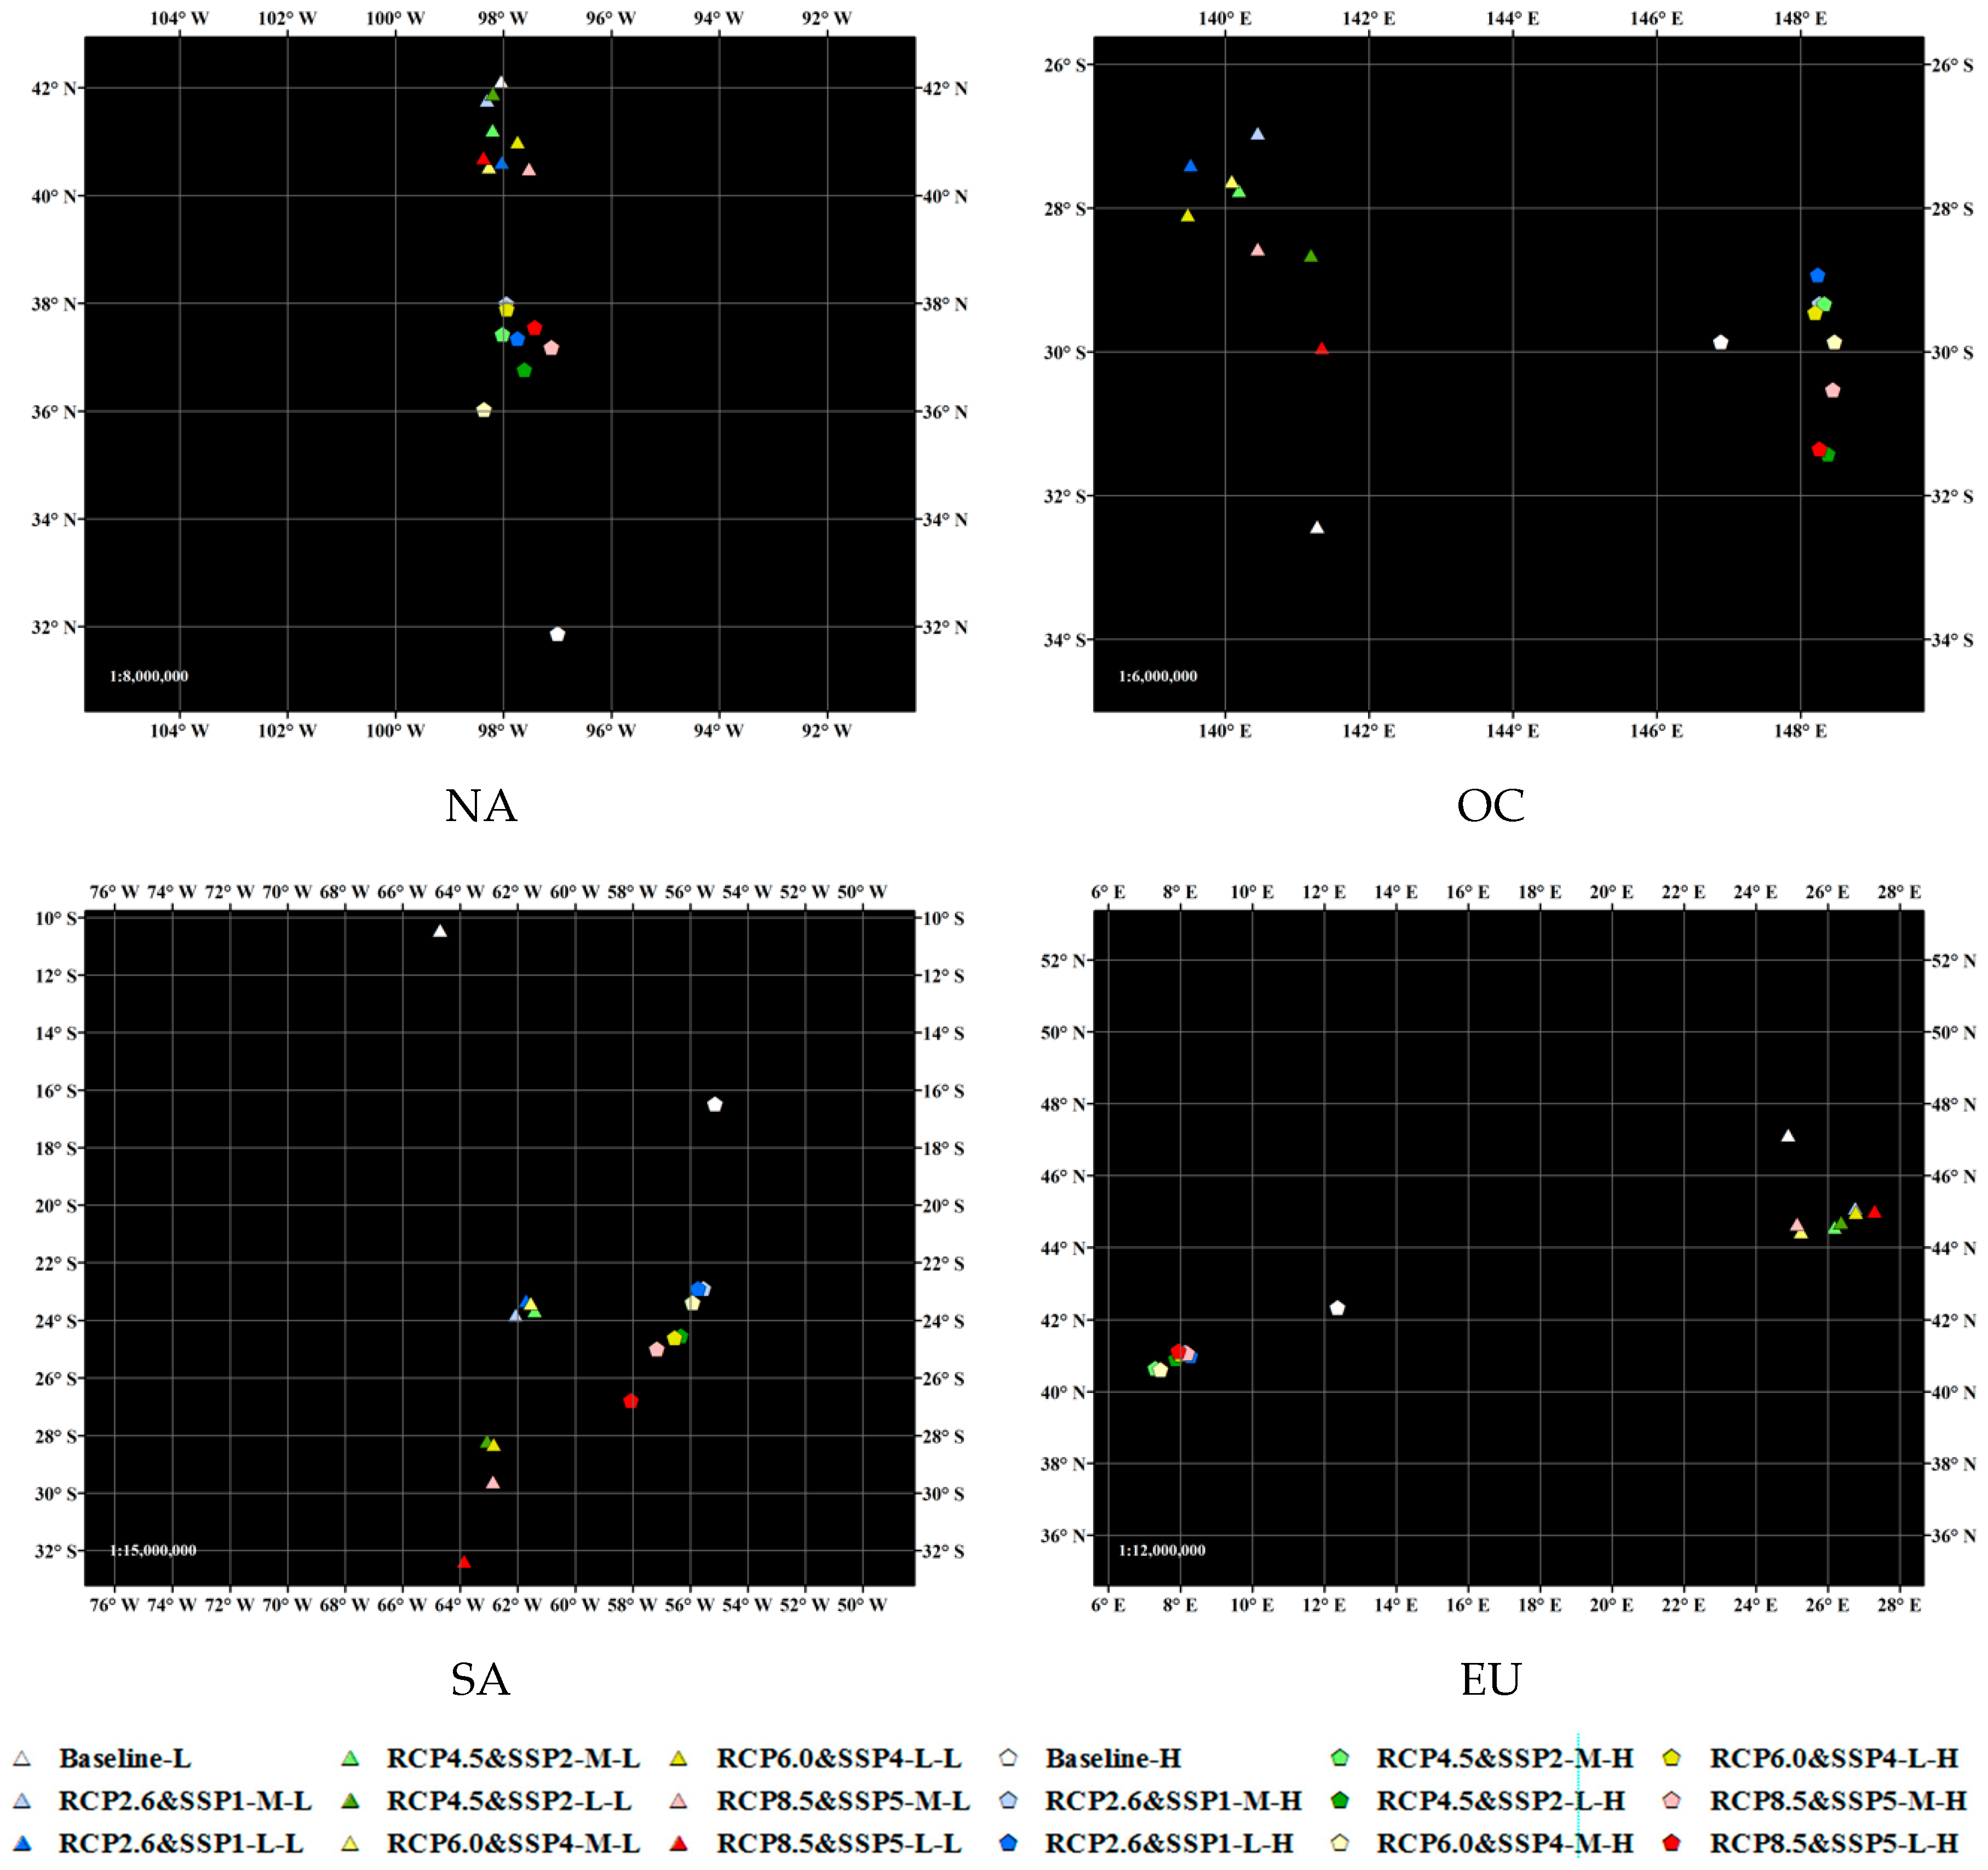
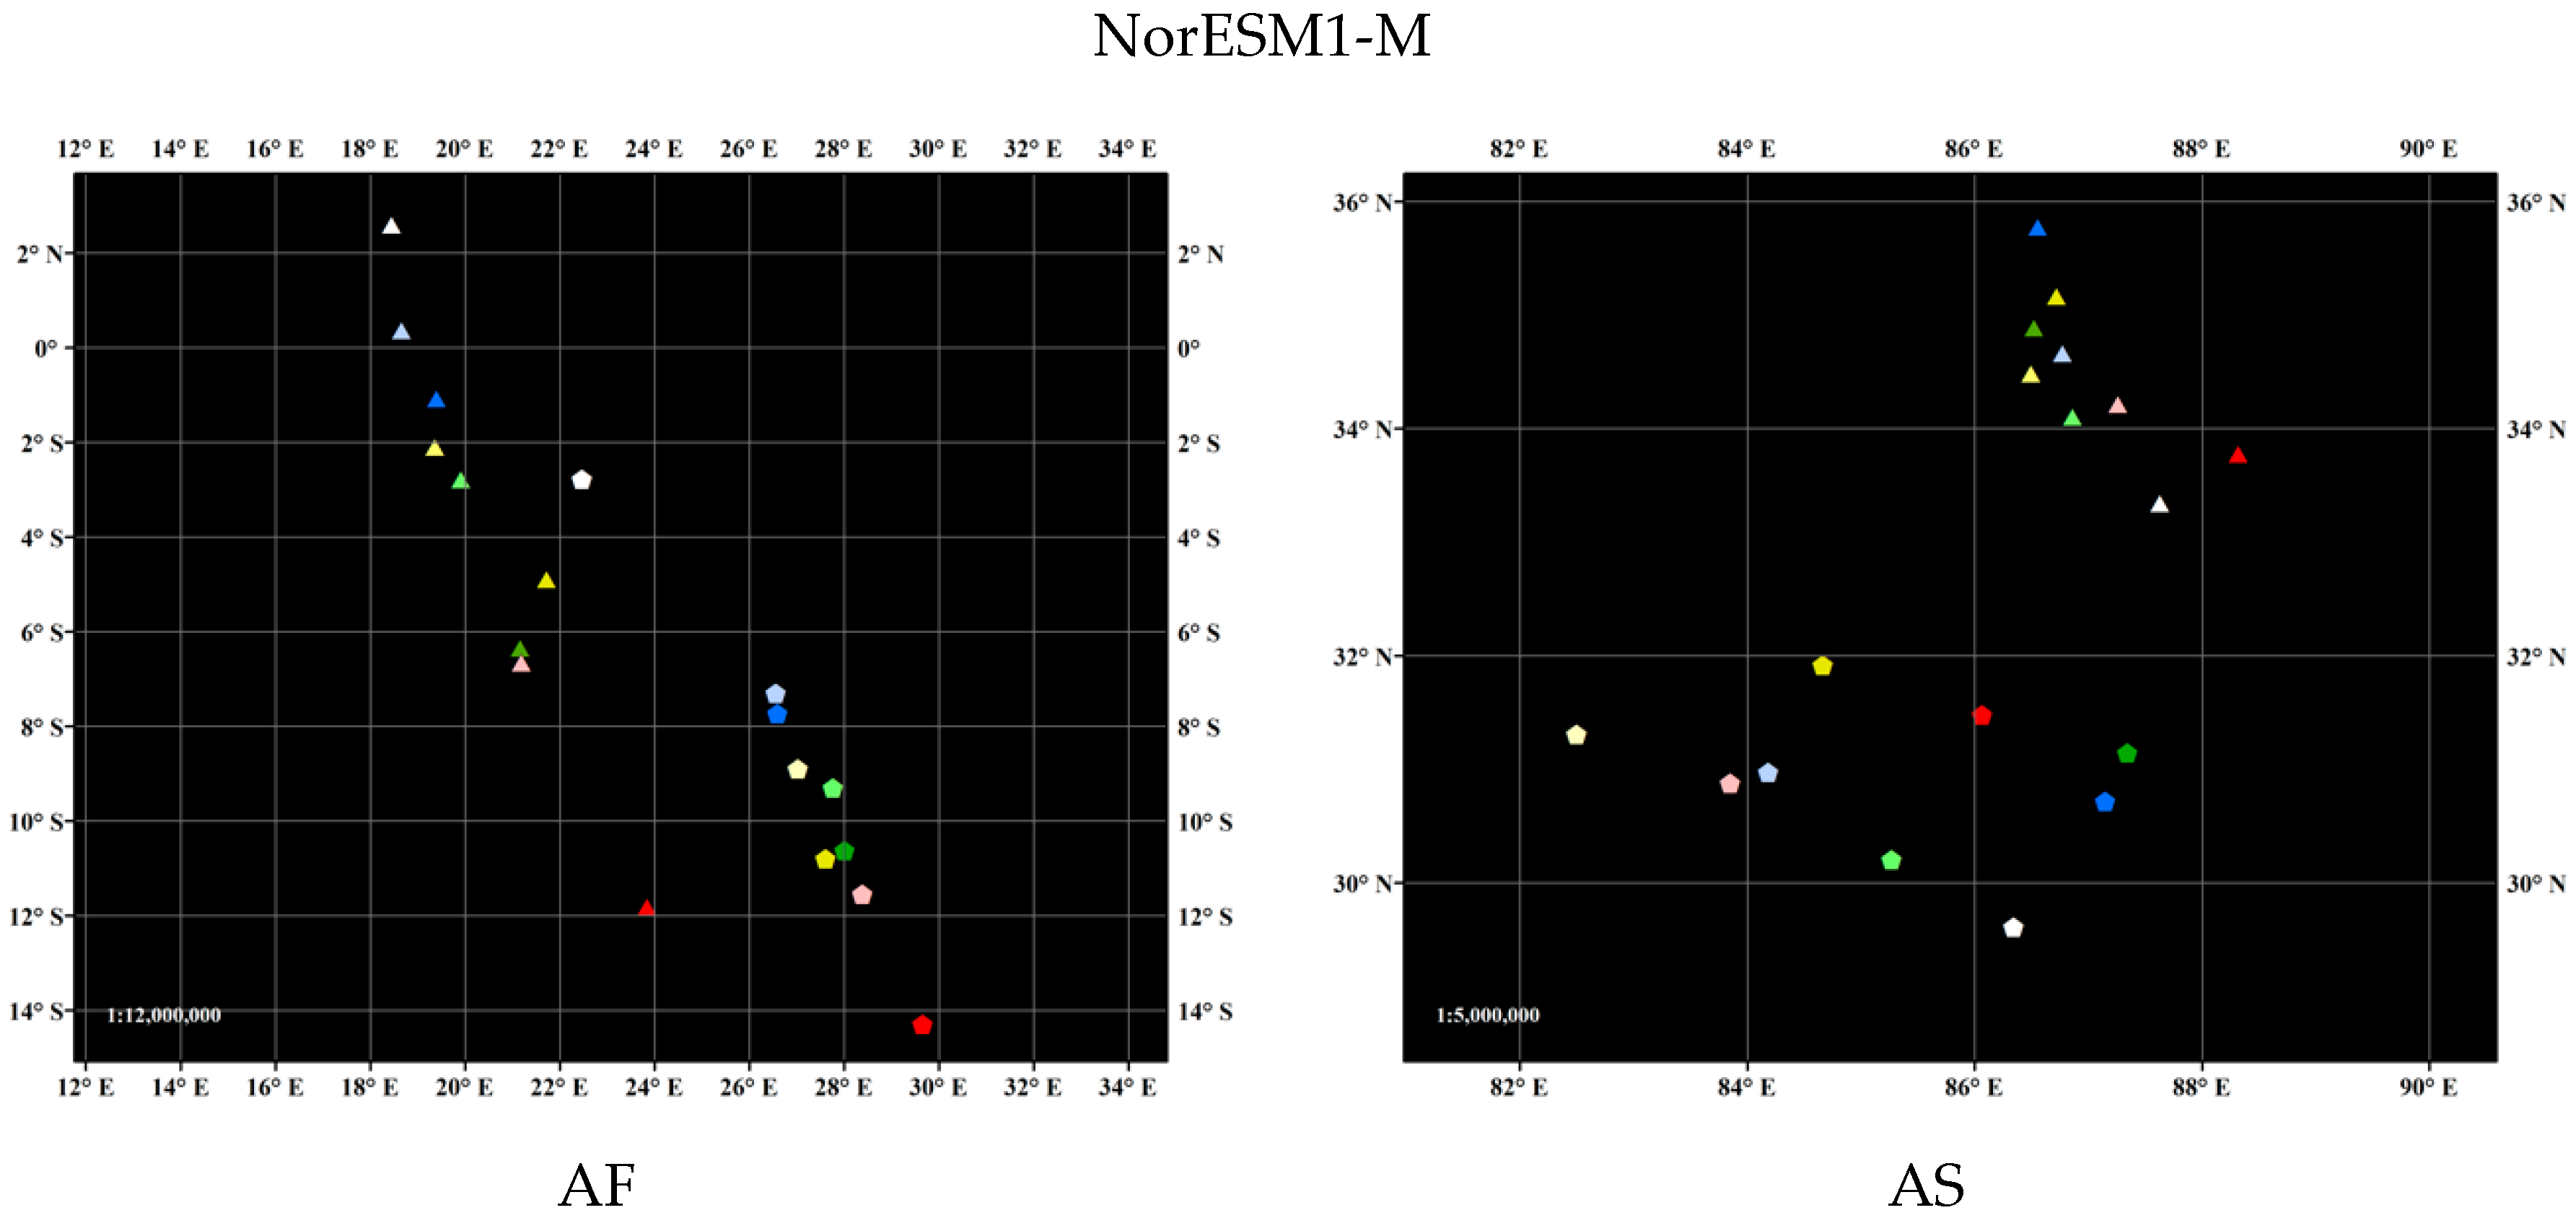
- Under the different scenarios, the rice habitat suitability zones in Africa, Asia, North America, South America and Oceania all moved to higher latitudes. The barycenters of the higher-grade suitability zones (grade IV and V zones) and the lower-grade suitability zones (grade II and III zones) in Africa moved to the southeast. The barycenters of the higher-grade suitability zones in Asia moved to the northeast, and the barycenters of the lower-grade suitability zones moved to the northwest. The barycenters of the higher-grade and the lower-grade suitability zones in South America moved to the south. The barycenters of the higher-grade suitability zones in Oceania moved to the southeast, while those of the lower-grade suitability zones moved to the north.
- Under different scenarios, the rice habitat suitability zones of all grades in Europe moved to lower latitudes, where the barycenters of both the higher-grade (IV and V) and lower-grade (II and III) suitable zones moved to the southwest.
- For the higher-grade suitability zones, Europe had the largest range of movement, up to approximately 10°, while Oceania had the smallest range of movement of only approximately 1°. The ranges of movement for the other continents were approximately 4° to 6°.
- For lower-grade suitability zones, South America had the largest movement range, up to approximately 7°, while the ranges of movement for the other continents were approximately 3° to 5°.
3.2. Spatial Changes in the High temperature Hazard Distributions
3.3. Comprehensive Analysis of Rice Exposure to High Temperature
4. Discussion
4.1. Accuracy Tests of Potential Rice Distribution Estimates
4.2. Temporal Rice Exposure to High Temperature
- (1)
- Distribution of SDDs during the rice growth period
- (i)
- The spatial distributions of the SDDs during the rice growth period were roughly the same as those of the SDD values determined without considering temporal exposure. The high-value regions during the growth period were in the Indian subcontinent, Mesopotamia, southern areas of the Sahara Desert, and the northern plateau of Mexico, although their scopes shrank. In particular, southern China shrunk the most because the original data used in this region only consisted of local, early-season rice growth period data.
- (ii)
- Changes in the SDD values without considering temporal exposure were consistent with the changes in SDDs during the rice growth period, but the change rates of the SDDs during the growth period were larger, especially on the Indian subcontinent and southern China.
- (2)
- Barycenter shift of the SDDs during the growth period
4.3. Comparative Analysis with Related Research
4.4. Limitations of This Study
4.4.1. Regional Indicator Selection and Suitability Level Division
4.4.2. Consideration of Socioeconomic Factors
5. Conclusions
- (1)
- The areas of potential rice distribution zones changed:
- (i)
- From the perspective of area changes, under different scenarios, the rice potential distribution zones continuously declined. Europe had the largest decline (approximately 50%), followed by Asia, Africa and South America (with averages of 30% to 40%). Among them, the higher-grade suitability areas in Asia and Africa dropped significantly, with a decrease of 40%–50%. There were significant declines in the areas of all suitability grades in South America, while the areas of potential distribution zones in North America and Oceania increased significantly (by approximately 30%).
- (ii)
- From the perspective of barycenter shifts, the global potential rice distribution zones generally moved to higher latitudes, except in Europe, which moved to lower latitudes. The movement ranges in terms of latitude were the largest in Europe, 6–10°, while Oceania had the smallest range of movement, 1–3°.
- (2)
- The effects of rice exposure to high temperature, and the intensities of the high temperature hazards, had the following characteristics:
- (i)
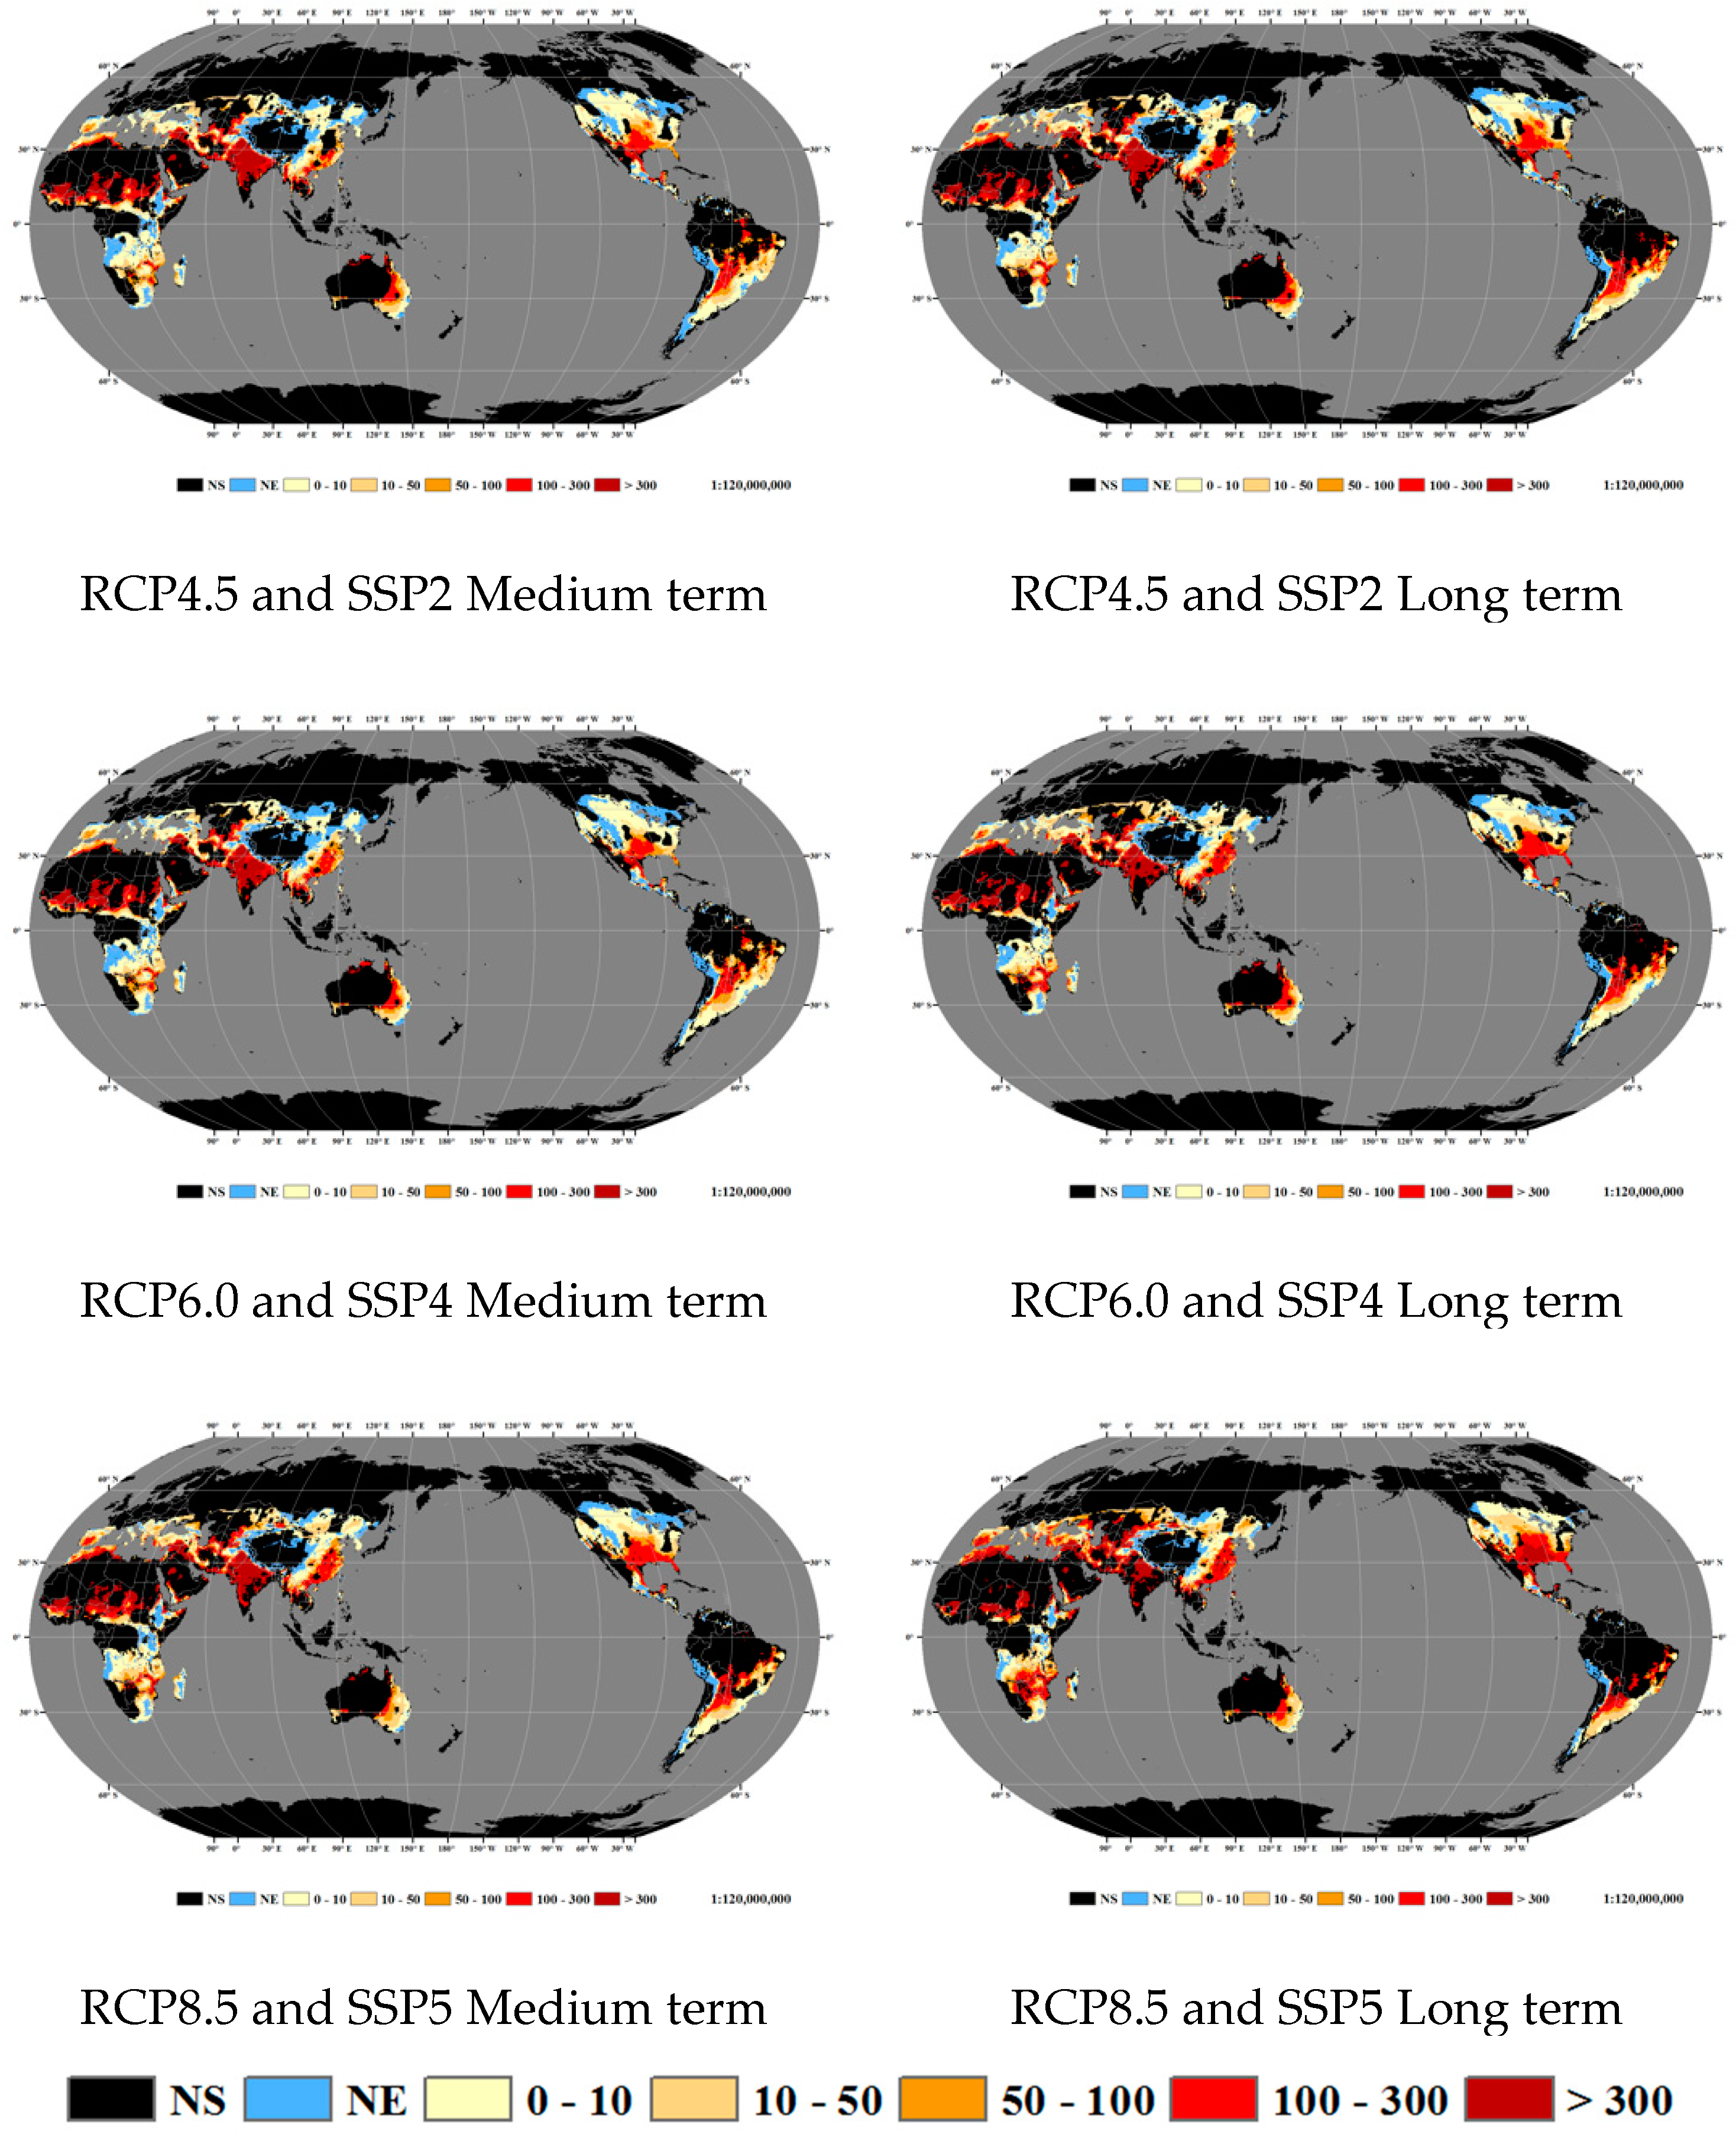
- High temperature exposure was concentrated on the Indian subcontinent, Asia Minor, Sudanian Savanna, the north plains of the Mexican Plateau, La Plata plains, the southwestern parts of the Great Dividing Range in Australia, and southern China, where the SDDs were high, with averages of 100–500.
- (ii)
- The SDD values in potential rice distribution zones showed continuous and significant increases. The SDDs increased from RCP2.6 to RCP8.5, especially on the Indian subcontinent, the monsoon region of China, southeastern United States, south-central South America, the southeastern parts of Australia and the Iberian Peninsula, where the SDD increased by over 3 to 5 times.
- (iii)
- High temperature exposure on the Indian subcontinent, Indo-China and the Sudanese prairie region all decreased significantly, while the Mediterranean Sea, central and southern Africa, the east coast of South America, northeast China, and central North America all increased.
- (3)
- The characteristics of the comprehensive changes in high temperature exposure and their effect on rice are summarized as follows. In each scenario, the degree of exposure change on each continent showed a floating variation. From the overall characteristics of high temperature exposure, changes in Asia were significantly aggravated, and South America showed significant reductions. In Africa, the performance was generally aggravated, while the rest of the continents generally had fewer or no significant changes.
Author Contributions
Funding
Conflicts of Interest
Appendix A
Appendix A.1. Pattern of Rice Suitability Zones



Appendix A.2. Changes in the Area of the Rice Suitability Zone


Appendix A.3. Changes in the Barycenter of the Rice Suitability Zone

Appendix A.4. Pattern of Rice Exposure to High Temperature


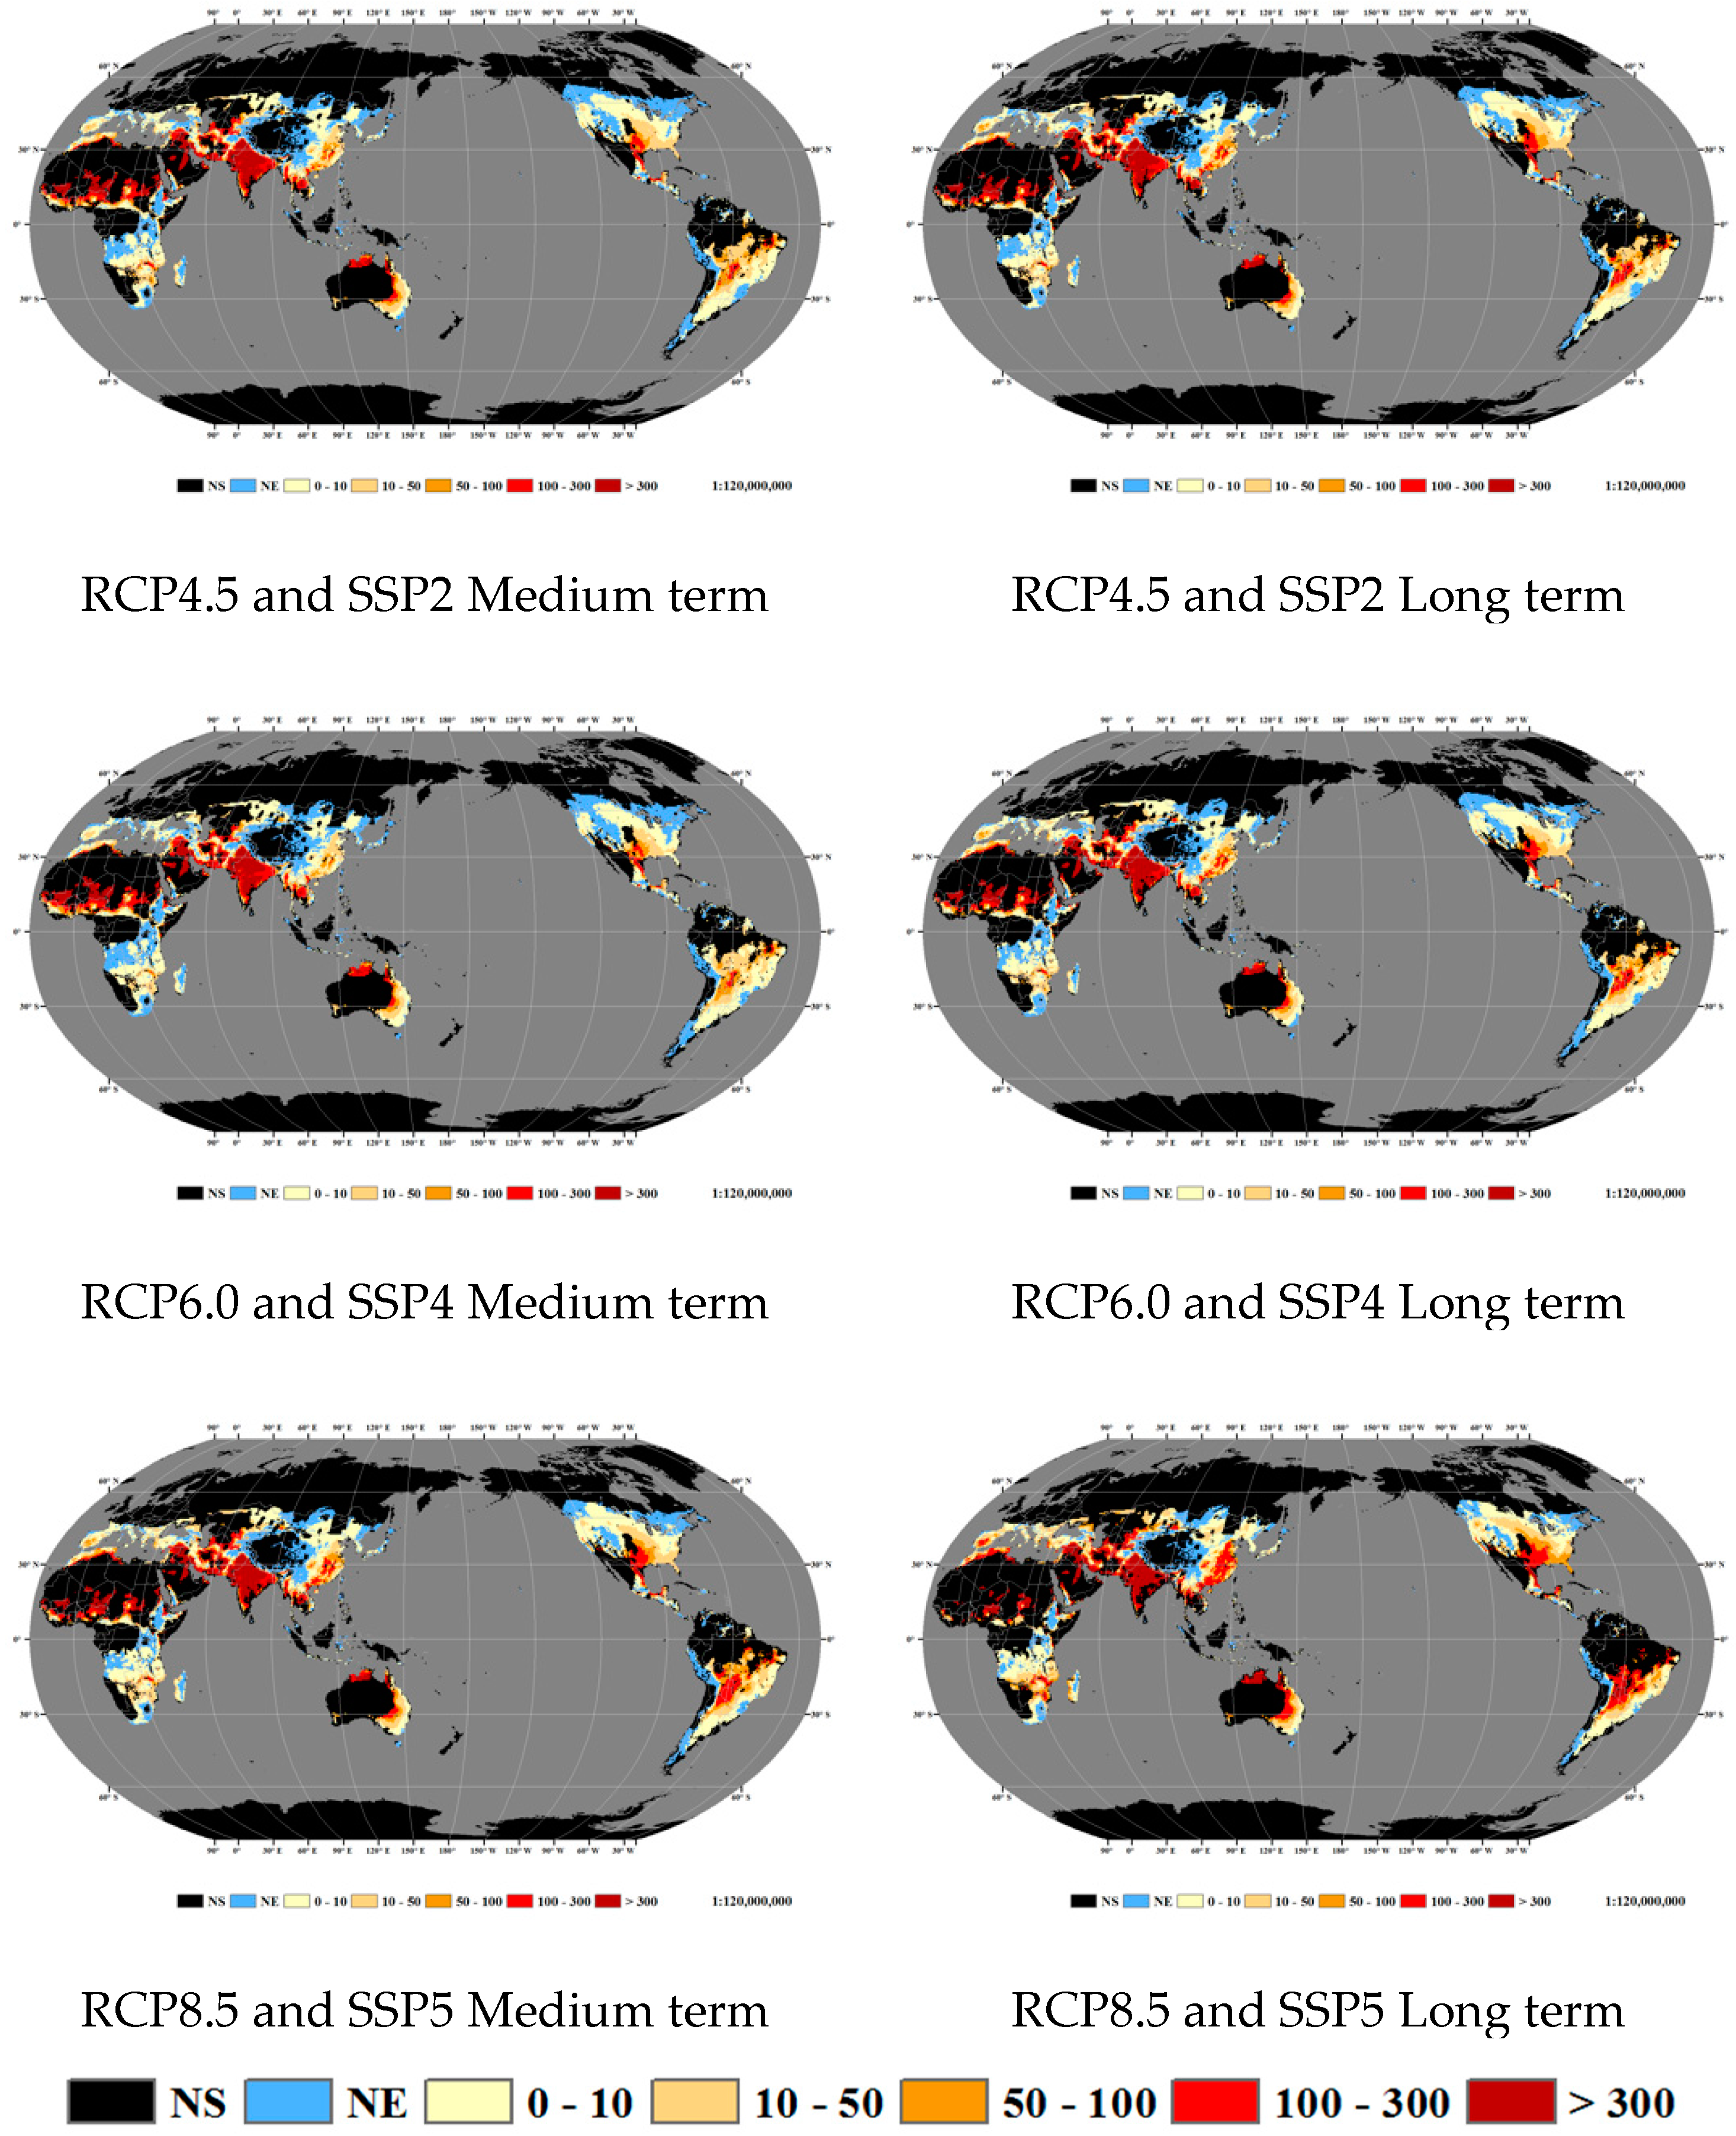
Appendix A.5. Changes in the High Temperature Hazards (SDD)
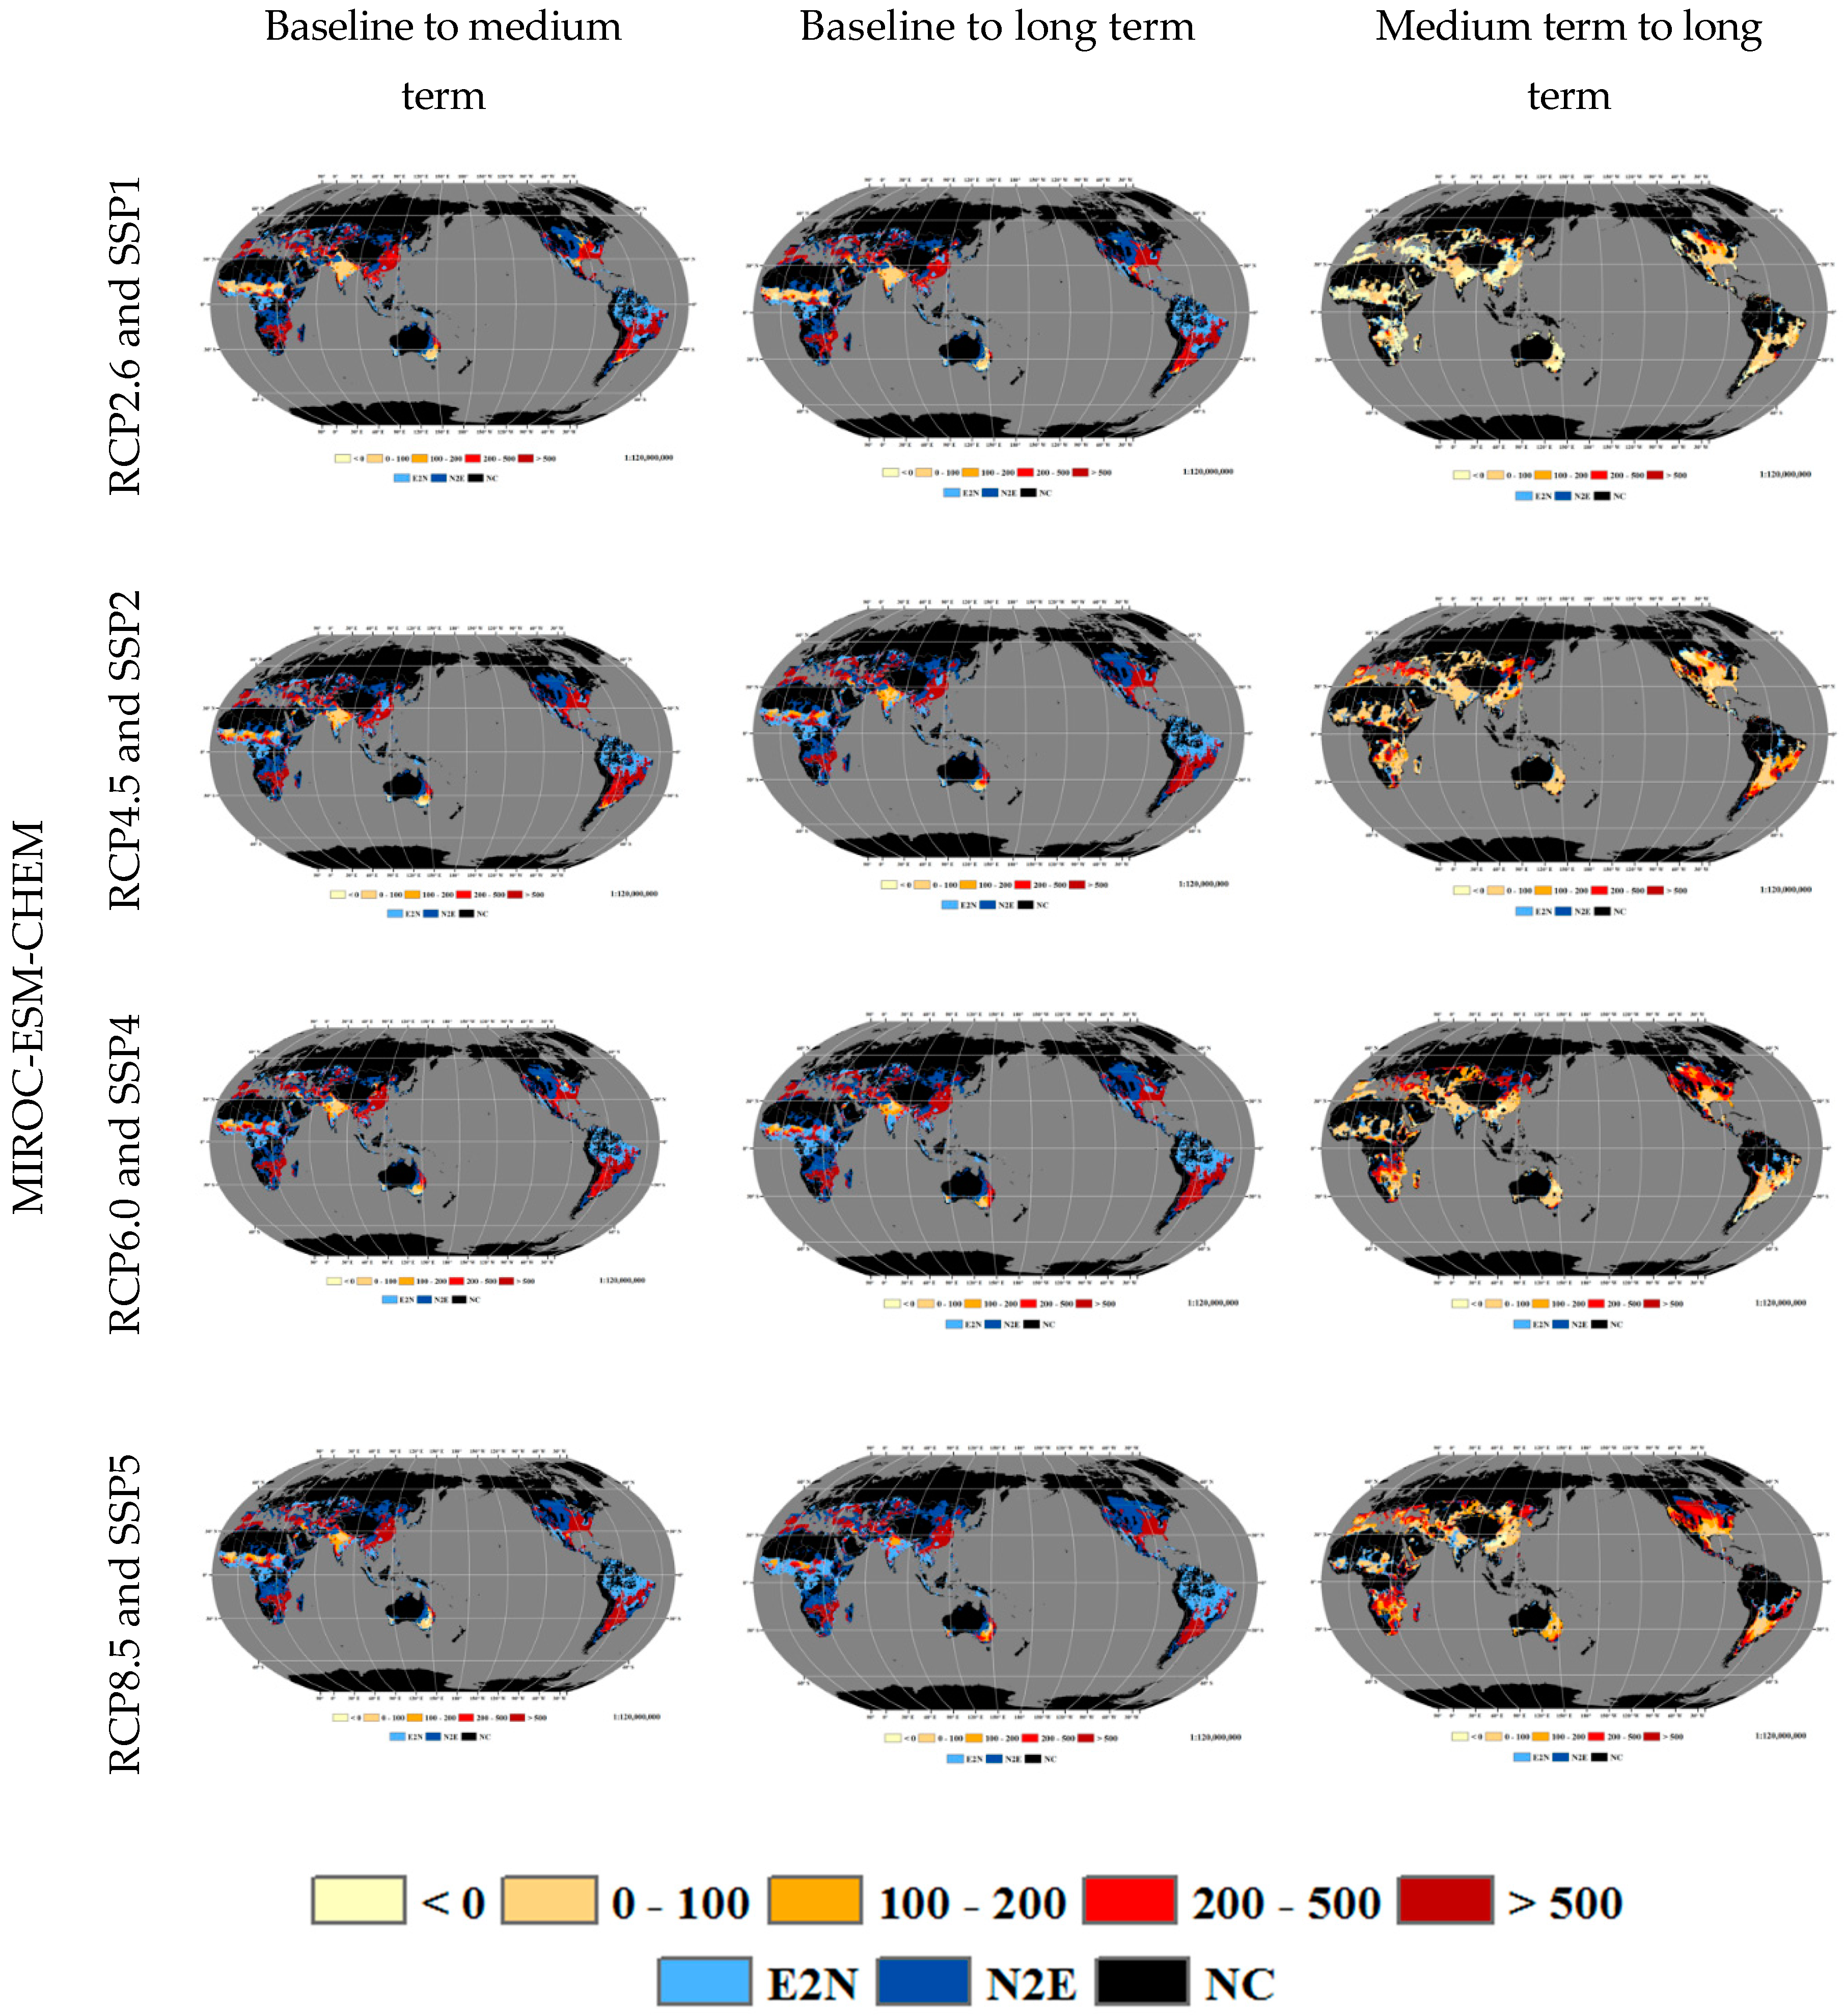

Appendix A.6. Changes in the Barycenter of the High Temperature Hazards (SDD)


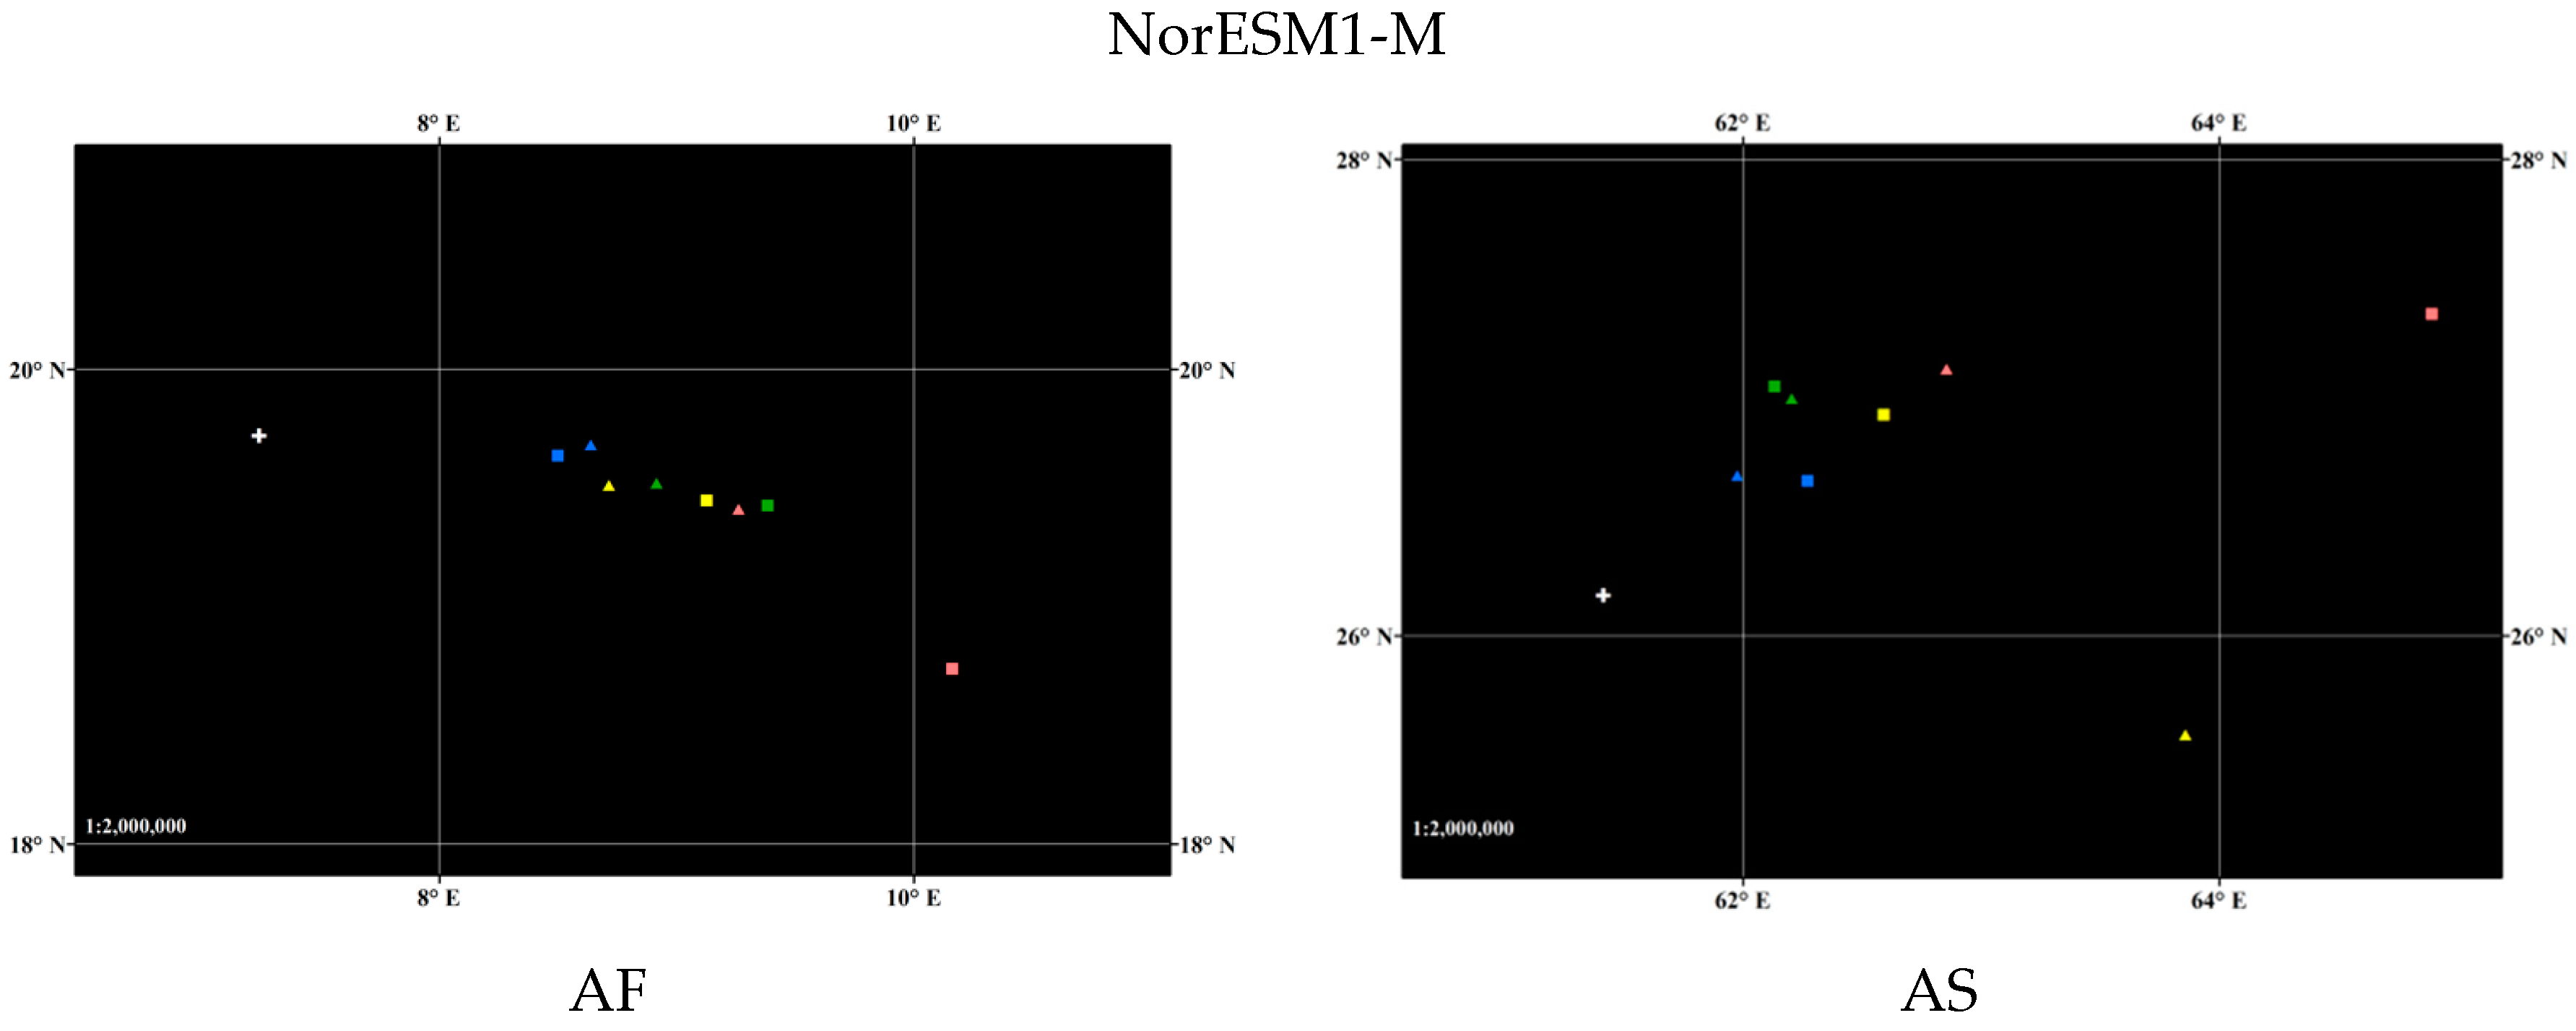
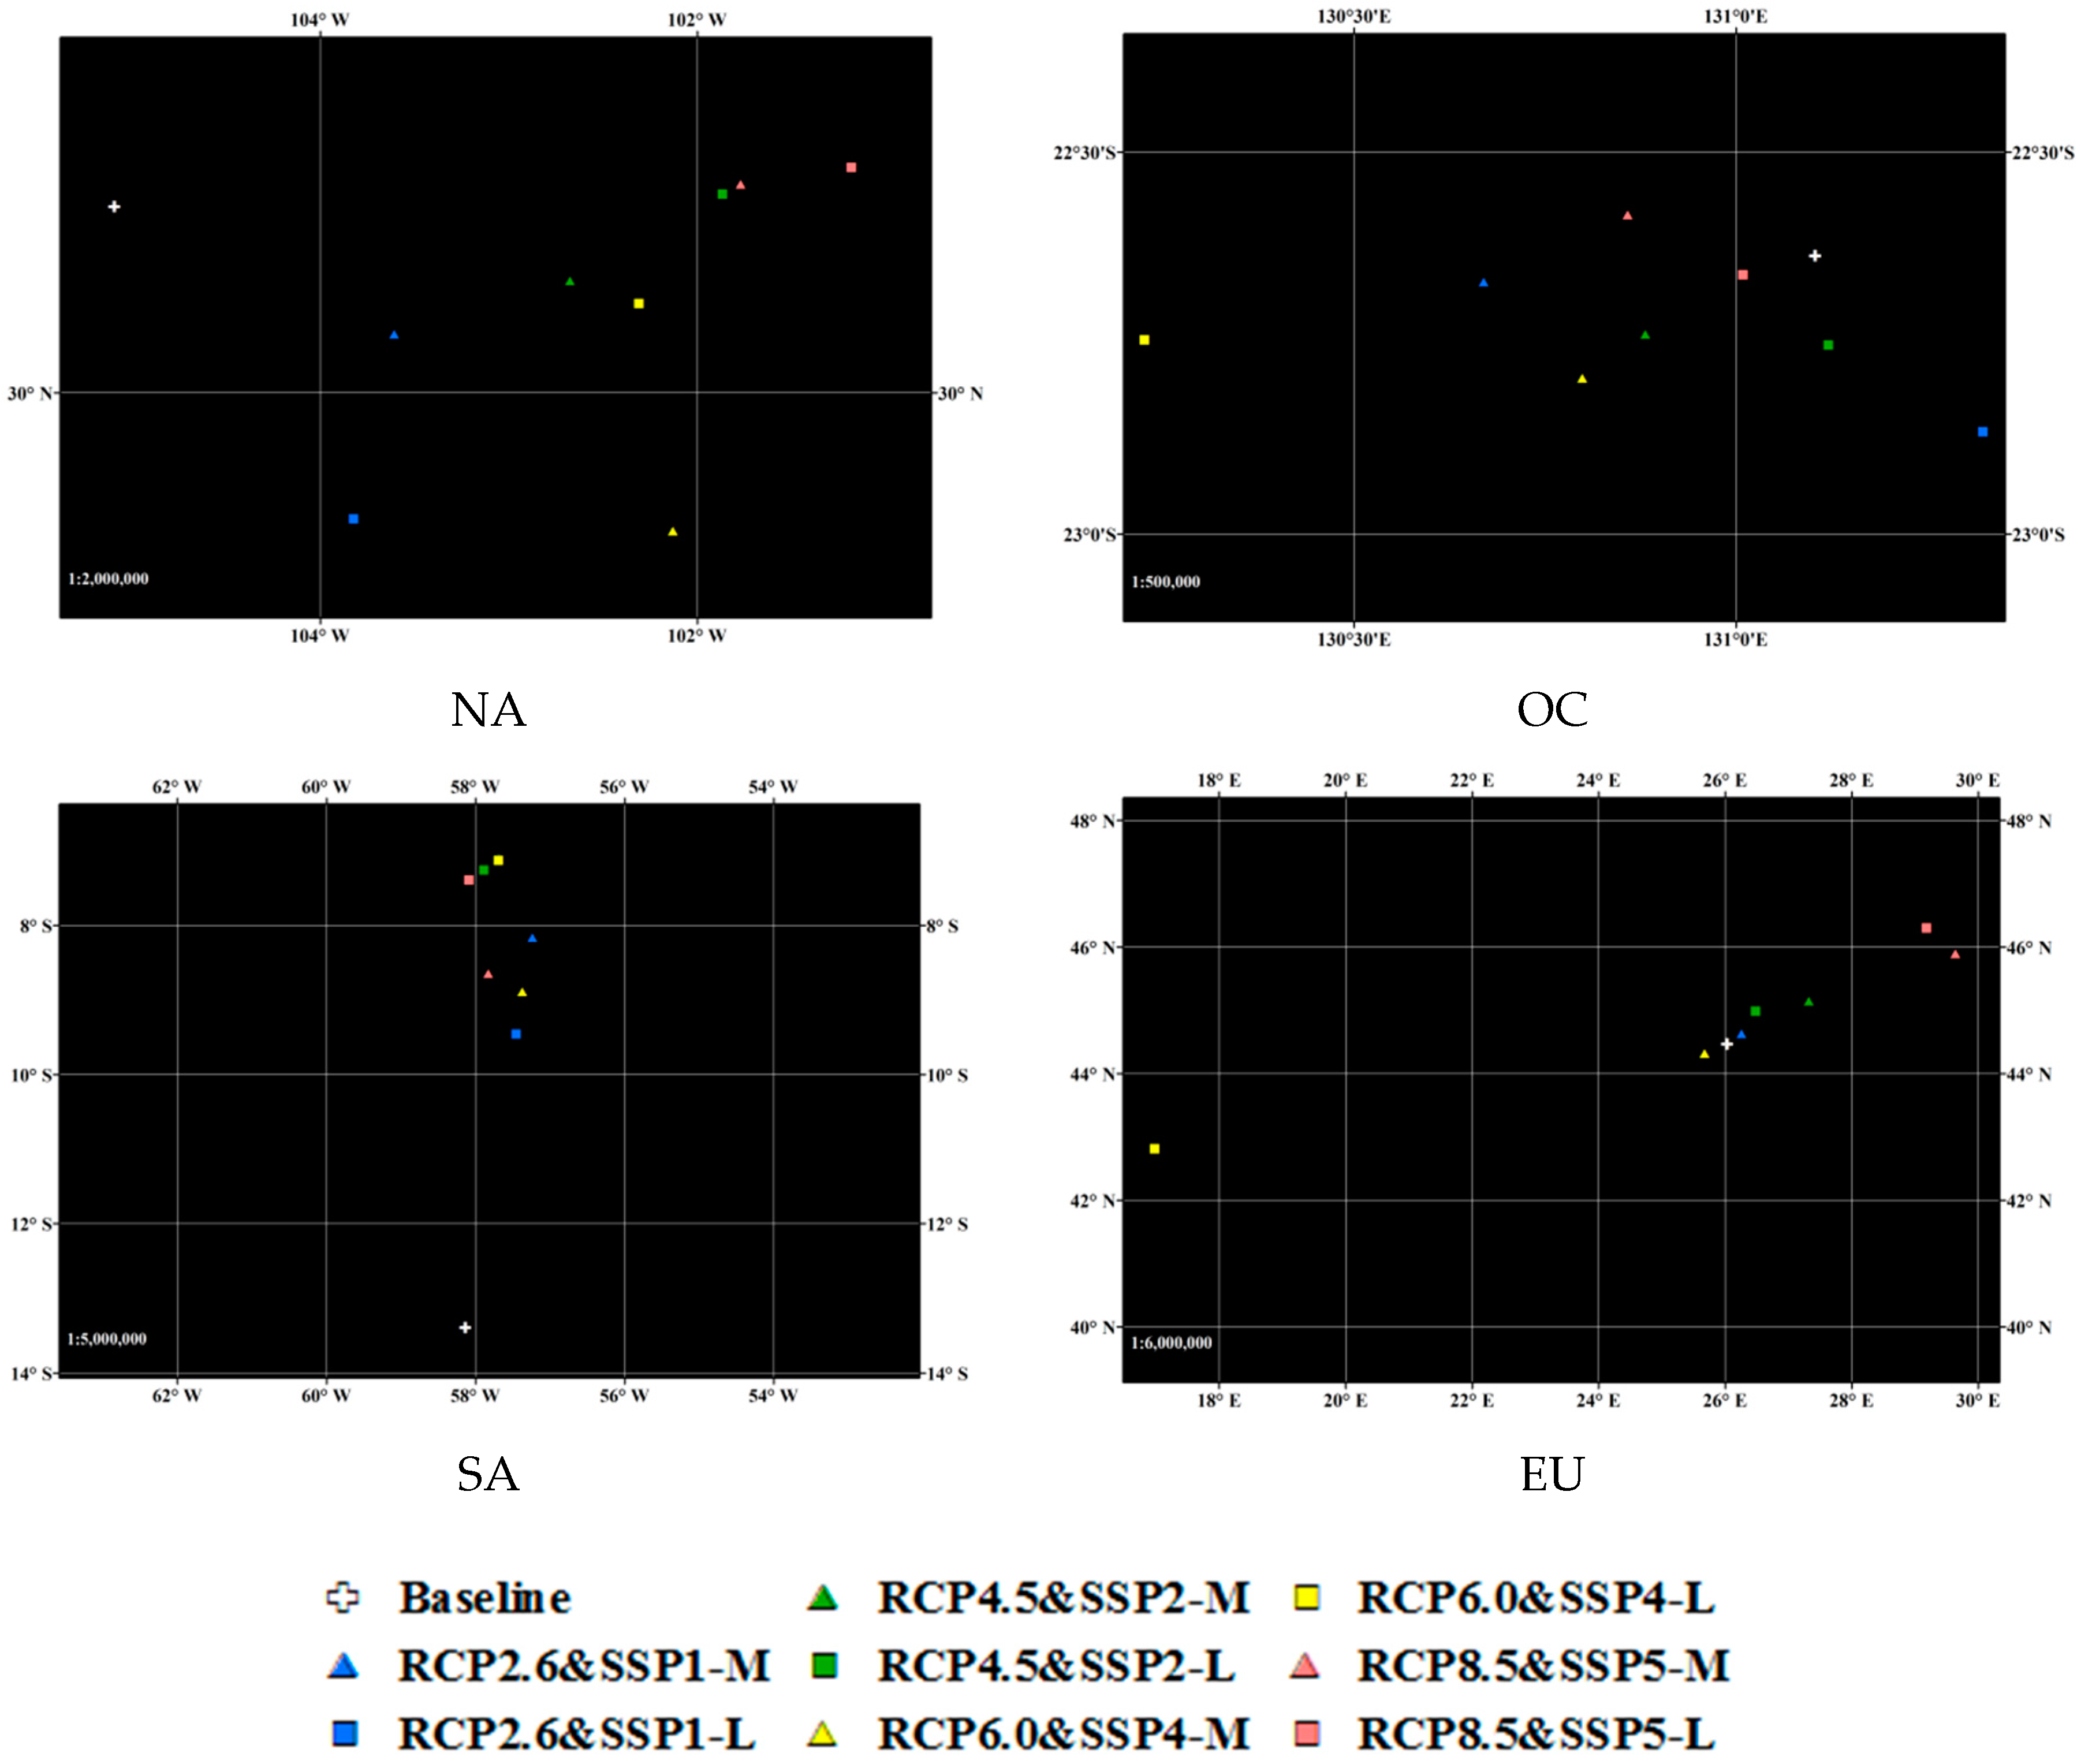
Appendix A.7. Comprehensive Characteristics of the Changes in High Temperature Exposure
| Continents | SYD | RCP2.6 and SSP1 | RCP4.5 and SSP2 | RCP6.0 and SSP4 | RCP8.5 and SSP5 | Avg |
|---|---|---|---|---|---|---|
| BM-ML | BM-ML | BM-ML | BM-ML | BM-ML | ||
| AF | High | ++ | +0 | +0 | +0 | +0 |
| Low | 0+ | 00 | 00 | 0+ | 0+ | |
| AS | High | 0+ | 0+ | -0 | 00 | 0+ |
| Low | 0+ | 0- | 0+ | -- | 00 | |
| EU | High | -0 | -0 | -0 | -+ | -0 |
| Low | -+ | -0 | -0 | -0 | -0 | |
| NA | High | -0 | -0 | -0 | 0+ | -+ |
| Low | -+ | -+ | -0 | -+ | -+ | |
| OC | High | 0+ | 0+ | 0+ | 0+ | 00 |
| Low | 00 | 00 | 00 | 00 | 0+ | |
| SA | High | -0 | -0 | -+ | -- | -0 |
| Low | -- | -- | -0 | -- | -- |
| Continents | SYD | RCP2.6& and SSP1 | RCP4.5& and SSP2 | RCP6.0& and SSP4 | RCP8.5& and SSP5 | Avg |
|---|---|---|---|---|---|---|
| BM-ML | BM-ML | BM-ML | BM-ML | BM-ML | ||
| AF | High | -0 | -0 | -0 | -0 | -0 |
| Low | +0 | +0 | +0 | +- | +- | |
| AS | High | -+ | +- | +- | 0+ | +0 |
| Low | ++ | ++ | +0 | ++ | +- | |
| EU | High | -+ | -- | -+ | -+ | -+ |
| Low | -+ | -- | -+ | -+ | -0 | |
| NA | High | -0 | -0 | -0 | -0 | -0 |
| Low | 00 | 00 | +0 | 00 | 00 | |
| OC | High | -0 | -0 | -0 | -0 | -0 |
| Low | +0 | +0 | +0 | -- | 0- | |
| SA | High | -0 | -- | -0 | -- | -- |
| Low | +0 | -- | -- | -- | -0 |
| Continents | SYD | RCP2.6& and SSP1 | RCP4.5& and SSP2 | RCP6.0& and SSP4 | RCP8.5& and SSP5 | Avg |
|---|---|---|---|---|---|---|
| B-M-L | B-M-L | B-M-L | B-M-L | B-M-L | ||
| AF | High | HL | HL | HL | HL | HL |
| Low | HH | NH | NH | HN | HN | |
| AS | High | HN | HN | LN | NH | HH |
| Low | HH | LH | HH | LH | NN | |
| EU | High | LN | LL | LN | NN | LN |
| Low | NN | LL | LN | LN | LL | |
| NA | High | LL | LL | LL | HL | NL |
| Low | LN | NN | LH | NN | NN | |
| OC | High | NH | NH | NH | NH | NL |
| Low | NH | NH | NH | NL | HL | |
| SA | High | LL | LL | NL | LL | LL |
| Low | LH | LL | LL | LL | LL |
| Continents | SYD | RCP2.6& and SSP1 | RCP4.5& and SSP2 | RCP6.0& and SSP4 | RCP8.5& and SSP5 | Avg |
|---|---|---|---|---|---|---|
| BM-ML | BM-ML | BM-ML | BM-ML | BM-ML | ||
| AF | High | 0+ | +- | +- | ++ | +- |
| Low | 0+ | +- | +- | ++ | +- | |
| AS | High | -0 | -+ | -0 | -0 | -0 |
| Low | -0 | -+ | +0 | -0 | 00 | |
| EU | High | +0 | -0 | +0 | 0+ | +0 |
| Low | -0 | 00 | 0+ | 00 | -0 | |
| NA | High | -0 | 0+ | -0 | -0 | -0 |
| Low | 0- | 0+ | 0+ | 00 | 00 | |
| OC | High | -+ | -0 | 00 | -0 | 00 |
| Low | -+ | 00 | -0 | +0 | 00 | |
| SA | High | -0 | -0 | -0 | -0 | -0 |
| Low | -0 | -0 | -0 | -0 | -0 |
| Continents | SYD | RCP2.6& and SSP1 | RCP4.5& and SSP2 | RCP6.0& and SSP4 | RCP8.5& and SSP5 | Avg |
|---|---|---|---|---|---|---|
| BM-ML | BM-ML | BM-ML | BM-ML | BM-ML | ||
| AF | High | -0 | -- | -0 | -- | -0 |
| Low | +0 | +0 | +0 | -- | 0- | |
| AS | High | ++ | -+ | +- | ++ | +0 |
| Low | +0 | +0 | +0 | ++ | ++ | |
| EU | High | +- | -+ | +- | 0- | 0- |
| Low | -+ | 0- | -+ | -0 | 0- | |
| NA | High | -+ | 0+ | 00 | 0+ | 00 |
| Low | 0+ | +0 | 0+ | ++ | +0 | |
| OC | High | -0 | -0 | -0 | ++ | -0 |
| Low | +0 | +- | +0 | +- | +0 | |
| SA | High | -+ | -- | -- | -- | -- |
| Low | -+ | -- | -- | -- | -- |
| Continents | SYD | RCP2.6& and SSP1 | RCP4.5& and SSP2 | RCP6.0& and SSP4 | RCP8.5& and SSP5 | Avg |
|---|---|---|---|---|---|---|
| BM-ML | BM-ML | BM-ML | BM-ML | BM-ML | ||
| AF | High | HL | NL | NL | HL | NL |
| Low | HH | NH | NH | HL | NL | |
| AS | High | LH | NN | LN | LH | LH |
| Low | LH | NH | HH | LH | NH | |
| EU | High | HN | LN | HN | HL | HL |
| Low | LN | NL | HN | NL | LL | |
| NA | High | LN | HH | LN | LH | LN |
| Low | LH | HH | HH | NH | NH | |
| OC | High | NL | LL | NL | LH | NL |
| Low | NH | NN | LH | HN | NH | |
| SA | High | LN | LL | LL | LL | LL |
| Low | LN | LL | LL | LL | LL |
| Continents | SYD | RCP2.6& and SSP1 | RCP4.5& and SSP2 | RCP6.0& and SSP4 | RCP8.5& and SSP5 | Avg |
|---|---|---|---|---|---|---|
| BM-ML | BM-ML | BM-ML | BM-ML | BM-ML | ||
| AF | High | III | IV | IV | III | IV |
| Low | I | II | II | III | IV | |
| AS | High | III | III | IV | III | III |
| Low | III | II | I | III | II | |
| EU | High | II | IV | II | III | III |
| Low | IV | IV | II | IV | V | |
| NA | High | IV | I | IV | III | IV |
| Low | III | I | I | II | II | |
| OC | High | IV | V | IV | III | IV |
| Low | II | III | III | II | II | |
| SA | High | IV | V | V | V | V |
| Low | IV | V | V | V | V |
| Continents | SYD | RCP2.6& and SSP1 | RCP4.5& and SSP2 | RCP6.0& and SSP4 | RCP8.5& and SSP5 | Avg |
|---|---|---|---|---|---|---|
| BM-ML | BM-ML | BM-ML | BM-ML | BM-ML | ||
| AF | High | 00 | 00 | 00 | 0+ | 00 |
| Low | -0 | 00 | -0 | 0+ | 0- | |
| AS | High | 00 | -0 | -- | -+ | 00 |
| Low | 00 | -+ | -0 | -+ | -0 | |
| EU | High | 00 | -0 | 00 | 0+ | -0 |
| Low | 00 | -0 | 00 | 0+ | 00 | |
| NA | High | 0+ | 00 | -+ | 00 | 0+ |
| Low | -0 | -0 | -0 | -0 | -+ | |
| OC | High | 00 | 00 | +0 | 00 | 00 |
| Low | 00 | 0+ | 0+ | 00 | 0+ | |
| SA | High | -0 | -+ | -- | -- | -0 |
| Low | -0 | -+ | -- | -- | -+ |
| Continents | SYD | RCP2.6& and SSP1 | RCP4.5& and SSP2 | RCP6.0& and SSP4 | RCP8.5& and SSP5 | Avg |
|---|---|---|---|---|---|---|
| BM-ML | BM-ML | BM-ML | BM-ML | BM-ML | ||
| AF | High | -0 | -0 | -- | -- | -- |
| Low | -- | -- | -- | -- | -- | |
| AS | High | +- | +- | +- | +0 | +- |
| Low | +0 | +0 | +- | ++ | +0 | |
| EU | High | -- | -0 | -+ | -+ | -+ |
| Low | -- | -0 | -0 | -0 | -- | |
| NA | High | -0 | -+ | -0 | -0 | -0 |
| Low | 0- | 00 | 00 | 0+ | -0 | |
| OC | High | 0- | 00 | 0- | -0 | 00 |
| Low | +- | +0 | +- | ++ | +0 | |
| SA | High | -+ | -0 | -- | -- | -- |
| Low | -- | -- | -- | -- | -0 |
| Continents | SYD | RCP2.6& and SSP1 | RCP4.5& and SSP2 | RCP6.0& and SSP4 | RCP8.5& and SSP5 | Avg |
|---|---|---|---|---|---|---|
| BM-ML | BM-ML | BM-ML | BM-ML | BM-ML | ||
| AF | High | NL | NL | NL | HL | NL |
| Low | LL | NL | LL | HL | LL | |
| AS | High | NN | LN | LN | NH | NN |
| Low | NH | NH | LN | NH | LH | |
| EU | High | NL | LL | NN | HN | LN |
| Low | NL | LL | NL | HL | NL | |
| NA | High | HL | NN | NL | NL | HL |
| Low | LL | LN | LN | LH | NL | |
| OC | High | NL | NN | HL | NL | NN |
| Low | NN | HH | HN | NH | HH | |
| SA | High | LN | NL | LL | LL | LL |
| Low | LL | NL | LL | LL | NL |
| Continents | SYD | RCP2.6& and SSP1 | RCP4.5& and SSP2 | RCP6.0& and SSP4 | RCP8.5& and SSP5 | Avg |
|---|---|---|---|---|---|---|
| BM-ML | BM-ML | BM-ML | BM-ML | BM-ML | ||
| AF | High | IV | IV | IV | III | IV |
| Low | V | IV | V | III | V | |
| AS | High | III | IV | IV | II | III |
| Low | II | II | IV | II | III | |
| EU | High | IV | V | III | II | IV |
| Low | IV | V | IV | III | IV | |
| NA | High | III | III | IV | IV | III |
| Low | V | IV | IV | III | IV | |
| OC | High | IV | III | III | IV | III |
| Low | III | I | II | II | I | |
| SA | High | IV | IV | V | V | V |
| Low | V | IV | V | V | IV |
Appendix A.8. Pattern of High Temperature Hazard (SDD) in the Growth Period
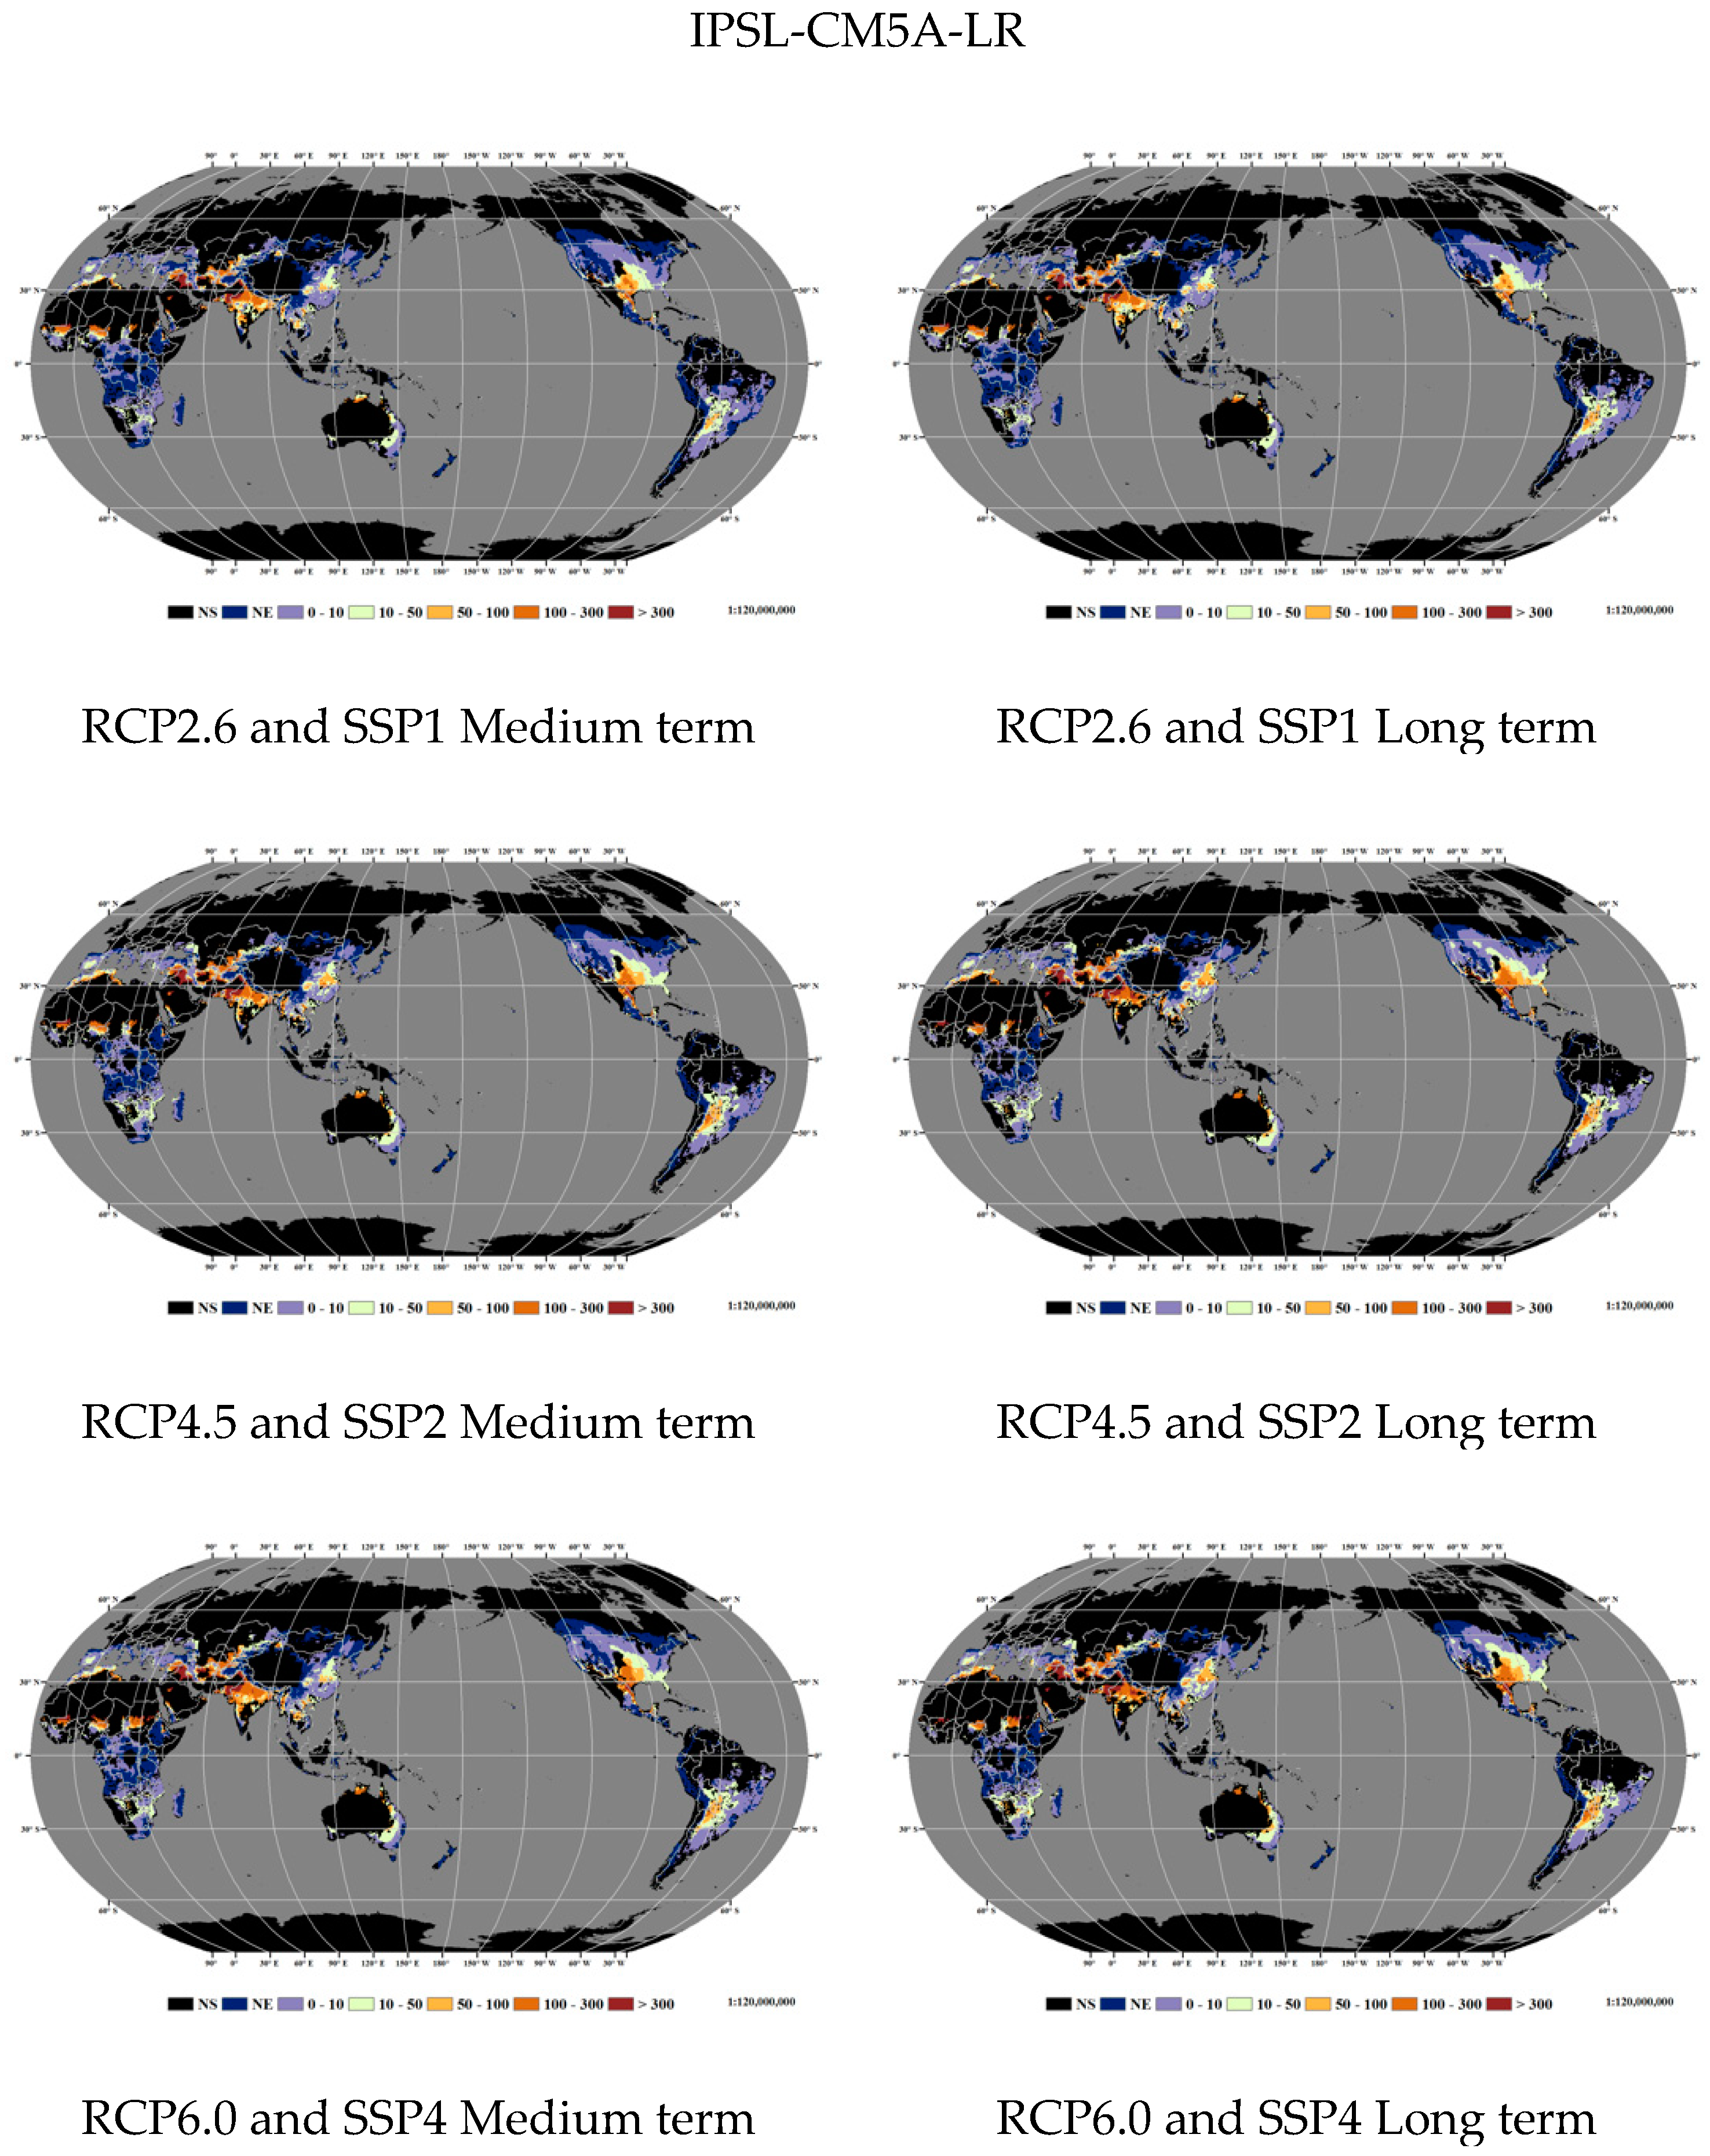


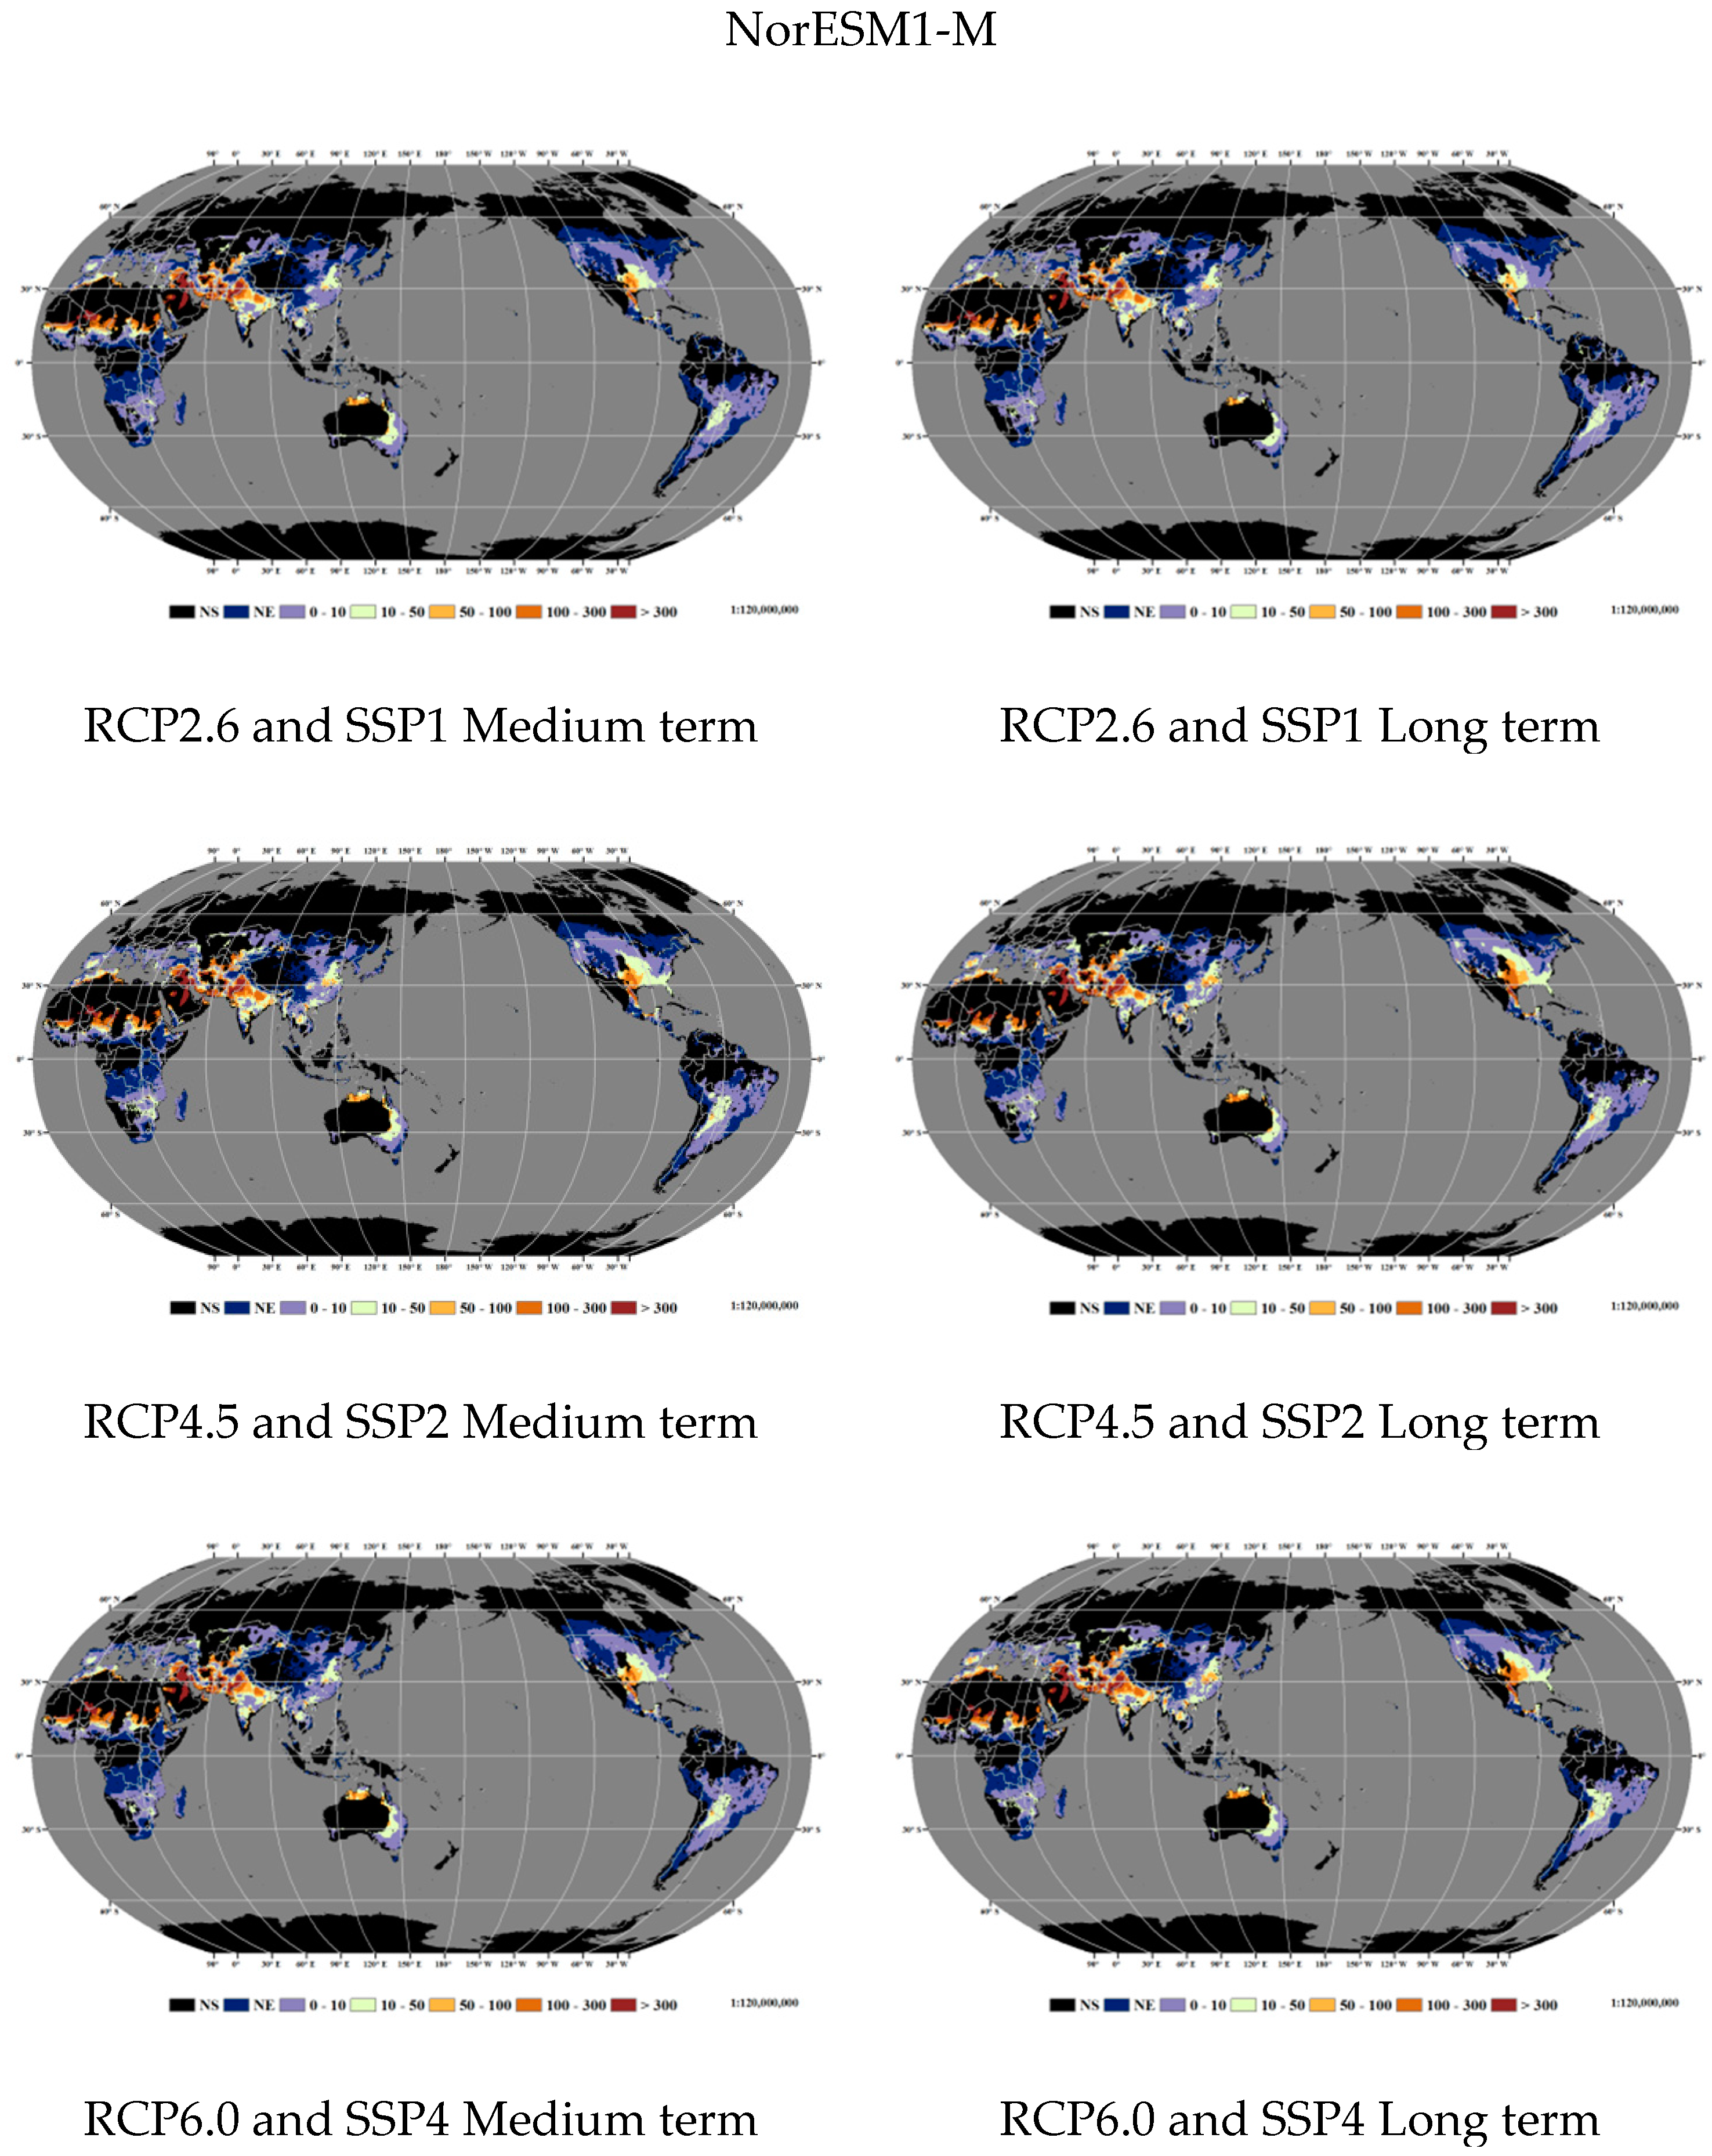
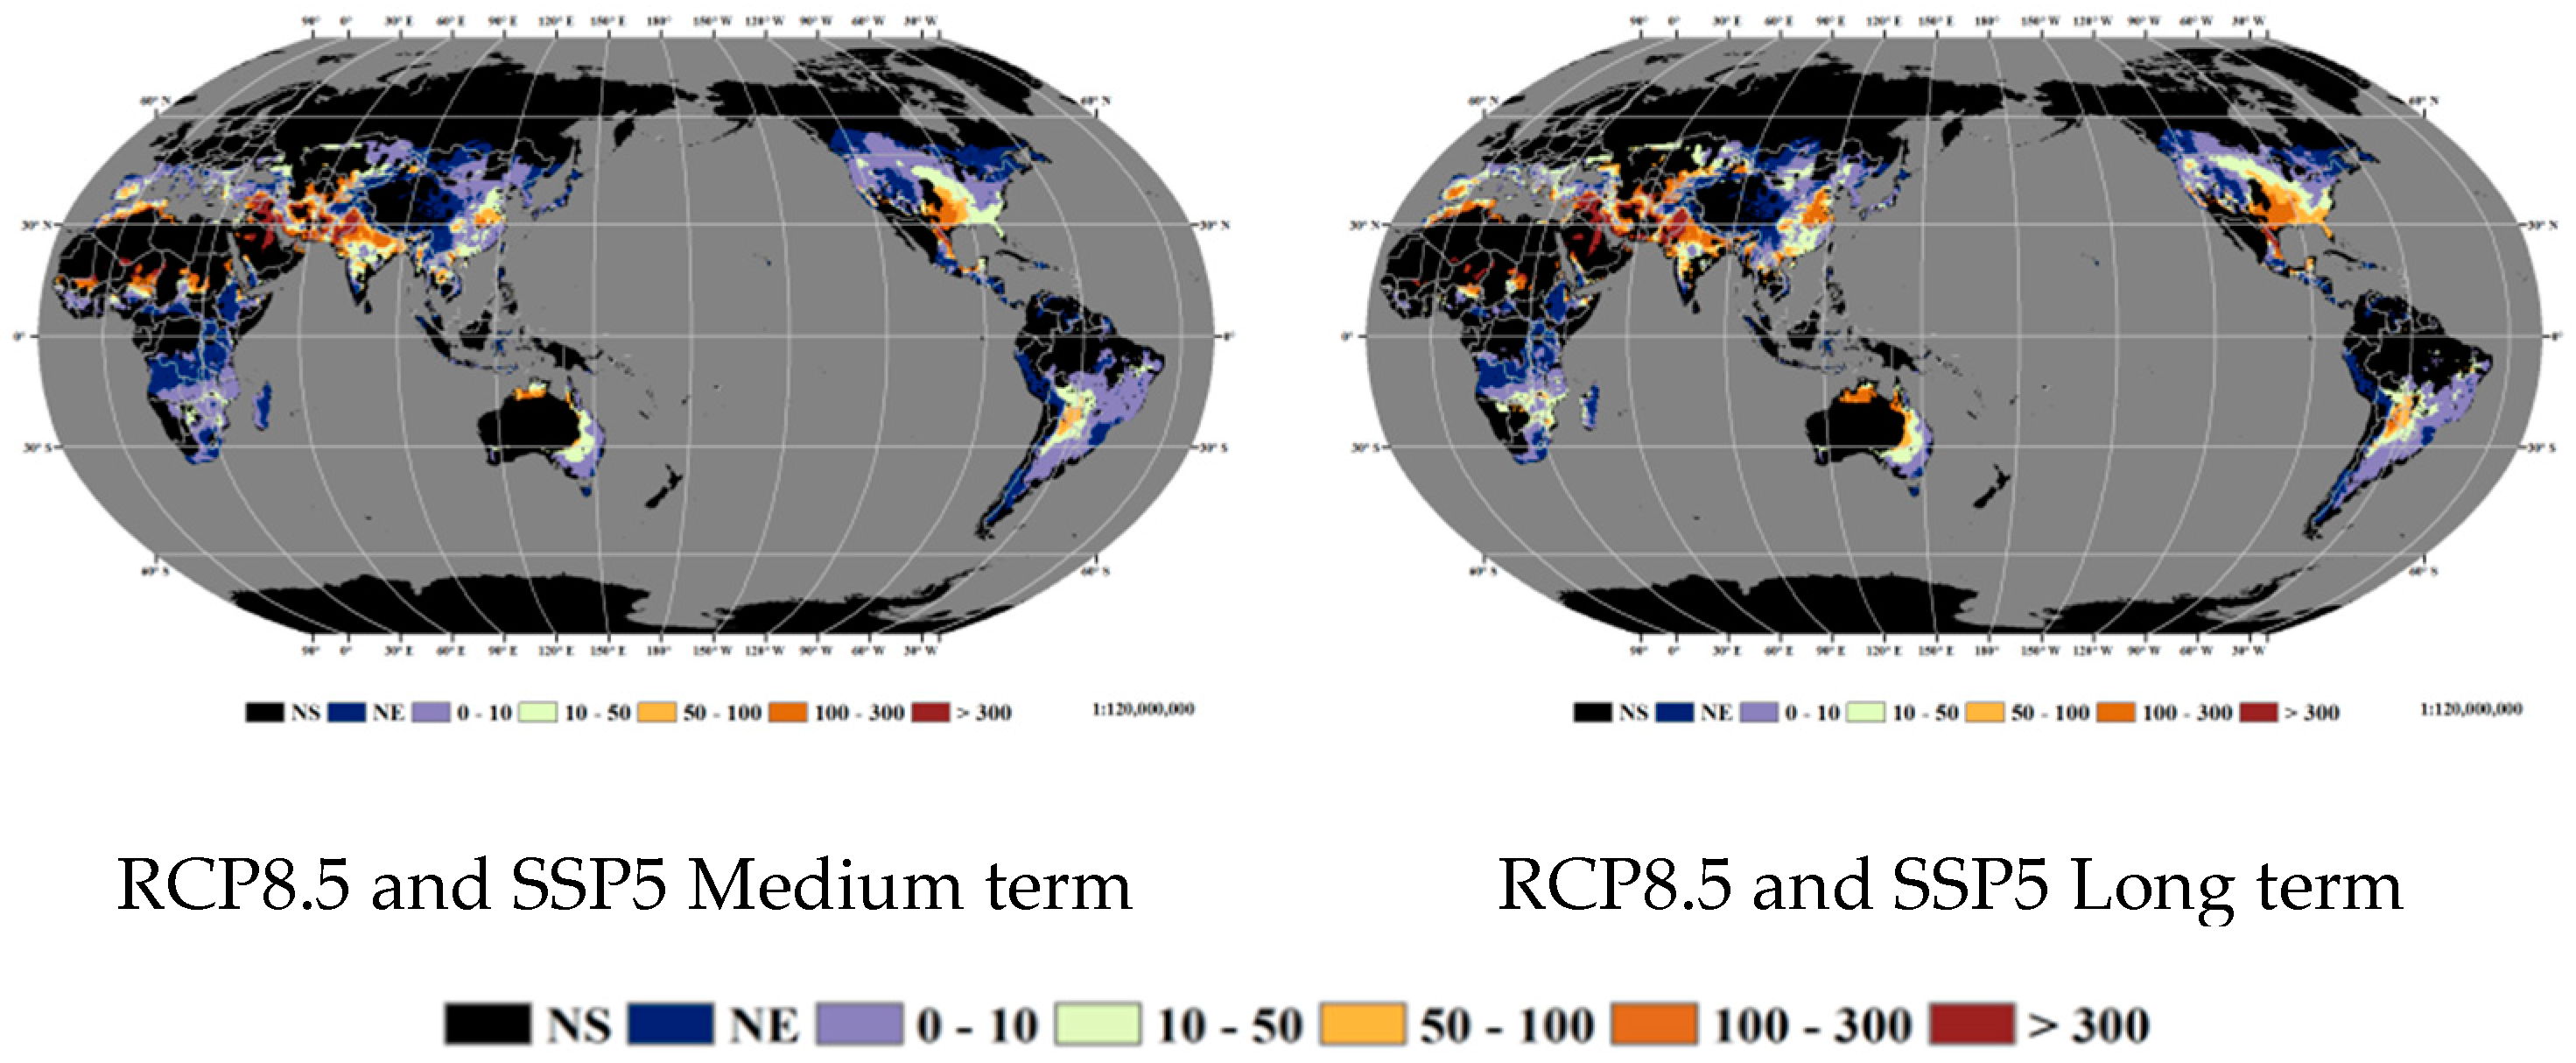
Appendix A.9. Changes in High Temperature Hazard (SDD) in the Growth Period


Appendix A.10. Pattern of the Barycenter of High Temperature Hazard (SDD) in the Growth Period


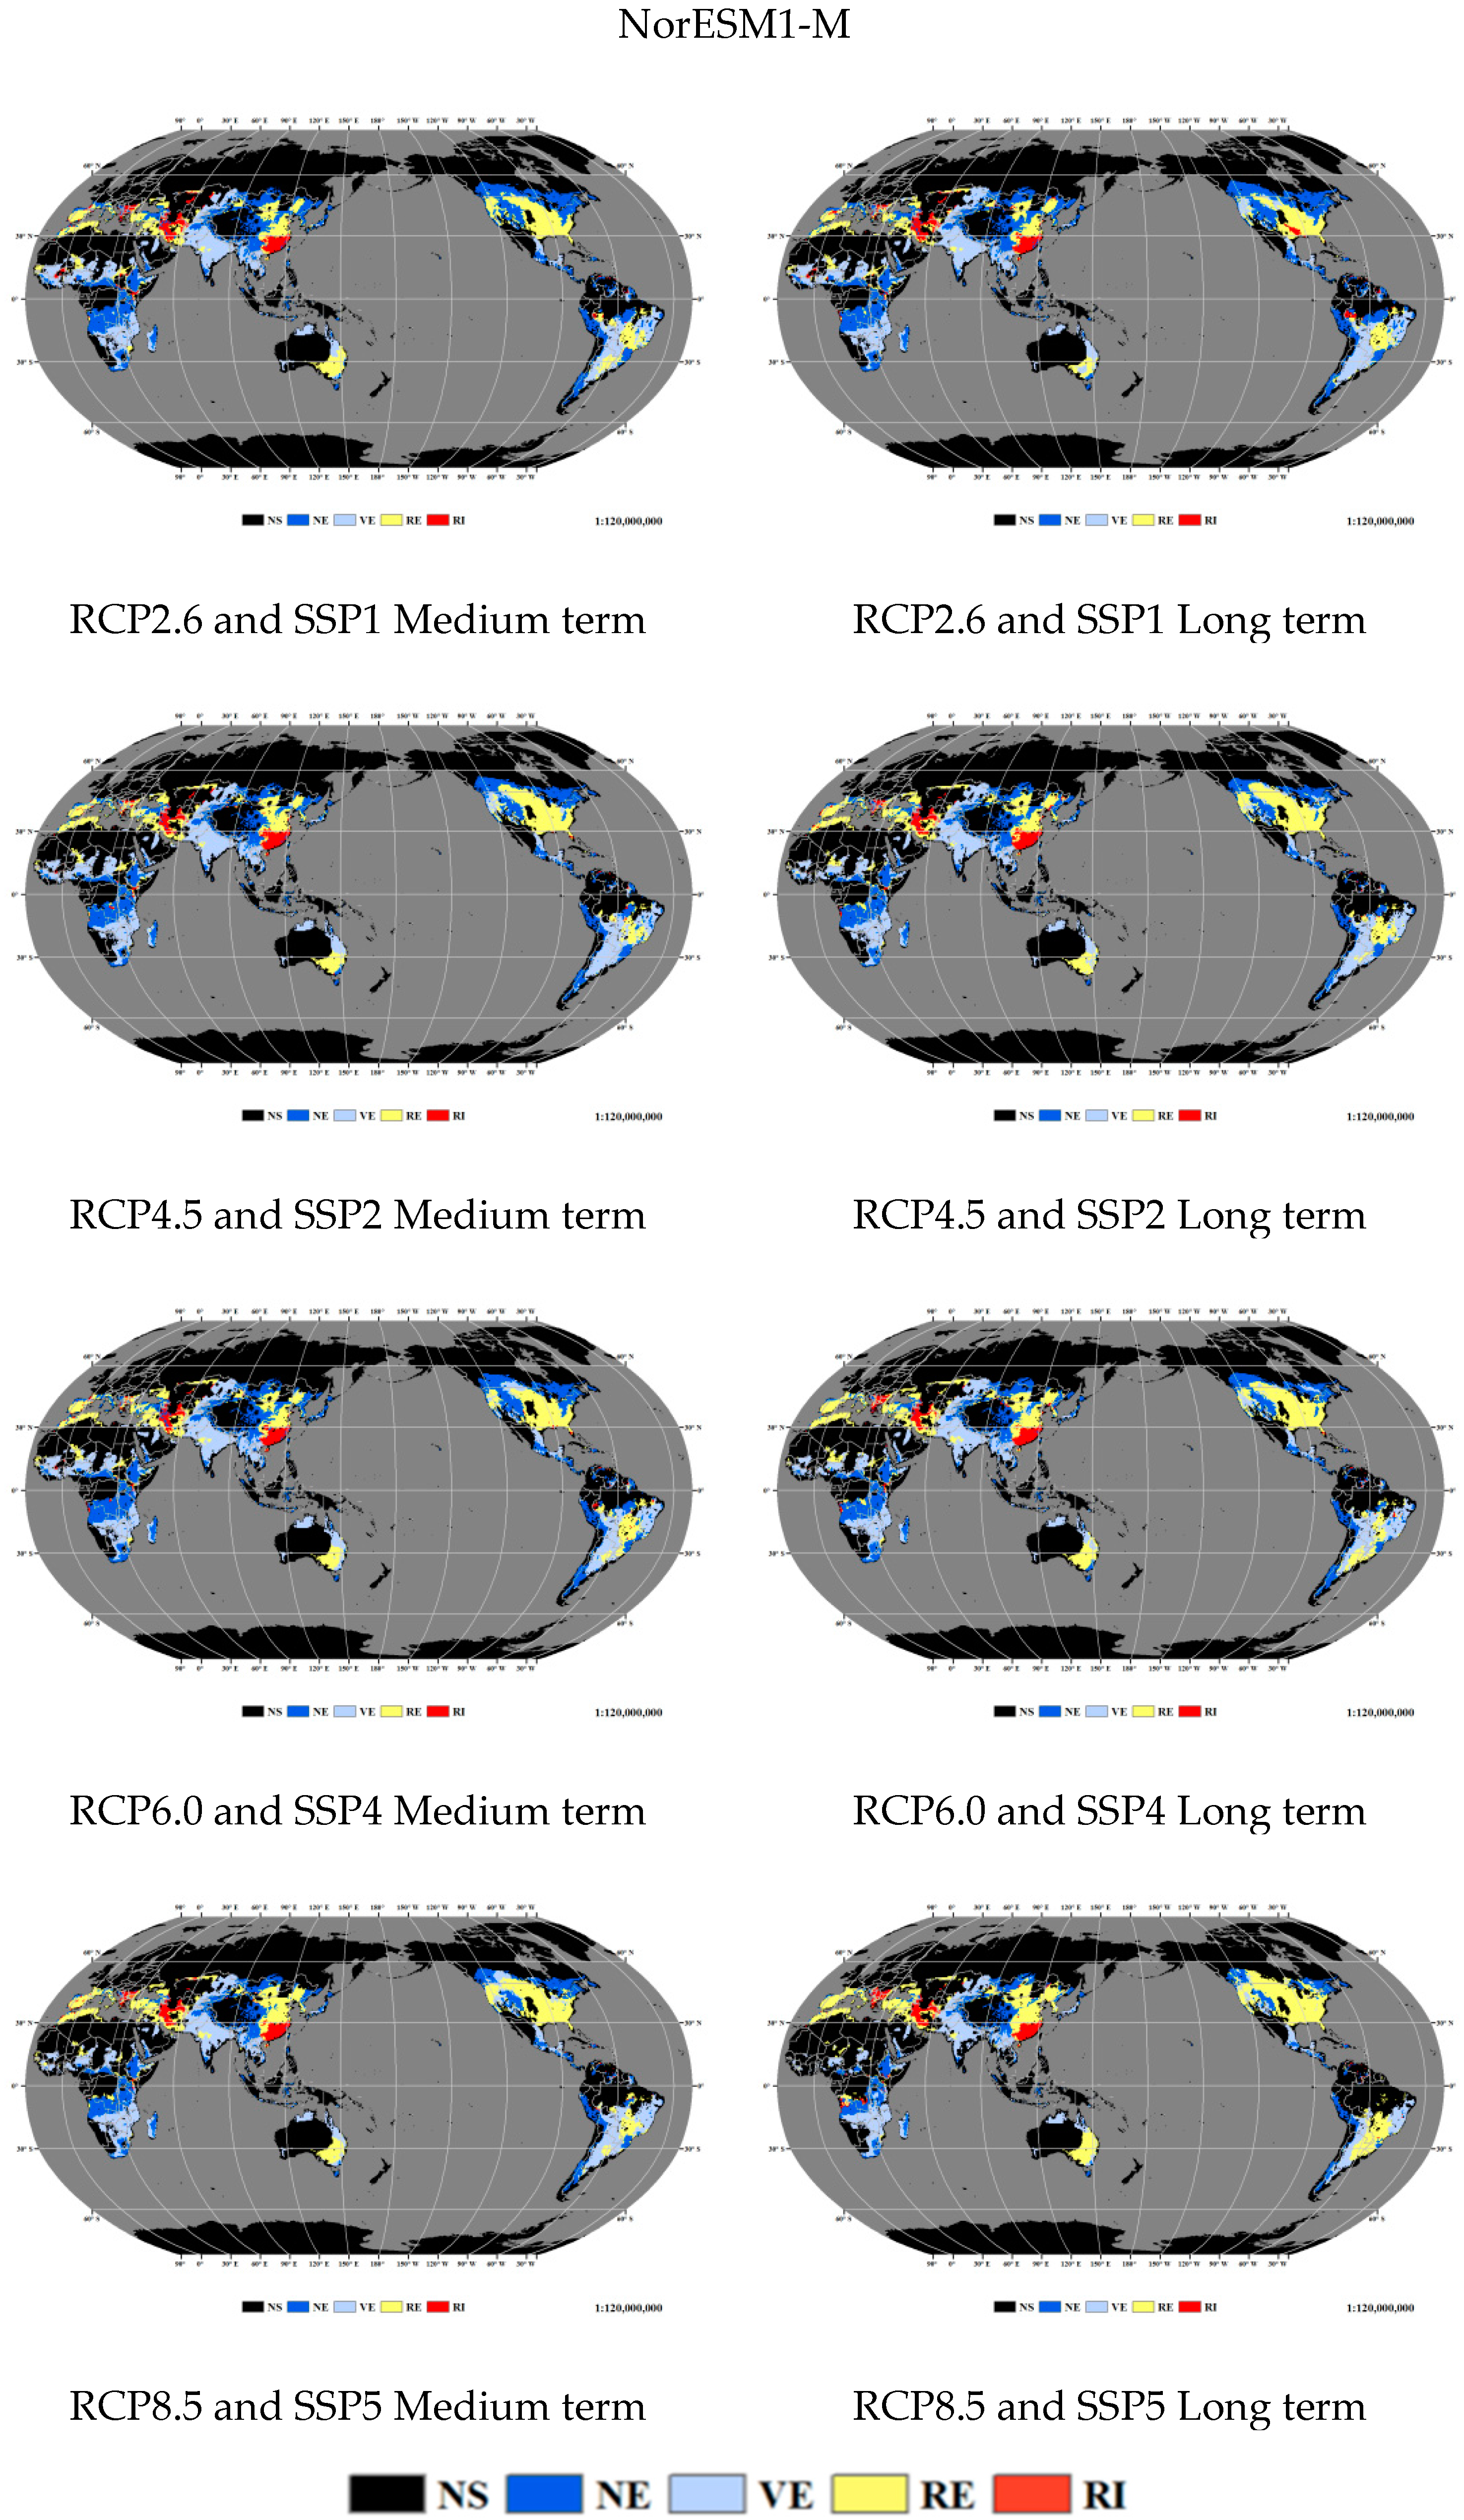

Appendix A.11. Changes in the Barycenter of High Temperature hazard (SDD) in the Growth Period


References
- IPCC. Global Warming of 1.5 °C, Summary for Policy Makers; IPCC: Geneva, Switzerland, 2018. [Google Scholar]
- Khush, G.S. Origin, dispersal, cultivation and variation of rice. Plant Mol. Biol. 1997, 35, 25–34. [Google Scholar] [CrossRef]
- Akinbile, C.; Akinlade, G.; Abolude, A. Trend analysis in climatic variables and impacts on rice yield in Nigeria. J. Water Clim. Change 2015, 6, 534–543. [Google Scholar] [CrossRef]
- Peng, S.; Huang, J.; Sheehy, J.E.; Laza, R.C.; Visperas, R.M.; Zhong, X.; Centeno, G.S.; Khush, G.S.; Cassman, K.G. Rice yields decline with higher night temperature from global warming. Proc. Natl. Acad. Sci. USA 2004, 101, 9971–9975. [Google Scholar] [CrossRef]
- Hoegh-Guldberg, O.; Jacob, D.; Taylor, M.; Bindi, M.; Brown, S.; Camilloni, I.; Diedhiou, A.; Djalante, R.; Ebi, K.; Engelbrecht, F. Impacts of 1.5 °C global warming on natural and human systems. In Global Warming of 1.5 °C, Summary for Policy Makers; IPCC: Geneva, Switzerland, 2018. [Google Scholar]
- Fahad, S.; Adnan, M.; Hassan, S.; Saud, S.; Hussain, S.; Wu, C.; Wang, D.; Hakeem, K.R.; Alharby, H.F.; Turan, V. Rice responses and tolerance to high temperature. In Advances in Rice Research for Abiotic Stress Tolerance; Elsevier: Amsterdam, The Netherlands, 2019; pp. 201–224. [Google Scholar]
- Fraser, S.A.; Wood, N.J.; Johnston, D.; Leonard, G.S.; Greening, P.D.; Rossetto, T. Variable population exposure and distributed travel speeds in least-cost Tsunami evacuation modelling. Nat. Hazards Earth Syst. Sci. 2014, 14, 2975–2991. [Google Scholar] [CrossRef]
- Antwi-Agyei, P.; Fraser, E.D.; Dougill, A.J.; Stringer, L.C.; Simelton, E. Mapping the vulnerability of crop production to drought in Ghana using rainfall, yield and socioeconomic data. Appl. Geogr. 2012, 32, 324–334. [Google Scholar] [CrossRef]
- Gunasekera, R.; Ishizawa, O.; Aubrecht, C.; Blankespoor, B.; Murray, S.; Pomonis, A.; Daniell, J. Developing an adaptive global exposure model to support the generation of country disaster risk profiles. Earth Sci. Rev. 2015, 150, 594–608. [Google Scholar] [CrossRef]
- Gbetibouo, G.A.; Ringler, C.; Hassan, R. Vulnerability of the south African farming sector to climate change and variability: An indicator approach. Nat. Resour. Forum 2010, 34, 175–187. [Google Scholar] [CrossRef]
- Gourdji, S.M.; Sibley, A.M.; Lobell, D.B. Global crop exposure to critical high temperatures in the reproductive period: Historical trends and future projections. Environ. Res. Lett. 2013, 8, 024041. [Google Scholar] [CrossRef]
- Sun, Y.; Zhang, X.; Zwiers, F.W.; Song, L.; Wan, H.; Hu, T.; Yin, H.; Ren, G. Rapid increase in the risk of extreme summer heat in eastern China. Nat. Clim. Change 2014, 4, 1082. [Google Scholar] [CrossRef]
- Murthy, C.; Laxman, B.; Sai, M.S. Geospatial analysis of agricultural drought vulnerability using a composite index based on exposure, sensitivity and adaptive capacity. Int. J. Disaster Risk Reduct. 2015, 12, 163–171. [Google Scholar] [CrossRef]
- Anandhi, A.; Steiner, J.L.; Bailey, N. A system’s approach to assess the exposure of agricultural production to climate change and variability. Clim. Change 2016, 136, 647–659. [Google Scholar] [CrossRef]
- Wu, W.; Shibasaki, R.; Yang, P.; Tan, G.; Matsumura, K.-I.; Sugimoto, K. Global-scale modelling of future changes in Sown areas of major crops. Ecol. Model. 2007, 208, 378–390. [Google Scholar] [CrossRef]
- Liu, Z.; Yang, P.; Tang, H.; Wu, W.; Zhang, L.; Yu, Q.; Li, Z. Shifts in the extent and location of rice cropping areas match the climate change pattern in China during 1980–2010. Reg. Environ. Change 2015, 15, 919–929. [Google Scholar] [CrossRef]
- Wang, P.; Hu, T.; Kong, F.; Zhang, D. Changes in the spatial pattern of rice exposure to heat stress in China over recent decades. Clim. Change 2019, 154, 1–12. [Google Scholar] [CrossRef]
- Zhang, L.; Zhang, Z.; Chen, Y.; Wei, X.; Song, X. Exposure, vulnerability, and adaptation of major maize-growing areas to extreme temperature. Nat. Hazards 2018, 91, 1257–1272. [Google Scholar] [CrossRef]
- Arun-Chinnappa, K.S.; Ranawake, L.; Seneweera, S. Impacts and management of temperature and water stress in crop plants. In Abiotic Stress Management for Resilient Agriculture; Springer: Berlin, Germany, 2017; pp. 221–233. [Google Scholar]
- Huang, J.; Zhang, F.; Xue, Y.; Lin, J. Recent changes of rice heat stress in Jiangxi province, Southeast China. Int. J. Biometeorol. 2017, 61, 623–633. [Google Scholar] [CrossRef]
- Fahad, S.; Hussain, S.; Saud, S.; Hassan, S.; Ihsan, Z.; Shah, A.N.; Wu, C.; Yousaf, M.; Nasim, W.; Alharby, H. Exogenously applied plant growth regulators enhance the morpho-physiological growth and yield of rice under high temperature. Front. Plant Sci. 2016, 7, 1250. [Google Scholar] [CrossRef]
- Mendas, A.; Delali, A. Integration of multicriteria decision analysis in gis to develop land suitability for agriculture: Application to durum wheat cultivation in the region of Mleta in Algeria. Comput. Electron. Agric. 2012, 83, 117–126. [Google Scholar] [CrossRef]
- Walke, N.; Reddy, G.O.; Maji, A.; Thayalan, S. Gis-based multicriteria overlay analysis in soil-suitability evaluation for cotton (Gossypium spp.): A case study in the black soil region of Central India. Comput. Geosci. 2012, 41, 108–118. [Google Scholar] [CrossRef]
- You, L.; Wood, S.; Wood-Sichra, U. Generating plausible crop distribution maps for Sub-saharan Africa using a spatially disaggregated data fusion and optimization approach. Agric. Syst. 2009, 99, 126–140. [Google Scholar] [CrossRef]
- Shi, P.; Tang, L.; Wang, L.; Sun, T.; Liu, L.; Cao, W.; Zhu, Y. Post-heading heat stress in rice of South China during 1981–2010. PLoS ONE 2015, 10, e0130642. [Google Scholar] [CrossRef]
- Dias, M.; Navaratne, C.; Weerasinghe, K.; Hettiarachchi, R. Application of DSSAT crop simulation model to identify the changes of rice growth and yield in Nilwala river basin for mid-centuries under changing climatic conditions. Proc. Food Sci. 2016, 6, 159–163. [Google Scholar] [CrossRef]
- Dar, M.U.D.; Aggarwal, R.; Kaur, S. Effect of climate change scenarios on yield and water balance components in rice-wheat cropping system in central Punjab, India. J. Agrometeorol. 2017, 19, 226–229. [Google Scholar]
- Chun, J.A.; Li, S.; Wang, Q.; Lee, W.-S.; Lee, E.-J.; Horstmann, N.; Park, H.; Veasna, T.; Vanndy, L.; Pros, K. Assessing rice productivity and adaptation strategies for Southeast Asia under climate change through multi-scale crop modeling. Agric. Syst. 2016, 143, 14–21. [Google Scholar] [CrossRef]
- Van Oort, P.A.; Zwart, S.J. Impacts of climate change on rice production in Africa and causes of simulated yield changes. Glob. Change Biol. 2018, 24, 1029–1045. [Google Scholar] [CrossRef]
- Kim, K.-H.; Cho, J.; Lee, Y.H.; Lee, W.-S. Predicting potential epidemics of rice leaf blast and sheath blight in South Korea under the RCP 4.5 and RCP 8.5 climate change scenarios using a rice disease epidemiology model, EPIRICE. Agric. Forest Meteorol. 2015, 203, 191–207. [Google Scholar] [CrossRef]
- Zhang, Z.; Chen, Y.; Wang, C.; Wang, P.; Tao, F. Future extreme temperature and its impact on rice yield in China. Int. J. Climatol. 2017, 37, 4814–4827. [Google Scholar] [CrossRef]
- IPCC. Emissions Scenarios; Cambridge University Press: Cambridge, UK, 2000. [Google Scholar]
- Shi, P. Disaster Risk Science; Springer: Berlin, Germany, 2019. [Google Scholar]
- He, C.; Huang, Q.; Dou, Y.; Tu, W.; Liu, J. The population in China’s earthquake-prone areas has increased by over 32 million along with rapid urbanization. Environ. Res. Lett. 2016, 11, 074028. [Google Scholar] [CrossRef]
- Batjes, N.H. ISRIC-WISE Derived Soil Properties on a 5 by 5 Arc-Minutes Global Grid (ver. 1.2); ISRIC-World Soil Information: Wageningen, The Netherlands, 2012. [Google Scholar]
- Warszawski, L.; Frieler, K.; Huber, V.; Piontek, F.; Serdeczny, O.; Schewe, J. The inter-sectoral impact model intercomparison project (ISI–MIP): Project framework. Proc. Natl. Acad. Sci. USA 2014, 111, 3228–3232. [Google Scholar] [CrossRef]
- Wiebe, K.; Lotze-Campen, H.; Sands, R.; Tabeau, A.; van der Mensbrugghe, D.; Biewald, A.; Bodirsky, B.; Islam, S.; Kavallari, A.; Mason-D’Croz, D. Climate change impacts on agriculture in 2050 under a range of plausible socioeconomic and emissions scenarios. Environ. Res. Lett. 2015, 10, 085010. [Google Scholar] [CrossRef]
- Zhao, C.; Piao, S.; Wang, X.; Huang, Y.; Ciais, P.; Elliott, J.; Huang, M.; Janssens, I.A.; Li, T.; Lian, X. Plausible rice yield losses under future climate warming. Nat. Plants 2017, 3, 16202. [Google Scholar] [CrossRef]
- Dufresne, J.-L.; Foujols, M.-A.; Denvil, S.; Caubel, A.; Marti, O.; Aumont, O.; Balkanski, Y.; Bekki, S.; Bellenger, H.; Benshila, R. Climate change projections using the IPSL-CM5 earth system model: From CMIP3 to CMIP5. Climate Dyn. 2013, 40, 2123–2165. [Google Scholar] [CrossRef]
- Watanabe, S.; Hajima, T.; Sudo, K.; Nagashima, T.; Takemura, T.; Okajima, H.; Nozawa, T.; Kawase, H.; Abe, M.; Yokohata, T. MIROC-ESM 2010: Model description and basic results of CMIP5–20c3m experiments. Geosci. Model Dev. 2011, 4, 845. [Google Scholar] [CrossRef]
- Bentsen, M.; Bethke, I.; Debernard, J.; Iversen, T.; Kirkevåg, A.; Seland, Ø.; Drange, H.; Roelandt, C.; Seierstad, I.; Hoose, C. The Norwegian Earth system model, norESM1-M-part 1: Description and basic evaluation. Geosci. Model Dev. Discus. 2012, 5, 2843–2931. [Google Scholar] [CrossRef]
- Elith, J.; Graham, C.; Anderson, R.; Dudík, M.; Ferrier, S.; Guisan, A.; Hijmans, R.; Huettmann, F.; Leathwick, J.; Lehmann, A. Novel methods improve prediction of species’ distributions from occurrence data. Ecography 2006, 29, 129–151. [Google Scholar] [CrossRef]
- Phillips, S.J.; Anderson, R.P.; Schapire, R.E. Maximum entropy modeling of species geographic distributions. Ecol. Model. 2006, 190, 231–259. [Google Scholar] [CrossRef]
- Lane, A.; Jarvis, A. Changes in climate will modify the geography of crop suitability: Agricultural biodiversity can help with adaptation. ISRICAT 2007, 4, 1–12. [Google Scholar]
- Gao, S.; Wang, P. Impacts of High Temperature Stress on Rice Production in the Mid-Lower Yangtze River Valley of China; Meteorological Press: Beijing, China, 2009. (In Chinese) [Google Scholar]
- Lobell, D.B.; Burke, M.B. On the use of statistical models to predict crop yield responses to climate change. Agric. Forest Meteorol. 2010, 150, 1443–1452. [Google Scholar] [CrossRef]
- Sun, W.; Huang, Y. Global warming over the period 1961–2008 did not increase high-temperature stress but did reduce low-temperature stress in irrigated rice across China. Agric. Forest Meteorol. 2011, 151, 1193–1201. [Google Scholar] [CrossRef]
- Butler, E.E.; Huybers, P. Adaptation of us maize to temperature variations. Nat. Clim. Change 2013, 3, 68. [Google Scholar] [CrossRef]
- Zhang, Z.; Wang, P.; Chen, Y.; Song, X.; Wei, X.; Shi, P. Global warming over 1960–2009 did increase heat stress and reduce cold stress in the major rice-planting areas across China. Eur. J. Agron. 2014, 59, 49–56. [Google Scholar] [CrossRef]
- Xiong, W.; Feng, L.; Ju, H.; Yang, D. Possible impacts of high temperatures on China’s rice yield under climate change. Adv. Earth Sci. 2016, 31, 515–528. [Google Scholar]
- ISO. Animal and Vegetable Fats and Oils—Determination of Acid Value and Acidity; China Standard Press: Beijing, China, 2005. [Google Scholar]
- Rafiee, R.; Mahiny, A.S.; Khorasani, N.; Darvishsefat, A.A.; Danekar, A. Simulating urban growth in Mashad city, Iran through the SLEUTH model (UGM). Cities 2009, 26, 19–26. [Google Scholar] [CrossRef]
- Shimba, T. An estimation of center of gravity from force platform data. J. Biomech. 1984, 17, 53–60. [Google Scholar] [CrossRef]
- Sacks, W.J.; Deryng, D.; Foley, J.A.; Ramankutty, N. Crop planting dates: An analysis of global patterns. Glob. Ecol. Biogeogr. 2010, 19, 607–620. [Google Scholar] [CrossRef]
- Rezaei, E.E.; Webber, H.; Gaiser, T.; Naab, J.; Ewert, F. Heat stress in cereals: Mechanisms and modelling. Eur. J. Agron. 2015, 64, 98–113. [Google Scholar] [CrossRef]
- Sánchez, B.; Rasmussen, A.; Porter, J.R. Temperatures and the growth and development of maize and rice: A review. Glob. Change Biol. 2014, 20, 408–417. [Google Scholar] [CrossRef]
- Fischer, G.; Shah, M.; Tubiello, F.; Van Velhuizen, H. Socio-economic and climate change impacts on agriculture: An integrated assessment, 1990–2080. Philos. Trans. R. Soc. B Biol. Sci. 2005, 360, 2067–2083. [Google Scholar] [CrossRef]
- Yan, Y.; Zhao, J.; Deng, H.; Luo, Q. Predicting China’s cultivated land resources and supporting capacity in the twenty-first century. Int. J. Sustain. Dev. World Ecol. 2006, 13, 229–241. [Google Scholar] [CrossRef]
- Wei, X.; Declan, C.; Erda, L.; Yinlong, X.; Hui, J.; Jinhe, J.; Ian, H.; Yan, L. Future cereal production in China: The interaction of climate change, water availability and socio-economic scenarios. Glob. Environ. Change 2009, 19, 34–44. [Google Scholar] [CrossRef]
- Howden, S.M.; Soussana, J.-F.; Tubiello, F.N.; Chhetri, N.; Dunlop, M.; Meinke, H. Adapting agriculture to climate change. Proc. Natl. Acad. Sci. USA 2007, 104, 19691–19696. [Google Scholar] [CrossRef]




| Data Category | Data Name | Temporal Resolution | Spatial Resolution | Source |
|---|---|---|---|---|
| Disaster-Formative Environment Theory | Global Digital Elevation Model Data GMTED2010 (DEM) | 2010 | 1 km × 1 km | United States Geological Survey (USGS) https://topotools.cr.usgs.gov/gmted_viewer/ |
| Global-Slope Data | 2006 | 10 km × 10 km | International Institute for Applied Systems Analysis Global Agro ecological Zones (GAEZ): http://www.gaez.iiasa.ac.at | |
| Global-Soil Parameter Data | 2012 | 1 km × 1 km | International Soil Reference and Information Centre (ISRIC): http://www.isric.org | |
| Hazard-Bearing Body | Rice Cultivation Range Data | 2000 or 2005 | 0.5° × 0.5° | ①Harvested Area and Yield for 175 Crops around the year 2000 (EARTHSTAT 2000): http://www.earthstat.org/harvested-area-yield-175-crops/ ②Global monthly irrigated and rainfed crop areas around the year 2000 (MIRCA 2000): http://www.unifrankfurt.de/45218031/data_download ③Spatial Production Allocation Model (SPAM) 2000/2005: http://mapspam.info/maps/ |
| Scenarios | IPSL-CM5A-LR | 1971~2099 | 0.5° × 0.5° | LOCEAN/IPSL: https://www.locean-ipsl.upmc.fr/smos/ |
| MIROC-ESM-CHEM | 1971~2099 | 0.5° × 0.5° | Japan Agency for Marine-Earth Science and Technology, Atmosphere and Ocean Research Institute (The University of Tokyo), and National Institute for Environmental Studies: http://adsabs.harvard.edu/abs/2011GMD.....4..845W | |
| NorESM1-M | 1971~2099 | 0.5° × 0.5° | Norwegian Earth System: https://portal.enes.org/models/earthsystem-models/ncc/noresm | |
| Land use Data (LUH2) | 1971~2100 | 0.25° × 0.25° | Land-Use Harmonization: http://luh.umd.edu/data.shtml | |
| Bioclimatic Variables | 1971~2000 2041~2060 2061~2080 | 1 km × 1 km | Global Climate Data (WorldClim): http://worldclim.org/CMIP5v1 |
| Grade | Variable Valuation Rules |
|---|---|
| I | >99 quantiles, <1 quantile |
| II | 97~99 quantiles, 1~3 quantiles |
| III | 95~97 quantiles, 3~5 quantiles |
| IV | 90~95 quantiles, 5~10 quantiles |
| V | <90 quantiles, >10 quantiles |
| Continents | SYD | RCP2.6 and SSP1 | RCP4.5 and SSP2 | RCP6.0 and SSP4 | RCP8.5 and SSP5 | Avg |
|---|---|---|---|---|---|---|
| B-M-L | B-M-L | B-M-L | B-M-L | B-M-L | ||
| AF | High | III | III | III | III | III |
| Low | I | II | II | II | II | |
| AS | High | II | II | III | I | I |
| Low | I | III | I | III | II | |
| EU | High | IV | V | IV | III | IV |
| Low | III | V | IV | IV | V | |
| NA | High | V | V | V | III | IV |
| Low | IV | III | III | III | III | |
| OC | High | III | III | III | III | IV |
| Low | II | III | II | IV | III | |
| SA | High | V | V | IV | V | V |
| Low | III | V | V | V | V |
| Accuracy Type | Data for Verification | |||||
|---|---|---|---|---|---|---|
| EARTHSTAT 2000 Harvest Data | SPAM 2000 Harvest Data | SPAM 2000 Sowing Data | MIRCA 2000 Harvest Data | SPAM 2005 Harvest Data | SPAM 2005 Sowing Data | |
| YY | 3.6% | 2.6% | 2.5% | 1.9% | 2.8% | 2.9% |
| NN | 91.6% | 92.6% | 92.5% | 93.0% | 91.2% | 91.4% |
| NY | 2.7% | 3.8% | 3.9% | 4.5% | 4.7% | 4.6% |
| YN | 2.1% | 1.0% | 1.1% | 0.6% | 1.3% | 1.1% |
| User Accuracy | 52.8% | 35.4% | 36.1% | 23.6% | 32.6% | 33.3% |
| Producer Accuracy | 80.8% | 83.8% | 84.2% | 80.4% | 81.3% | 81.8% |
| All Accuracy | 93.9% | 93.8% | 94.2% | 92.9% | 92.4% | 92.8% |
| Kappa Coefficient | 0.61 | 0.47 | 0.48 | 0.35 | 0.43 | 0.44 |
© 2019 by the authors. Licensee MDPI, Basel, Switzerland. This article is an open access article distributed under the terms and conditions of the Creative Commons Attribution (CC BY) license (http://creativecommons.org/licenses/by/4.0/).
Share and Cite
Wang, R.; Jiang, Y.; Su, P.; Wang, J. Global Spatial Distributions of and Trends in Rice Exposure to High Temperature. Sustainability 2019, 11, 6271. https://doi.org/10.3390/su11226271
Wang R, Jiang Y, Su P, Wang J. Global Spatial Distributions of and Trends in Rice Exposure to High Temperature. Sustainability. 2019; 11(22):6271. https://doi.org/10.3390/su11226271
Chicago/Turabian StyleWang, Ran, Yao Jiang, Peng Su, and Jing’ai Wang. 2019. "Global Spatial Distributions of and Trends in Rice Exposure to High Temperature" Sustainability 11, no. 22: 6271. https://doi.org/10.3390/su11226271
APA StyleWang, R., Jiang, Y., Su, P., & Wang, J. (2019). Global Spatial Distributions of and Trends in Rice Exposure to High Temperature. Sustainability, 11(22), 6271. https://doi.org/10.3390/su11226271


