Abstract
The chloride diffusion process can be greatly affected by the temperature and relative humidity. Annual average temperature and relative humidity are often adopted in analytical models to calculate chloride profiles. These models, however, cannot consider the seasonal characteristics of temperature and relative humidity. This paper presents a theoretical study to solve the above problem. The temperature and relative humidity in several major cities in China are first collected. Then, the governing equation of one-dimensional chloride diffusion is solved by both analytical and numerical methods using the annual and monthly average temperature and relative humidity, respectively. Based on these two methods, a parameter called “seasonal correction coefficient” is introduced into the analytical models. The values of the coefficient for major cities in China are obtained. Based on the results, it is found that: (1) the analytical solution with annual average temperature and relative humidity is questionable to calculate chloride profiles for typical cities, (2) the seasonal correction coefficient is independent on the apparent chloride diffusivity, affected slightly by the activation energy of chloride ions during diffusion and greatly by the critical relative humidity for common water-to-cement ratios of ordinary Portland cement (OPC) mortar and concrete.
1. Introduction
Concrete is one of the most widely used construction materials. Normal concrete is manufactured using cement, aggregate, water, and other necessary additives. The cement, therefore, is one of the major components of normal concrete. Figure 1 shows the cement output in China from 1990 to 2017. As can be seen, the cement output continuously increases during 1990–2014. Owing to the emphasis on the ecology issue in civil engineering from the government, the cement output in recent years is kept at a stable level. However, a tremendous amount of cement is still produced every year.
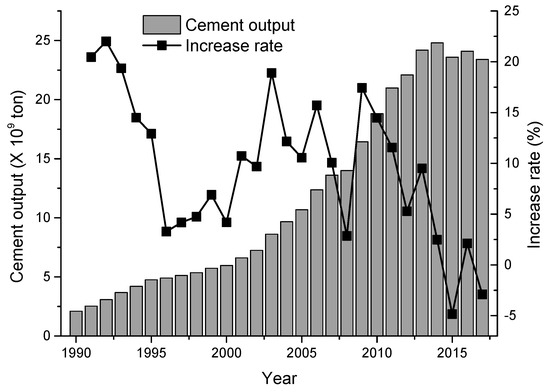
Figure 1.
Cement output and increase rate in China from 1990 to 2017.
In the cement industry, carbon dioxide is released during the production, shown in Equation (1), which is one of the reasons for the green-house effect. To control the carbon emission from the cement industry, besides the development of new materials such as green concrete, it is also important to conduct the research on the long-term performance of concrete. The research in this field can enable the prediction of the performance degradation, which is helpful to optimize the structural design, e.g., the thickness of concrete cover, mix proportion of concrete. Therefore, the service life of the structure can be extended with acceptable cost to avoid unnecessary large-scale reconstruction.
Owing to the low tensile strength of concrete, steel rebar and concrete are usually combined to form the reinforced concrete (RC) structure. In RC structures, concrete can effectively protect steel rebar due to the high alkaline environment. In some cases, however, the steel rebar will corrosion, which can lead to a series of adverse consequences such as concrete cracking and cover spalling [1,2]. The remaining service life of the structures, therefore, will be seriously shortened. In the marine environment and the cold regions where the deicing salt is used, the chloride transport is the main reason responsible for the steel rebar corrosion [3,4]. It is recognized that when the chloride content at the rebar surface reaches a critical value [5], the rebar starts to corrode. A reliable analysis of the chloride transport inside the concrete is helpful to estimate the service life of RC structures in chloride environment. However, the chloride transport in concrete is a very complex process that is influenced by many material and environmental variables such as the water-to-cement ratio (), temperature and relative humidity.
To accurately predict the chloride transport process inside the concrete, lots of experimental and theoretical researches were conducted in the past. Nowadays, several models and methods are available to analyze the chloride transport process. These models and methods can be categorized into two types. One is to develop empirical or semi-empirical models based on the analytical solution of Fick’s 2nd law [6,7], which is preferred in engineering practice owing to its simple expression and convenience to use. This approach, however, is only applicable under typical assumptions, e.g., homogeneous material, consistent environmental conditions, semi-infinite domain. The other approach is to use numerical methods to solve the governing equation of the Fick’s 2nd law to obtain a full profile of the chloride content. Compared with empirical models, the numerical method provides a more flexible but time-consuming approach to calculate the chloride content. The numerical method, therefore, is usually adopted in academic research [8,9].
An accurate prediction of the chloride transport process is strongly dependent on the evaluation of the chloride diffusivity. So far, numerous efforts were made to determine this parameter [10,11,12,13,14,15]. These researches showed that the chloride diffusivity can be influenced by a lot of factors which can be categorized into materials such as and environmental condition such as temperature and relative humidity. These influence factors are often considered by the following equation,
where is the chloride diffusivity, are influence factors, are influence functions, are the values of , with which the chloride diffusivity is measured.
To consider the effect of environmental conditions on the chloride transport process, the annual average temperature and relative humidity are often used in corresponding influence functions. This approach, however, is unreasonable, as it does not consider the time-variation (seasonal characteristics) of temperature and relative humidity during the year. It is possible that the annual average temperature and relative humidity in two places are the same, but the seasonal variations are different. If annual average values are directly used, the chloride transport process in these places should be the same. In fact, however, there may be differences (a typical example will be presented later). In these cases, it is improper to use annual average temperature and relative humidity to calculate the chloride content either by analytical model or numerical simulation.
This study mainly presents theoretical research on the effect of seasonal characteristics of temperature and relative humidity on the chloride diffusion process. Firstly, the governing equation of chloride diffusion with two influence functions of temperature and relative humidity, as well as the analytical and numerical solutions of the governing equation, is briefly introduced. Secondly, an illustrative example is studied to show the differences between calculated chloride profiles using annual and monthly average temperature and relative humidity. A parameter called “seasonal correction coefficient” is introduced to consider the effect of seasonal characteristics of temperature and relative humidity in analytical models. Then, a nationwide investigation of several major cities in China is conducted to obtain the value of the seasonal correction coefficient for each city. Thirdly, a parametric study is conducted to evaluate the sensitivity of the seasonal correction coefficient to important parameters such as chloride diffusivity. An analytical model with the seasonal correction coefficient is proposed in the fourth part of this study. Finally, some valuable conclusions are obtained. Through this study, it is expected that the issue of seasonal characteristics of temperature and relative humidity in the analysis of the chloride transport and other concrete durability problems can be recognized and received enough attention.
2. Models and Methods
2.1. Governing Equation
In one-dimension, the chloride diffusion process is governed by the Fick’s 2nd law,
where is the chloride content in the unit of mass percentage of concrete, is the apparent chloride diffusivity, and are influence functions which represent the effects of the temperature and relative humidity on the chloride diffusivity, respectively. With the purpose of nondimensionalization, Equation (3) can be rewritten as,
where , is the surface chloride content. The above equation assumes that is constant throughout the chloride diffusion process. The effect of the time-dependent will be discussed later.
The temperature can significantly affect the diffusion rate. From the perspective of physical chemistry, a higher temperature can increase the frequency of thermal vibrations of the diffusant. This effect can be considered by the modified Arrhenius equation,
where is the activation energy of chloride ions whose value is found to depend on and cement type [16,17], is the ideal gas constant, is the reference temperature ( is used).
According to the work by [10,18,19], has the following expression,
where and are two constants, is the critical relative humidity. The values of and are suggested as , [10,18,19], while different values of have been used in publications, e.g., 0.75 [10], 0.83 [18]. Based on Equation (6), a sharp variation of can be found near .
2.2. Analytical Solution
If the apparent chloride diffusivity and surface chloride content are constants, and the annual average temperature and relative humidity are used, the analytical solution of Equation (3) is simply,
where is the exposure time, is the distance to the exposure surface.
2.3. Numerical Solution
If the effect of the seasonal characteristics of temperature and relative humidity during the year on the chloride diffusion process should be considered, it is difficult to find the analytical solution, as the values of influence functions and are not constant. The governing equation is shown in Equation (3), therefore, it is numerically solved by finite element method (FEM). To this end, Equation (3) is firstly discretized in the spatial domain,
where and are global matrices, is the vector of . The detailed procedure to obtain Equation (8) can be found in textbooks on FEM. Then, Equation (8) is further discretized in the time domain by the Crank-Nicolson method,
where,
where and are used. By using Equations (9)–(11) and the initial condition, the chloride profile can be solved sequentially.
3. Results
3.1. Illustrative Case Study
In this section, the chloride diffusion processes in Beijing and Urumqi are adopted as a typical example to show the effect of the seasonal characteristics of temperature and relative humidity on chloride profiles. Although these two cities are located far from the coastal line, the weather in the winter is cold. The de-icing salt is usually used as a result. The chlorine attack, therefore, is still the main concern in the durability performance of RC structures in these cities. The monthly average temperature and relative humidity in two cities are plotted in Figure 2. As can be seen, the temperature in two cities has a similar seasonal change, i.e., high in the summer and low in the winter. The annual average temperature in Beijing ( °C) is higher than that in Urumqi ( °C). The relative humidity, on the other hand, shows an opposite seasonal variation. In Beijing, the relative humidity is low in the winter and high in the summer, while in Urumqi, the relative humidity is high in the winter and low in the summer. However, the annual average relative humidity in these two cities is close to each other (55.33% for Beijing and 57.92% for Urumqi).
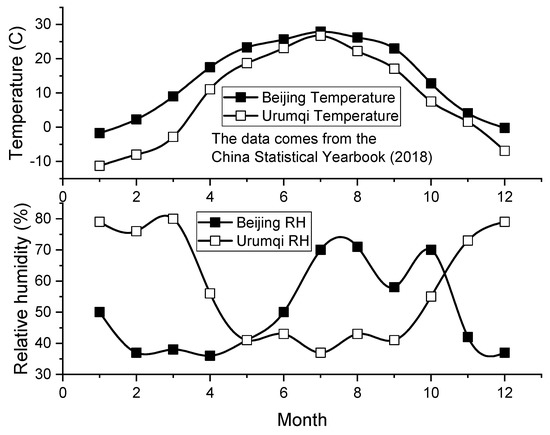
Figure 2.
Monthly average temperature and relative humidity of Beijing and Urumqi.
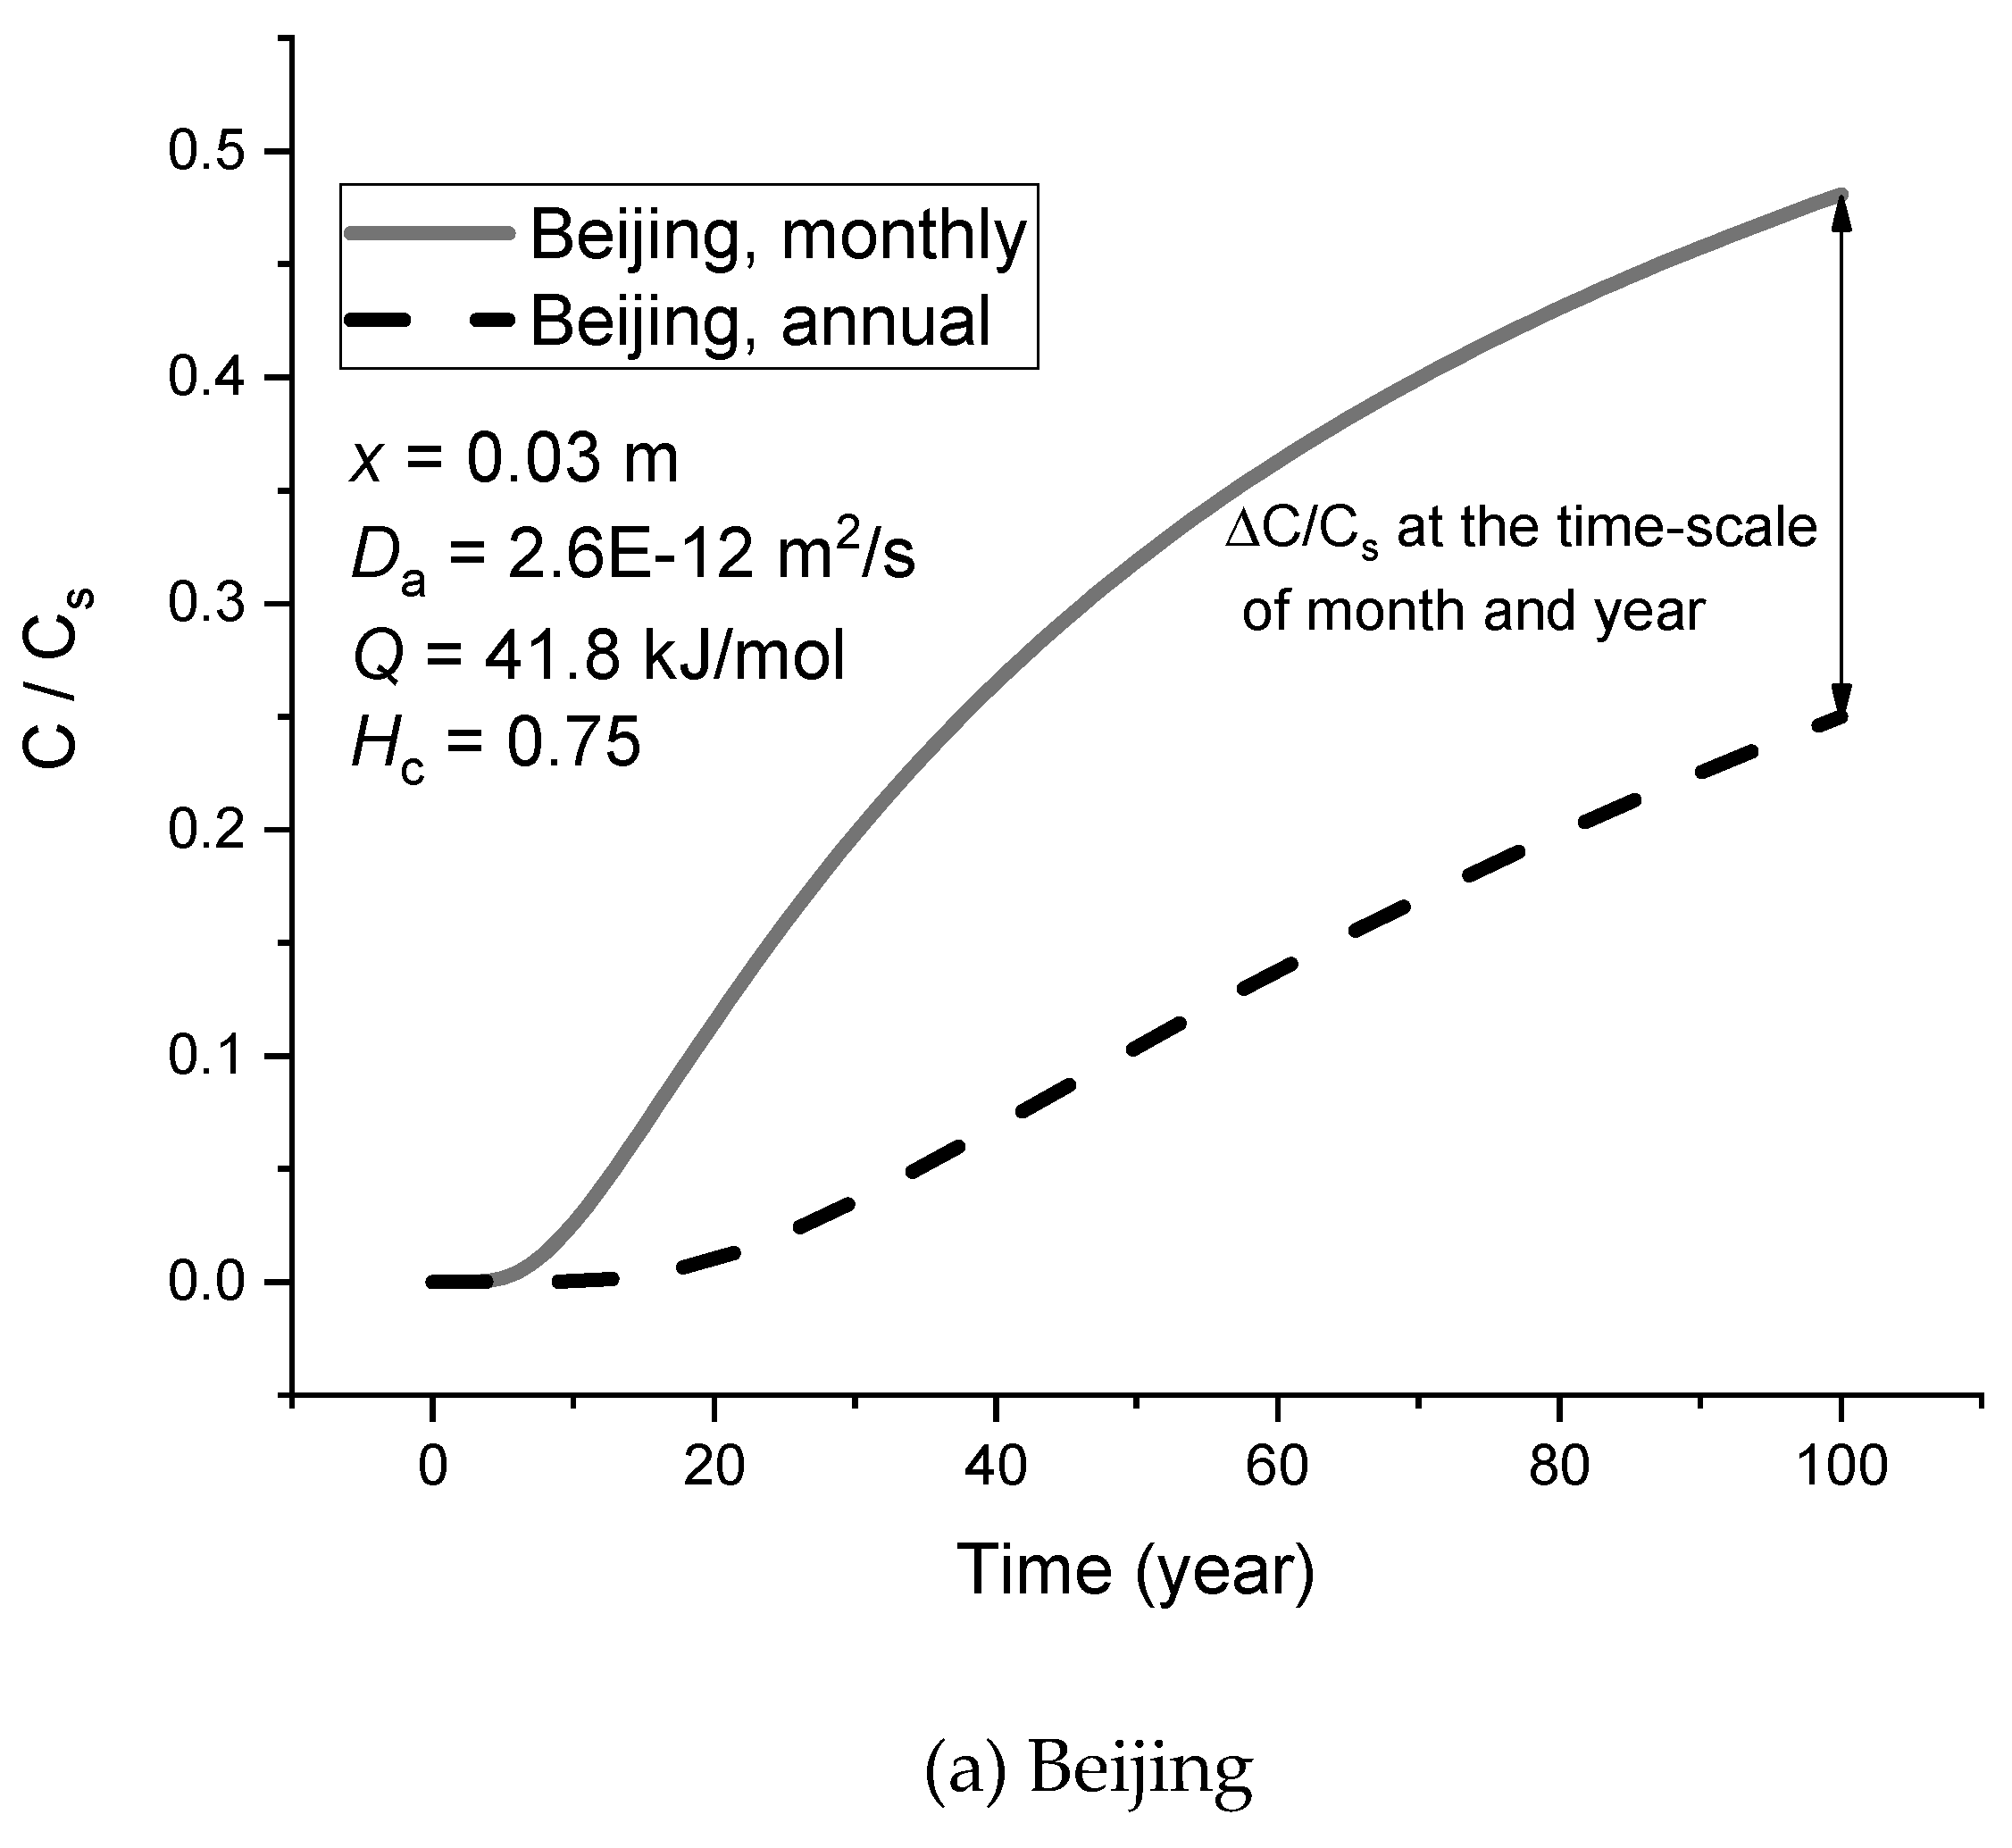
In this example, the apparent chloride diffusivity is , which was measured by Page, Short and El Tarras [16] for the cement (ordinary Portland cement, OPC) paste with . The corresponding activation energy in Equation (5) is . The critical relative humidity in Equation (6) is . With these parameters, the analytical and numerical solutions of Equation (3) are obtained using the annual and monthly average temperature and relative humidity, respectively.
The comparisons between the chloride profiles obtained by the analytical and numerical solutions are plotted in Figure 3. Firstly, the result in Figure 3a shows a significant difference between calculated chloride profiles for Beijing. One of the reasons is that the seasonal characteristics of temperature and relative humidity are not considered in the analytical solution. However, the result in Figure 3b shows that the difference between the calculated chloride profiles for Urumqi is neglectable. Therefore, the effect of the seasonal characteristics of temperature and relative humidity on the calculated chloride profile differs between cities, which indicates that an obvious seasonal variation of temperature or relative humidity is not a sufficient condition for the seasonal effect. How the temperature and relative humidity change with time during the year is also important.

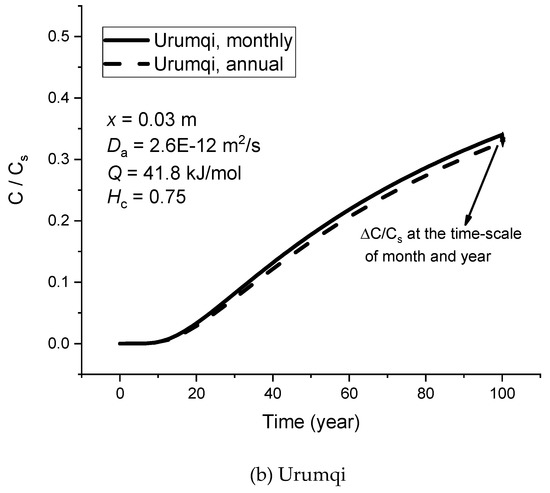
Figure 3.
Comparison between results of chloride profiles using an annual and monthly average of temperature and relative humidity for Beijing and Urumqi.
3.2. Seasonal Correction Coefficient
Based on the results in Figure 3, in some cities with specific seasonal characteristics of temperature and relative humidity, it is improper to calculate the chloride profile using the annual average of temperature and relative humidity. Although the numerical method can fully consider seasonal characteristics, it is not preferred in engineering practice owing to the computational effort. With this consideration, a parameter called seasonal correction coefficient is introduced to modify the analytical solution,
where is the seasonal correction coefficient.
To determine the proper value of , with a step of is tried. For each value of , the coefficient of determination () is calculated, as shown in Figure 4. Then, the best value of which results in the largest between analytical and numerical solutions of chloride profiles can be found, as shown in Figure 5. According to the results, can be considered as a constant throughout the entire chloride diffusion process.
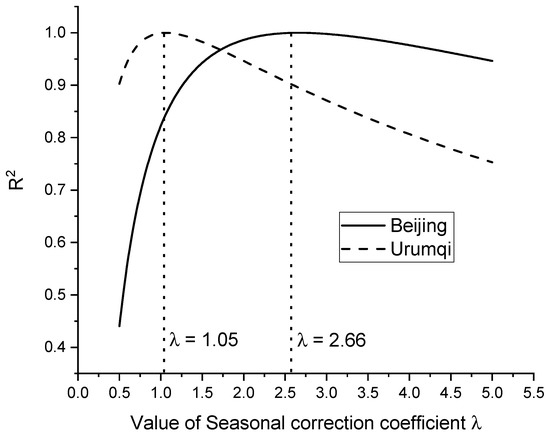
Figure 4.
Plot of R2 as a function of the value of seasonal correction coefficients for Beijing and Urumqi to obtain the best value.
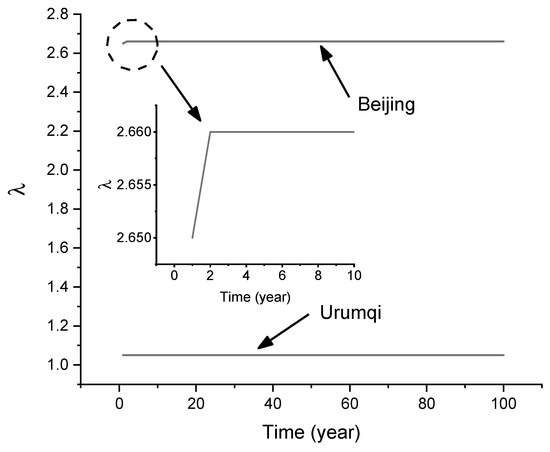
Figure 5.
Seasonal correction coefficients for Beijing and Urumqi.
3.3. Nationwide Investigation
To further investigate the effect of seasonal characteristics of temperature and relative humidity on chloride profiles, the monthly average temperature and relative humidity in several major cities are collected from the China Statistical Yearbook (2018 Edition). The profiles of the temperature and relative humidity of these cities are listed in Appendix A.
The parameters used in the analysis are the same as those in the illustrative example of Beijing and Urumqi. By following the similar analysis procedure, the seasonal correction parameter with for each city is obtained, as shown in Figure 6. Owing to the differences in seasonal variations of temperature and relative humidity, covers a wide range, which can be as large as 2.66 (Beijing) and as small as 0.87 (Guiyang). For the cities with , e.g., Kunming, Nanchang, it is still acceptable to use annual average temperature and relative humidity to calculate the chloride profile by the analytical solution in Equation (7). However, for cities such as Beijing and Changchun, the seasonal characteristics of temperature and relative humidity must be considered, i.e., Equation (12) should be used.
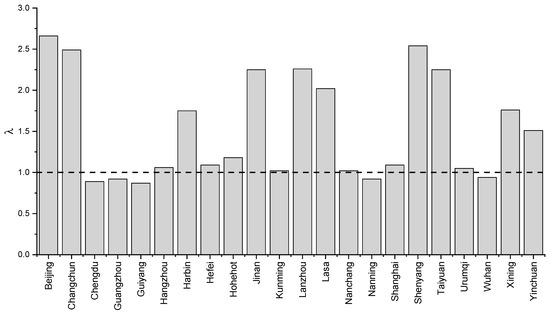
Figure 6.
Seasonal correction coefficients for major cities in China.
4. Discussion
4.1. Effect of Chloride Diffusivity
In the above illustrative case study and nationwide investigation, the chloride diffusivity calibrated by Page, Short and El Tarras [16] for OPC paste is adopted. For mortar and concrete, the effect of aggregates should be considered. Experimental work [20,21] suggests that the reference chloride diffusivity has a linear relationship with the volume fraction of aggregates,
where is a reduction coefficient which is proportional to where is the volume fraction of aggregates.
To analyze the effect of on the seasonal correction coefficient, are chosen. The results of seasonal correction coefficients for several representative cities are shown in Figure 7. It is found that the seasonal correction coefficient is independent on the chloride diffusivity. The reason is explained as follows.
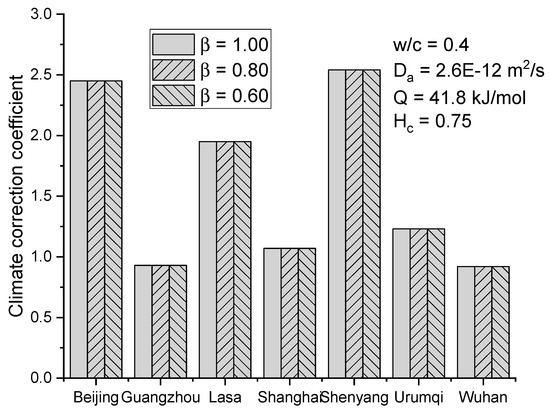
Figure 7.
Effect of chloride diffusivity on seasonal correction coefficient.
When the chloride diffusivity is reduced to , the analytical solution in Equation (7) becomes,
which indicates that the chloride profile at time is the same as the profile at time before the reduction of .
For the numerical solution, the diffusivity matrix K in Equation (8) is proportional to . Equations (10) and (11), therefore, become,
which can be further transformed into,
From Equation (16), it can be found that in the numerical solution, the chloride profile at time is the same as that at time before the reduction of . Therefore, when is reduced, the chloride profiles obtained by the analytical and numerical solutions decrease synchronously. The seasonal correction coefficient, therefore, remains the same.
In the above case study, the chloride diffusivity is taken as a constant throughout the service life of concrete structures. In-situ test, however, shows that owing to the further cement hydration after exposure, the chloride diffusivity decreases with time [22], and finally becomes a constant when the cement hydration is finished,
where is the age of concrete, is the exposure time, is the age of concrete at the beginning of exposure, is the age of concrete when the chloride diffusivity is , is a parameter whose value is between 0.2 and 0.6 according to Life-365 [23], or [22].
With Equation (17), the analytical solution of the chloride profile becomes [6],
where .
By following the same procedure in Section 3.2, the seasonal correction coefficient with the consideration of the time-dependent chloride diffusivity can be also obtained, as shown in Figure 8. As can be seen, within the common range of , only a slight difference in the seasonal correction coefficient, i.e., decreasing when increases, is found. Besides, in all these cases with different , is very close to 1.0 (larger than 0.99 in all cases). Therefore, the seasonal correction coefficient for (constant chloride diffusivity) can be still used even if the time-dependence of chloride diffusivity is considered.
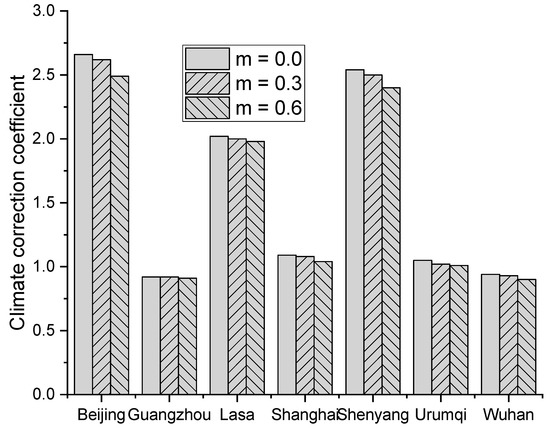
Figure 8.
Effect of time-dependence of chloride diffusivity on seasonal correction coefficient.
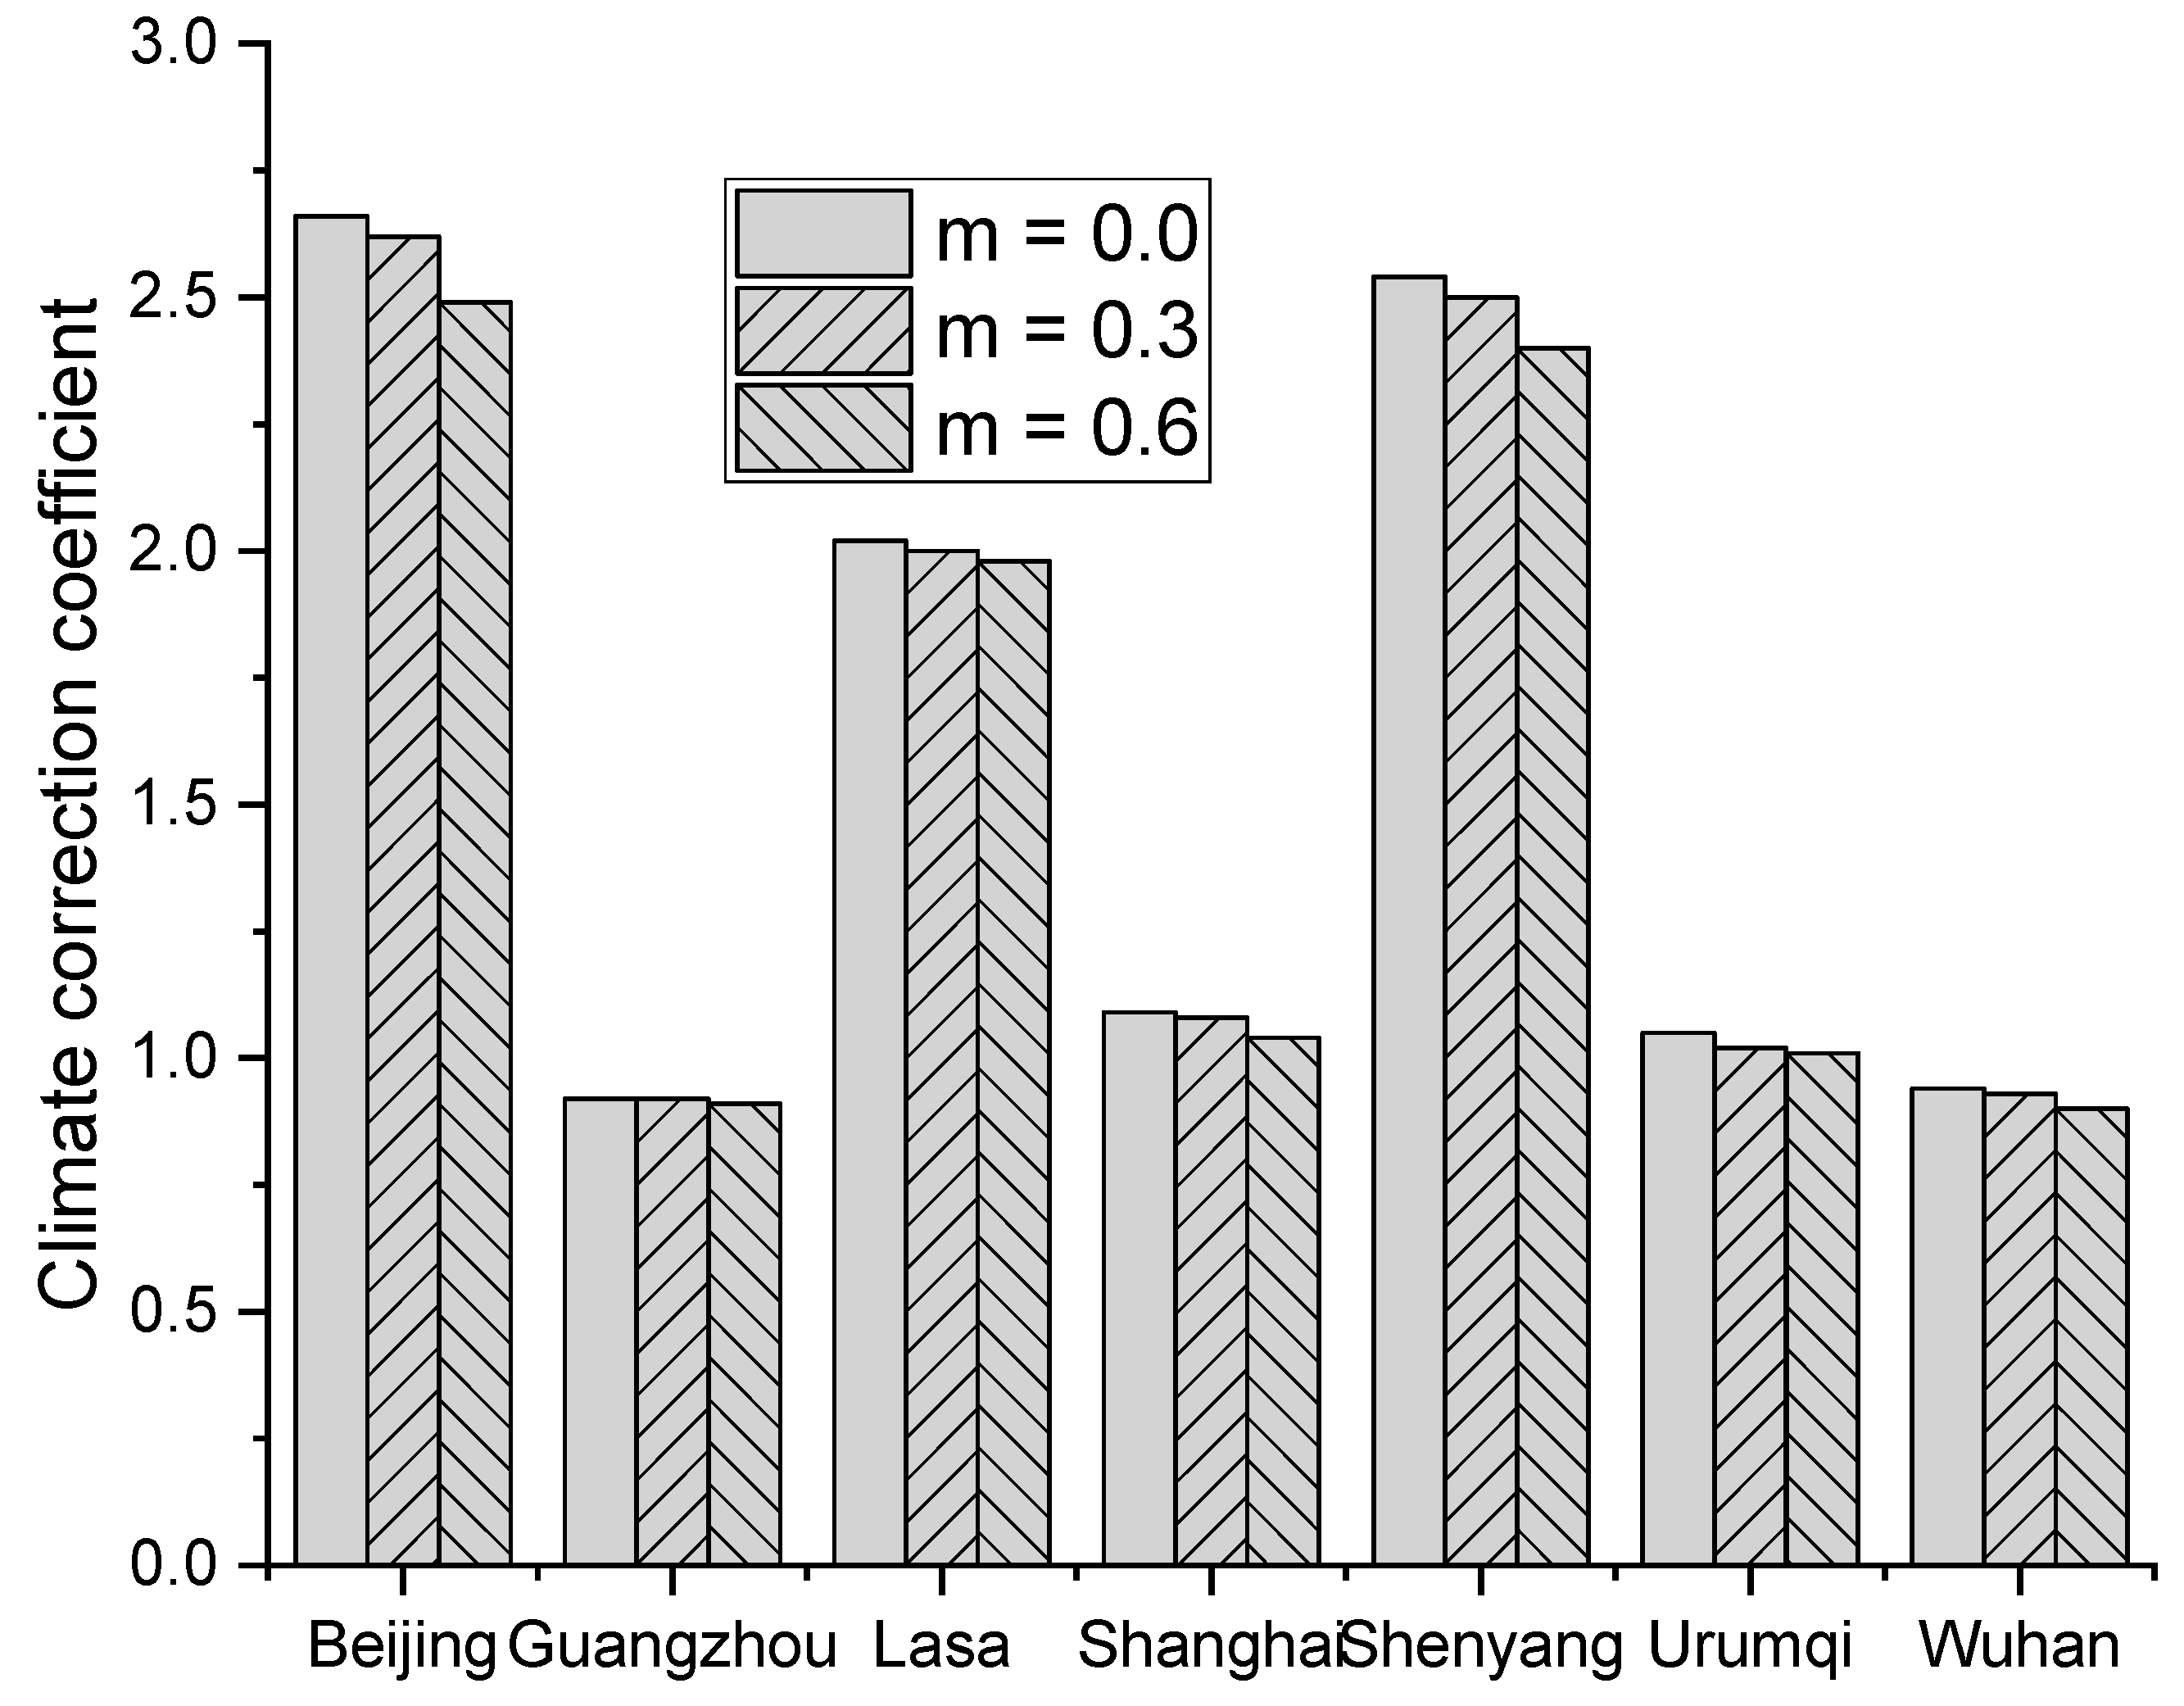
4.2. Effect of Activation Energy
In the influence function of temperature, the activation energy is of special importance, as it stands for the diffusion rate of chloride ions. Research by Page, Short and El Tarras [16] shows that the activation energy is relevant to , but does not have a monotonous relationship with . According to the experimental data [16], the activation energy is for OPC cement with , respectively. These values are adopted to study the effect of the activation energy on the seasonal correction coefficient. The results of these three cases are plotted in Figure 9. It can be found that the activation energy has a slight effect on the seasonal correction coefficient. If the seasonal correction coefficient is close to 1.0, the effect is negligible.
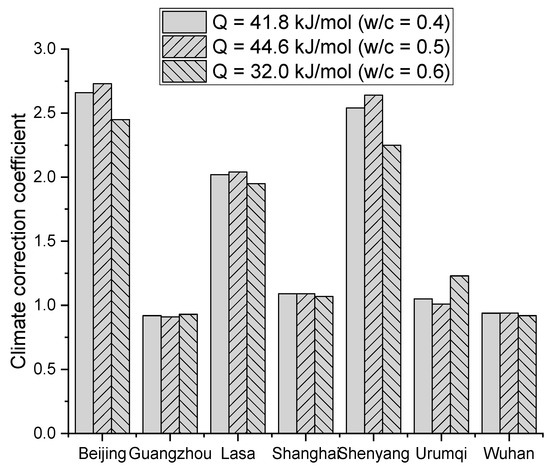
Figure 9.
Effect of activation energy on the seasonal correction coefficient.
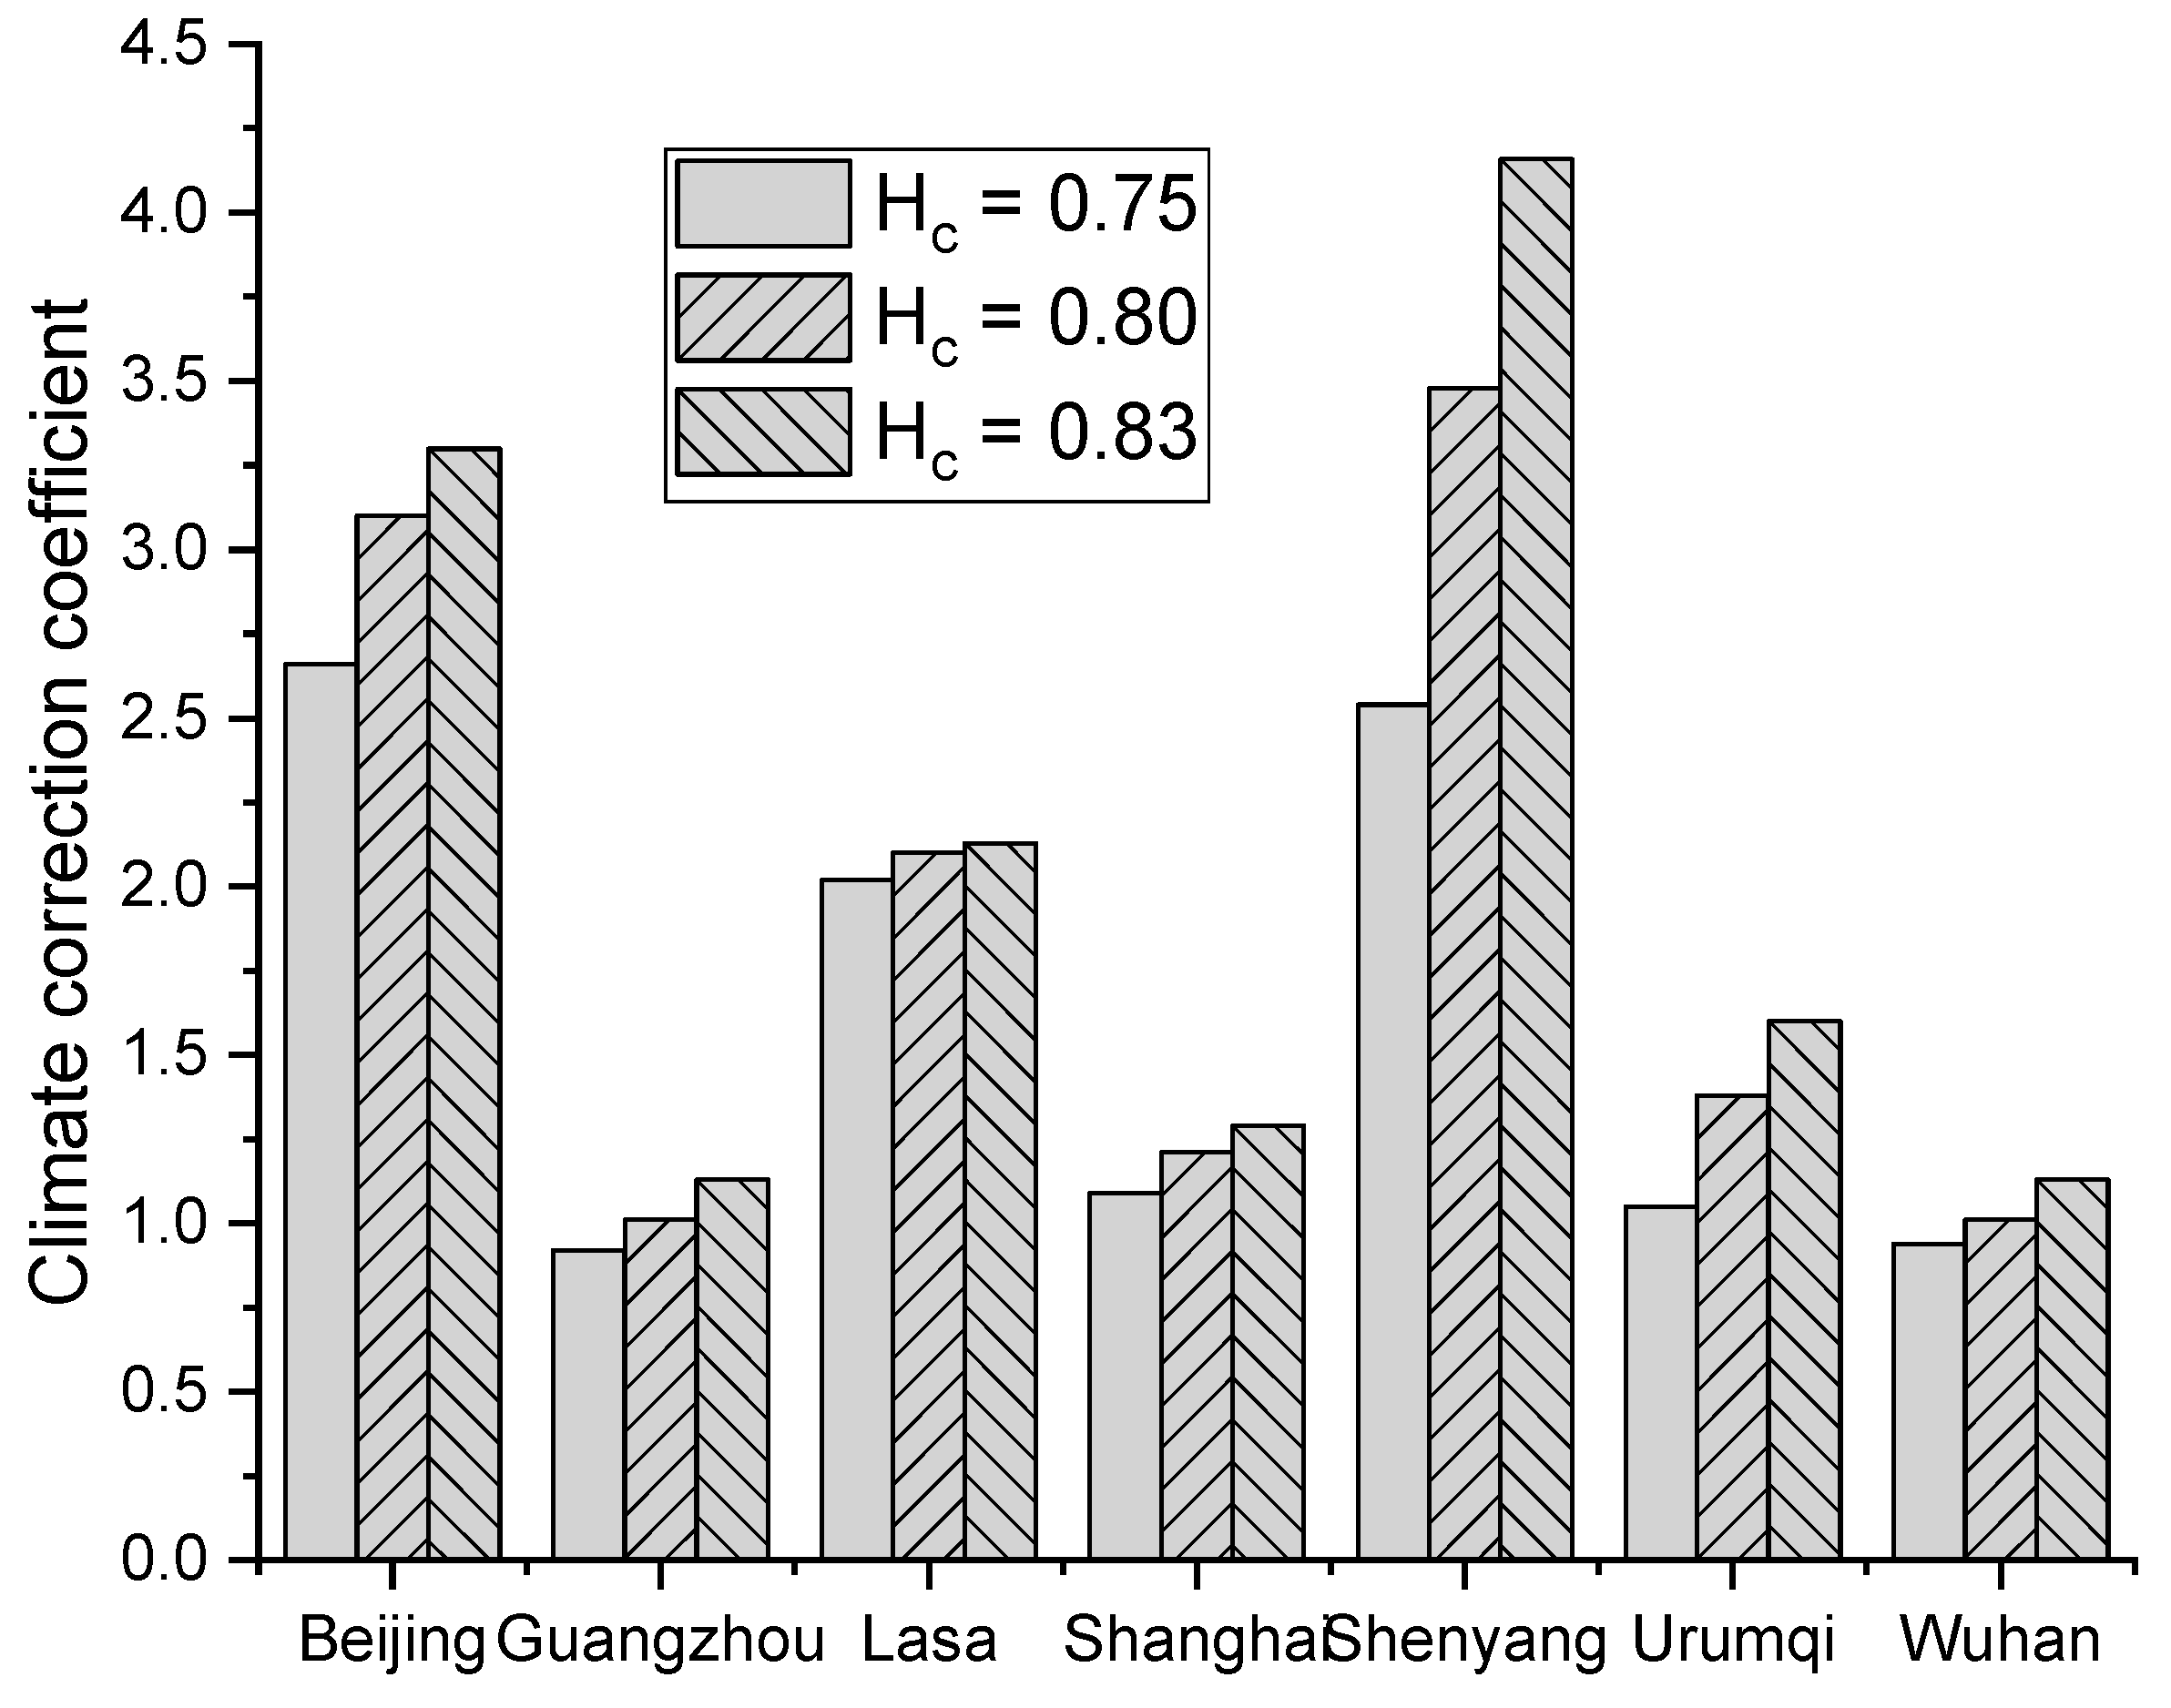
4.3. Effect of Critical Relative Humidity
In all the above analyses, the critical relative humidity is used. This value has been adopted in publications on the chloride diffusion in unsaturated cementitious materials [10,19]. Other values, however, are also reported, e.g., by Nielsen and Geiker [18] based on the data fitting with the experimental result. Therefore, are adopted to study the effect of on the seasonal correction coefficient. The results are shown in Figure 10. It is found that the seasonal correction coefficient increases monotonously with . The increase rate, however, differs from the seasonal characteristic of relative humidity in different cities.
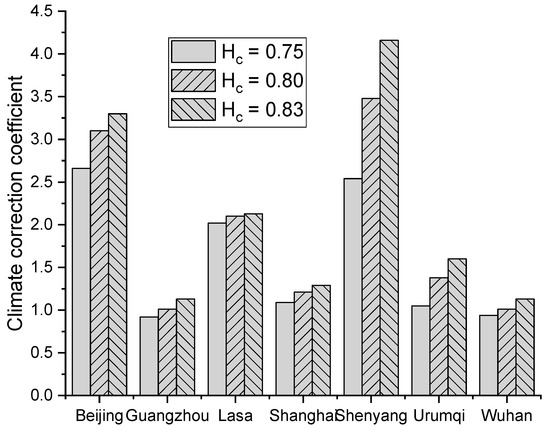
Figure 10.
Effect of critical relative humidity on seasonal correction coefficient.
4.4. Effect of Surface Chloride Content
When RC structures are exposed to the chloride environment, the chloride ions gradually accumulate on the concrete surface. The surface chloride content, therefore, should increase with time in the initial exposure period [24]. In-site tests in publications show that the surface chloride content has a linear or square-root increase relationship with time, dependent on the type of the chloride environment [25,26,27,28]. If the structure is submerged and exposed to wet-dry cycles, the surface chloride content in concrete has a square-root increase with time [29],
If the structure is submerged and exposed to airborne chloride, the surface chloride content in concrete linearly increases with time,
where is a constant dependent on the environmental condition.
When the surface chloride content is considered, the analytical solution of Equation (3) can be still found, but with a much more complex expression. For , the analytical solution is [6],
where . For , the analytical solution is [7],
By following the same procedure in Section 3.2, the seasonal correction coefficient with the consideration of the time-dependent chloride diffusivity can be also obtained, as shown in Figure 11. The results indicate that the seasonal correction coefficient is independent of the type of surface chloride content and its increase rate.
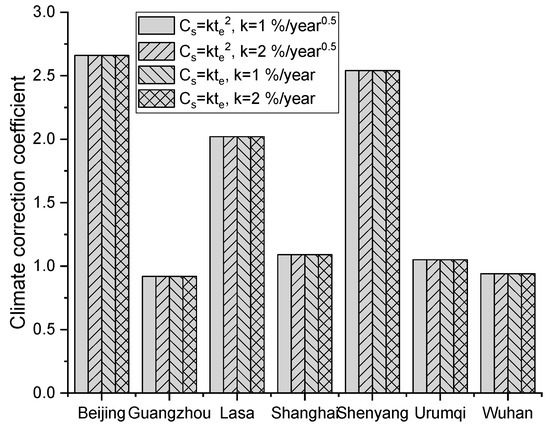
Figure 11.
Effect of surface chloride content on the seasonal correction coefficient.
5. Conclusions
This study mainly presents theoretical research on the effect of seasonal characteristics of temperature and relative humidity on the chloride diffusion process. To this end, the temperature and relative humidity in several major cities in China were first collected. Then, the governing equation of one-dimensional chloride diffusion was solved by both analytical and numerical methods by using annual and monthly average of temperature and relative humidity, respectively. Based on these two methods, an illustrative example, nationwide investigation, and parametric study were conducted. Based on the results and discussions, the following conclusions can be drawn,
- The analytical solution with annual average temperature and relative humidity cannot consider their seasonal variations, which is questionable to calculate chloride profiles for typical cities.
- A seasonal correction coefficient for each city can be introduced to modify the analytical solution to enable its consideration of seasonal characteristics of temperature and relative humidity.
- Based on a parametric study, the seasonal correction coefficient shows a slight difference when the time-dependence of chloride diffusivity is considered.
- The seasonal correction coefficient is independent of how the surface chloride content increases with time and the increase rate.
- Within the common range of water-to-cement ratio for OPC mortar and concrete, the seasonal correction coefficient is affected slightly by the activation energy and greatly by the critical relative humidity in influence functions of temperature and relative humidity, respectively.
This paper only presents a preliminary theoretical study on the effect of seasonal characteristics of environmental conditions on the chloride diffusion. To further study this issue, a series of in-door experiments and in-situ tests should be conducted to confirm the calculated seasonal correction coefficient for cities with different climate characteristics. This work, however, is beyond the scope of this paper and will be done in future research.
Author Contributions
Conceptualization, Z.P. and T.L.; methodology, Z.P. and X.R.; formal analysis, Z.P. and T.L.; Writing—Original Draft preparation, Z.P.; Writing—Review and Editing, X.R.; funding acquisition, T.L. and X.R.
Funding
This research was funded by the support from the National Key R&D Program of China (Grant number 2018YFB1600100), National Natural Science Foundations of China (Grant numbers 51608377 and 51678435) and Urumqi Science and Technology Plan (Grant number Y161320002).
Conflicts of Interest
The authors declare no conflict of interest.
Appendix A

Table A1.
Monthly average temperature of major cities in China (°C).
Table A1.
Monthly average temperature of major cities in China (°C).
| City | Month | |||||||||||
|---|---|---|---|---|---|---|---|---|---|---|---|---|
| 1 | 2 | 3 | 4 | 5 | 6 | 7 | 8 | 9 | 10 | 11 | 12 | |
| Beijing | −1.7 | 2.3 | 9 | 17.5 | 23.3 | 25.6 | 27.9 | 26.2 | 23 | 12.8 | 4.1 | −0.2 |
| Taiyuan | −2.5 | 0.2 | 5.7 | 13.4 | 21 | 21.9 | 25.6 | 22.7 | 18.9 | 10.5 | 3.1 | −3.1 |
| Hohhot | −9.1 | −5.6 | 0.7 | 10.4 | 17.5 | 20.9 | 24.6 | 20.9 | 16.7 | 7.3 | −3.2 | −8.2 |
| Changchun | −12.2 | −7.7 | 0.6 | 10.7 | 16.6 | 20.2 | 24.8 | 22.1 | 16.4 | 7.7 | −3.1 | −12.4 |
| Harbin | −16.6 | −11 | −1.7 | 9.1 | 16.7 | 19.9 | 24.7 | 22.1 | 15 | 6.2 | −5.7 | −17.1 |
| Shanghai | 6.8 | 6.8 | 10.4 | 17.1 | 21.9 | 24 | 31.9 | 29.4 | 24.6 | 19.3 | 13.6 | 7.1 |
| Hangzhou | 7.3 | 7.8 | 11.3 | 18.7 | 22.8 | 24.1 | 31.6 | 30.3 | 24.9 | 19.1 | 13.7 | 7.4 |
| Hefei | 5.4 | 6.4 | 10.8 | 18 | 23.1 | 25.7 | 30.8 | 28.1 | 23.2 | 16.4 | 11.8 | 5.4 |
| Nanchang | 8.9 | 9.5 | 12.4 | 19.4 | 24.6 | 24.4 | 31 | 29.9 | 26.8 | 20.1 | 14.3 | 8.7 |
| Jinan | 1.1 | 4.7 | 9.3 | 17.5 | 24.3 | 25.8 | 28.2 | 26.7 | 24.1 | 14.7 | 8.9 | 2.5 |
| Wuhan | 6.4 | 7.2 | 11.5 | 17.6 | 22.7 | 25.2 | 30.6 | 28.6 | 23.5 | 16.7 | 12 | 5.4 |
| Guangzhou | 15.4 | 15 | 17.9 | 21.6 | 25.1 | 28.2 | 27.9 | 28.7 | 27.9 | 23.6 | 19.3 | 14.4 |
| Nanning | 15.6 | 15.5 | 17.1 | 22.3 | 25.4 | 27.6 | 27.6 | 27.9 | 28.2 | 23.3 | 18.4 | 14.1 |
| Chengdu | 7.3 | 8.2 | 11.1 | 17.2 | 21.5 | 23.4 | 26.7 | 25.9 | 22.3 | 16.5 | 12.4 | 6.5 |
| Guiyang | 6.6 | 7.5 | 9.2 | 16.5 | 18.8 | 20.1 | 23.5 | 23.6 | 21.7 | 16.4 | 11.4 | 6.5 |
| Kunming | 10.2 | 11.2 | 13.7 | 16.1 | 18.9 | 20.9 | 19.6 | 20.3 | 19.7 | 16.1 | 12.4 | 9.3 |
| Lasa | 0.1 | 4.5 | 5.9 | 10 | 13.4 | 16.1 | 16.6 | 16.4 | 16.2 | 11.6 | 4.5 | 2 |
| Lanzhou | −6.8 | −2.1 | 2.8 | 10.2 | 15.4 | 18.7 | 23.4 | 18.8 | 15.2 | 7.7 | −0.1 | −7.3 |
| Xining | −6.7 | −2.4 | 1.1 | 7.6 | 11.8 | 15.3 | 20.2 | 16.6 | 12.4 | 6.7 | −0.7 | −6.4 |
| Yinchuan | −4.6 | −0.4 | 4.6 | 14 | 19.3 | 23.1 | 25.9 | 22.4 | 19.3 | 9.8 | 2.8 | −4.5 |
| Urumqi | −11.3 | −8 | −2.8 | 11.1 | 18.7 | 23.1 | 26.7 | 22.2 | 17.1 | 7.5 | 1.6 | −6.9 |
| Shenyang | −9.1 | −4.9 | 2.8 | 12.7 | 18.7 | 22.8 | 26.5 | 23.5 | 17.9 | 9.2 | 0.2 | −8.3 |
Table A2.
Monthly average relative humidity of major cities in China (%).
Table A2.
Monthly average relative humidity of major cities in China (%).
| City | Month | |||||||||||
|---|---|---|---|---|---|---|---|---|---|---|---|---|
| 1 | 2 | 3 | 4 | 5 | 6 | 7 | 8 | 9 | 10 | 11 | 12 | |
| Beijing | 50 | 37 | 38 | 36 | 41 | 50 | 70 | 71 | 58 | 70 | 42 | 37 |
| Taiyuan | 55 | 50 | 45 | 47 | 37 | 59 | 67 | 76 | 70 | 81 | 53 | 47 |
| Hohhot | 52 | 47 | 47 | 31 | 29 | 41 | 45 | 51 | 42 | 58 | 42 | 43 |
| Changchun | 65 | 62 | 50 | 38 | 50 | 65 | 75 | 80 | 64 | 51 | 54 | 61 |
| Harbin | 72 | 68 | 62 | 46 | 49 | 68 | 70 | 76 | 70 | 54 | 62 | 67 |
| Shanghai | 73 | 66 | 67 | 64 | 66 | 77 | 66 | 76 | 78 | 75 | 74 | 65 |
| Hangzhou | 74 | 63 | 69 | 63 | 69 | 81 | 66 | 72 | 79 | 76 | 74 | 67 |
| Hefei | 74 | 72 | 70 | 71 | 72 | 76 | 76 | 83 | 85 | 80 | 69 | 67 |
| Nanchang | 71 | 68 | 76 | 70 | 67 | 88 | 70 | 76 | 76 | 73 | 74 | 63 |
| Jinan | 60 | 44 | 43 | 49 | 45 | 54 | 74 | 73 | 60 | 67 | 39 | 44 |
| Wuhan | 78 | 79 | 78 | 79 | 77 | 85 | 75 | 86 | 89 | 88 | 79 | 76 |
| Guangzhou | 81 | 75 | 84 | 83 | 84 | 85 | 85 | 82 | 85 | 75 | 78 | 66 |
| Nanning | 77 | 71 | 85 | 78 | 79 | 86 | 86 | 86 | 85 | 78 | 80 | 67 |
| Chengdu | 81 | 81 | 81 | 76 | 71 | 80 | 81 | 85 | 86 | 90 | 83 | 80 |
| Guiyang | 87 | 79 | 87 | 75 | 73 | 88 | 78 | 80 | 80 | 82 | 78 | 74 |
| Kunming | 71 | 65 | 61 | 67 | 62 | 73 | 83 | 81 | 81 | 83 | 75 | 72 |
| Lasa | 21 | 15 | 22 | 31 | 39 | 49 | 58 | 60 | 48 | 39 | 24 | 23 |
| Lanzhou | 42 | 47 | 50 | 48 | 44 | 62 | 52 | 78 | 75 | 78 | 59 | 53 |
| Xining | 47 | 47 | 52 | 54 | 54 | 60 | 53 | 70 | 76 | 73 | 53 | 48 |
| Yinchuan | 45 | 43 | 44 | 33 | 33 | 45 | 52 | 60 | 55 | 67 | 43 | 49 |
| Urumqi | 79 | 76 | 80 | 56 | 41 | 43 | 37 | 43 | 41 | 55 | 73 | 79 |
| Shenyang | 63 | 59 | 47 | 42 | 50 | 57 | 72 | 81 | 73 | 63 | 48 | 51 |
References
- Jaffer, S.J.; Hansson, C.M. Chloride-induced corrosion products of steel in cracked-concrete subjected to different loading conditions. Cem. Concr. Res. 2009, 39, 116–125. [Google Scholar] [CrossRef]
- Chen, A.; Pan, Z.; Ma, R. Mesoscopic simulation of steel rebar corrosion process in concrete and its damage to concrete cover. Struct. Infrastruct. Eng. 2017, 13, 478–493. [Google Scholar] [CrossRef]
- Akiyama, M.; Frangopol, D.M.; Takenaka, K. Reliability-based durability design and service life assessment of reinforced concrete deck slab of jetty structures. Struct. Infrastruct. Eng. 2017, 13, 468–477. [Google Scholar] [CrossRef]
- Akiyama, M.; Frangopol, D.M.; Matsuzaki, H. Life-cycle reliability of RC bridge piers under seismic and airborne chloride hazards. Earthq. Eng. Struct. Dyn. 2011, 40, 1671–1687. [Google Scholar] [CrossRef]
- Angst, U.; Elsener, B.; Larsen, C.K.; Vennesland, O. Critical chloride content in reinforced concrete—A review. Cem. Concr. Res. 2009, 39, 1122–1138. [Google Scholar] [CrossRef]
- Zhou, S. Analytical Model for Square Root Increase of Surface Chloride Concentration and Decrease of Chloride Diffusivity. J. Mater. Civ. Eng. 2015, 28, 04015181. [Google Scholar] [CrossRef]
- Zhou, S. Modeling chloride diffusion in concrete with linear increase of surface chloride. ACI Mater. J. 2014, 111, 483–490. [Google Scholar]
- Meijers, S.; Bijen, J.; De Borst, R.; Fraaij, A. Computational results of a model for chloride ingress in concrete including convection, drying-wetting cycles and carbonation. Mater. Struct. 2005, 38, 145–154. [Google Scholar] [CrossRef]
- Conciatori, D.; Laferrière, F.; Brühwiler, E. Comprehensive modeling of chloride ion and water ingress into concrete considering thermal and carbonation state for real climate. Cem. Concr. Res. 2010, 40, 109–118. [Google Scholar] [CrossRef]
- Ababneh, A.; Benboudjema, F.; Xi, Y.P. Chloride penetration in nonsaturated concrete. J. Mater. Civ. Eng. 2003, 15, 183–191. [Google Scholar] [CrossRef]
- Wang, L.; Soda, M.; Ueda, T. Simulation of Chloride Diffusivity for Cracked Concrete Based on RBSM and Truss Network Model. ACT 2008, 6, 143–155. [Google Scholar] [CrossRef]
- Zheng, J.; Zhang, C.; Wu, Y.; Sun, L. Random-Walk Algorithm for Chloride Diffusivity of Concrete with Aggregate Shape Effect. J. Mater. Civ. Eng. 2016, 28, 04016153. [Google Scholar] [CrossRef]
- Fu, C.; Jin, X.; Ye, H.; Jin, N. Theoretical and Experimental Investigation of Loading Effects on Chloride Diffusion in Saturated Concrete. J. Adv. Concr. Technol. 2015, 13, 30–43. [Google Scholar] [CrossRef]
- Djerbi Tegguer, A.; Bonnet, S.; Khelidj, A.; Baroghel-Bouny, V. Effect of uniaxial compressive loading on gas permeability and chloride diffusion coefficient of concrete and their relationship. Cem. Concr. Res. 2013, 52, 131–139. [Google Scholar] [CrossRef]
- Abyaneh, S.D.; Wong, H.S.; Buenfeld, N.R. Modelling the diffusivity of mortar and concrete using a three-dimensional mesostructure with several aggregate shapes. Comput. Mater. Sci. 2013, 78, 63–73. [Google Scholar] [CrossRef]
- Page, C.L.; Short, N.R.; El Tarras, A. Diffusion of chloride ions in hardened cement pastes. Cem. Concr. Res. 1981, 11, 395–406. [Google Scholar] [CrossRef]
- Collepardi, M.; Marcialis, A.; Turriziani, R. Penetration of Chloride Ions into Cement Pastes and Concretes. J. Am. Ceram. Soc. 1972, 55, 534–535. [Google Scholar] [CrossRef]
- Nielsen, E.P.; Geiker, M.R. Chloride diffusion in partially saturated cementitious material. Cem. Concr. Res. 2003, 33, 133–138. [Google Scholar] [CrossRef]
- Saetta, A.V.; Scotta, R.V.; Vitaliani, R.V. Analysis of chloride diffusion into partially saturated concrete. ACI Mater. J. 1993, 90, 441–451. [Google Scholar]
- Yang, C.C.; Su, J.K. Approximate migration coefficient of interfacial transition zone and the effect of aggregate content on the migration coefficient of mortar. Cem. Concr. Res. 2002, 32, 1559–1565. [Google Scholar] [CrossRef]
- Caré, S. Influence of aggregates on chloride diffusion coefficient into mortar. Cem. Concr. Res. 2003, 33, 1021–1028. [Google Scholar] [CrossRef]
- Mangat, P.S.; Molloy, B.T. Prediction of Long-Term Chloride Concentration in Concrete. Mater. Struct. 1994, 27, 338–346. [Google Scholar] [CrossRef]
- Bentz, E.C. Probalistic Modeling of Service Life for Structures Subjected to Chlorides. ACI Mater. J. 2003, 100, 391–397. [Google Scholar]
- Pang, L.; Li, Q. Service life prediction of RC structures in marine environment using long term chloride ingress data: Comparison between exposure trials and real structure surveys. Constr. Build. Mater. 2016, 113, 979–987. [Google Scholar] [CrossRef]
- Mustafa, M.A.; Yusof, K.M. Atmospheric chloride penetration into concrete in semitropical marine environment. Cem. Concr. Res. 1994, 24, 661–670. [Google Scholar] [CrossRef]
- Costa, A.; Appleton, J. Chloride penetration into concrete in marine environment—Part I: Main parameters affecting chloride penetration. Mater. Struct. 1999, 32, 252–259. [Google Scholar] [CrossRef]
- Costa, A.; Appleton, J. Chloride penetration into concrete in marine environment—Part II: Prediction of long term chloride penetration. Mater. Struct. 1999, 32, 354–359. [Google Scholar] [CrossRef]
- Meira, G.R.; Andrade, C.; Alonso, C.; Borba, J.C.; Padilha, M. Durability of concrete structures in marine atmosphere zones—The use of chloride deposition rate on the wet candle as an environmental indicator. Cem. Concr. Compos. 2010, 32, 427–435. [Google Scholar] [CrossRef]
- Tang, L.; Nilsson, L.O. Prediction of Chloride Penetration into Concrete Exposed to Various Exposure Environments. In Proceedings of the 9th International Conference on the Durability of Building Materials and Components, Brisbane, Australia, 17–20 March 2002. [Google Scholar]


© 2019 by the authors. Licensee MDPI, Basel, Switzerland. This article is an open access article distributed under the terms and conditions of the Creative Commons Attribution (CC BY) license (http://creativecommons.org/licenses/by/4.0/).