Abstract
Estimation of economic development in advance is benefit to test the validity of economic policy or to take timely remedial measures for economic recession. Due to the inevitable connections between human mobility and economic status, estimation of economic trend in advance from easily observable big data in human mobility has the superiority of authenticity, timeliness, and convenience. However, high-precision quantitative relations between human mobility and economic growth remain an outstanding question. To this issue, we firstly analyzed and compared the general patterns of human mobility and economic development; then, a novel, simple, and effective hybrid human mobility indicator () of weighted human mobility networks was proposed to quantitatively estimate economic growth. contained two parts, that is, the interaction volumes of a given city with all participation cities and only top hub cities, respectively. This implied that the economic growth of a city is affected by not only its own strength, but also the cooperation with hub cities. Several empirical experiments demonstrated that the proposed had an exceedingly high estimation ability of economic growth, especially for the tertiary industry. Compared with other complex network indicators, had a distinct advantage and its best accuracy reached 0.9543. These results can provide policy-making supports for inter-city sustainable coordinated development.
1. Introduction
In the background of urbanization process, both the cooperation and competition between cities become fiercer and fiercer [1,2,3]. To timely estimate economic current status and future growing trend in advance is of great importance for testing the validity of economic policy [4,5] or for taking timely remedial measures for economic recession [6]. However, traditional survey data and complicated economic forecast models consume huge manpower and material resources. So, a major challenge is brought to policy-makers and researchers. Under this context, reliable and quantitative big data are a necessary and promising way to simply, quickly, and effectively estimate economic development, which is benefit for the sustainable development of urban systems [7].
Essentially speaking, economy is the products of human activities. For economic development, human activities play an irreplaceable role. For instance, the activities recorded by social media and “Internet of Things” were used to measure unemployment [8], electoral outcomes [9], and economic development [10]. Many social-economic activities need people’s participation. Usually, the more people participant in, the more wealth would be created. Some literatures demonstrated that measurements made on large datasets recording human activities can yield us high-fidelity proxies of socio-economic development and we can monitor the socio-economic development of a territory just by observing the inhabitant behaviors [11]. Thus, to investigate the quantitative relation between economy and human activities would be effective.
During all activities, human mobility not only is a comprehensive necessity to meet various society needs [12], but also motivates the communication of innovation [13], culture [14], ideas and labor force [15]. Inevitable connections between human mobility and economic development [16,17] exist. Relevant literatures have confirmed that human mobility is strongly related to the overall economy of a city. Studies on human mobility have been a hotspot of geography [18,19] and economics in recent years due to the significant scientific values and wide applications in migration [20] and economy issues [21]. At the individual level, predictability of individual human mobility was confirmed [22] and their general patterns were revealed [23,24]. With such findings, personalized location-based recommendations were improved, which promoted the development of the shared economy concept [25]. At the collective level, the spatial-temporal patterns of aggregate human mobility were widely used in urban planning [26], traffic forecasting [27], and the spread prevention of biological [28], and mobile viruses [29]. As a result, human mobility, on the one hand, made the world smaller [30]; on the other hand, led to city attraction and economic strength. Thus, human mobility has potential for estimating economic growth. Moreover, to monitor human mobility is easy, cheap, and can be done in real-time. Compared with traditional economic census, human mobility data are superior in terms of high timeliness and low cost. As a result, human mobility would be a good choice of cheaply, quickly, and effectively estimating economic growth.
In spite of the huge significance and practicability, the estimation of economic growth is still challenging. The reasons include that: (1) economic growth is a systematic, integrated, and complicated process. It involves many factors, such as policy, population, industrial structure, and so on; (2) Compared with economic status, the differences of economic growth among cities are relatively smaller. The estimation accuracy would be more demanding. Correspondingly, most existing literatures either used particularly complicated methods and time-, money-, and labor-consuming data, or merely utilized big data to estimate current economic status, but few have considered economic growth. The main difficulties faced in estimating economic growth are a convenient big data set and its high-precision quantitative relation with economic growth. However, there is no literature so far that concurrently solves them. Fortunately, new big data technologies bring novel solution ideas. By collecting near real-time location data of mobile phone users from mobile-phone operators, the dynamic human mobility trajectories can be captured at almost zero cost. Further, weighted human mobility networks in an urban system are constructed and urban centralities are calculated with complex network theory. At last, estimation of economic growth could be achieved by building the quantitative relation of urban centralities and economic growth in a short-term future. In these ways, aforementioned two difficulties can be solved. In order to overcome above challenges using easily-observed human mobility data, this study firstly analyzed and compared the patterns of collective human mobility and economic growth (Section 4). Considering both their homogeneity and heterogeneity, a novel indicator of weighted inter-city human mobility networks was proposed to estimate economic development (Section 5) and its effectiveness were empirically verified (Section 6). The main contributions of this study are:
- The general patterns of collective human mobility and economic growth were analyzed and compared from multiple perspectives, so that the understanding of spatial interactions and economic characteristics of the urban system in our study area were deepened.
- A novel, simple, and effective hybrid indicator deduced from weighted human mobility network was proposed to estimate economic growth. With this indicator, a quantitative bridge between human mobility and economic growth was built.
2. Literature Reviews
To evaluate current economic status or future economic development is a burdensome task. Officially, economic census involving Gross Domestic Product (GDP), industrial structure, employment, residents’ living conditions, and so on, was a persuasive method to comprehensively portray the detailed economic status [31,32]. However, it was usually time-, money-, and labor-consuming because it needed to consider numerous factors for a long time [33]. Moreover, some other indexes, such as Keqian Index [34], Producer Price Index (PPI) [35], Consumer Price Index (CPI) [36], Social Retail Goods (SRG) [37], and Foreign Direct Investment (FDI) [38], characterized economic developments or structures. However, to collect such long-term observed data for these indexes was still arduous.
Under this context, a high-precision, cheap, simple, and near real-time way or index to estimate the economic development trend is urgently needed. In order to cut down the costs, big data techniques were presented to evaluate current economic status. For instance, Liu et al. [39] used online social activities to reflect the economic status of 282 prefecture-level cities in China, and their maximum Spearman’s rank correlation reached 0.8988. Chang et al. [40] found that the correlations (i.e., 0.9052) of online activities with the tertiary industry was larger than the secondary industry (i.e., 0.8688); and much larger than the primary industry (i.e., 0.0482). The strong relation between socio-economic status and physical human mobility were also observed [41,42]. In all, some literatures used human activities to successfully estimate economic status and demonstrated the hidden correlations of human activities and economic developments [41,42].
However, the above works just stayed in the stage of evaluation for current economic status. The goal of this study is more challenging, that is, to achieve a high-precision estimation of economic development. Besides of professional economic and political theories [43,44,45], two categories of limited literatures were presented for this issue in a relatively easy way. One was based on science and technology innovation and the other was about social activities. It was feasible to use science and technology innovations to estimate economic growth because of the close relationships between science and technology inputs (such as the scientific and technical manpower; the expenditures for scientific and technological activities; and the expenditures of research and development) and economic growth had been observed [12,46,47,48,49]. Jokanović et al. [50] estimated the economic development based on different science and technology factors and their best accuracy was 0.58. Zhang et al. [51] observed the mutual influence and promotion relations between the national high-end talent development efficiency and the added values of the primary, secondary, and tertiary industries, but their quantitative correlations were not shown. However, such methods could not achieve high-precision estimation of integral growth and the required data were not easy to collect in a real-time way. Liu et al. [39] used online social activities to show the high correlation with GDP status, but low estimation of future GDP development with about 0.17–0.32 root mean square error (RMSE). These new technologies still cannot produce satisfactory results. This study focuses on using human mobility to estimate economic growth. Existing evidence demonstrates the mutual internal drive relations of human mobility and economic growth. For instance, human mobility could promote Chinese outward FDI [52]; the mobility of high- and low-skilled human resources played different roles relative to up- and downturns in the economy [53]; human mobility is a key research theme for the global spread of knowledge and innovation [54] and innovations could promote economic growth [55]. Thus, our research approach gain supports of theoretical foundation.
As it was well known, influential and potential cities usually have wide-ranging interactions with other cities [56]. Highly developed cities were always the central points in transportation networks [57]. Considering these factors, this study attempted to utilize realistic collective human mobility data to estimate economic development tread. In the complex network theory, node importance evaluates the roles of nodes according to the topological structure and weights, which attracts great attentions. Its functions are similar to our goal. State-of-the-art on node importance of complex network can be classified into five categories, they are based on local structure [58,59,60,61], global structure [62], node location [63,64,65], random walk [58], and transmission dynamics [66], respectively. This study further proposed a simple, efficient, and explainable indicator to estimate economic growth and its accuracy was compared with classical complex network indexes.
3. Study Area, Data, and Denotation
Here, to investigate the latent relationships of human mobility and economic growth, two kinds of persuasive data sources involving both economic development and human mobility are acquired in our study area.
3.1. Study Area and Data Description
Our study area is Guangdong Province (China), in which the Pearl River Delta megalopolis are the leaders of the economic development in south China. The gross domestic product (GDP) of Guangdong in 2017 reached 8000 billion yuan, which was the highest in China. Guangdong Province had been a focus of metropolitan region researching due to its rapid economic growth, active human activity and migration, numerous vibrant innovations, and important national strategies (such as the Guangdong-Hong Kong-Macau Greater Bay Area). About 110 million inhabitants are gathered in this 177,900 square kilometers area.
Twenty one prefecture-level cities are located in Guangdong Province (Figure 1). They are Chaozhou (CZ), Dongguan (DG), Foshan (FS), Guangzhou (GZ), Heyuan (HY), Huizhou (HZ), Jiangmen (JM), Jieyang (JY), Maoming (MM), Meizhou (MZ), Qingyuan (QY), Shantou (ST), Shanwei (SW), Shaoguan (SG), Shenzhen (SZ), Yangjiang (YJ), Yunfu (YF), Zhanjiang (ZJ), Zhaoqing (ZQ), Zhongshan (ZS), and Zhuhai (ZH), respectively, where Guangzhou is the provincial capital and Shenzhen is a Special Economic Zone.
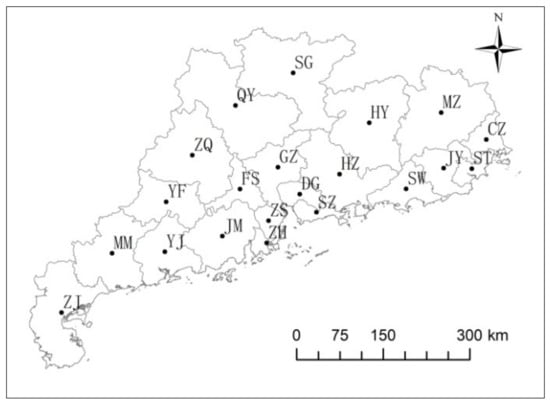
Figure 1.
The prefecture-level cities in Guangdong Province.
3.1.1. Human Mobility Data
Phone cellular signal data were provided by the mobile communication companies. One trip was recorded when one mobile phone user moves from one city to another. Phone users’ cellular signal data in the study area were collected from 11th February to 14th March 2017. Over 510 million mobility records in total were thus obtained.
3.1.2. Economic Data
GDP is an important indicator to represent the global economy status of a city or country. The date of phone cellular signaling data is at the beginning of 2017. As our goal is to estimate economic growth using phone cellular signal data, economic data should describe the economic change during 2017. To match phone cellular signal data, the GDPs and growth rates of the above 21 municipalities used in this study were surveyed by the corresponding official statistics institute in 2017 [67]. In more detail, the GDPs and growth rates for the primary, secondary, and tertiary industries were also known.
3.2. Denotation and Definition
3.2.1. Weighted Human Mobility Network
With the above cellular signal data, a weighted human mobility network is constructed, which is a fully connected directed network with 21 nodes and links. Let be the human mobility network, where is the node set (i.e., the set of prefecture-level city), is the link set (i.e., the connection between cities), be the link weight (i.e., human mobility volume from city i to j), if . Each directed link weight equals the average counting number of travel trips for one day. As shown in Figure 2, all cities in the study area are connected by human travels.
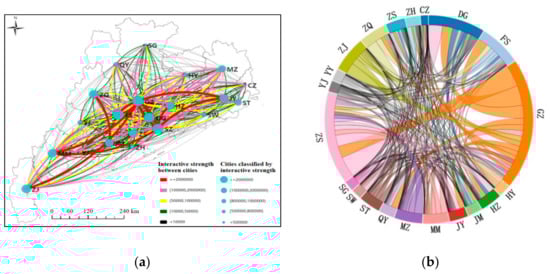
Figure 2.
Human mobility network: (a) topological structure; (b) chordal graph of topological structure.
Let be the overall interaction strengths of city i with all other cities. implies a city’s aggregated attraction. Furthermore, the integrative attraction ratio is defined to describe the relative attraction of city i.
Let , , , and be the total GDP, partial GDPs of the primary, secondary, and tertiary industries of city i in the year of x; correspondingly, the value-added of total GDP, partial GDPs of the primary, secondary, and tertiary industries are , , , and , respectively. As this study considers the economic growth only in 2017, let , , , and be , , , and for convenience.
3.2.2. Rank Order
Here, we use the rank order to directly see how a variable set change. Given a set of data , then is ranked into a descending sequence , where if . If the rank number of city is , then . Let an ascending sequence and be the values of horizontal and vertical axis, respectively, their scatter plots are used to check the change trend of variable set Y.
3.2.3. Spatial Distribution
Given a variable set for a specified city set with geographic area , the spatial distributions can be intuitively observed from the map. Firstly, the nature break method is used to classify into several categories; each category is given a unique color; then, the aggregation effect of variable set is shown according to the color. The more similar the colors in close geographical areas are, the stronger the aggregation effect would be and vice versa.
3.2.4. Correlation Analysis
In order to test the ability of human mobility to estimate economic growth in the later pages, two variable sets and will be compared, where and are calculated independently from human mobility and economic growth data, respectively. The correlation of and is analyzed under the fixed fitting function . First, and are normalized into , ; then, the scatter plots of and are shown in a coordinate plane; at last, their Pearson correlation coefficient r and root mean square error (RMSE) are calculated to evaluate the accuracy:
where ; .
In this study, we use the fixed function , rather than the best fitting function, to measure the precision of human mobility indicator to estimate the economic growth. The reason lies in that we want to analyze the consistency of the normalized human mobility indicator and economic growth for a given city among the whole study area.
4. Patterns of Collective Human Mobility and Economic Growth
In this section, the spatial distribution and rank order of human mobility and economic growth are analyzed and compared at a collective level. Furthermore, the similarities and differences of their general laws are discussed. Based on these findings, quantifying the correlations of human mobility and economic growth becomes feasible.
4.1. Spatial Distribution
Different from many other literatures that have focused on the individual human mobility-related indicators (such as travel distance, travel time, radius of gyration, and movement entropy, etc.) [68], this study concentrated on the patterns of inter-city interaction intensity (i.e., the link weights in human mobility networks) at a collective level. In complex network theory, is a convincing indicator of node importance. Here, is tentatively treated as a city’s status in human mobility networks to test the spatial distribution of cities’ interaction intensity. As shown in Figure 3, we can intuitively observe that the main centers of human mobility are clustered. In other words, people always trend to visit limited specific geographical spaces. This is also consistent with the common sense.
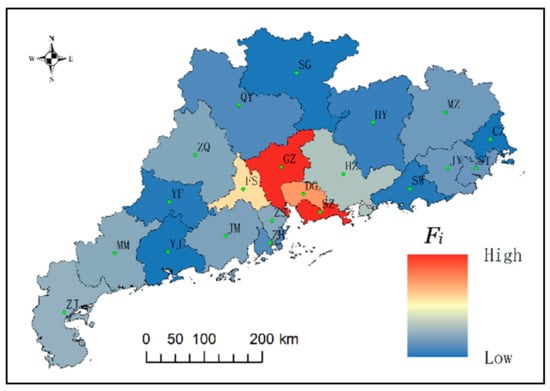
Figure 3.
The spatial distribution of human mobility intensity.
As different industries require different amounts of participants, the economic development is measured by total GDP, the primary, secondary, and tertiary industries, respectively, to amply understand the patterns of cities’ economic growths. The spatial distributions of value-added of total GDP, the primary, secondary, and tertiary industries are shown in Figure 4, respectively.
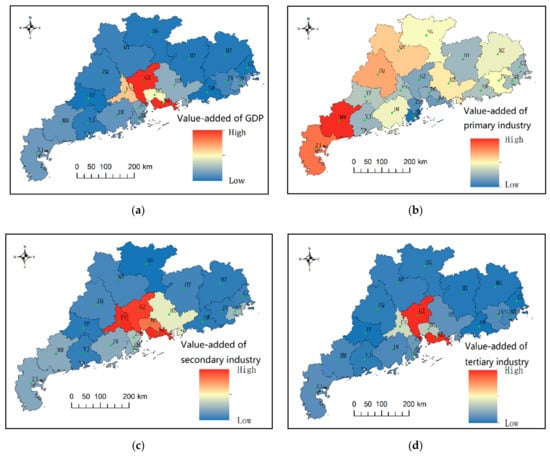
Figure 4.
The spatial distributions of cities’ economic growth: (a) Value-added of total gross domestic product (GDP); (b) Value-added of the primary industry; (c) Value-added of the secondary industry; (d) Value-added of the tertiary industry.
High spatial aggregation effects of economic growth for total GDP, the secondary, and tertiary industries are demonstrated. Most booming cities were intensively distributed in the Pearl River Delta. These characteristics are consistent with above human mobility intensity. However, the spatial distribution of the primary industry is decentralized, which seems to be opposite from other scenarios.
4.2. Rank Order
There are links in the human mobility network (as shown in Figure 2a), and the link weights refer to the mobility intensity between cities. The heterogeneity (or homogeneity) of these weights implies the preference of mobility: for a given city, if it coequally interacts with other cities, no preference exists; vice versa. In order to explore the patterns of mobility intensity, all individual weights in the overall network, the individual weights in partial network connected to only one specific city (such as Shenzhen), and the cities’ integrative weight are analyzed.
From the results in Figure 5, it can be concluded that the heterogeneities of human mobility intensity are conspicuous. Human moves frequently between extremely limited pairs of cities; while most pairs of cities have weak interactions. In terms of individual cities, the vast majority of human mobility is contributed to several particular cities. The individual intensity of both overall human mobility network and the partial network connected to a given city follow approximately power-law distributions (Figure 5a,b). Obvious heterogeneities of human mobility for various pairs of cities are observed. Moreover, Figure 5c shows a significant power-law distribution of cities’ integrative human mobility volumes. That indicates the heterogeneity of mobility intensity for different individual cities are also huge: most human mobility is related to only few cities. The mobility intensities within top four cities are more than all other cities.
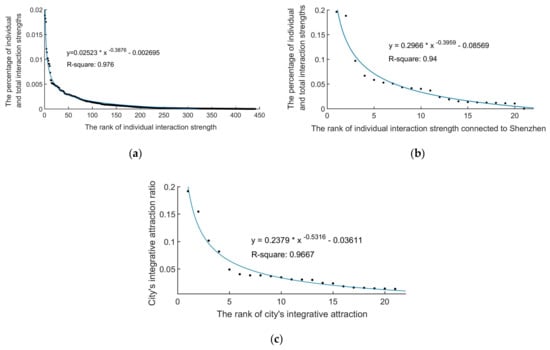
Figure 5.
The rank order of link weights: (a) individual weights in the overall network, where satisfies ; (b) individual weights in partial network connected to Shenzhen, where satisfies i is the fixed index of Shenzhen, and n is the number of cities in study area; (c) the cities’ integrative weight .
In terms of the pure values of economic growth without the geographical adjacency relations, high heterogeneities of economic growth are observed in total GDP, partial GDPs of the secondary, and tertiary industries, as shown in Figure 6. All their values-added in the descending order follow exponential functions. But, the values-added of the primary industry follow a cubic function. As for total GDP, partial GDPs of the secondary and tertiary industries, most cities’ economic growth proportions are small; while several booming cities present high economic growth proportions. A small number of top hub cities dominate the vast majority of economic growth. Furthermore, the heterogeneity degree of the tertiary industry is stronger than the secondary industry, and much stronger than total GDP.
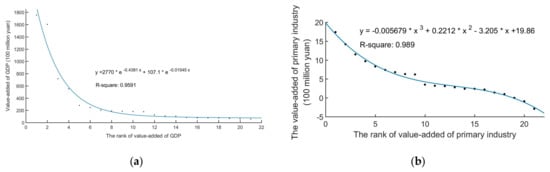
Figure 6.
The rank order of cities’ economic growth: (a) Value-added of total GDP; (b) Value-added of the primary industry; (c) Value-added of the secondary industry; (d) Value-added of the tertiary industry.
4.3. Comparison
From the above, we found that both the total interaction volumes of individual cities and individual interactions between an arbitrary pair of cities follow power-law distributions. This reveals that on one hand, attractive cities can more easily interact with other cities; on the other hand, the interaction volumes of a pair of cities are determined by the integrated attractions of two cities. As for economic developments, we found that cities’ developments are highly inconsistent and booming cities usually gather together. Hub cities tend to have a much higher economic growth proportion. From these findings, we can clearly feel that preponderant cities are easier to expand their preponderances. Specifically speaking, above findings presented both similarities and differences of general laws for human mobility and economic growth:
- (1)
- Similarity
Two similarities of the patterns for human mobility and economic growth were observed from above experiments:
Similarity-I: One common tread is that the minority dominates major advantages and the majority shares a few benefits. Figure 5 demonstrated that 20% top individual cities make over 50% of the contributions to the total mobility volumes. Likewise, the top 20% cities are responsible for over 50% of the total GDP economic growth, partial GDPs of the secondary and tertiary industries, as shown in Figure 6. It is easy to observe the high heterogeneities of both human mobility and economic growth.
Similarity-II: The other common tread is the aggregation effect. On one hand, Figure 5 showed that the individual link weights of each pair of cities are highly inequitable. Furthermore, for a given city i, its mobility volumes with other cities were show trends. Combing these with Figure 2 which considers spatial location, it can be concluded that cities in some ways are inclined to interact with several certain charismatic cities. As a result, the human mobility is clustered, as shown in Figure 3; on the other hand, Figure 4 also demonstrated the aggregation effect of economic growth in the geographic space. Moreover, these clustered and highly booming cities are coincident with those cities in the human mobility network.
- (2)
- Difference
The heterogeneity degrees of human mobility and economic growth are different. The human mobility intensities are more like to follow power-law distributions; while the economic growth are exponential laws. Even though aforementioned two similarities evidently allude to the strong correlations between them, previous onefold mobility indicator [69] cannot accurately estimate economic growth. Take as an example, its correlations with the economic growths of total GDP, partial GDPs of the primary, secondary, and tertiary industries are 0.8535, −1.505, 0.7321, and 0.7814 respectively when using the fixed function to measure their correlations, as shown Figure 7. Even though these correlation coefficients are acceptable (except for the primary industry), there is still huge room to improve. Moreover, their trends are not consistent (one is power-laws and the other is exponential laws). Thus, it is necessary to integrate multifold indicators to model the relation of human mobility and economic growth.
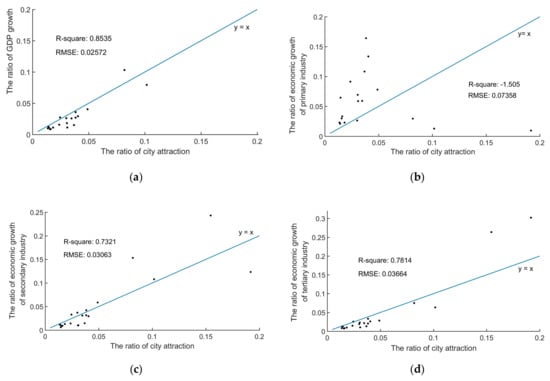
Figure 7.
The correlation of city attraction and economic growth: (a) total GDP; (b) the primary industry; (c) the secondary industry; (d) the tertiary industry, where RMSE is root mean square error.
5. Quantitative Relation between Economic Growth and Human Mobility
Based on above findings, we’d like to build a bridge between human mobility and economic growth by proposing a hybrid indicator of human mobility in this section.
5.1. Novel Hybrid Indicator
Considering the two aforementioned similarities, it can be concluded that economic growth is strongly correlated to two factors. One is the cities’ overall attraction, which is deduced from Similarity-I (i.e., the high inequity of interaction volume); the other one is the mobility volumes with top hub cities, which is deduced from Similarity-II (i.e., the aggregation effect). In order to quantify these similarities, we propose a novel hybrid human mobility indicator () to describe its relation with economic growth. is defined as:
where, and represent the aforementioned human mobility volumes of city i with all and top hub cities, respectively; is an undetermined parameter, which differentiates the contributions of and ; is also an undetermined parameter, which denotes the number of top hub cities.
In order to determine parameters and , the values of economic growth and are normalized (as shown in Table 1) at first, and then various experiments are done to test how and affect the ability of in estimating economic growths. The best correlation coefficients of normalized economic growth and under the fixed function are treated as the estimation accuracy.

Table 1.
The correlation coefficients of human mobility and economic growth under explicitly quantitative formulas, where GDP is gross domestic product and is the proposed hybrid human mobility indicator.
By parameter calibration in Table 1 and Figure 8, the best correlations of normalized and economic growth of total GDP, partial GDPs of the secondary and tertiary industries reach up to 0.945, 0.75, and 0.9534, respectively. Such results are satisfactory and even beyond expectations. Two conclusions are demonstrated:
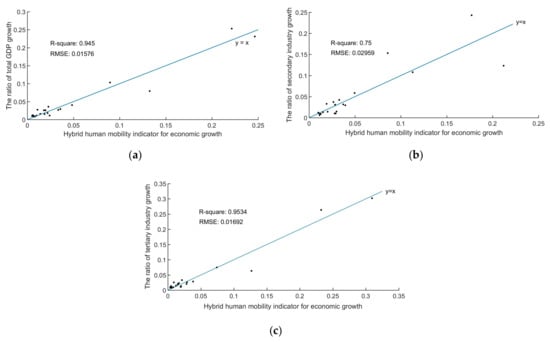
Figure 8.
The best correlation coefficients of normalized economic growth and under the fixed fitting function : (a) total GDP; (b) the secondary industry; (c) the tertiary industry, is the proposed hybrid human mobility indicator.
- (1)
- Human mobility is more relevant to the tertiary industry than to the secondary industry, and much more relevant than to the primary industry (the correlation coefficients of and partial GDP growth of the primary industry are negative). This coincides with the common senses and we quantitatively verify this by empirical data.
- (2)
- By further considering the effect of interaction strengths with top hub cities, the correlation coefficients are improved a lot. This further shows that the economic growth of GDP (especially for the tertiary industry) is related not only to its own strength, but also to the cooperation with hub cities.
In sum, the bridges between human mobility and economic growth are built by quantitative formulas, as shown in Table 1. Exceedingly high-precision correlations between them have been observed, especially for the tertiary industry.
5.2. Comparison
To further validate the superiority of , we compare its estimation ability of economic development with other classical complex network indicators. Here, four more prestigious, but different theoretical approaches are used to calculate contrastive indicators in complex network theory. They are authority score [70], eigenvector centrality [71], hub score [70], and Page rank [72] algorithms, respectively.
Figure 9 and Table 2 demonstrate that the abilities of classical complex network indicators to estimate economic growth are not better than . In terms of physical significances, treats all individual human mobility equally and it thinks arbitrary inter-city interaction makes a same contribution to the economic growth, while, all other indicators, including our proposed , assign relative scores to cities based on the principle that the connections to high-scoring cities contribute more score to the cities. However, these algorithms have different calculation methods. From the experimental results, undoubtedly has the best estimation ability.
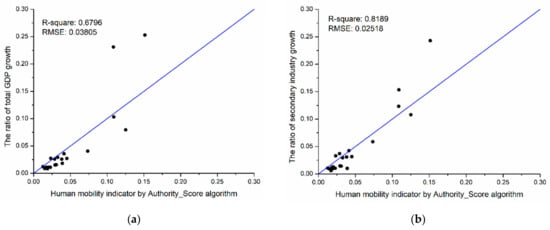
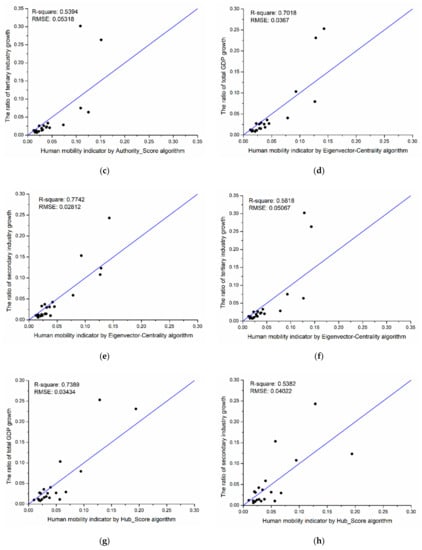
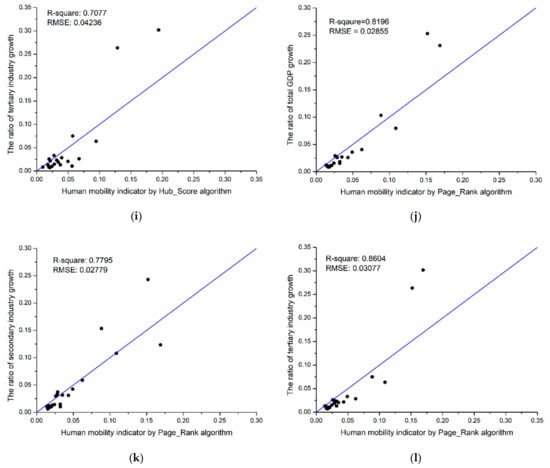
Figure 9.
The correlation coefficients of normalized economic growth and complex network indicators under the fixed fitting function : (a) Authority score versus total GDP; (b) Authority score versus the secondary industry; (c) Authority score versus the tertiary industry; (d) Eigenvector centrality versus total GDP; (e) Eigenvector centrality versus the secondary industry; (f) Eigenvector centrality versus the tertiary industry; (g) Hub score versus total GDP; (h) Hub score versus the secondary industry; (i) Hub score versus the tertiary industry; (j) Page rank versus total GDP; (k) Page rank versus the secondary industry; (l) Page rank versus the tertiary industry.
Table 2.
The correlation coefficients of economic growth and node centrality in weighted human mobility networks.
Thus, it can be deduced that interactions with hub cities usually make more contributions to cities’ economic growths. For a hub city i, it is easier to interact with other cities because it has a relatively larger population and advantages in job opportunity, cooperation, and innovation; on the other hand, predominant geological location, convenient transportation, and great hunger for communication facilitate the human mobility of city i to other hub cities. Human mobility promotes innovation and improves economic development; in reverse, excellent economic conditions attract more human aggregation, mobility, and communication; these two factors interact with each other.
6. Conclusions
This study first analyzed the patterns of collective human mobility and economic development, experiments demonstrated: (1) aggregation effects of both human mobility and economic growth; (2) power-law distributions of the total interaction volumes for individual cities; (3) power-law distributions of the descending individual interactions between an arbitrary pair of cities; (4) exponential-law distributions of the descending economic growths. Then, two similarities and one difference between the patterns of human mobility and economic growth were observed. The similarities lied in that: (i) aggregation effects existed for both human mobility and economic growth; (ii) the minority dominated major advantages and the majority shared a few benefits. The difference was their heterogeneity degrees. Subsequently, based on these findings, their quantitative relations were determined. Hybrid human mobility indicators , and were proposed to estimate the economic growths of total GDP, partial GDPs of the secondary and tertiary industries, respectively. Correspondingly, their accuracies were 0.945, 0.75, and 0.9543. These results suggested that cities’ economic growths are related to their interaction volumes with all other cities, especially with top hub cities. On one hand, human mobility more easily happened to rich cities; on the other hand, interaction strengths among rich cities were relatively stronger.
Though uncovering the similarities and differences of the patterns of collective human mobility and economic development, quantitative relations between human mobility and economic growth were given. The experiments demonstrated the exceedingly high correlations between them. These contributions were mainly due to two aspects: (1) high-quality phone cellular signal data typically and quantitatively depicts human mobility better than other human mobility data, such as online check-ins [39]; (2) an effective hybrid indicator built a solid bridge between them. Further considering the hub-club effect, the hybrid indicators proposed in this study greatly improve the precision of estimating economic growth, compared with other traditional indicators.
To monitor human mobility is easy, cheap, and real-time, so it is possible to estimate short-term future trends of economic development with the hybrid indicators proposed in this study. By observing dynamic human mobility and estimating economic change after new policies are implemented, policy-makers can evaluate the effectiveness of policies for economic development. However, parameters and might be different in different cases. Even though numerous experiments were conducted with quite convincing data sets, the universality of this study’s contributions was still limited. Owing to the inaccessibility of data sets at present, especially for different study areas and scales, single data source cannot confirm the generality of parameters and . In the future, long-term (over several years) and full-scale observed data will be further collected and analyzed to mine deeper and more microscopic relations of human mobility and economics. More empirical instances will be tested, compared, and summarized in various study areas and scales.
Author Contributions
Conceptualization, J.J.; Data curation, W.T.; Investigation, J.C.; Project administration, J.C., J.J. and C.W.; Writing—original draft, J.J. and W.T.; Writing—review and editing, C.W.
Funding
This research was jointly funded by the Supported by the Strategic Priority Research Program of the Chinese Academy of Sciences (Grant Number XDA19030301); National Natural Science Foundation of China (Grant Number 41701452); Shenzhen Scientific Research and Development Funding Program (Grant Numbers KQJSCX20180328093453763 and JCYJ20180305125101282).
Acknowledgments
We are grateful to the colleagues Profs. Yang Yue and Qingquan Li from Shenzhen University for assistance with data support.
Conflicts of Interest
On behalf of all authors, the corresponding author states that there is no conflict of interest.
References
- Feiock, R.C. (Ed.) Metropolitan Governance: Conflict, Competition, and Cooperation; Georgetown University Press: Washington, DC, USA, 2004. [Google Scholar]
- Douglass, M. From global intercity competition to cooperation for livable cities and economic resilience in Pacific Asia. Environ. Urban. 2002, 14, 53–68. [Google Scholar] [CrossRef]
- Goetz, E.G.; Kayser, T. Competition and cooperation in economic development: A study of the Twin Cities metropolitan area. Econ. Dev. Q. 1993, 7, 63–78. [Google Scholar] [CrossRef]
- Claessens, S.; Dell’Ariccia, G.; Igan, D.; Laeven, L. Cross-country experiences and policy implications from the global financial crisis. Econ. Policy 2010, 25, 267–293. [Google Scholar] [CrossRef]
- Baker, S.R.; Bloom, N.; Davis, S.J. Measuring economic policy uncertainty. Q. J. Econ. 2016, 131, 1593–1636. [Google Scholar] [CrossRef]
- Callan, P.M. Coping with Recession: Public Policy, Economic Downturns and Higher Education; The National Center for Public Policy and Higher Education: San Jose, CA, USA, 2002. [Google Scholar]
- González-Mejía, A.M.; Eason, T.N.; Cabezas, H.; Suidan, M.T. Social and economic sustainability of urban systems: Comparative analysis of metropolitan statistical areas in Ohio, USA. Sustain. Sci. 2014, 9, 217–228. [Google Scholar] [CrossRef]
- Choi, H.; Varian, H. Predicting the present with Google Trends. Econ. Rec. 2012, 88, 2–9. [Google Scholar] [CrossRef]
- Wang, W.; Rothschild, D.; Goel, S.; Gelman, A. Forecasting elections with non-representative polls. Int. J. Forecast. 2015, 31, 980–991. [Google Scholar] [CrossRef]
- Eagle, N.; Macy, M.; Claxton, R. Network diversity and economic development. Science 2010, 328, 1029–1031. [Google Scholar] [CrossRef] [PubMed]
- Pappalardo, L.; Vanhoof, M.; Gabrielli, L.; Smoreda, Z.; Pedreschi, D.; Giannotti, F. Estimating Economic Development with Mobile Phone Data. Available online: http://www.cisstat.com/BigData/CIS-BigData_08_Eng%20%20IT%20Luca%20Pappalardo%20Et%20Al%20Estimating%20Economic%20Development.pdf (accessed on 30 May 2016).
- Wang, D.; Pedreschi, D.; Song, C.; Giannotti, F.; Barabasi, A.L. Human mobility, social ties, and link prediction. In Proceedings of the 17th ACM SIGKDD International Conference on Knowledge Discovery and Data Mining, San Diego, CA, USA, 21–24 August 2011; ACM: New York, NY, USA, 2011; pp. 1100–1108. [Google Scholar]
- Filatotchev, I.; Liu, X.; Lu, J.; Wright, M. Knowledge spillovers through human mobility across national borders: Evidence from Zhongguancun Science Park in China. Res. Policy 2011, 40, 453–462. [Google Scholar] [CrossRef]
- Archer, M.S. Making Our Way through the World: Human Reflexivity and Social Mobility; Cambridge University Press: Cambridge, UK, 2007. [Google Scholar]
- Fagiolo, G.; Santoni, G. Human-mobility networks, country income, and labor productivity. Netw. Sci. 2015, 3, 377–407. [Google Scholar] [CrossRef]
- Timme, M.; Kocarev, L.; Witthaut, D. Focus on networks, energy and the economy. New J. Phys. 2015, 17, 110201. [Google Scholar] [CrossRef]
- Mantegna, R.N.; Kertész, J. Focus on statistical physics modeling in economics and finance. New J. Phys. 2011, 13, 025011. [Google Scholar] [CrossRef]
- Zhang, Z.; Wang, M.; Xu, H.; Zhang, W.; Tian, L. Research on the co-movement between high-end talent and economic growth: A complex network approach. Phys. A Stat. Mech. Appl. 2018, 492, 1216–1225. [Google Scholar] [CrossRef]
- Yang, X.; Zhao, Z.; Lu, S. Exploring spatial-temporal patterns of urban human mobility hotspots. Sustainability 2016, 8, 674. [Google Scholar] [CrossRef]
- Levy, M. Scale-free human migration and the geography of social networks. Phys. A Stat. Mech. Appl. 2010, 389, 4913–4917. [Google Scholar] [CrossRef]
- Barbosa, H.; Barthelemy, M.; Ghoshal, G.; James, C.R.; Lenormand, M.; Louail, T.; Menezes, R.; Ramasco, J.J.; Simini, M.; Tomasini, M. Human mobility: Models and applications. Phys. Rep. 2018, 734, 1–74. [Google Scholar] [CrossRef]
- Song, C.; Qu, Z.; Blumm, N.; Barabási, A.L. Limits of predictability in human mobility. Science 2010, 327, 1018–1021. [Google Scholar] [CrossRef] [PubMed]
- Gonzalez, M.C.; Hidalgo, C.A.; Barabasi, A.L. Understanding individual human mobility patterns. Nature 2008, 453, 779. [Google Scholar] [CrossRef] [PubMed]
- Yan, X.Y.; Wang, W.X.; Gao, Z.Y.; Lai, Y.C. Universal model of individual and population mobility on diverse spatial scales. Nat. Commun. 2017, 8, 1639. [Google Scholar] [CrossRef] [PubMed]
- Mudda, S.; Giordano, S. Regula: Utilizing the regularity of human mobility for location recommendation. In Proceedings of the 6th ACM SIGSPATIAL International Workshop on GeoStreaming, Bellevue, WA, USA, 3–6 November 2015; ACM: New York, NY, USA, 2015; pp. 69–77. [Google Scholar]
- Becker, R.A.; Caceres, R.; Hanson, K.; Loh, J.M.; Urbanek, S.; Varshavsky, A.; Volinsky, C. A tale of one city: Using cellular network data for urban planning. IEEE Pervasive Comput. 2011, 10, 18–26. [Google Scholar] [CrossRef]
- Castro, P.S.; Zhang, D.; Li, S. Urban traffic modelling and prediction using large scale taxi GPS traces. In International Conference on Pervasive Computing; Springer: Berlin/Heidelberg, Germany, 2012; pp. 57–72. [Google Scholar]
- Wu, M.; Han, S.; Sun, M.; Han, D. How the distance between regional and human mobility behavior affect the epidemic spreading. Phys. A Stat. Mech. Appl. 2018, 492, 1823–1830. [Google Scholar] [CrossRef]
- Colizza, V.; Barrat, A.; Barthélemy, M.; Vespignani, A. Predictability and epidemic pathways in global outbreaks of infectious diseases: The SARS case study. BMC Med. 2007, 5, 34. [Google Scholar] [CrossRef] [PubMed]
- Riascos, A.P.; Mateos, J.L. Emergence of encounter networks due to human mobility. PLoS ONE 2017, 12, e0184532. [Google Scholar] [CrossRef] [PubMed]
- Sun, Y.; Du, D. Determinants of industrial innovation in China: Evidence from its recent economic census. Technovation 2010, 30, 540–550. [Google Scholar] [CrossRef]
- Zhong, W.; Yuan, W.; Li, S.X.; Huang, Z. The performance evaluation of regional R&D investments in China: An application of DEA based on the first official China economic census data. Omega 2011, 39, 447–455. [Google Scholar]
- OECD. Gross Domestic Product (GDP). 2001. Available online: http://stats.oecd.org/glossary/detail.asp?ID=1163 (accessed on 10 August 2014).
- Economist, Keqiang Ker-Ching: How China’s Next Prime Minister Keeps Tabs on Its Economy. 2012. Available online: http://www.economist.com/node/17681868 (accessed on 20 August 2014).
- Von der Lippe, P.M. Index Theory and Price Statistics; Peter Lang GmbH: Frankfurt am Main, Germany, 2007. [Google Scholar]
- Shapiro, M.D.; Wilcox, D.W. Mismeasurement in the consumer price index: An evaluation. NBER Macroecon. Ann. 1996, 11, 93–142. [Google Scholar] [CrossRef]
- Schott, R. Social Retail: Finding, Engaging & Cultivating Today’s Connected Consumer. 2016. Available online: http://searchenginewatch.com/article/2192745/Social-Retail-Finding-Engaging-Cultiv-ating-TodaysConnected-Consumer# (accessed on 8 August 2016).
- Borensztein, E.; De Gregorio, J.; Lee, J.W. How does foreign direct investment affect economic growth? J. Int. Econ. 1998, 45, 115–135. [Google Scholar] [CrossRef]
- Liu, J.H.; Wang, J.; Shao, J.; Zhou, T. Online social activity reflects economic status. Phys. A Stat. Mech. Appl. 2016, 457, 581–589. [Google Scholar] [CrossRef]
- Xiaomeng, C.; Guozhen, L.; Yang, Y.; Qingquan, L. Estimating the distribution of economy activity: A case study in Jiangsu Province (China) using large scale social network data. In Proceedings of the 2014 IEEE International Conference on Data Mining Workshop, Shenzhen, China, 14 December 2014; pp. 1126–1134. [Google Scholar]
- Frias-Martinez, V.; Virseda-Jerez, J.; Frias-Martinez, E. On the relation between socio-economic status and physical mobility. Inf. Technol. Dev. 2012, 18, 91–106. [Google Scholar] [CrossRef]
- Pappalardo, L.; Pedreschi, D.; Smoreda, Z.; Giannotti, F. Using big data to study the link between human mobility and socio-economic development. In Proceedings of the 2015 IEEE International Conference on Big Data (Big Data), Santa Clara, CA, USA, 29 October–1 November 2015; pp. 871–878. [Google Scholar]
- Lucas, R.E., Jr. On the mechanics of economic development. J. Monet. Econ. 1988, 22, 3–42. [Google Scholar] [CrossRef]
- Malecki, E.J. Technology and Economic Development: The Dynamics of Local, Regional and National Competitiveness; Longman Pub Group: London, UK, 1997. [Google Scholar]
- Weingast, B.R. The economic role of political institutions: Market-preserving federalism and economic development. J. Law Econ. Organ. 1995, 11, 1–31. [Google Scholar]
- Schwarzkopf, D.L. Identifying peer states to assess technology-based economic development. Technol. Soc. 2014, 39, 68–76. [Google Scholar] [CrossRef]
- Kolbachev, E.; Kolbacheva, T.; Salnikova, Y. Application of natural science and engineering methods as a trend in the development of economic and management research and education. Procedia Soc. Behav. Sci. 2015, 214, 1000–1007. [Google Scholar] [CrossRef]
- Mashelkar, R.A. Impact of science, technology and innovation on the economic and political power. AI Soc. 2017, 32, 243–251. [Google Scholar] [CrossRef]
- Fan, P. Innovation capacity and economic development: China and India. Econ. Chang. Restruct. 2011, 44, 49–73. [Google Scholar] [CrossRef]
- Jokanović, B.; Lalic, B.; Milovančević, M.; Simeunović, N.; Marković, D. Economic development evaluation based on science and patents. Phys. A Stat. Mech. Appl. 2017, 481, 141–145. [Google Scholar] [CrossRef]
- Zhang, H.T.; Zhu, T.; Fu, D.; Xu, B.; Han, X.P.; Chen, D. Spatiotemporal property and predictability of large-scale human mobility. Phys. A Stat. Mech. Appl. 2018, 495, 40–48. [Google Scholar] [CrossRef]
- Gao, L.; Liu, X.; Zou, H. The role of human mobility in promoting Chinese outward FDI: A neglected factor? Int. Bus. Rev. 2013, 22, 437–449. [Google Scholar] [CrossRef]
- Smith, K.H. Human Resources, Mobility and the Systems Approach to Innovation; Organisation of Economic Co-Operation and Development: Paris, France, 2001. [Google Scholar]
- Montanari, A. Cross-national co-operation and human mobility: An introduction. Int. Rev. Sociol. 2012, 22, 175–190. [Google Scholar]
- Greenhalgh, C.; Rogers, M. Innovation, Intellectual Property, and Economic Growth; Princeton University Press: Princeton, NJ, USA, 2010. [Google Scholar]
- Taylor, P.J.; Derudder, B. World City Network: A Global Urban Analysis; Routledge: London, UK, 2015. [Google Scholar]
- Guimera, R.; Mossa, S.; Turtschi, A.; Amaral, L.N. The worldwide air transportation network: Anomalous centrality, community structure, and cities’ global roles. Proc. Natl. Acad. Sci. USA 2005, 102, 7794–7799. [Google Scholar] [CrossRef] [PubMed]
- Newman, M.E. A measure of betweenness centrality based on random walks. Soc. Netw. 2005, 27, 39–54. [Google Scholar] [CrossRef]
- Chen, D.; Lü, L.; Shang, M.S.; Zhang, Y.C.; Zhou, T. Identifying influential nodes in complex networks. Phys. A Stat. Mech. Appl. 2012, 391, 1777–1787. [Google Scholar] [CrossRef]
- Centola, D. The spread of behavior in an online social network experiment. Science 2010, 329, 1194–1197. [Google Scholar] [CrossRef] [PubMed]
- Ugander, J.; Backstrom, L.; Marlow, C.; Kleinberg, J. Structural diversity in social contagion. Proc. Natl. Acad. Sci. USA 2012, 109, 5962–5966. [Google Scholar] [CrossRef] [PubMed]
- Gao, C.; Wei, D.; Hu, Y.; Mahadevan, S.; Deng, Y. A modified evidential methodology of identifying influential nodes in weighted networks. Phys. A Stat. Mech. Appl. 2013, 392, 5490–5500. [Google Scholar] [CrossRef]
- Kitsak, M.; Gallos, L.K.; Havlin, S.; Liljeros, F.; Muchnik, L.; Stanley, H.E.; Makse, H.A. Identification of influential spreaders in complex networks. Nat. Phys. 2010, 6, 888. [Google Scholar] [CrossRef]
- Dorogovtsev, S.N.; Goltsev, A.V.; Mendes, J.F.F. K-core organization of complex networks. Phys. Rev. Lett. 2006, 96, 040601. [Google Scholar] [CrossRef] [PubMed]
- Carmi, S.; Havlin, S.; Kirkpatrick, S.; Shavitt, Y.; Shir, E. A model of Internet topology using k-shell decomposition. Proc. Natl. Acad. Sci. USA 2007, 104, 11150–11154. [Google Scholar] [CrossRef] [PubMed]
- Restrepo, J.G.; Ott, E.; Hunt, B.R. Characterizing the dynamical importance of network nodes and links. Phys. Rev. Lett. 2006, 97, 094102. [Google Scholar] [CrossRef] [PubMed]
- Bureau, G.S. Guangdong Statistics Yearbook 2017; Statistics Press: Beijing, China, 2017. [Google Scholar]
- Jiang, J.; Li, Q.; Tu, W.; Shaw, S.L.; Yue, Y. A simple and direct method to analyse the influences of sampling fractions on modelling intra-city human mobility. Int. J. Geogr. Inf. Sci. 2019, 33, 618–644. [Google Scholar] [CrossRef]
- Lü, L.; Chen, D.; Ren, X.L.; Zhang, Q.M.; Zhang, Y.C.; Zhou, T. Vital nodes identification in complex networks. Phys. Rep. 2016, 650, 1–63. [Google Scholar] [CrossRef]
- Kleinberg, J.M. Authoritative sources in a hyperlinked environment. J. ACM (JACM) 1999, 46, 604–632. [Google Scholar] [CrossRef]
- Hotelling, H. Simplified calculation of principal components. Psychometrika 1936, 1, 27–35. [Google Scholar] [CrossRef]
- Brin, S.; Page, L. The anatomy of a large-scale hypertextual web search engine. Comput. Netw. ISDN Syst. 1998, 30, 107–117. [Google Scholar] [CrossRef]


© 2019 by the authors. Licensee MDPI, Basel, Switzerland. This article is an open access article distributed under the terms and conditions of the Creative Commons Attribution (CC BY) license (http://creativecommons.org/licenses/by/4.0/).