Figure 1.
Climate zoning based on winter climate severity and summer climate severity according to the Spanish Technical Building Code [
52]. Source: drawn up by the authors.
Figure 1.
Climate zoning based on winter climate severity and summer climate severity according to the Spanish Technical Building Code [
52]. Source: drawn up by the authors.
Figure 2.
Frequency histogram of calculated non-renewable primary energy consumption [kWhp/m2·year] for office blocks and offices in industrial buildings. Source: drawn up by the authors using data from the ICAEN database, July 2018.
Figure 2.
Frequency histogram of calculated non-renewable primary energy consumption [kWhp/m2·year] for office blocks and offices in industrial buildings. Source: drawn up by the authors using data from the ICAEN database, July 2018.
Figure 3.
Frequency histogram of calculated non-renewable primary energy consumption [kWhp/m2·year] for offices in residential buildings. Source: drawn up by the authors using data from the ICAEN database, July 2018.
Figure 3.
Frequency histogram of calculated non-renewable primary energy consumption [kWhp/m2·year] for offices in residential buildings. Source: drawn up by the authors using data from the ICAEN database, July 2018.
Figure 4.
Box-and-whisker plot diagram for calculated non-renewable primary energy consumption [kWhp/m2·year] by office type. Source: drawn up by the authors using data from the ICAEN database, July 2018.
Figure 4.
Box-and-whisker plot diagram for calculated non-renewable primary energy consumption [kWhp/m2·year] by office type. Source: drawn up by the authors using data from the ICAEN database, July 2018.
Figure 5.
Number of energy performance certificates of office blocks and offices in industrial buildings according to the energy rating. Source: drawn up by the authors using data from the ICAEN database, July 2018.
Figure 5.
Number of energy performance certificates of office blocks and offices in industrial buildings according to the energy rating. Source: drawn up by the authors using data from the ICAEN database, July 2018.
Figure 6.
Number of energy performance certificates of offices in residential buildings according to energy rating. Source: drawn up by the authors using data from the ICAEN database, July 2018.
Figure 6.
Number of energy performance certificates of offices in residential buildings according to energy rating. Source: drawn up by the authors using data from the ICAEN database, July 2018.
Figure 7.
Breakdown of average calculated non-renewable primary energy consumption [kWhp/m2·year] according to the office type and end-uses. Source: drawn up by the authors using data from the ICAEN database, July 2018.
Figure 7.
Breakdown of average calculated non-renewable primary energy consumption [kWhp/m2·year] according to the office type and end-uses. Source: drawn up by the authors using data from the ICAEN database, July 2018.
Figure 8.
Average calculated non-renewable primary energy consumption [kWhp/m2·year] by office type and construction period. Source: drawn up by the authors using data from the ICAEN database, July 2018.
Figure 8.
Average calculated non-renewable primary energy consumption [kWhp/m2·year] by office type and construction period. Source: drawn up by the authors using data from the ICAEN database, July 2018.
Figure 9.
On the left, energy label of office blocks and offices in industrial buildings according to the construction period. On the right, share of energy performance certificates for office blocks and offices in industrial buildings according to construction period. Source: drawn up by the authors using data from the ICAEN database, July 2018.
Figure 10.
On the left, energy label of offices in residential buildings by construction period. On the right, share of energy performance certificates for offices in residential buildings according to construction period. Source: drawn up by the authors using data from the ICAEN database, July 2018.
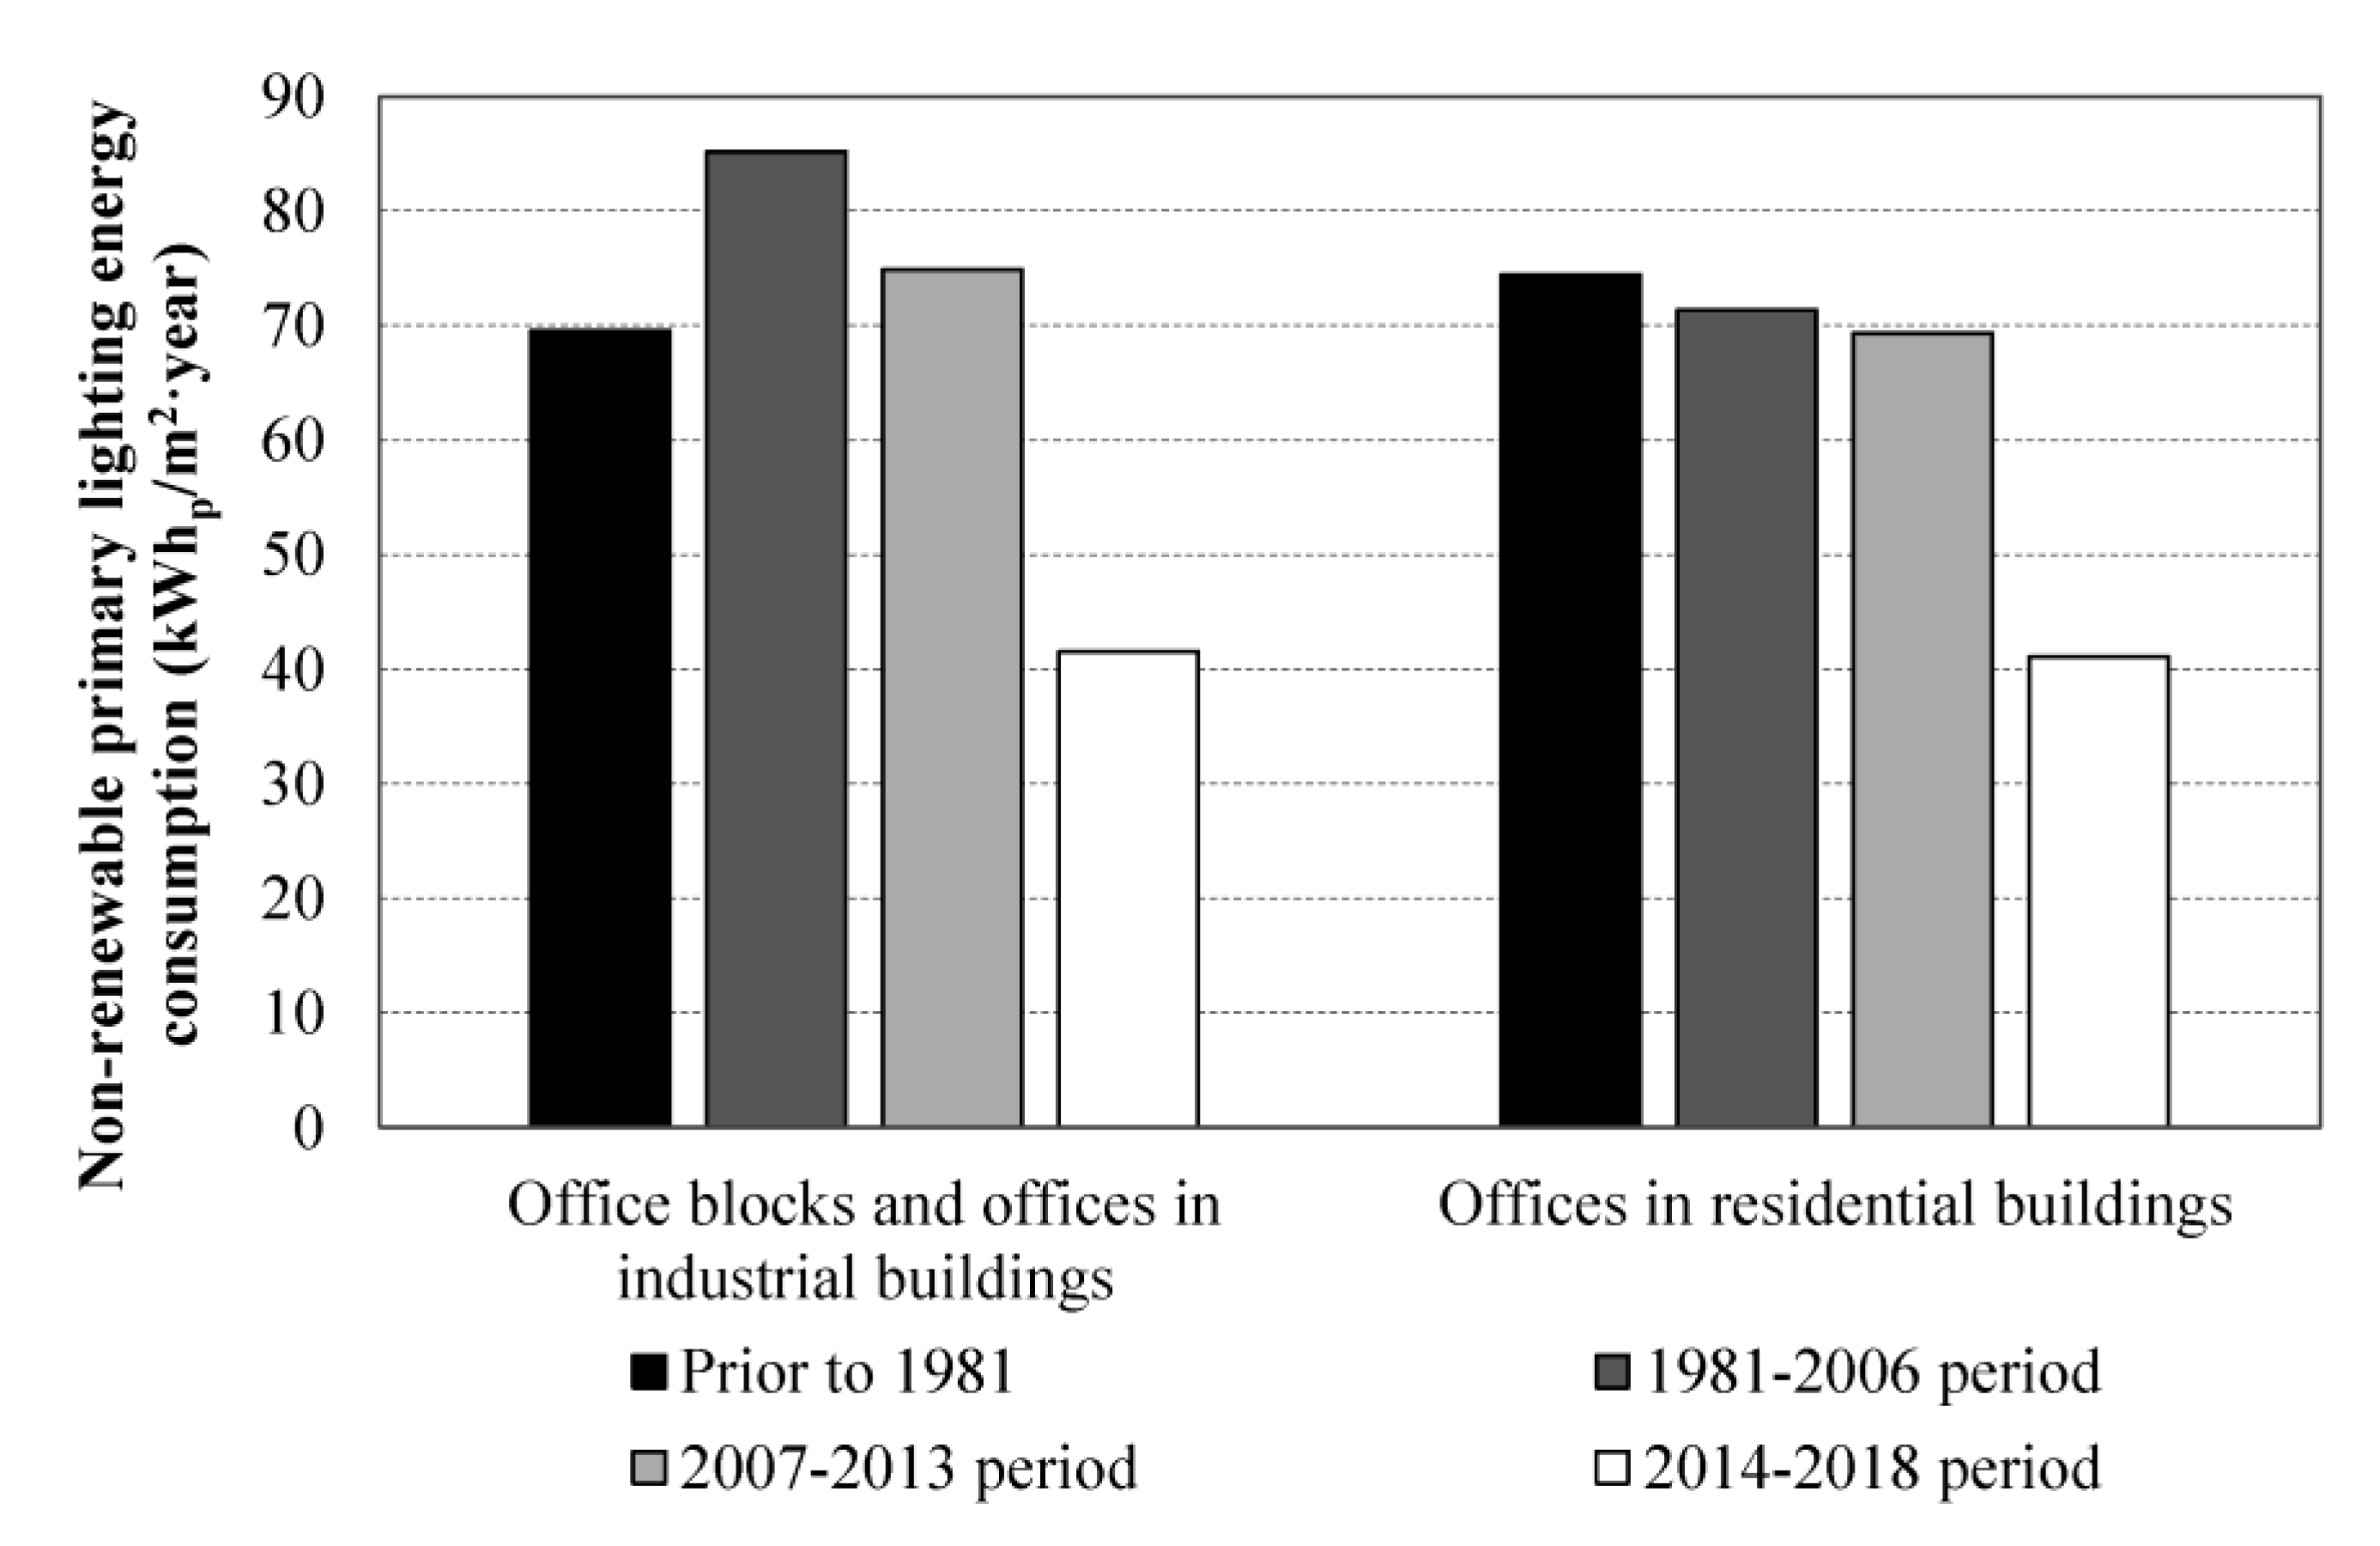
Figure 11.
Average calculated non-renewable primary lighting energy consumption [kWhp/m2·year] by office type and construction year. Source: drawn up by the authors using data from the ICAEN database, July 2018.
Figure 11.
Average calculated non-renewable primary lighting energy consumption [kWhp/m2·year] by office type and construction year. Source: drawn up by the authors using data from the ICAEN database, July 2018.
Figure 12.
Average calculated non-renewable primary heating energy consumption [kWhp/m2·year] according to office type and climate zone. Source: drawn up by the authors using data from the ICAEN database, July 2018.
Figure 12.
Average calculated non-renewable primary heating energy consumption [kWhp/m2·year] according to office type and climate zone. Source: drawn up by the authors using data from the ICAEN database, July 2018.
Figure 13.
Average calculated non-renewable primary cooling energy consumption [kWhp/m2·year] according to office type and climate zone. Source: drawn up by the authors using data from the ICAEN database, July 2018.
Figure 13.
Average calculated non-renewable primary cooling energy consumption [kWhp/m2·year] according to office type and climate zone. Source: drawn up by the authors using data from the ICAEN database, July 2018.
Figure 14.
Average calculated non-renewable primary energy consumption [kWhp/m2·year] by office type, construction period and climate zone. Source: drawn up by the authors using data from the ICAEN database, July 2018.
Figure 14.
Average calculated non-renewable primary energy consumption [kWhp/m2·year] by office type, construction period and climate zone. Source: drawn up by the authors using data from the ICAEN database, July 2018.
Figure 15.
Average calculated non-renewable primary energy consumption [kWhp/m2·year] by office type and existence of renewable energy. Source: drawn up by the authors using data from the ICAEN database, July 2018.
Figure 15.
Average calculated non-renewable primary energy consumption [kWhp/m2·year] by office type and existence of renewable energy. Source: drawn up by the authors using data from the ICAEN database, July 2018.
Figure 16.
Average calculated non-renewable primary energy consumption [kWhp/m2·year] according to office type and ownership. Source: drawn up by the authors using data from the ICAEN database, July 2018.
Figure 16.
Average calculated non-renewable primary energy consumption [kWhp/m2·year] according to office type and ownership. Source: drawn up by the authors using data from the ICAEN database, July 2018.
Figure 17.
Average calculated non-renewable primary energy consumption [kWhp/m2·year] according to office type and motivation. Source: drawn up by the authors using data from the ICAEN database, July 2018.
Figure 17.
Average calculated non-renewable primary energy consumption [kWhp/m2·year] according to office type and motivation. Source: drawn up by the authors using data from the ICAEN database, July 2018.
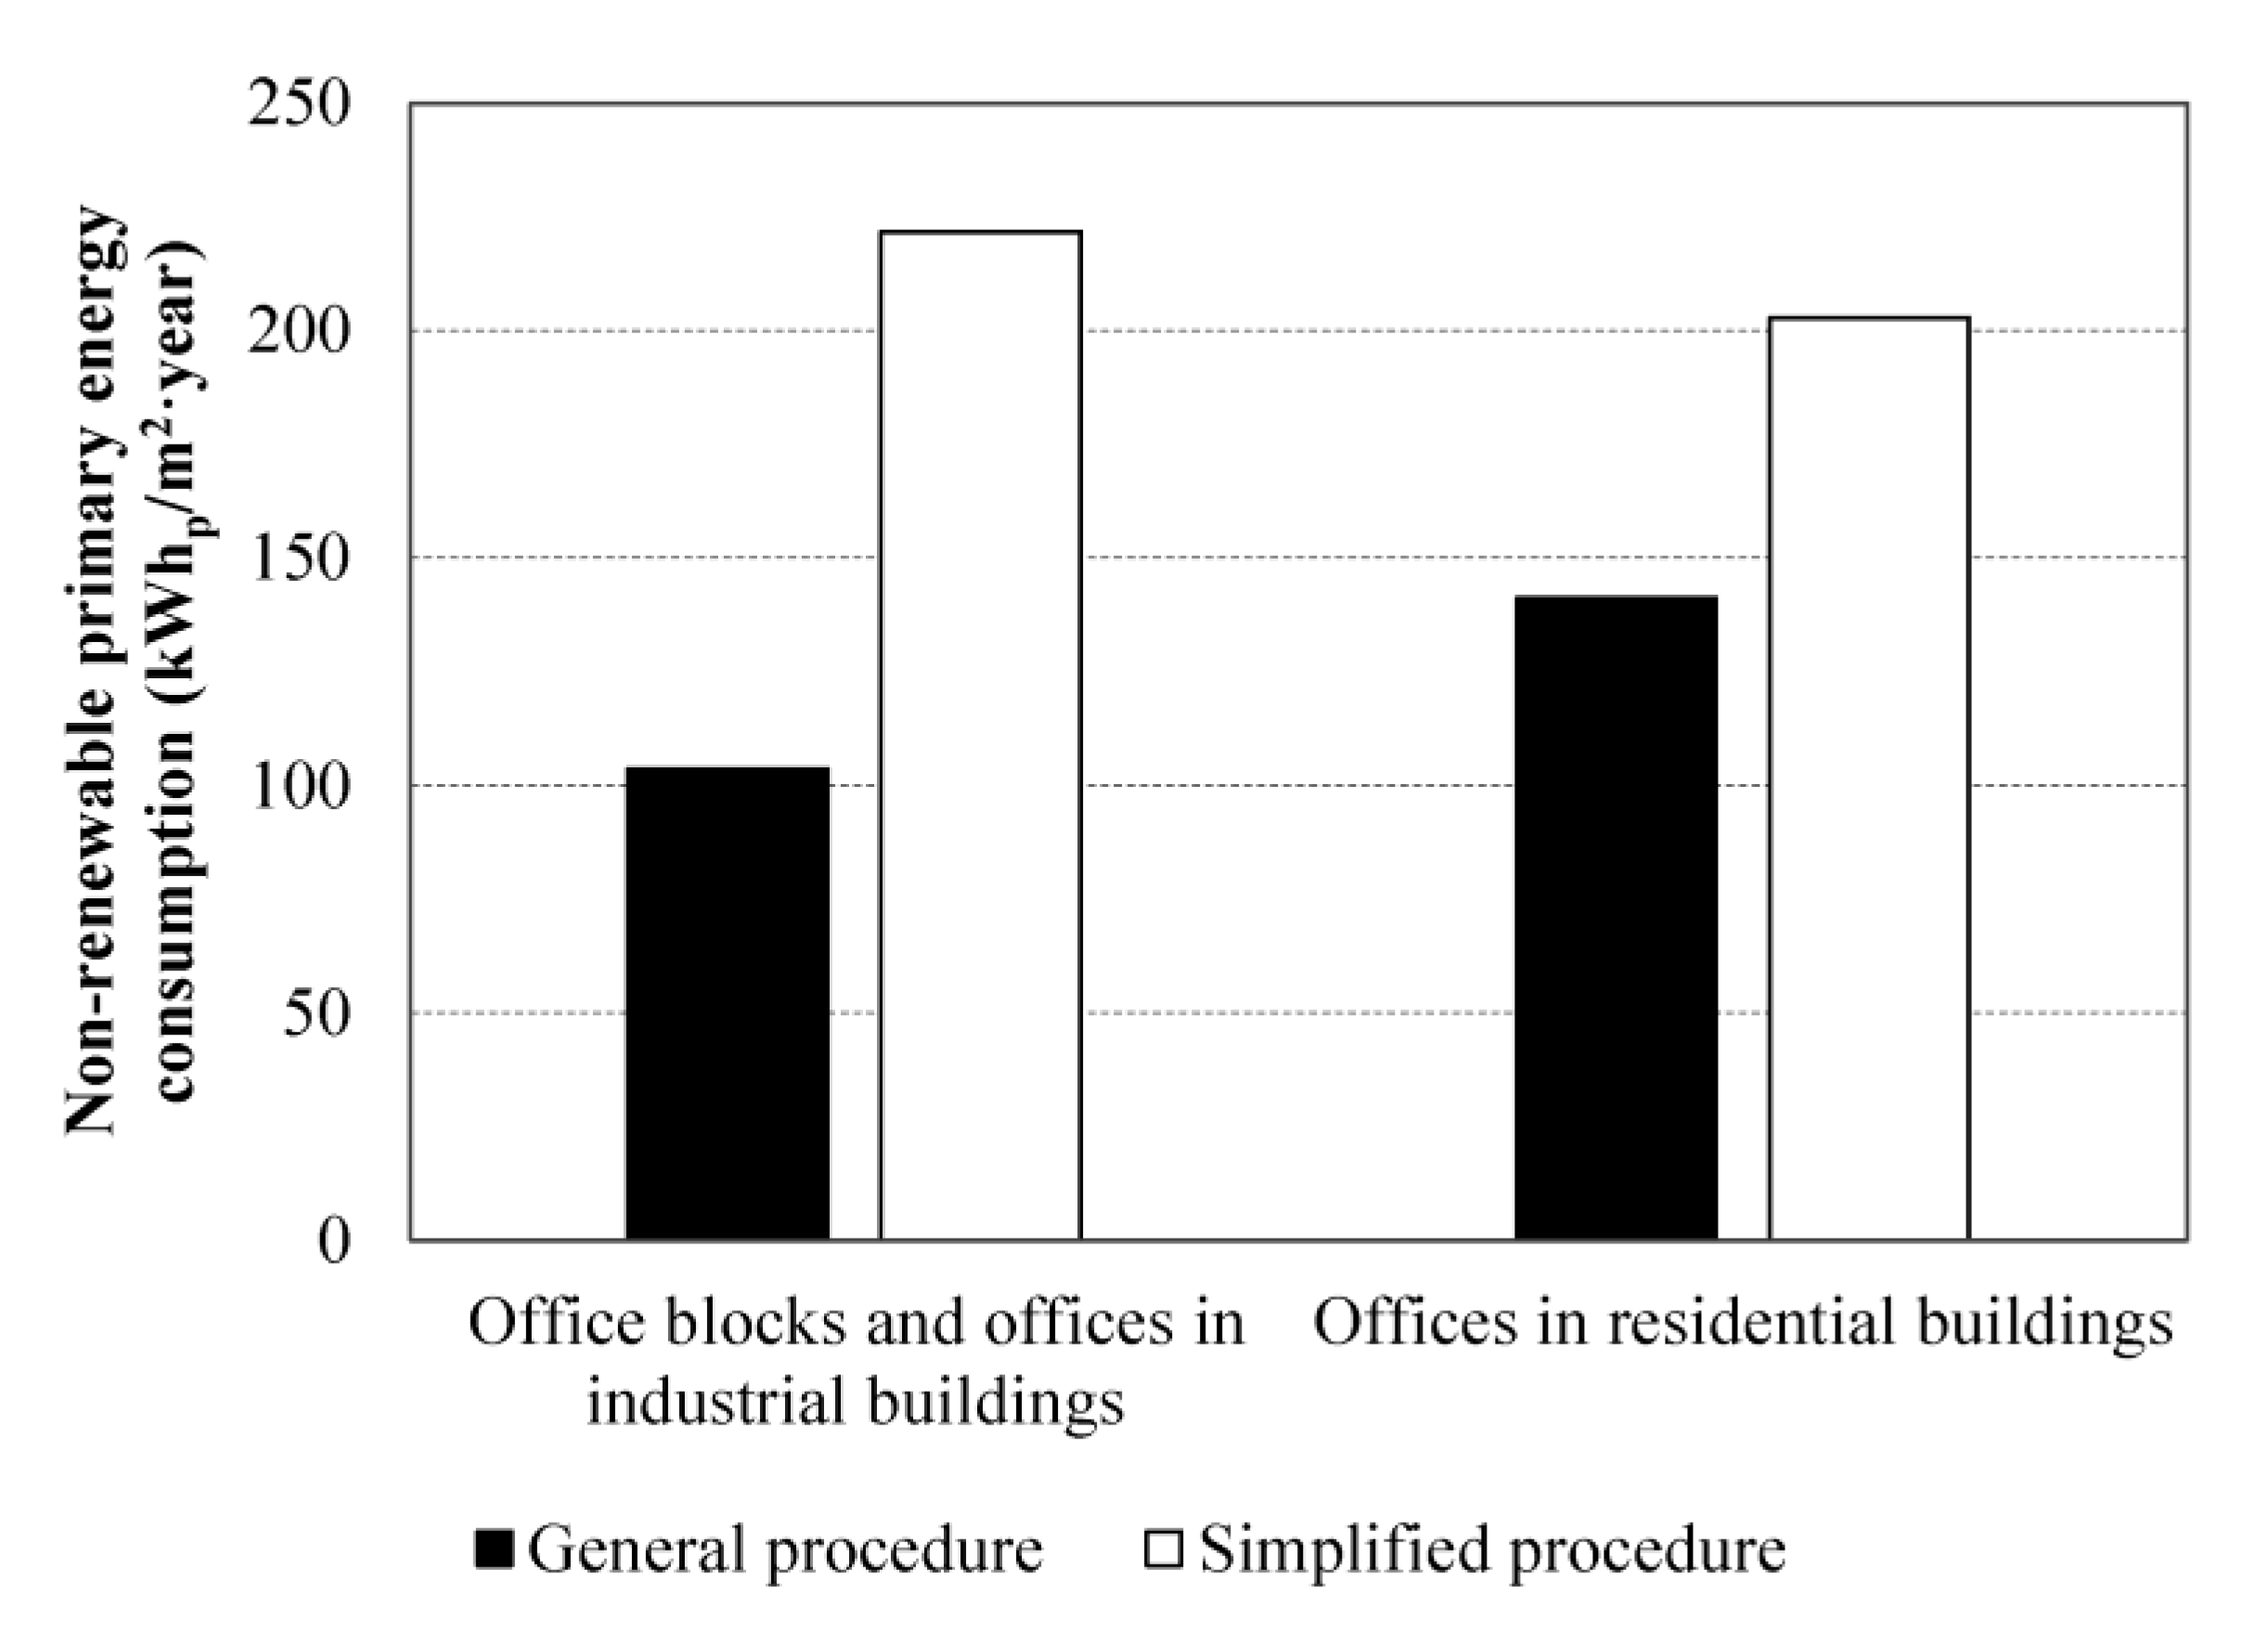
Figure 18.
Average calculated non-renewable primary energy consumption [kWhp/m2·year] according to office type and certification procedure. Source: drawn up by the authors using data from the ICAEN database, July 2018.
Figure 18.
Average calculated non-renewable primary energy consumption [kWhp/m2·year] according to office type and certification procedure. Source: drawn up by the authors using data from the ICAEN database, July 2018.
Table 1.
Previous research initiatives using energy performance certificate databases to describe the building stock. Source: own elaboration.
Table 1.
Previous research initiatives using energy performance certificate databases to describe the building stock. Source: own elaboration.
| Research Paper | Number of EPCs | Domain | Country |
|---|
| Armitage et al. [20] | 2600 | Offices | England and Wales |
| Broberg and Egüez [22] | 90,039 | Residential | Sweden |
| Buratti et al. [23] | 6500 | Residential | Italy |
| Curtis et al. [24] | 410,348 | Residential | Ireland |
| Dall’O’ et al. [25] | 175,778 | Residential | Italy |
| Dascalaki et al. [16] | 250 | Residential and non-residential | Greece |
| Dascalaki et al. [18] | 355,000 | Residential and non-residential | Greece |
| Dineen et al. [26] | 304,814 | Residential | Ireland |
| Droutsa et al. [27] | 650,000 | Residential | Greece |
| Fabbri et al. [17] | 1081 | Residential and non-residential | Italy |
| Fabbri [28] | 362,884 | Residential | Italy |
| Gangolells et al. [19] | 129,635 | Residential and tertiary | Spain |
| Godoy-Shimizu et al. [29] | 12,000 | Schools | United Kingdom |
| Hjortling et al. [21] | 186,021 | Commercial | Sweden |
| Hong et al. [30] | 8732 | Schools | United Kingdom |
| Hong et al. [31] | 7731 | Schools | United Kingdom |
| Johansson et al. [32] | 138,444 | Residential | Sweden |
| Kragh and Wittchen [33] | 235,000 | Residential | Denmark |
| Las-Heras-Casas et al. [34] | 36,072 | Residential | Spain |
| López-González et al. [35] | 9416 | Residential | Spain |
| Magalhães and Leal [36] | 259,775 | Residential | Portugal |
| Majcen et al. [37] | 233,670 | Residential | The Netherlands |
| Mangold et al. [38] | 17,620 | Residential | Sweden |
| Mangold et al. [39] | 5697 | Residential | Sweden |
| Prieler et al. [40] | 2645 | Residential | Austria |
| Reis and Escórcio [41] | 519 | Residential | Portugal |
Table 2.
Variables and threshold values used to detect errors in the energy performance certificate database. Source: own elaboration.
Table 2.
Variables and threshold values used to detect errors in the energy performance certificate database. Source: own elaboration.
| Variable | Value Threshold |
|---|
| Useful floor area (Su) | Su ≥ 10 m2 |
| Headroom (h) | 2.2 m ≤ h ≤ 5.0 m |
| Shape factor (SF) | 0.01 m2/m3 ≤ SF ≤ 2.30 m2/m3 |
| Thermal enclosure area (Ste) | Ste ≥ 5 m2 |
| Non-renewable primary energy consumption (Ep) | 24.4 kWhp/m2·year ≤ Ep ≤ 1000.0 kWhp/m2·year |
Table 3.
Number of energy performance certificates and corresponding floor area according to office type. Source: drawn up by the authors using data from the Catalan Institute of Energy (ICAEN) database, July 2018.
Table 3.
Number of energy performance certificates and corresponding floor area according to office type. Source: drawn up by the authors using data from the Catalan Institute of Energy (ICAEN) database, July 2018.
| Office Type | Number of Energy Performance Certificates | Floor Area |
|---|
| [u.] | [%] | [m2] | [%] |
|---|
| Office blocks and offices in industrial buildings | 2945 | 22.52 | 1,595,844 | 51.74 |
| Offices in residential buildings | 10,131 | 77.48 | 1,488,548 | 48.26 |
| Total | 13,076 | - | 3,084,393 | - |
Table 4.
Number of energy performance certificates according to office type and construction period. Source: drawn up by the authors using data from the ICAEN database, July 2018.
Table 4.
Number of energy performance certificates according to office type and construction period. Source: drawn up by the authors using data from the ICAEN database, July 2018.
| Office Type | Construction Year |
|---|
| Prior to 1981 | 1981–2006 Period | 2007–2013 Period | 2014–2018 Period | Total |
|---|
| [u.] | [%] | [u.] | [%] | [u.] | [%] | [u.] | [%] | [u.] | [%] |
|---|
| Office blocks and offices in industrial buildings | 1094 | 37.15 | 1485 | 50.42 | 238 | 8.08 | 128 | 4.35 | 2945 | 100 |
| Offices in residential buildings | 6287 | 62.06 | 3361 | 33.18 | 434 | 4.28 | 49 | 0.48 | 10,131 | 100 |
| Total | 7381 | 56.45 | 4846 | 37.06 | 672 | 5.14 | 177 | 1.35 | 13,076 | 100 |
Table 5.
Number of energy performance certificates according to office type and climate zone. Source: drawn up by the authors using data from the ICAEN database, July 2018.
Table 5.
Number of energy performance certificates according to office type and climate zone. Source: drawn up by the authors using data from the ICAEN database, July 2018.
| Office Type | Climate Zone |
|---|
| Province Capitals Zones | Other Zones | Total |
|---|
| C2 | B3 | D3 | D2 | C3 | D1 | E1 |
|---|
| [u.] | [%] | [u.] | [%] | [u.] | [%] | [u.] | [%] | [u.] | [%] | [u.] | [%] | [u.] | [%] | [u.] | [%] |
|---|
| Office blocks and offices in industrial buildings | 1874 | 63.63 | 75 | 2.55 | 118 | 4.01 | 562 | 19.08 | 184 | 6.25 | 86 | 2.92 | 46 | 1.56 | 2945 | 100 |
| Offices in residential buildings | 8111 | 80.06 | 196 | 1.93 | 228 | 2.25 | 1046 | 10.32 | 349 | 3.44 | 145 | 1.43 | 56 | 0.55 | 10,131 | 100 |
| Total | 9985 | 76.36 | 271 | 2.07 | 346 | 2.65 | 1608 | 12.30 | 533 | 4.08 | 231 | 1.77 | 102 | 0.78 | 13,076 | 100 |
Table 6.
Number of energy performance certificates by office type and renewable energy sources. Source: drawn up by the authors using data from the ICAEN database, July 2018.
Table 6.
Number of energy performance certificates by office type and renewable energy sources. Source: drawn up by the authors using data from the ICAEN database, July 2018.
| Office Type | Renewable Energy Sources | Non-Renewable Energy Sources |
|---|
| Solar Thermal | Solar Photovoltaics | Biomass | Geothermal |
|---|
| [u.] | [%] 1 | [u.] | [%] 1 | [u.] | [%] 1 | [u.] | [%] 1 | [u.] | [%] 1 |
|---|
| Office blocks and offices in industrial buildings | 95 | 3.23 | 46 | 1.56 | 17 | 0.58 | 6 | 0.20 | 2796 | 94.94 |
| Offices in residential buildings | 108 | 1.07 | 13 | 0.13 | 16 | 0.16 | 13 | 0.13 | 9990 | 98.61 |
| Total | 203 | 1.55 | 59 | 0.45 | 33 | 0.25 | 19 | 0.15 | 12,786 | 97.78 |
Table 7.
Number of energy performance certificates according to office type and ownership. Source: drawn up by the authors using data from the ICAEN database, July 2018.
Table 7.
Number of energy performance certificates according to office type and ownership. Source: drawn up by the authors using data from the ICAEN database, July 2018.
| Office Type | Public | Private | Total |
|---|
| [u.] | [%] | [u.] | [%] | [u.] | [%] |
|---|
| Office blocks and offices in industrial buildings | 339 | 11.51 | 2606 | 88.49 | 2945 | 100 |
| Offices in residential buildings | 119 | 1.17 | 10,012 | 98.83 | 10,131 | 100 |
| Total | 458 | 3.50 | 12,618 | 96.50 | 13,076 | 100 |
Table 8.
Number of energy performance certificates by office type and the reason for issuing them. Source: drawn up by the authors using data from the ICAEN database, July 2018.
Table 8.
Number of energy performance certificates by office type and the reason for issuing them. Source: drawn up by the authors using data from the ICAEN database, July 2018.
| Office Type | Rental | Sale | Newly Built | Public Offices | Voluntary Certification | Others | Total |
|---|
| [u.] | [%] | [u.] | [%] | [u.] | [%] | [u.] | [%] | [u.] | [%] | [u.] | [%] | [u.] | [%] |
|---|
| Office blocks and offices in industrial buildings | 1344 | 45.64 | 942 | 31.99 | 88 | 2.99 | 288 | 9.78 | 91 | 3.09 | 192 | 6.52 | 2945 | 100 |
| Offices in residential buildings | 6806 | 67.18 | 2804 | 27.68 | 5 | 0.05 | 92 | 0.91 | 135 | 1.33 | 289 | 2.85 | 10,131 | 100 |
| Total | 8150 | 62.33 | 3746 | 28.65 | 93 | 0.71 | 380 | 2.91 | 226 | 1.73 | 481 | 3.68 | 13,076 | 100 |
Table 9.
Recognised tools for energy performance certification of tertiary sector buildings in Spain in 2019. Source: adapted from ICAEN [
53].
Table 9.
Recognised tools for energy performance certification of tertiary sector buildings in Spain in 2019. Source: adapted from ICAEN [
53].
| Building Type | Certification Procedure | Recognised Tools |
|---|
| New buildings | Tertiary sector buildings | General | HULC |
| CYPETHERM |
| SG Save |
| Simplified | CE3X |
| Large tertiary sector buildings | General | HULC |
| CYPETHERM |
| SG Save |
| Existing buildings | Tertiary sector buildings | General | HULC |
| CYPETHERM |
| SG Save |
| Simplified | CE3X |
| CE3 |
| Large tertiary sector buildings | General | HULC |
| CYPETHERM |
| SG Save |
| Simplified | CE3X |
Table 10.
Number of energy performance certificates by office type and energy performance certification procedure. Source: drawn up by the authors using data from the ICAEN database, July 2018.
Table 10.
Number of energy performance certificates by office type and energy performance certification procedure. Source: drawn up by the authors using data from the ICAEN database, July 2018.
| Office Type | Energy Performance Certification Procedure |
|---|
| General Procedures | Simplified Procedures | Total |
|---|
| HULC | Calener VyP | Calener GT | CYPE-THERM | SG Save | CE3X | CE3 | CE2 |
|---|
| [u.] | [%] | [u.] | [%] | [u.] | [%] | [u.] | [%] | [u.] | [%] | [u.] | [%] | [u.] | [%] | [u.] | [%] | [u.] | [%] |
|---|
| Office blocks and offices in industrial buildings | 78 | 2.65 | 35 | 1.19 | 10 | 0.34 | 0 | 0.00 | 0 | 0.00 | 2803 | 95.18 | 19 | 0.65 | 0 | 0.00 | 2945 | 100 |
| Offices in residential buildings | 9 | 0.09 | 4 | 0.04 | 1 | 0.01 | 0 | 0.00 | 0 | 0.00 | 10,028 | 98.98 | 89 | 0.88 | 0 | 0.00 | 10,131 | 100 |
| Total | 87 | 0.67 | 39 | 0.30 | 11 | 0.08 | 0 | 0.00 | 0 | 0.00 | 12,831 | 98.13 | 108 | 0.83 | 0 | 0.00 | 13,076 | 100 |
Table 11.
Average and total calculated non-renewable primary energy consumption and emissions generation by office type. Source: drawn up by the authors using data from the ICAEN database, July 2018.
Table 11.
Average and total calculated non-renewable primary energy consumption and emissions generation by office type. Source: drawn up by the authors using data from the ICAEN database, July 2018.
| Office Type | Average Primary Energy Consumption | Average Emissions Generation | Total Primary Energy Consumption | Total Emissions Generation |
|---|
| [kWhp/m2·year] | [kg CO2/m2·year] | [GWhp/year] | [%] | [t CO2/year] | [%] |
|---|
| Office blocks and offices in industrial buildings | 212.10 | 39.36 | 227.84 | 61.62 | 41,271.17 | 60.56 |
| Offices in residential buildings | 202.66 | 37.94 | 141.91 | 38.38 | 26,873.13 | 39.44 |
| Total | - | - | 369.75 | - | 68,144.30 | - |
Table 12.
Number of energy performance certificates according to available system and office type. Source: drawn up by the authors using data from the ICAEN database, July 2018.
Table 12.
Number of energy performance certificates according to available system and office type. Source: drawn up by the authors using data from the ICAEN database, July 2018.
| Fuel | Heating | Cooling | Domestic Hot Water |
|---|
| [u.] | [%] | [u.] | [%] | [u.] | [%] |
|---|
| Office blocks and offices in industrial buildings |
| Existing system | 1048 | 97.67 | 950 | 88.54 | 595 | 55.45 |
| No system | 25 | 2.33 | 123 | 11.46 | 478 | 44.55 |
| Total | 1073 | 100 | 1073 | 100 | 1073 | 100 |
| Offices in residential buildings |
| Existing system | 3382 | 97.86 | 3,073 | 88.92 | 1494 | 43.23 |
| No system | 74 | 2.14 | 383 | 11.08 | 1962 | 56.77 |
| Total | 3456 | 100 | 3456 | 100 | 3456 | 100 |
Table 13.
Number of energy performance certificates according to fuel and office type. Source: drawn up by the authors using data from the ICAEN database, July 2018.
Table 13.
Number of energy performance certificates according to fuel and office type. Source: drawn up by the authors using data from the ICAEN database, July 2018.
| Fuel | Heating | Cooling | Domestic Hot Water |
|---|
| [u.] | [%] | [u.] | [%] | [u.] | [%] |
|---|
| Office blocks and offices in industrial buildings |
| Electricity | 520 | 84.42 | 745 | 99.73 | 503 | 88.87 |
| Natural gas | 51 | 8.28 | 1 | 0.13 | 50 | 8.83 |
| Diesel oil | 9 | 1.46 | 0 | 0.00 | 7 | 1.24 |
| Renewable energy/combined systems | 8 | 1.30 | 1 | 0.13 | 2 | 0.35 |
| Others 1 | 28 | 4.55 | 0 | 0.00 | 4 | 0.71 |
| Total 2 | 616 | 100 | 747 | 100 | 566 | 100 |
| Offices in residential buildings |
| Electricity | 1738 | 92.89 | 2308 | 99.87 | 1222 | 89.39 |
| Natural gas | 88 | 4.70 | 1 | 0.04 | 135 | 9.88 |
| Diesel oil | 21 | 1.12 | 1 | 0.04 | 5 | 0.37 |
| Renewable energy/combined systems | 1 | 0.05 | 0 | 0.00 | 1 | 0.07 |
| Others 1 | 23 | 1.23 | 1 | 0.04 | 4 | 0.29 |
| Total 2 | 1871 | 100 | 2311 | 100 | 1367 | 100 |
Table 14.
Percentage of energy performance certificates including renewable energy by office type and construction period. Source: drawn up by the authors using data from the ICAEN database, July 2018.
Table 14.
Percentage of energy performance certificates including renewable energy by office type and construction period. Source: drawn up by the authors using data from the ICAEN database, July 2018.
| Office Type | Construction Year |
|---|
| Prior to 1981 | 1981–2006 Period | 2007–2013 Period | 2014–2018 Period | Total |
|---|
| Office blocks and offices in industrial buildings | 1.70% | 3.61% | 15.91% | 35.90% | 100% |
| Offices in residential buildings | 0.57% | 0.68% | 22.70% | - | 100% |
| Total | 0.74% | 1.61% | 20.32% | 29.59% | 100% |

 ,
, 


