Article

Carbon Mitigation for Industrial Sectors in the Jing-Jin-Ji Urban Agglomeration, China

1
Institute of Geographic Sciences and Natural Resources Research, Chinese Academy of Sciences, Beijing 100101, China
2
Center for Chinese Agricultural Policy, Chinese Academy of Sciences, Beijing 100101, China
3
School of Economics and Management, China University of Geosciences, Beijing 100083, China
4
Chinese Academy of Environmental Planning, Beijing 100012, China
*
Author to whom correspondence should be addressed.
Sustainability 2019, 11(22), 6383; https://doi.org/10.3390/su11226383
Submission received: 2 October 2019 / Revised: 7 November 2019 / Accepted: 11 November 2019 / Published: 13 November 2019
(This article belongs to the Section Energy Sustainability)

Abstract

:
Industrial companies are responsible for most of the energy consumption and carbon emissions in China’s urban agglomerations. Some scholars have allocated CO2 emissions to China’s industrial sectors in reaching national reduction targets, yet industrial sectors’ burden-sharing problem for carbon mitigation at the provincial level has not been well addressed. Given the goal of realizing China’s national carbon mitigation target by 2030, we applied a nonlinear quota allocation model to obtain the optimal allocation of emission reduction quotas among 37 industrial sectors in the Jing-Jin-Ji urban agglomeration in China (comprising Beijing, Tianjin, and Hebei). Compared to Beijing and Tianjin, the secondary industry in Hebei bears the highest reduction responsibilities, given that Hebei will experience the largest carbon emissions, at 0.42 billion tons in 2030, which is 80.04% of the total emissions in the Jing-Jin-Ji urban agglomeration. Energy production and heavy manufacturing sectors serve as the major carbon emitters and have relatively high carbon intensities, which indicates that they have significant potential and major responsibilities for impacting carbon mitigation. Based on differences in urban function and development mode, the same industrial sectors in the three provinces have different obligations for emission reductions. This study is vital to allocate reduction responsibilities among industrial sectors and to discrete key sector categories bearing a higher mitigation burden.

1. Introduction

Both developed and developing countries must decrease carbon emissions to alleviate climate change and to ensure global sustainable development [1]. China faces specific challenges in making deep carbon emission reductions given its large population [2], rapidly expanding economy [3], and heavy reliance on coal [4]. The United Nations Framework Convention on Climate Change (UNFCCC) has found that China has surpassed the United States to become the largest carbon emitter in the world since 2009 [5]. The Chinese government has committed that by 2030, China’s carbon emissions per unit of gross domestic product (GDP) will be reduced by 60% to 65% relative to the 2005 level. Urban agglomerations, or continuous urban areas, are composed of several urban centers and have been developed as part of an explicit national strategy. These agglomerations contribute 64% to China’s energy-related carbon dioxide (CO2) emissions, playing a vital role in shaping the future of climate change [6]. Carbon reductions in urban agglomerations determine national-level carbon emission reductions and climate change.
The responsibilities and equity rights of different countries, provinces, and regions have been studied using different methods. The Boltzmann distribution (a frequency distribution method) was applied to allocate permits in carbon emission trading among eight countries [7]. Pang et al. improved the Pareto model to allocate global emission quotas using the ZSG-DEA model, an effective method for optimizing comprehensive efficiency under total quantity constraints, which can achieve the optimization of resource allocation efficiency [8]. In China, several studies have allocated carbon emission allowances over different provinces [9,10,11,12]. Yu et al. concluded that the western region has the largest potential reduction capability and the lowest marginal cost, and therefore should undertake more emission reductions [11]. Focusing on the Jing-Jin-Ji urban agglomeration, Han et al. applied an integrated weighting approach to calculate the carbon reduction capacity and responsibility, finding that Hebei bears the largest burden of carbon reduction because it undertakes a large number of industrial enterprises from Beijing and Tianjin [13].
The rational allocation of carbon reduction among sectors is the basis for achieving carbon emission reduction targets [14,15,16,17]. At the national level, heavy industry sectors are understood to bear the largest share of carbon quotas; however, there are differences between specific sectors. Zhang and Hao predicted the carbon reduction responsibilities for 37 sectors and revealed that six key sectors account for 91.77% of the total quota. These six sectors include the manufacture and processing of the ferrous metals sector; the processing of the petroleum sector; the coking and processing of the nuclear fuel sector; the nonmetal mineral products sector; the chemical raw materials and chemical products manufacturing sector; and the mining and washing of the coal sector [18]. Zhao et al. proposed that the production and distribution of electric power and heat power should bear the largest burden of carbon reduction, with CO2 emission reductions of 1825.98 million tons and 2673.69 million tons for reduction targets of 60% to 65%, respectively [16]. Those studies were mainly conducted on a country scale. This does not provide specific targets in the allocation of carbon reduction quotas in urban agglomerations and economic zones, such as the Jing-Jin-Ji urban agglomeration.
Located in North China, the Jing-Jin-Ji urban agglomeration is an important core region and center of economic growth in China. It includes Beijing (abbreviated as Jing), Tianjin (abbreviated as Jin), and Hebei (abbreviated as Ji). The synergetic development of Jing-Jin-Ji urban agglomeration was part of an explicit national strategy in the National 12th (2011 to 2015) Five-Year Plan [19]. The GDP of the Jing-Jin-Ji urban agglomeration in 2017 represented 9.74% of the total national GDP [20]; however, economic development remains imbalanced. Beijing plunders abundant resources from its surrounding area, especially Hebei, in order to achieve further economic development [21,22]. Despite its rapid economic development, Jing-Jin-Ji urban agglomeration has been assigned significant energy conservation and emission reduction responsibilities. The regional carbon emissions represented 10.24% of the total national emissions in 2015 [23]. Carbon emissions from secondary industry sectors, such as the nonmetal mineral products sectors and smelting and pressing of the ferrous metals sectors, account for 71.34% of total national emissions, indicating that reducing industrial carbon is an effective approach to conserve energy and to achieve the allocated carbon emission targets in the region.
Addressing carbon mitigation issues for industrial sectors, most researchers concern their carbon emission allocation at the national level. Generally, studies on industrial carbon reduction at the provincial level emphasize a specific industrial sector due to its features and higher emission. However, current studies rarely focus on the industrial sectors’ burden-sharing problem for carbon mitigation in the Jing-Jin-Ji urban agglomeration in China, which extends the existing knowledge on the topic. Given this background, the main goals of this study were to (1) estimate the future carbon emissions and intensities of 37 industrial sectors in the Jing-Jin-Ji urban agglomeration, and (2) disaggregate the carbon reduction targets among three provinces and 37 sectors to reduce carbon emissions in the Jing-Jin-Ji urban agglomeration. This study provides meaningful information to help the Jing-Jin-Ji urban agglomeration identify carbon reduction targets, assign emission mitigation responsibilities across 37 sectors, and formulate related policies.
The rest of this paper is organized as follows. Section 2 introduces the historical trends of carbon emissions in the Jing-Jin-Ji urban agglomeration. Section 3 presents the data sources and the nonlinear carbon emission reduction quota allocation model. Section 4 shows the predicted carbon emissions and intensities of different industrial sectors in the Jing-Jin-Ji area in 2030, as well as the optimal allocation of carbon reduction targets. Several policy recommendations are proposed based on the results. The last section includes the study conclusions.

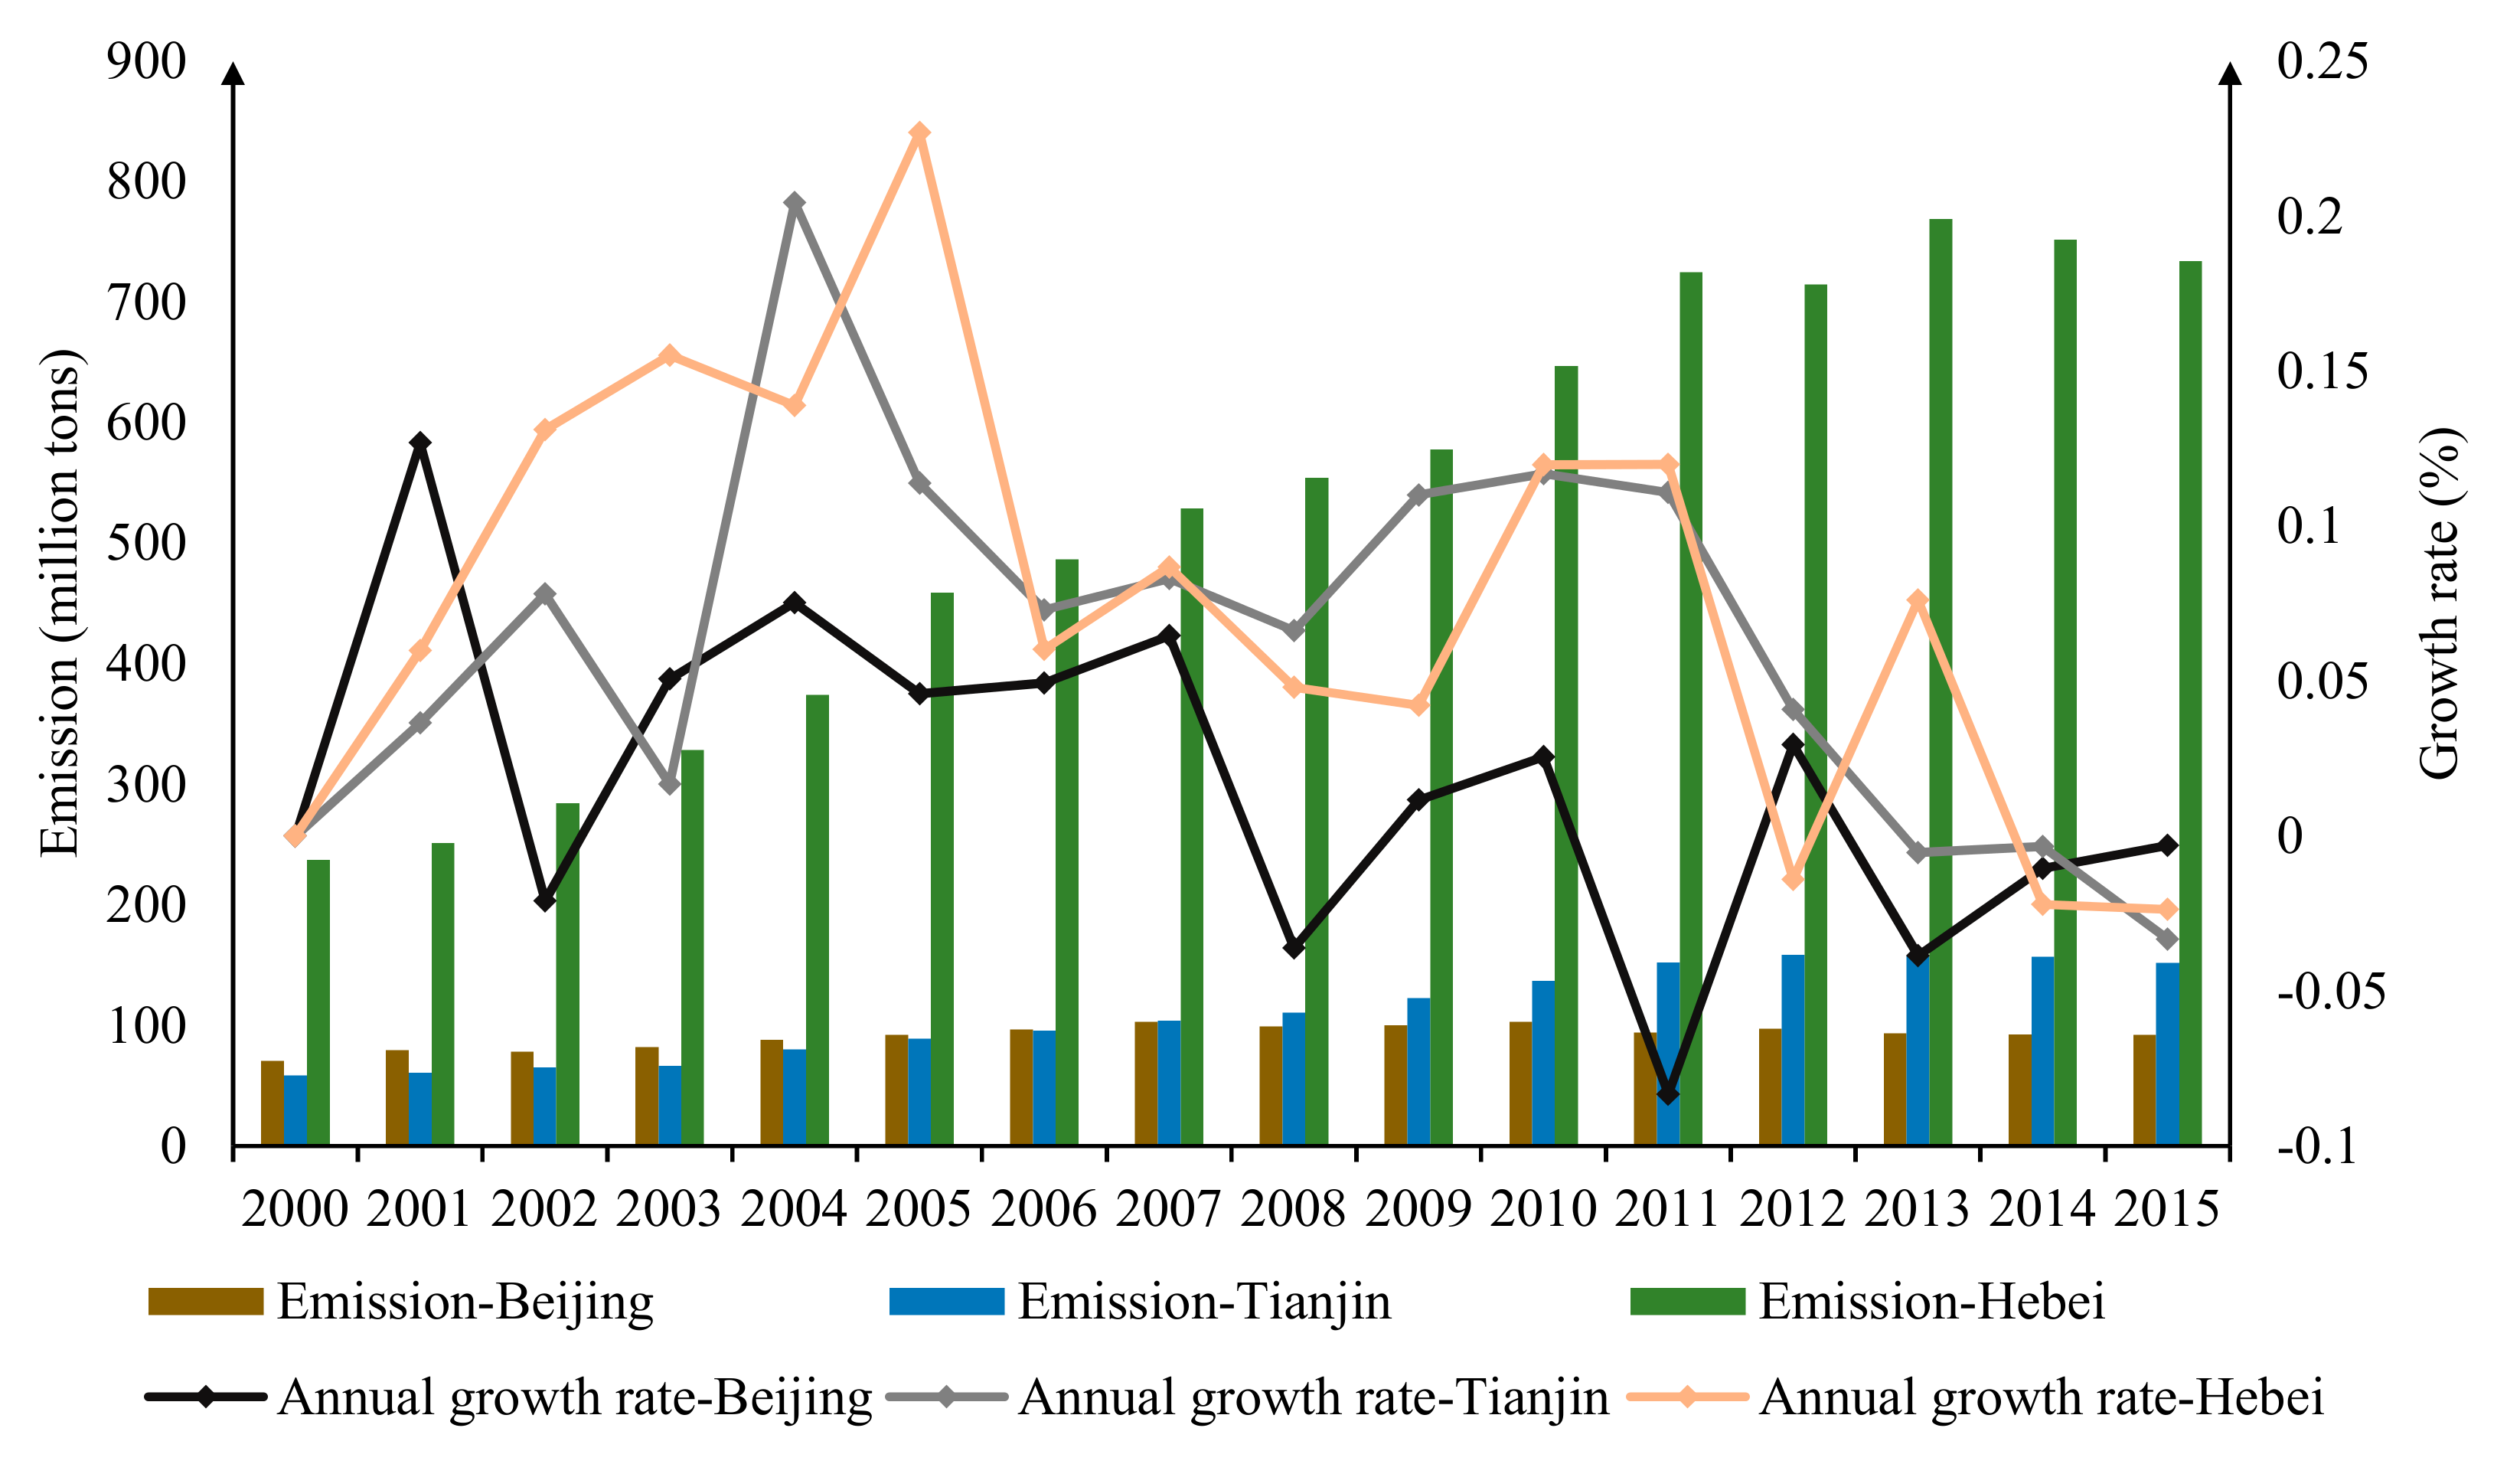
2. Overview of Carbon Emissions in the Jing-Jin-Ji Urban Agglomeration

Figure 1 shows that carbon emissions in the Jing-Jin-Ji urban agglomeration have maintained an upward trend over the long term. Compared to Beijing and Tianjin, carbon emissions were highest in Hebei, representing the major proportion of emissions among the three provinces. The cumulative carbon emissions in Hebei were 11.60 billion tons from 2000 to 2015, accounting for 72.3% of the cumulative carbon emissions in the Jing-Jin-Ji urban agglomeration. In 2005, the annual growth rate of Hebei’s carbon emissions reached the highest level of 22.69%, which was near twice the level of Tianjin and four times the level of Beijing in the same year. Due to the carbon-based energy structure in Hebei, carbon emissions increased rapidly before 2005, attracting the attention of the local government. The government proposed a series of policies to control the carbon emission, which accounts for the declining growth trend after 2005. From 2000 to 2006, the carbon emissions in Tianjin were lower compared to Beijing; however, since 2007, carbon emissions in Tianjin have surpassed Beijing, and the gap in emissions between Beijing and Tianjin has widened. Beijing’s carbon emission fluctuations have maintained relatively stable levels. Historical emissions data indicate that Hebei, which has had the largest historical emissions, bears the most responsibility for reducing emissions. In contrast, Beijing and Tianjin face a relatively low emission reduction burden.
Figure 2 shows the historical trend of carbon emissions in the primary, secondary, and tertiary industries of the Jing-Jin-Ji urban agglomeration. Industrial sectors are the main force driving economic growth and occupy the dominant position in the three industries. Meanwhile, production processes in the secondary industry generate abundant carbon emissions. In 2015, the average carbon emissions in the secondary industry of Beijing, Tianjin, and Hebei represented 42.58%, 81.86%, and 89.37%, respectively, of total emissions. Carbon emissions generated by the secondary industry consistently remained at a high proportion of total emissions in Hebei and Tianjin. In contrast, Beijing experienced decreases in emissions, from 54.93% to 42.58% of total emissions between 2010 and 2015. To optimize cooperative development in the Jing-Jin-Ji urban agglomeration, Hebei must assume the functional transfer and additional emissions from Beijing and Tianjin [13]. For example, the Shougang Group is a large-scale enterprise group mainly engaged in the iron and steel industry. The group moved to Hebei after 2005 under an arrangement with China’s national development and reform commission. This movement led to the secondary industry of Hebei having an average proportion of carbon emissions that was significantly higher compared to Beijing and Tianjin.

3. Theories and Methodologies

3.1. Data

For this study, we collected historical data, including carbon emissions (2000–2015), from the Jing-Jin-Ji urban agglomeration at the provincial and sectoral levels from China’s Emission Accounts and Datasets (CEADs). CEADs regularly publishes the latest carbon emission inventories, which are compiled based on relevant energy data revisions (2015) by the Chinese Statistics Bureau [23]. We reorganized the sectoral-level data and determined the emissions data for 37 industrial sectors. The corresponding GDP and industrial value-added for different sectors were collected from the Chinese Energy Statistical Yearbook for 2000–2015. To eliminate errors driven by price fluctuations, we measured the GDP and the industrial value-added in 2015 using the year 2000 constant prices.

3.2. Carbon Emissions and Intensities in 2030

The carbon emissions and intensities for the three provinces of the Jing-Jin-Ji urban agglomeration in 2030 needed to be determined to identify optimal strategies for the allocation of carbon reduction responsibilities. Carbon intensity refers to a region’s carbon emissions per unit of GDP. We selected carbon emissions per unit of industrial value added as the standard to measure carbon intensity at the sectoral level. We applied the growth rate method to forecast carbon emissions, intensities, GDP, and industrial value added. The average annual growth rates for GDP, industrial value-added, and carbon emissions from 2000 to 2015 were recognized as fixed growth rates. The year 2015 was set as the base period for predictions. Then, we generated the GDP and carbon emissions of the three provinces and the industrial value added for 37 sectors in the Jing-Jin-Ji urban agglomeration for 2030 by multiplying the base period by the growth rates. We predicted the sectoral carbon emissions level in 2030 based on the proportions that different sectors contributed to total emissions in 2015. The carbon intensities at the provincial and sectoral level in 2030 were predicted using the future GDP/industrial value-added values, divided by carbon emissions.
Subsequently, we calculated the target carbon intensities of the Jing-Jin-Ji urban agglomeration in 2030, with the goal of achieving China’s mitigation targets as submitted to the UNFCCC as part of the Copenhagen Accord. The formula is as follows:
E I 2030 = E I 2005 × η .
In this expression, EI2030 refers to the target carbon intensity of the Jing-Jin-Ji urban agglomeration in 2030 (ton/104 RMB); EI2005 is the carbon emission intensity of 2005 (ton/104 RMB); and η represents the national target carbon intensity reduction ratio, which was set at 60%–65% relative to the 2005 level.
The target emission reduction for 2030 was calculated as follows:
E R 2030 = F E I 2030 s E I 2030 × F G D P 2030 s .
In this expression, ER2030 refers to the target carbon emission reduction of Jing-Jin-Ji urban agglomeration (ton); FEI 2030represents the carbon intensities of the three provinces in 2030, which were estimated based on historical data series of carbon emissions and GDP (ton/104 RMB); and FGDP2030 is the GDP of three provinces in 2030, which was estimated based on the historical GDP data series (104 RMB).

3.3. Nonlinear Quota Allocation Modeling

A nonlinear quota allocation model was applied to solve the problem of minimizing abatement costs within the constraint of emission reduction targets. Estimated carbon intensities and the amount of allowable emission were entered into the model to solve the model algorithm. We constructed a marginal abatement cost curve to estimate the abatement cost when realizing carbon emission reduction targets. Previous studies have mainly adopted three forms to investigate abatement costs: the exponential function [24], quadratic function [25], and logarithmic function [26,27]. This study applied the logarithmic function. We generated the formula for the marginal abatement cost curve based on the marginal abatement cost data from the Emissions Prediction and Policy Analysis (EPPA) model [28]. The formula is as follows:
M C = 70.9 702.6 × ln ( 1 R ) .
For sector i, we have:
r i = 1 e i e n .
In this expression, ei refers to the carbon intensity of sector i; and en represents the local carbon intensity. When the carbon intensity of sector i is less than the local carbon intensity, then r i > 0 . Otherwise, r i < 0 . Next, we calculated the marginal abatement cost of sector i with the carbon reduction proportion Ri, as follows:
M C i R i = M C R i + r i M C r i = β ln ( 1 R i 1 r i ) .
This can be further translated into the formula as follows:
M C i A i = β ln ( 1 A i E i 1 r i ) .
In this expression, Ai refers to the emission reductions in sector i, and Ei represents the total predicted emissions from sector i. The total abatement cost for emission reductions in sector i is calculated as follows:
C i A i = 0 A i [ β ln ( 1 σ E i 1 r i ) d σ = β E i 1 r i A i ] ln ( 1 A i E i 1 r i ) β A i .
The nonlinear quota allocation optimization model can then be formulated as:
m i n   T   C = i β E i 1 r i A i ln ( 1 A i E i 1 r i ) β A i .
This expression is subject to:
i A i = A ;
A i 0 ; .

4. Results and Discussion

4.1. Carbon Mitigation at the City Level

Jing-Jin-Ji urban agglomeration’s carbon emissions and intensities in 2030 were predicted as shown in Table 1. In general, Jing-Jin-Ji urban agglomeration will witness an increase of 639.24 million tons of carbon emissions in 2030 compared to the 2015 level. There are significant differences among Beijing, Tianjin, and Hebei due to their different energy consumption structures, technological levels, and industrial structures. Hebei is predicted to experience the highest carbon emissions, at 1.21 billion tons in 2030, accounting for approximately 92.14% of the total emissions in the Jing-Jin-Ji urban agglomeration. The carbon intensity in Hebei is estimated to be 2.58 tons per 104 RMB in 2030, which is 3.79 times the predicted level for Beijing and 2.55 times the predicted level for Tianjin. Hebei is the home of many energy-consuming industrial enterprises, which have been transferred from Beijing and Tianjin. Extensive development and inefficient industrial structures in Hebei are predicted to create high carbon intensity [29]. The low levels of carbon emissions and intensities in Beijing and Tianjin result from efficient economic development, advanced manufacturing equipment, and mature technology [30].
Beijing, Tianjin, and Hebei are predicted to undertake varying emission reduction responsibilities to achieve China’s total carbon intensity reduction targets in 2030 (Table 1). The differentiated reduction quotas are consistent with the Common but Different Responsibilities (CBDR) proposed by the Chinese government [13]. Hebei will bear the greatest emission reduction obligations, given its status as a gathering place of heavy industrial enterprises. A total of 146.05 and 316.80 million tons should be reduced in Hebei to achieve reduction targets of 60% and 65%, respectively. However, carbon reduction requirements significantly conflict with local economic development goals [31]. Reduction quotas for Tianjin are 11.85 and 25.70 million tons to achieve 60% and 65% reduction targets, respectively. Beijing has completed the early stages of industrialization, and the current energy consumption by its industrial sectors is assumed to be highly efficient. Therefore, Beijing has the lowest reduction responsibility among the three regions.
Table 2 compared the composition of the secondary industry in developed countries and the Jing-Jin-Ji urban agglomeration in China. The secondary industry only dominates 20.7%, 16.8%, and 26.9% of the total industry in the United States, the United Kingdom, and Japan, respectively. The secondary industry dominates approximately 89.4%, 81.9%, and 42.6% of the total mitigation responsibility of Hebei, Tianjin, and Beijing, respectively. It is known that a structural bonus (economic benefits arising from the rationalization of economic structure) benefits energy intensity, meaning that optimization and adjustments to the industrial structure could support decreased emissions [32,33,34]. For example, the rise in the proportion of the tertiary industry plays a positive role in reducing carbon emissions [35]. In consequence, Jing-Jin-Ji urban agglomeration still has great potential to further upgrade the industrial structure and develop a low-carbon economy.

4.2. Industrial Sectors’ Carbon Emissions in 2030

Reducing carbon emissions requires joint efforts from different industrial sectors (listed in Table 3). In this study, we predicted the carbon emissions and intensities of 37 sectors in the secondary industry in 2030 (shown in Figure 3). All 37 industrial sectors are predicted to emit a total of 21.02, 94.70, and 419.86 million tons of carbon dioxide in Beijing, Tianjin, and Hebei, respectively. The major carbon emitters include energy production sectors and heavy manufacturing sectors. For example, S35 (Production and Supply of Electric Power, Steam, and Hot Water) is a typical energy production sector, generating approximately 50% of the total carbon emissions at the national scale [36]. In this study, S35 is forecasted to discharge carbon emissions of 17.31, 46.99, and 142.61 million tons in Beijing, Tianjin, and Hebei, respectively; the corresponding carbon intensities are predicted to be 0.99, 6.31, and 4.92 tons/104 RMB, respectively. S24 (Smelting and Pressing of Ferrous Metals) is one of the four most energy-intensive industries, with a high potential to support energy conservation and decrease emissions [37]. S24 is expected to discharge carbon emissions of 0.14, 35.80, and 208.74 million tons in Beijing, Tianjin, and Hebei, respectively, accounting for 0.68%, 37.80%, and 49.70% of the total emissions from the secondary industry in the three respective provinces.
The sectors with lower carbon emissions and intensities are mainly those engaged in light manufacturing and high-tech industries, i.e., S11 (Leather, Furs, Down, and Related Products), S12 (Timber Processing, Bamboo, Cane, Palm Fiber, and Straw Products), S32 (Instruments, Meters, Cultural and Office Machinery), and S33 (Other Manufacturing Industry). S11 is predicted to generate carbon emissions of 0.001, 0.01, and 0.15 million tons in Beijing, Tianjin, and Hebei in 2030, with the intensities of 0.04, 0.02, and 0.02 tons/104 RMB, respectively. Carbon emissions from light manufacturing sectors are mainly from the widespread use of obsolete production equipment [38] and the lack of core technology [39]. In the 12th Five-Year Plan (completed well by the end of 2015), these industrial enterprises were required to establish the goal of green production. With clear government directives and effective control technology, these light manufacturing sectors have seen low direct carbon emissions currently and will witness declining trends of emissions in the future.
The high-tech industry sectors refer to five sectors aiming at producing with high and new techniques, including S30, S31, S32, S33, and S34. Since high-tech industry sectors give consideration to both production efficiency and environmental protection, these sectors emit relatively low carbon emissions, which contributes to the realization of the 2030 carbon reduction targets [16]. Carbon emission intensities of high-tech industry sectors remained at a consistently low level in these three provinces. Especially in Beijing, S30 and S34 have the least carbon intensities among the 37 industrial sectors, namely 0.004 and 0.006 104 tons/RMB. The Chinese government and the local government in the Jing-Ji-Ji urban agglomeration have made efforts to support the development of high-tech industry sectors in order to mitigate carbon emissions and to improve the core competitiveness of cities. Taking S34 for instance, the Chinese government implements a plan of industrial resources comprehensive utilization industry coordinated development in Jing-Jin-Ji and its surrounding areas (2015–2017) aiming at achieving the effective reuse of industrial scrap and wastes and exploring a new mode of synergistic development in S34. The plan projects to realize a reduction of carbon emissions by 4 million tons per year [40]. Relevant policies have provided effective guidance for the expansion of the production scale and carbon reduction in the high-tech industry sectors in the Jing-Jin-Ji urban agglomeration. Local governments also need to consider accelerating technological exchanges and cooperation to promote more efficient and cleaner production in these industries.

4.3. Carbon Mitigation for Industrial Sectors

The optimized carbon quotas for 37 sectors of secondary production in the Jing-Jin-Ji urban agglomeration were further calculated. Key sectors sharing significant responsibility for reducing emissions were presented in Figure 4, occupying nearly 99% of the total reduction quotas. The rest sectors with carbon reduction quotas less than 250 hundred tons are listed in the Table S1. As the most prominent energy production sector, S35 has the largest responsibility to reduce carbon emissions in all three provinces; the predicted goal is to mitigate 4.34, 74.27, and 161.09 million tons of emissions for Beijing, Tianjin, and Hebei, respectively, to achieve the 65% target. At the national scale, S35 also has the largest carbon reduction quota to achieve 60% and 65% target levels in 2030 [16]. Another traditional energy production sector, S17 (Petroleum Processing and Coking), will have reduction quotas of 0.12, 0.33, and 1.32 million tons to achieve the 65% target in Beijing, Tianjin, and Hebei, respectively. The results indicated that S17 bears smaller carbon reduction quotas than S35 under the 2030 reduction targets. S23 and S24 are pillars of the high manufacturing sector and carry significant responsibilities for emission reductions. Note that the development of these four sectors may hinder the reduction of carbon emissions; however, the entire secondary industry would be hit hard without these sectors [18]. In fact, developing these sectors may greatly enhance the overall economic growth of the Jing-Jin-Ji urban agglomeration; as such, the trade-offs between industrial development and emission reduction deserve reconsideration.
The selected key emission reduction sectors varied largely among Beijing, Tianjin, and Hebei due to the differences of urban functions and industrial development levels. Hebei assumes significant responsibility for energy production in the Jing-Jin-Ji urban agglomeration. As a result, the energy production sector S1 holds the biggest reduction burden in Hebei: 4.06 and 8.80 million tons at 60% and 65% reduction targets, respectively. At the national level, Yan et al. [36] found that S1 bears responsibility for 62.49% of the total reduction target. S18 and S27, two typical heavy manufacturing sectors, bear 0.23 and 0.06 million tons, respectively, to achieve 65% reduction targets in Hebei. However, Beijing and Tianjin have very low responsibilities with respect to these sectors. This is because Hebei has a large number of heavy manufacturing industrial enterprises. In addition, S22 (Plastic Products) faces significant pressure to reduce emissions in Tianjin, with reduction quotas of 0.01 million tons to achieve the 60% target and 0.03 million tons to achieve the 65% target. In contrast, Beijing and Hebei have relatively small mitigation responsibilities.
The allocation of reduction quotas is closely associated with carbon emissions and intensities. Higher carbon intensities indicate a greater potential for emission reductions. Energy production and heavy manufacturing sectors tend to have high carbon emissions intensities. As such, these sectors are allocated the largest emission carbon reduction quotas. When the carbon intensities of two sectors are the same, the difficulty associated with sector-level carbon reductions is correlated with carbon emissions. For example, S14 (Papermaking and Paper Products) and S22 are predicted to have the same carbon intensities of 0.037 tons/104 RMB in Beijing in 2030. The carbon emissions of S14 (0.021 million tons) are predicted to be higher than those of S22 (0.012 million tons), leading to a larger mitigation responsibility being assigned to S14 compared to S22. These results were consistent with a study on the provincial allocation of carbon reduction responsibilities conducted by Wang et al. [24]. Although the results may have some uncertainties under the constraint of long time-series data, the methodology and results in our study are valid for carbon mitigation in industrial sectors at the provincial level in China.

4.4. Policy Implications

The allocation of emission reduction responsibilities at the sectoral level should be clearly defined by policymakers. Unclear responsibilities are associated with low efficiency in reducing carbon emission. Heavily energy-dependent manufacturing sectors, such as S35, S23, and S24, should be responsible for major emission reductions in the Jing-Jin-Ji urban agglomeration. These sectors should stringently control pollution emissions by transforming the extensive economic development mode, accelerating the application of advanced technologies, and eliminating underdeveloped production capacity. Light manufacturing and high-tech industry sectors should consider accelerating their transformation, moving from labor-intensive to technology-intensive approaches, and thus to improve the efficiency of energy use and further to reduce carbon emissions.
Different provinces are encouraged to introduce different and coordinated control schemes to reduce carbon emissions. Regions should exchange relevant experience to maximize the synergistic effect of low-carbon economic development. Hebei should implement clean production and energy consumption structural adjustments to promote low-carbon development and to narrow the gap with Beijing–Tianjin. Many carbon-intensive enterprises have been transferred to Hebei; as such, Beijing should appropriately subsidize Hebei.
Clean production technology and equipment should be advanced in the Jing-Jin-Ji urban agglomeration and surrounding areas to combine technological upgrades and industrial restructuring. Adjusting ineffective emission structures should play a dominant role in saving energy and reducing emissions in industrial sectors.

5. Conclusions

Consistent with the Paris Climate Agreement, China has pledged to decrease its carbon intensity by 60%–65% compared to 2005 levels by 2030. The Jing-Jin-Ji urban agglomeration, a key carbon emission center in China, was an ideal case study to allocate carbon reduction quotas in industrial sectors. This study established a nonlinear quota allocation model to achieve target carbon reduction among 37 industrial sectors in the Jing-Jin-Ji urban agglomeration at targets of 60% and 65%, respectively. The results provide insights into the carbon emission reduction, industrial structure adjustment, and the future direction of industrial sectors. The major findings and their implications for future researches over carbon mitigation are as follows.
Major energy production and heavy manufacturing sectors including S17, S18, S23, S24, and S35, discharge the main share of the total carbon emissions in the Jing-Jin-Ji urban agglomeration. In contrast, light manufacturing and high-tech industry sectors discharge small amounts of carbon emissions. Sectors with large amounts of emissions and high carbon intensities offer significant potential and face relatively little difficulty in carbon reduction, so they are assigned considerable carbon mitigation responsibilities. Due to the different urban functions and industrial development levels, the same industrial sector may assume different responsibilities for emission reduction in Beijing, Tianjin, and Hebei. Overall, this study provides a theoretical basis for carbon reduction in the Jing-Jin-Ji urban agglomeration, since it could formulate a more explicit policy to optimize the carbon emission reduction allocation mechanism. Using policy guidance and clear allocation of responsibilities, the carbon emission reductions in the Jing-Jin-Ji urban agglomeration could be further enhanced, contributing to the mutual development of the economy and environment.
There are two main limitations in our research. On one hand, predictions of future carbon emissions and intensities may not accurately reflect the real situation, which is a common flaw in all predicting methods in reality. The transformation of the industrial structure and the improvement of energy-use efficiency are not taken into account when using the average growth rate to anticipate future change. On the other hand, when distributing the mitigation quotas, the criteria of accumulated emissions responsibility, current economic capacity, and emissions efficiency are not considered in our methods. Owing to the characteristics of some industrial sectors, they are bound to emit vast proportions of carbon dioxide. Once unduly stringent industry emission mitigation targets are set to these sectors, the developments of these sectors are likely to be restrained, which leads to a negative impact on the developments of other sectors and the economic development in the whole region. We suggest constructing a more rational multicriteria model to allocate mitigation burdens among numerous economic sectors in further studies.

Supplementary Materials

The following are available online at https://www.mdpi.com/2071-1050/11/22/6383/s1, Table S1: Carbon emission reduction quotas (less than 250 hundred tons) for other sectors.

Author Contributions

Y.Z. conceptualized and designed the research, supervised the whole process, and wrote the original draft; Y.W. shared the efforts in data analysis; X.H. contributed to the methodology of the study and polished the manuscript. All authors read and approved the final manuscript.

Funding

This research was funded by the National Key Research and Development Plan of China, (Grant No. 2016YFA0602504) and the National Natural Science Foundation of China (Grant No. 31861143015).

Acknowledgments

We thank the editor and reviewers for careful review and insightful comments.

Conflicts of Interest

The authors declare no conflicts of interest regarding the publication of this paper.

References

  1. Akinyele, D.O.; Rayudu, R.K.; Nair, N.K.C.; Seah, W.K.G. Clean development mechanism projects for developing countries: Potential for carbon emissions mitigation and sustainable development. In Proceedings of the Power Systems Conference, Guwahati, India, 18–20 December 2014; IEEE: Piscataway, NJ, USA, 2015. [Google Scholar] [CrossRef]
  2. Ni, L.; Zhu, D. Study on impacts of population, consumption and technology on carbon emission in China (1990–2008) based on STIRPAT model. In Proceedings of the International Conference on Service Systems & Service Management, Tianjin, China, 25–27 June 2011; IEEE: Piscataway, NJ, USA, 2011. [Google Scholar] [CrossRef]
  3. Guo, X.; Ren, D.; Shi, J. Carbon emissions, logistics volume and GDP in China: Empirical analysis based on panel data model. Environ. Sci. Pollut. Res. 2016, 23, 1–10. [Google Scholar] [CrossRef]
  4. Luo, T.; Wang, N. Analysis of carbon emission reduction potential by clean coal technology in China. Appl. Mech. Mater. 2015, 737, 935–940. [Google Scholar] [CrossRef]
  5. United Nations Framework Convention on Climate Change. CO2 Emissions from Fuel Combustion, 2009th ed.; IEA: Paris, France, 2009. [Google Scholar]
  6. Wang, S.; Fang, C.; Sun, L.; Su, Y.; Chen, X.; Zhou, C.; Feng, K.; Hubacek, K. Decarbonizing China’s urban agglomerations. Ann. Assoc. Am. Geogr. 2019, 109, 266–285. [Google Scholar] [CrossRef]
  7. Park, J.W.; Kim, C.U.; Iscard, W. Permit allocation in emission trading using the Boltzmann distribution. Physics A 2012, 391, 4883–4890. [Google Scholar] [CrossRef]
  8. Pang, R.Z.; Deng, Z.Q.; Chiu, Y.H. Pareto improvement through a reallocation of carbon emission quotas. Renew. Sust. Energy Rev. 2015, 50, 419–430. [Google Scholar] [CrossRef]
  9. Liu, H.; Lin, B. Cost-based modelling of optimal emission quota allocation. J. Clean. Prod. 2017, 149, 472–484. [Google Scholar] [CrossRef]
  10. Wei, C.; Ni, J.; Du, L. Regional allocation of carbon dioxide abatement in China. China Econ. Rev. 2012, 23, 552–565. [Google Scholar] [CrossRef]
  11. Yu, S.; Wei, Y.M.; Wang, K. Provincial allocation of carbon emission reduction targets in China: An approach based on improved fuzzy cluster and shapley value decomposition. Energy Policy 2014, 66, 630–644. [Google Scholar] [CrossRef]
  12. Wang, K.; Zhang, X.; Wei, Y.; Yu, S. Regional allocation of CO2 emissions allowance over provinces in China by 2020. Energy Policy 2013, 54, 214–229. [Google Scholar] [CrossRef]
  13. Han, R.; Tang, B.; Fan, J.; Liu, L.; Wei, Y. Integrated weighting approach to carbon emission quotas: An application case of Beijing-Tianjin-Hebei region. J. Clean. Prod. 2016, 131, 448–459. [Google Scholar] [CrossRef]
  14. Zhang, Y.; Wang, A.; Da, Y. Regional allocation of carbon emission quotas in China: Evidence from the Shapley value method. Energy Policy 2014, 74, 454–464. [Google Scholar] [CrossRef]
  15. Han, R.; Yu, B.; Tang, B.; Liao, H.; Wei, Y. Carbon emissions quotas in the Chinese road transport sector: A carbon trading perspective. Energy Policy 2017, 106, 298–309. [Google Scholar] [CrossRef]
  16. Zhao, R.; Min, N.; Geng, Y.; He, Y. Allocation of carbon emissions among industries/sectors: An emissions intensity reduction constrained approach. J. Clean. Prod. 2016, 142, 3083–3094. [Google Scholar] [CrossRef]
  17. Chen, W.; He, Q. Intersectoral burden sharing of CO2 mitigation in China in 2020. Mitig. Adapt. Strateg. Glob. Chang. 2014, 21, 1–14. [Google Scholar] [CrossRef]
  18. Zhang, Y.; Hao, J. Carbon emission quota allocation among China’s industrial sectors based on the equity and efficiency principles. Ann. Oper. Res. 2017, 255, 117–140. [Google Scholar] [CrossRef]
  19. The State Council. The 12th Five-Year Plan Program on Curbing Greenhouse Gases Emission. Available online: http://www.gov.cn/xxgk/pub/govpublic/mrlm/201201/t20120113_64719.html (accessed on 24 June 2019).
  20. China Statistics Bureau. China Statistical Yearbook; China Statistics Press: Beijing, China, 2018. [Google Scholar]
  21. Sun, W.; Mao, L.; Tang, Z. Research on the non-capital function decentralization sequence based on the sensitivity model. Geogr. Res. 2016, 35, 1819–1830. [Google Scholar] [CrossRef]
  22. Liu, H.; Lin, M.; Li, G. Spatial-temporal evolution pattern of unbalanced economic development in Beijing-Tianjin-Hebei region since the 1990s. Geogr. Res. 2016, 35, 471–481. [Google Scholar] [CrossRef]
  23. CEADs. National Emission Inventory 2000–2015. Available online: http://www.ceads.net/data/inventory-by-sectoral-approach/ (accessed on 20 June 2019).
  24. Wang, X.; Cai, Y.; Xu, Y.; Zhao, H.; Chen, J. Optimal strategies for carbon reduction at dual levels in china based on a hybrid nonlinear grey-prediction and quota-allocation model. J. Clean. Prod. 2014, 83, 185–193. [Google Scholar] [CrossRef]
  25. Ellerman, D.; Decaux, A. Analysis of Post-Kyoto CO2 Emissions Trading Using Marginal Abatement Curves; MIT Joint Program on the Science and Policy of Global Change, Report 40; MIT: Cambridge, MA, USA, 1998. [Google Scholar]
  26. Nordhuas, W.D. The cost of slowing climate change: A survey. Energy 1991, 12, 37–66. [Google Scholar] [CrossRef]
  27. Zhu, L.; Zhang, X.B.; Fan, Y. A non-linear model for estimating the cost of achieving emission reduction targets: The case of the U.S. China and India. J. Syst. Sci. Syst. Eng. 2012, 21, 297–315. [Google Scholar] [CrossRef]
  28. Mustafa, H.B.; John, M.; Reilly, M.M.; Richard, S.E.; Ian, S.W.; Robert, C.H. The MIT Emissions Prediction and Policy Analysis (EPPA) Model: Revisions, Sensitivities, and Comparisons of Results. Available online: https://dspace.mit.edu/bitstream/handle/1721.1/3574/MITJPSPGC_Rpt71.pdf?sequence=1 (accessed on 11 June 2019).
  29. Xin, T.; Xuesen, L.; Lin, T. Gray correlative empirical research on carbon emissions and influencing factors in Hebei Province. In Proceedings of the 29th Chinese Control and Decision Conference (CCDC), Chongqing, China, 28–30 May 2017; IEEE: Piscataway, NJ, USA, 2017. [Google Scholar] [CrossRef]
  30. Wang, Z.; Yang, L. Delinking indicators on regional industry development and carbon emissions: Beijing–Tianjin–Hebei economic band case. Ecol. Indic. 2015, 48, 41–48. [Google Scholar] [CrossRef]
  31. Wang, D.; Guo, H. A study on development policy of low-carbon city. Appl. Mech. Mater. 2014, 641-642, 1058–1061. [Google Scholar] [CrossRef]
  32. Wu, Y. Energy intensity and its determinants in China’s regional economies. Energy Policy 2012, 41, 703–711. [Google Scholar] [CrossRef]
  33. Li, K.; Lin, B. The nonlinear impacts of industrial structure on China’s energy intensity. Energy 2014, 69, 258–265. [Google Scholar] [CrossRef]
  34. Mi, Z.; Pan, S.; Yu, H.; Wei, Y. Potential impacts of industrial structure on energy consumption and CO2 emission: A case study of Beijing. J. Clean. Prod. 2015, 103, 455–462. [Google Scholar] [CrossRef]
  35. Zhang, Y.J.; Liu, Z.; Zhang, H.; Tan, T.D. The impact of economic growth, industrial structure and urbanization on carbon emission intensity in China. Nat. Hazards 2014, 73, 579–595. [Google Scholar] [CrossRef]
  36. Yan, Q.; Wang, Y.; Baležentis, T.; Sun, Y.; Streimikiene, D. Energy-related CO2 emission in China’s provincial thermal electricity generation: Driving factors and possibilities for abatement. Energies 2018, 11, 1096. [Google Scholar] [CrossRef]
  37. Lin, B.; Tan, R. Ecological total-factor energy efficiency of China’s energy intensive industries. Ecol. Indic. 2016, 70, 480–497. [Google Scholar] [CrossRef]
  38. Cao, H.; Du, Y.; Chen, Y. Exploring a new low-carbon development paradigm for China’s future manufacturing sectors. J. Sci. Technol. Policy China 2012, 2, 159–170. [Google Scholar] [CrossRef]
  39. Lin, Y.; Yao, Y.; Zhang, J.; Xian, Z.; Mcalinden, K.J. A CGE analysis of carbon market impact on CO2 emission reduction in China: A technology-led approach. Nat. Hazards 2016, 81, 1107–1128. [Google Scholar] [CrossRef]
  40. The State Council. Beijing-Tianjin-Hebei and its Surrounding Areas Industrial Resources Comprehensive Utilization Industry Coordinated Development Action Plan (2015–2017). Available online: http://www.scio.gov.cn/xwfbh/xwbfbh/wqfbh/33978/34204/xgzc34210/Document/1469694/1469694.htm (accessed on 29 June 2019).
Figure 1. Time series showing carbon emissions and annual growth rate in the Jing-Jin-Ji urban agglomeration.
Sustainability 11 06383 g001
Figure 2. Carbon emission percentages from three industries from 2000 to 2015.
Sustainability 11 06383 g002
Figure 3. Predicted carbon emissions from industrial sectors in 2030.
Sustainability 11 06383 g003
Figure 4. Carbon emission reduction quotas for key sectors. The orange and green pillar represents the allocation responsibility of carbon emission reduction under the 60% and 65% targets, respectively.
Sustainability 11 06383 g004
Table 1. Carbon emissions, intensity, and target reduction for the Jing-Jin-Ji urban agglomeration in 2030.
RegionsEmissions in 2030 (106 ton)Emission Intensity in 2030 (ton/104 RMB)Target ReductionTarget Reduction for the Secondary Industry
60% (104 ton)65% (104 ton)60% (104 ton)65% (104 ton)
Beijing152.410.68482.591046.75229.42497.63
Tianjin251.191.011184.672569.58986.402139.52
Hebei1213.862.5814,605.6531,680.1313,257.5928,756.14
Table 2. The composition of secondary industry in developed countries and in China’s Jing-Jin-Ji urban agglomeration (%).
YearUnited StatesUnited KingdomJapanBeijingTianjinHebei
200522.0026.2030.2064.7080.9090.40
201021.4021.1028.0054.9082.7090.90
201520.7016.8026.9042.6081.9089.40
Table 3. Industrial sectors and their abbreviations.
Industrial SectorsAbbreviationClassification
Coal Mining and DressingS1Energy production
Petroleum and Natural Gas ExtractionS2Energy production
Ferrous Metals Mining and DressingS3Heavy manufacturing
Nonmetal Minerals Mining and DressingS4Heavy manufacturing
Food ProcessingS5Light manufacturing
Food ProductionS6Light manufacturing
Beverage ProductionS7Light manufacturing
Tobacco ProcessingS8Light manufacturing
Textile IndustryS9Light manufacturing
Garments and Other Fiber ProductsS10Light manufacturing
Leather, Furs, Down, and Related ProductsS11Light manufacturing
Timber Processing, Bamboo, Cane, Palm Fiber, and Straw ProductsS12Light manufacturing
Furniture ManufacturingS13Light manufacturing
Papermaking and Paper ProductsS14Light manufacturing
Printing and Record Medium ReproductionS15Light manufacturing
Cultural, Educational, and Sports ArticlesS16Light manufacturing
Petroleum Processing and CokingS17Energy production
Raw Chemical Materials and Chemical ProductsS18Heavy manufacturing
Medical and Pharmaceutical ProductsS19Light manufacturing
Chemical FiberS20Heavy manufacturing
Rubber ProductsS21Heavy manufacturing
Plastic ProductsS22Heavy manufacturing
Nonmetal Mineral ProductsS23Heavy manufacturing
Smelting and Pressing of Ferrous MetalsS24Heavy manufacturing
Smelting and Pressing of Nonferrous MetalsS25Heavy manufacturing
Metal ProductsS26Heavy manufacturing
Ordinary MachineryS27Heavy manufacturing
Equipment for Special PurposesS28Heavy manufacturing
Transportation EquipmentS29Heavy manufacturing
Electric Equipment and MachineryS30High-tech industry
Electronic and Telecommunications EquipmentS31High-tech industry
Instruments, Meters, Cultural, and Office MachineryS32High-tech industry
Other Manufacturing IndustryS33High-tech industry
Scrap and wasteS34High-tech industry
Production and Supply of Electric Power, Steam, and Hot WaterS35Energy production
Production and Supply of GasS36Energy production
Production and Supply of Tap WaterS37Heavy manufacturing

