Article

The Relationship between Social Responsibility and Business Performance: An Analysis of the Agri-Food Sector of Southeast Spain

by
Antonio Martos-Pedrero
1,*,
Francisco Joaquín Cortés-García
2 and
David Jiménez-Castillo
3
1
Faculty of Human and Social Sciences, University of Almería, Ctra. Sacramento, s/n, 04120 La Cañada, Almería, Spain
2
Faculty of Business and Management, Universidad Autónoma de Chile, 7500912 Santiago, Chile
3
Department of Economics and Business, Research Center CIMEDES, University of Almeria (ceiA3), Ctra. Sacramento, s/n, 04120 La Cañada, Almería, Spain
*
Author to whom correspondence should be addressed.
Sustainability 2019, 11(22), 6390; https://doi.org/10.3390/su11226390
Submission received: 14 October 2019 / Revised: 1 November 2019 / Accepted: 12 November 2019 / Published: 14 November 2019
(This article belongs to the Section Economic and Business Aspects of Sustainability)

Abstract

:
This study aims to contribute to the existing debate on the impact of corporate social responsibility (CSR) orientation on different measures of business performance through the proposal of a conceptual model. Drawing on stakeholder theory, we conceptualize CSR as a broad and multidimensional construct with seven dimensions: employees, partners, customers, farmers, environment, community, and competition. We also extend the concept of business performance, which includes tangible variables, namely financial performance (FP) and export performance (EXP), as well as intangible variables, namely image and reputation (IR) and the satisfaction of relevant stakeholders (SS). The research context of this study is the agri-food sector in southeastern Spain. This sector has been the focus of attention of numerous researchers due to the relevance that social and environmental aspects have had in its development. To test the proposed model, the partial least-squares technique (PLS-SEM) was applied to data collected by means of a survey from a sample of 107 companies, which represent 81.4% of the turnover of the sector analyzed. The results show that CSR has a positive effect on financial performance, improves the volume and performance of exports, positively affects the corporate image and reputation, and increases the level of satisfaction of relevant stakeholders. Further research should examine the model from the perceptions of other stakeholders (e.g., customers, employees, and suppliers), using a longitudinal research design and exploring other contexts.

1. Introduction

In recent decades, there has been growing interest in corporate social responsibility (CSR), both from academia and business. To this, we can also add the pressures from an increasingly demanding society, one that is sensitive to irresponsible business behavior (i.e., firms’ behaviors which do not consider the impact their activities have on society and environment); the pressure from public institutions at both national and international levels through different guidelines and regulatory developments; and the pressure from other agents operating in the market. In addition, the significant growth of competition in all markets has prompted companies to differentiate themselves in ways other than traditional ones (e.g., price, product quality, design, advertising), embracing the value of certain intangible assets such as reputation and relationships with its internal and external stakeholders.
Despite the numerous studies that have analyzed the relationship between CSR and business performance in recent decades, the findings are not entirely conclusive [1], keeping academia interested in deepening their understanding of this relationship. Although most of the studies suggest a positive relationship between both variables [2,3,4,5,6,7,8,9], the truth is that there are also many studies that suggest that this relationship is zero or negative [10,11,12,13,14,15]. One of the reasons for this lack of consensus stems from the existence of different conceptualizations of CSR and business performance, as well as different measurement methodologies and different models used to analyze the relationship between both variables.
CSR is a concept that covers a broad spectrum of aspects, making it a complex phenomenon to analyze. This has led to various definitions in the literature in terms of perspectives and interests [16], which has generated some confusion about how to define it in the field of business management. There are a variety of theories, theoretical perspectives, and definitions, as well as several frames of reference that explain their dimensionality. Although most empirical studies have used the so-called ethical, sustainable, or socially responsible stock indices for the measurement of CSR, some researchers have chosen to develop their own measurement scales. Many authors [17,18,19,20] have developed their own measurement scales based on Carroll’s model [21], which considers CSR as a four-dimension concept: economic, legal, ethical, and discretionary. Socially responsible companies need to be profitable, comply with law and certain ethical standards, and get involved with discretionary activities that meet the social needs. Other authors [22,23,24] based their studies on the perspective of sustainable development [25] which considers CSR as a three-dimension construct: economic, social, and environmental. Socially responsible companies need to ensure success in their business and contribute with social development and environmental protection. Other authors [4,10,26,27,28,29,30] have developed their measurement scales based on stakeholder theory, which considers that socially responsible companies need to take into account the interests of every group of people than could affect, directly or indirectly, to their activities [31]. In our study, we developed a measurement scale based on the stakeholder theory, as this is the most used for the development of CSR proposals and the one adopted by numerous organizations that regulate or promote it. We identified the dimensions of this construct as employees, partners, customers, farmers, environment, community, and competition.
Business performance has been linked, in most empirical studies, with financial performance in terms of sales, market share, profitability, and productivity. However, we consider, in line with other authors, [32,33,34] that in such complex and competitive environments as the current one, business performance goes beyond financial performance, and must take into account other intangible assets that are decisive for the survival and development of companies such as image and reputation (IR) and the level of satisfaction of their principal or critical stakeholders (SS). Some researchers include certain intangible assets such as customer satisfaction [35,36,37] or reputation [36,38] in their analysis models as mediating variables in the relationship between CSR and financial performance (FP). However, none of the studies reviewed analyze the specific impact of CSR on the four types of performance contemplated in this research within the same model.
This work aims to analyze CSR through a multidimensional approach based on stakeholder theory and examines its direct effect on different types of performance in companies in the agri-food sector that operate in environments directed at international markets. From the broader perspective of business performance, we analyze four types of performance within the same model, by considering two tangible and two intangible variables. With regards to the tangible variables, in addition to FP, in terms of sales, market share, profitability, and productivity, we also include export performance (EXP), in terms of volume and profitability of exports, as determining elements of the business performance of these companies. We also include two components of business performance considered to be intangible variables, namely IR and SS. We focus on analyzing their effects in the agri-food context and, in particular, in the fruit and vegetable sector of southeastern Spain, which is of special interest and relevance since its evolution has been marked by social and environmental aspects, as demonstrated in various works. By referring to a specific sector, we can avoid the possible distortion of the results and conclusions of the study which according to Godfrey and Hatch [39] could result from the use of multiple samples belonging to several sectors. In addition, as the sector is especially sensitive to CSR activities, the results may be more consistent [1]. Although the agri-food sector has been extensively examined in the literature [40], most studies on CSR have focused on other industrial sectors. Even when they have studied the agri-food sector, they have done so, principally, from the perspective of suppliers [41] or customers [42]. There are very few studies [43,44] that study CSR in the agri-food sector from a more disaggregated global approach that takes into account the point of view of managers and includes, in the same model, not only customers and farmers but also other stakeholders such as employees, partners, the environment, the community, and competition.
In contrast, many of the researchers who have included intangible variables in their models that examine the relationship between CSR and FP [35,36,37,38], have considered them mediating variables in that relationship. However, this research examines the direct impact of CSR on the tangible (FP and EXP) as well as the intangible (IR and satisfaction of relevant stakeholders) variables of business performance.
Consequently, this research aims to improve understanding of the nature and composition of CSR in the agri-food sector, as well as verify its effectiveness in terms of business performance. It seeks to demonstrate if the companies in this sector that apply CSR policies can improve their financial results, the volume and profitability of their exports, improve their IR and raise the level of satisfaction of their principal stakeholders (employees, customers, and farmers), beyond the mere economic benefits, thereby favoring customer loyalty, employee engagement, and the generation of stable and strategic relationships with farmers. This paper includes a review of the concept of CSR as a multidimensional phenomenon and its importance in the agri-food sector. Next, the theoretical model is presented with the hypotheses that are intended to be tested. Subsequently, the methodological section is developed, and the results obtained after applying the partial least-squares technique (PLS-SEM) to the proposed model are shown. Next, the main theoretical contributions of the study are identified and practical recommendations for managers are proposed. Finally, we warn of some limitations of the study and suggest future lines of research.

2. Conceptual Framework

2.1. CSR As a Multidimensional Phenomenon: Approaches and Conceptualization

As already mentioned, there is no consensus about the proper definition for the concept of CSR or what is the precise way to apply it to the field of business management. There are numerous definitions provided by academic literature and by organizations and institutions involved in CSR. However, some concurrent elements can be extracted from a series of highly cited definitions found in the literature [10,16,45,46,47,48,49,50,51]. CSR is understood as the company’s assumption of a series of voluntary responsibilities [16,45], which go beyond legal and regulatory requirements [10] and that involve a long-term commitment to incorporate the interests of the plurality of agents involved in or affected by its management decisions [46,47,48]. It is a strategic and proactive way of doing business, beyond social action and marketing, which must consider and balance economic, environmental and social aspects [49,50]. It should be understood as an investment that can help improve the competitiveness of a company [51].
Based on the above, in our research, we define CSR as the voluntary, proactive and strategic commitment of the company to satisfy the needs of its stakeholders as well as preserve the environment, beyond legal requirements, and whose development and application can create long-term value. Thus, a definition of CSR is proposed that seeks to collect the concurrent elements of some of the most cited definitions in the literature and in which environmental issues stand out as being of crucial importance in the agri-food context.
Given the variety of theories, theoretical perspectives, and existing definitions on CSR, there are also several frames of reference that explain the dimensions of the concept. In recent decades, most empirical studies have used three different approaches: one based on Carroll’s theory [21], one elaborated from the perspective of sustainable development and one which is based on stakeholder theory. Carroll [21] elaborates a multidimensional definition of CSR which links the economic and legal responsibilities of the company with its social responsibilities. It defines four dimensions which in turn are dependent on each other. To wit, that companies meet the expectations of society that they be profitable (economic dimension), that they attain their economic objectives subject to the established legal framework (legal dimension), that their behavior and business practices satisfy certain ethical standards (ethical dimension), and that they be voluntarily involved in activities that meet social needs (discretionary dimension).
The perspective of sustainable development [25] supports the discourse of the need to integrate economic, social, and environmental issues for the company to guarantee long-term business success, contribute to economic and social development as well as protect the environment. From this standpoint, the responsible behavior of a company implies the creation of value for shareholders, customers, suppliers and employees (economic dimension); accepting the legal and socio-cultural standards of the society in which it operates; actively participating in the improvement of the general welfare of the society (social dimension); and contributing to sustainable development with a response for the externalities generated that go beyond compliance with current legislation in environmental protection.
With regards to stakeholder theory [52,53,54], it presents the company as an organization composed of a plurality of agents that intervene in or are affected by its management decisions. Consequently, companies must take into account not only the management of their resources and operations, but also the interests of all persons or groups of people that may directly or indirectly affect the development of their activities [31]. The instrumental approach of this theory [31] establishes the need to consider the interests of the stakeholders to maximize profits. Acting responsibly with stakeholders, through a process of dialogue that allows the company to detect and identify their expectations and ultimately leads to the best long-term results for all, including shareholders. To implement CSR in business management, a proper identification of stakeholders is essential depending on the sector, the company, and the geographical location. Mitchell et al. [53] classify stakeholders according to the relationship attributes of power, legitimacy, and urgency and identify different types according to whether they possess one, two, or three of those attributes. Wheeler and Sillanpää [54] established a classification based on the degree of implication of stakeholders in the activity of the company, distinguishing between primary (indispensable for company operations) and secondary (with influence, but without direct involvement in the company’s operations).
Based on this theoretical perspective, and in line with existing research [26,27,28,29,30], we have characterized CSR as a seven-dimensional construct including shareholders, employees, customers, farmers, the environment, community, and competition. Due to the special relevance that environmental issues have in the agri-food sector, we include, in line with some authors [26,28,29,30], the environmental dimension, which contributes to offering a broader or holistic view of the phenomenon.

2.2. CSR in the Agri-Food Sector
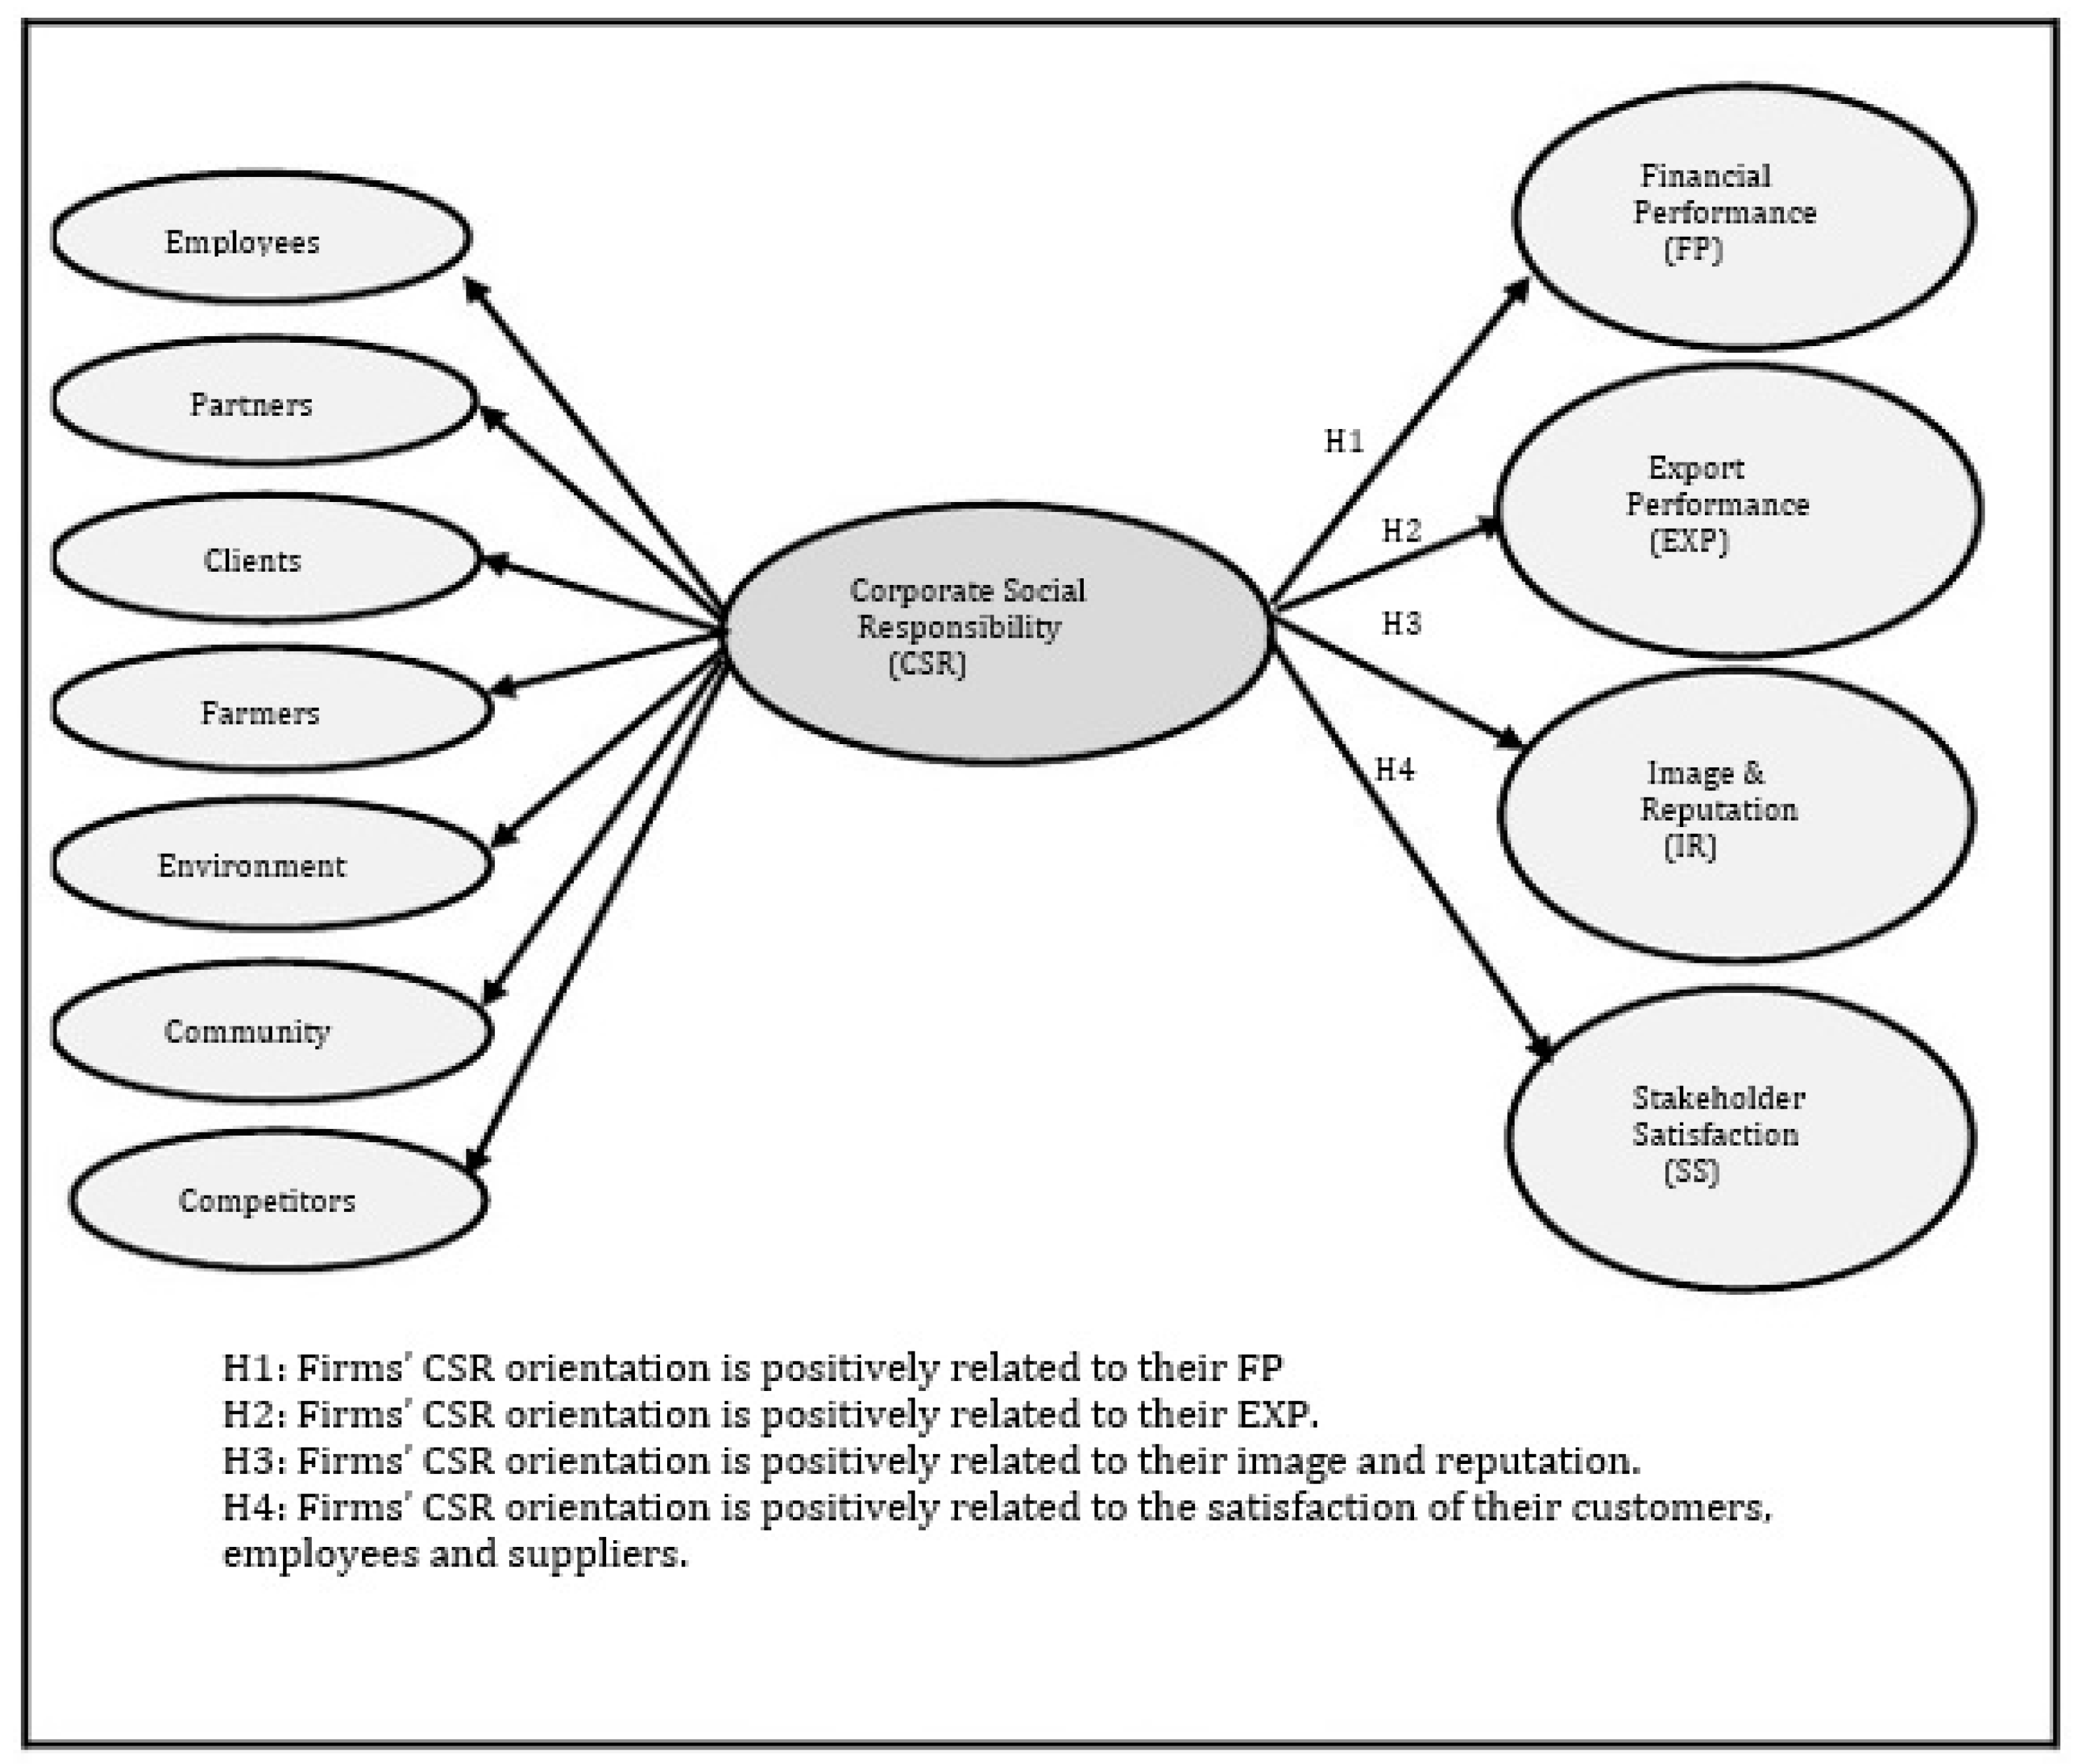
The agri-food sector currently operates in an environment characterized by the existence of more informed and demanding markets in which consumers demand information, not only about the characteristics and quality of the product, but also on its origin, the production process, its ecological characteristics, and the social impact of the production chain. This has led to a significant increase in pressure regarding social and environmental requirements and guarantees, which affect all agents and that may constitute a threat to the reputation and legitimacy of both companies and the sector itself [40,55]. In this context, the main challenge of the sector is to achieve levels of productivity that ensure self-sustainability, while at the same time, ensure balanced local or regional development and an efficient use of natural resources that reduce negative externalities [56].
To understand the importance of CSR in the agri-food sector, it is necessary to understand the concept of multifunctionality as one of its most notable features [57,58,59]. This concept refers to all those functions performed by this sector that go beyond its traditional objective of production and distribution of raw materials and food under competitive conditions (i.e., economic function). The decisions of the agents in this sector can have an immediate, positive or negative, impact on the environment (i.e., environmental function) and can contribute to the viability of rural areas and to a balanced development from the territorial point of view (i.e., social function). This multifunctional character demonstrates the importance and the need to promote CSR practices in this sector. Despite this, most studies on CSR have focused on other industrial sectors, rather than on the agri-food sector and they have approached it from the perspective of a single stakeholder or have dealt with specific issues such as ecological aspects or biodiversity [55]. However, authors such as Luhmann and Theuvsen [55] point out the need for studies that analyze the relevant stakeholders in the sector and their requirements more fully, with a research design that determines the impact of CSR on both financial and non-financial results.
In line with this proposal, this research aims to analyze, from the point of view of the managers of the companies in the sector, the impact of CSR which in turn is understood to be a multidimensional construct with the participation of all relevant stakeholders, on their financial results (FP and EXP) and non-financial (IR and SS).

3. Hypothesis

This work aims to analyze the impact of CSR, as a multidimensional concept, on different indicators of business performance. For this, we consider business performance, in line with the opinion of numerous authors [32,33,60,61,62,63], as a broad concept that covers both financial and non-financial indicators. In addition to the tangible results measured through FP and EXP, we include other intangible elements, such as IR and satisfaction of relevant stakeholders in our model. These are decisive for the long-term survival and growth of companies (see Figure 1).

3.1. CSR and FP

Although there is no consensus on which instrument to apply for the measurement of FP, a fact which complicates the comparison of the results of the different studies, most of them use objective measurement models based on accounting measures [4,64], financial market measures [65], or mixed accounting and financial measures [66]. Measures such as return on assets (ROA), return on investment (ROI), earnings before interest taxes depreciation and amortization (EBITDA), market share or sales growth, market value (market capitalization), total shareholder return (TSR), economic value added (EVA), or Tobin’s Q, are the most frequent in studies that analyze the link between CSR with FP.
At a theoretical level, numerous works have explained the positive impact of CSR on certain elements of the competitiveness of companies related to their FP, such as improving access to capital markets and reducing capital costs [67,68], the improvement in the efficiency of processes [68], the reduction and improvement of risk management [67] or the improvements in innovation and product development [69]. Stakeholder theory also suggests this positive association [52]. In addition, most empirical studies [2,3,4,5,6,7,8,9] suggest a positive relationship between both variables, i.e., that higher levels of CSR lead directly to higher levels of FP. In line with these theoretical arguments and the results of previous works, we propose the following hypothesis:
Hypothesis 1 (H1):
Firms’ CSR orientation is positively related to their FP.

3.2. CSR and EXP

In line with Cavusgil and Zou [64], we define EXP as the degree to which a company achieves its export objectives, through the execution of a specific marketing strategy (market expansion, increased market share abroad, etc.), or financial (profits, sales, costs, etc.). Thus, we identify EXP with the level of satisfaction that a company has about the evolution of its exports and its relation to total sales, the evolution of its market share in its main foreign market and the general performance of the same.
CSR can be considered to be one of the fundamental elements of a company’s differentiation strategy [65]. It facilitates its positioning and that of its products to its clients and other stakeholders as environmentally or socially responsible [66], differentiating itself in foreign markets and improving the performance of its exports. Possessing a social or environmental certification, producing product or using suppliers with social or environmental certification and with a reputation for being socially and environmentally responsible are elements that contribute to a differentiation strategy based on CSR which can lead to a company attaining a unique position in the market [66]. Authors such as Boehe and Barín [66], Barín et al. [70], Motlaghi and Mostafavi [71] and Theoharakis et al. [72] suggest, in their empirical work that CSR can contribute to a strategy of differentiation at the product and company level in export markets and, therefore, can improve export performance. The context of these works was different sectors in emerging economies during periods of reduced export competitiveness. From this line of argument, the following hypothesis is proposed:
Hypothesis 2 (H2):
Firms’ CSR orientation is positively related to their EXP.

3.3. CSR and Image and Reputation

Image refers to the set of impressions, perceptions, information, expectations, attitudes, beliefs, and feelings that different stakeholders, both internal and external, have about the characteristics and activities of a company [73]. Reputation refers to the representative perception of a company, based both on its performance in the past, and on future projections [74]. It is a synthesis of the opinions, perceptions and attitudes of a company’s stakeholders [75] and a reflection of the knowledge of the true characteristics of a company and the emotions that its stakeholders feel towards it [76]. Image has a conjunctural nature and can be modeled relatively quickly through appropriate advertising and communication programs. Reputation, however, has a more structural character, is more stable and is configured through a process of historic accumulation [77].
IR represents two intangible assets, difficult to imitate, that allows companies to obtain solid and sustainable competitive advantages over time, to the extent that they can differentiate themselves from the competition, demonstrate loyalty to their customers, access capital markets and attract better workers [18].
CSR positively influences the opinions of stakeholders and is considered to be a sign that the company will take into account their interests and expectations [78,79], opinions, which, in short, form the basis of its reputation [80]. There are numerous works that show a positive relationship between CSR and IR in different economic sectors [18,78,79,80,81,82,83,84]. In line with these findings, we propose the following hypothesis:
Hypothesis 3 (H3):
Firms’ CSR orientation is positively related to their image and reputation.

3.4. CSR and Satisfaction of Relevant Stakeholders

The level of satisfaction of a company’s stakeholders is determined by the level of fulfillment of their expectations [85]. In the context of this study and according to the criteria of power, legitimacy, and urgency established by Mitchell et al. [53], we have considered clients, employees, and suppliers as principal or critical stakeholders. As will be seen later, this identification was supported by the opinion of the members of a panel of experts.
CSR requires the company to have greater knowledge of the expectations and interests of its stakeholders, as well as modify its policies, objectives, and priorities to adapt to those expectations and interests. It also requires greater transparency with regards to the company’s relationships with its stakeholders and the implementation of consultation and participation processes that allow their opinions to be taken into account in the company’s decisions in situations that affect them [86]. All these elements increase the level of satisfaction of stakeholders beyond economic benefits. Numerous studies suggest the existence of a positive impact of CSR on customer satisfaction and loyalty [37,87,88,89], on job satisfaction and employee commitment to the objectives and values ​​of the company [90,91,92,93,94,95] and on the satisfaction of its suppliers, facilitating the generation of stable and strategic relationships for the future based on trust [96,97]. In line with these results, we propose the following hypothesis in this investigation:
Hypothesis 4 (H4):
Firms’ CSR orientation is positively related to the satisfaction of their customers, employees, and suppliers.

4. Methodology

4.1. Measurement

For the measurement of the constructs that make up the model, a list of items was generated based on a review of the existing empirical and theoretical research literature. In line with the guidelines established by Skjong and Wentworht [98], these items were subsequently reviewed by a panel composed of 13 experts: seven researchers, five representatives from the business world and a representative from the public sector.
A subjective measurement model based on the perception of managers was employed. A disadvantage of the use of such measures is that they may be affected by psychological biases that may lead to non-representative results.
We designed the survey using some procedures to control for these potential biases. First, the people surveyed should have a broad, transversal, and deep knowledge of the company. Second, we ensured that the concepts were clearly defined and that the measurement items represent them clearly and concisely [98,99,100]. Before the development of the questionnaire, we reviewed with the panel of experts the clarity and precision when defining the variables and their dimensions, as well as when choosing the exact wording for the items incorporated in this survey. Third, we guaranteed the anonymity of every people surveyed to reduce the bias resulting from the tendency to give socially desirable answers. Fourth, every company were offered to have and executive report with the main results of the study contacting the researchers. We consider this could also help to reduce the potential bias as it may encourage honest, truthful survey answers.
CSR was measured using scales of multiple items adapted from those used by Öberderser et al. [26]; Dopico [27]; Luo et al. [28]; Turker [29]; and Fatma et al. [30]. We measure FP using a scale adapted from those used by Kandemir et al. [101]; Delgado and Gallardo [62]; and Calantone et al. [102]. The EXP was measured using a scale adapted from those used by Zou et al. [103]; Lages et al. [104]; and Ahimbisibwe et al. [105]. The image and reputation measurement used a scale adapted from those used by Ahearne, et al. [106]; Alvarado and Schlesinger [19]; and Martínez-Salinas and Pina-Pérez [107]. Finally, SS was measured using a scale adapted from that used by Quinn and Rohrbaugh [108]; Kumar et al. [109]; and Camisón et al. [34].
The members of the expert panel agreed that employees, customers, farmers, partners, community, competition, and the environment are to be considered stakeholders of the companies being studied, with the first three considered to principal or critical stakeholders. For the final selection of the items, the procedure followed by Zaichkowsky [110] was used. Each item was rated by each of the components of the panel of experts as: “clearly representative”, “moderately representative” or “not representative”, depending on the level of representativeness of the item with respect to the variable or construct to be measured. Subsequently, following the criteria of authors such as Ouellet [111], those items considered to be “clearly representative” were maintained by at least two thirds of the panel components, and that the remaining third part would not have considered them worse than “moderately representative”. After this review process, a battery of items was generated. The questionnaire used during data collection was designed based on the battery of items generated.
A seven-point Likert scale was used in the data collection phase, because it is the format mostly used by researchers for the measurement of perceptions [112]. The ranges of the scale were 1 = “totally disagree” to 7 = “totally agree” for the items corresponding to the CSR variable. For those items corresponding to the variables FP, EXP, IR, and SS, the scale ranged from 1 = “in no measure” to 7= “in maximum degree”.

4.2. Data Collection and Sample

We collected data from companies in the fruit and vegetable marketing sector in Almería (southeast Spain). This sector is integrated into a high-performance agricultural model based on intensive horticulture, clearly directed at foreign markets and with a strong capacity for growth and adaptation to new demands of national and international markets. Its growth has been based on family farms and businesses (which has resulted in a redistribution of income and economic well-being to a large segment of the population) and the endogenous development of marketing infrastructure and auxiliary services. In addition, this growth has been carried out with a tendency towards agro-ecological practices with a more efficient use of resources and that contributes to diminishing the impact on the environment. This agricultural model has been studied extensively in numerous works [113,114] and used as a research context in works related to CSR [115,116,117] and exports [118]. These arguments motivate its use as a context for the application of the theoretical model in the present work. Based on information extracted from the SABI –(System of Analysis of Iberian Balances) database (the main database of general information and annual accounts of Spanish companies), the sector is comprised of a total of 287 companies.
The analysis technique to be used for scale validation and hypotheses testing is structural equation modeling based on partial least square (PLS), as it is considered the most appropriate when faced with complex structural models in which there are formative and reflective indicators and when samples are small, although representative, as is the case in the present investigation [119]. To calculate the sample size required for the application of PLS technique [120], we first identify the most complex multiple regression in the conceptual model, which in this case corresponds to the variable “Employees” and also includes a scale of seven indicators. Following Cohen’s recommendations [121] and Green’s approach [122] to the tables proposed by the former, a sample size of 102 observations would be required, assuming a significance (Alpha) of 0.05 and a test power of 0.80, to achieve a moderate size (f2) effect (magnitude or estimate of the degree to which the phenomenon studied exists in the population). Likewise, Nitzl [123] indicates that for seven predictors the required sample size, considering a significance of 0.05, a power of 0.8 and a moderate size effect of 0.15, should be 103 observations. The results were obtained using G * Power software [124], as an alternative option for analyzing power and attaining the sample size that fits that power. Version 3.1.9.4 of this software was applied, and it was found that in fact, the sample size for the previous parameters was 103 observations as well. Since the sample size in this investigation is 107 observations, we can state that there is no problem as to the sample size required to apply the selected analysis technique. In addition, the criteria set by Reinartz et al. [125] suggested increasing the sample to at least 100 cases to reach acceptable levels of statistical power.
An online questionnaire was sent to a subset of 164 companies with turnovers exceeding 5 million Euros, representing 94.16% of turnover and 91.9% of employment in the sector. A total of 107 valid answers were obtained. The sample represents 37.3% of companies, 81.4% of sales and 54.7% of employment in the sector. A response rate of 65.2% of the questionnaires sent was achieved. 68% of them were answered by the president, general manager or manager of the company, 25% by those responsible for Human Resources and the remaining 7% for other charges. Table 1 present statistical summary and correlations regarding the constructs of this study.

5. Results

5.1. Identification and Evaluation of the Measurement Model

Figure 2 shows the results of the structural model. Said model consists of a total of 52 items for 11 primary constructs. It also includes a secondary construct, CSR, with seven dimensions, represented by the primary constructs: employees, partners, customers, farmers, the environment, community, and competition.
A reflective relationship of the items with respect to their corresponding latent variables is proposed, with the exception of the items of the CSR variable, with which we consider maintaining a formative relationship. This consideration is made on the basis that these items cover different aspects of the concept included in the construct and are not necessarily interchangeable and are not expected to correlate with each other [126,127,128].
To evaluate the measurement model, we use the build-up approach as suggested by Chin [129] and Aldas-Manzano [130], since it incorporates secondary constructs, measured by several primary components. The first step of this technique consists of eliminating the secondary CSR factor and linking all the related primary factors (dimensions of CSR) to all other constructs with which the secondary factor would be related.
Regarding the variables with reflective indicators, we evaluate the individual reliability of each item; internal consistency, using Cronbach’s alpha and composite reliability [131]; and convergent validity, through the average variance extracted (AVE) as developed by Fornell and Larcker [132].
To evaluate the measurement scales of the variables with formative indicators, we verify, by means of the tolerance index (TOL) and the variance inflation index factor (VIF), that there is no collinearity between them [126,133]. The maximum value of the VIF index is 3.4 for the item “Agr1”, lower than the threshold of 5, defined by Hair et al. [134]. The minimum level of the TOL index is 0.293 for the same indicator, higher than the threshold of 0.20 defined by the aforementioned author. We conclude, therefore, that there are no collinearity problems between the formative indicators.
For the analysis of the relative relevance of the constituent indicators we apply the criteria established by Hair et al. [119]. Based on this criterion, non-significant constituent indicators with loads of less than 0.50 are eliminated and which in addition have loads that are also not significant. For this we obtain the weight-to-load ratio of each indicator using the bootstrapping technique.
The results (see Table 2) indicate that there are three indicators (“Emp4”, “Emp5” and “Env1”) with non-significant weights (p > 0.05) and with loads below 0.50. In the case of “Emp4” and “Emp5”, we decide to keep them by presenting loads close to the threshold of 0.50 and which were, in addition, significant. On the other hand, the “Env1” indicator has a load of 0.244, below the threshold of 0.50, in addition to being a non-significant load (p = 0.156), so we decide to eliminate it.
The results of the estimation process allow us to conclude that there is internal consistency and convergent validity in all the factors with reflective indicators of the model (see Table 2). The loads of the items with their respective latent variable exceed the threshold of 0.707 suggested by Carmines and Zeller [135]. The application of the bootstrapping technique indicates that all loads are significant (p < 0.001 and t-value > 1.96). Both the Cronbach’s alpha and composite reliability of all the factors exceed the threshold of 0.70 set by Barclay et al. [106] and the even stricter threshold of 0.80 set by Nunnally [136] for basic research. The AVE exceeds, in all cases, the threshold of 0.50 set by Fornell and Larcker [132]. The application of the square root criterion of the AVE values, proposed by Fornell and Larcker [132] and the criterion of the ratio between heterotrait–monotrait (HTMT) correlations, proposed by Henseler et al. [137], indicate that there are no discriminant validity problems (Table 3).
As a second step of the build-up approach technique, we proceed to convert the original CSR secondary construct into a primary factor, so that this variable can be measured by its dimensions (now indicators). Since all the variables in the model now have reflective indicators, we recheck the internal consistency, convergent validity, and discriminant validity of the model.
The estimation process indicates that the loads of all the items exceed or are very close to the threshold of 0.707 suggested by Carmines and Zeller [135], being, in addition, all of them highly significant. Only the “Community” indicator has a load (0.484) below said threshold, although close to 0.505 established as a criterion for the admission of loads by Falk and Miller [138]. Said load is also significant (t = 4.64). There are no problems with reliability or convergent validity. The application of the Fornell and Larcker criterion [132] reveal problems of discriminant validity of the CSR variable with respect to the IR variable; however, the application of the alternative criterion of the ratio between the HTMT correlations [137] indicates that there is discriminant validity, since all factors have values below 0.90 [139].

5.2. Evaluation of the Structural Model

To evaluate the structural model, we use the following indices: the standardized coefficients (β); the size of the effect (f2); the R2 and Q2 statistics; as well as the PLS Predictive option. The standardized coefficients (β), calculated with the bootstrapping technique, indicate the standardized regression weights that link the latent constructs, while the effect size (f2) allows us to assess whether or not the influence of a given latent variable on a dependent construct has a substantive impact. The R2 statistic indicates the amount of variance of the construct which is explained by the model and the Q2 statistic which is calculated using the PLS blindfolding procedure, allowing us to assess the predictive relevance of the model. Finally, the predictive PLS option is presented as a more demanding option to assess such relevance or predictive performance [140]. These parameters show that CSR has a positive, high and statistically significant impact on FP (β = 0.531; f2 = 0.393; t = 8.90). Thus, the H1 hypothesis of this study is confirmed. A positive, moderate and statistically significant impact on EXP (β = 0.392; f2 = 0.181; t = 3.96) confirms the H2 hypothesis; and a positive, high and statistically significant impact on IR (β = 0.789; f2 = 1.653; t = 25.79), also confirms H3 hypothesis. Finally, a positive, high and statistically significant impact on SS (β = 0.746; f2 = 1.255; t = 19.82), also confirms the H4 hypothesis. These results are shown in Figure 2.
The values offered by PLS for R2, Q2 and predictive Q2 statistics (see Table 4) allow us to conclude that the relationships that are formulated as hypotheses have a high predictive level for all variables. R2 values exceed the minimum threshold of 0.10 set by Falk and Miller [138]. Q2 values are greater than zero, which indicates that the model has predictive capacity or relevance for all dependent variables [141]. The predictive Q2 values are also greater than 0 for all variables, except for the EXP variable.
In short, we can affirm that there is predictive capacity or relevance for all the dependent variables of the model. Only the application of predictive PLS, a much more demanding option, would indicate that there would be problems of predictive relevance for the EXP variable.
Regarding the global adjustment measures of the model in PLS, it should be noted that they are currently being developed and have been questioned by several authors [142], so we therefore need to be cautious. We have, however, applied, the most commonly used adjustment measures to date: the exact fit criteria d_ULS and d_G, and the standardized root mean square residual (SRMR) [143], for which we use the bootstrapping option for consistent PLS. The results of these adjustment measures indicate that the model meets the d_G criteria, according to Dijkstra and Henseler [144], with the SRMR close to the 0.10 threshold suggested by Ringle [145]. However, according to the criteria of Dijkstra and Henseler [144], it is ­ not suitable for d_ULS.

6. Discussion

6.1. Theorical Implications

In the present investigation, we have analyzed, drawing on stakeholder theory, the impact of CSR on the business performance of companies in the agri-food sector in southeastern Spain [52]. This theory implied a change in the vision of the company, which began by being considered an organization composed of a plurality of agents (stakeholders) involved in or affected by its management decisions. According to the instrumental approach of this theory [31], the attention paid by the company to the interests and expectations of its stakeholders can have positive effects on its performance, while allowing it to develop competitive advantages.
We have verified the direct and specific effects of CSR on different types of performance, using financial (FP and EXP) and non-financial (IR and SS) variables.
A measurement methodology based on this theory has been used which includes, along with the internal (employees, partners) and external (customers, suppliers, community, and competition) dimensions, the environmental dimension, due to its particular relevance in our research context. We have taken as a reference a specific sector especially sensitive to CSR activities, thus avoiding that the use of multiple samples belonging to several sectors which can distort the results and conclusions of the study [39].
The results suggest that the commitment assumed by the companies of the agri-food sector of the southeast of Spain with regards to ​​CSR has a positive effect on their FP, which is aligned with the instrumental approach of stakeholder theory [31] and with the numerous previous works that confirm the “hypothesis of social impact” [2]. These results also suggest that the CSR of the companies in that sector results in an improvement in their EXP. This is in line with the results of previous research, according to which a strategy of differentiation in the foreign market based on CSR favors the EXP of companies [70,71,72]. The results also confirm, in line with numerous previous works [18,78,79,80,81,82,83,84], the existence of a positive impact of the CSR of the companies in the sector on their IR. Finally, in line with other previous work [37,86,87,88,89,90,91,92,93,94,95,96], the existence of a positive impact of CSR on SS is also confirmed.
The results suggest, therefore, a direct impact of CSR on both tangible performance variables (FP and EXP) and on intangible variables (IR and SS), although this impact is greater in the latter group. This is in contrast to the results of previous investigations that do not find a direct and significant relationship between CSR and FP, but rather found that this relationship is mediated by the effect of certain intangible assets such as reputation, customer satisfaction, innovation, human capital or culture [18.35–38].

6.2. Managerial Implications

This paper offers managers a reliable and valid instrument with which to measure CSR and thus can be of considerable use in the management of a business. Knowing and understanding the influence that CSR exerts on each of the variables of BP can serve as a guide for the relevant decision making of managers and can help them develop strategies that allow them to direct their companies towards responsible practices.
Managers must consider CSR as an element to be incorporated into the company’s strategy and thus requires the involvement of owners and senior management, as well as the allocation of sufficient resources which should be considered, not as an expense, but as an investment in an intangible asset. It is not about adopting certain practices in isolation, but that the commitment must be permanent and proactively adopted, not only as a response to market pressures, but as a differentiation strategy that can increase competitiveness.
Consequently, it is necessary to apply the required resources for the development of a communication strategy based on the company’s commitment to CSR, both internally and externally. This communication should focus on environmental issues (energy efficiency, efficient use of water, fertilizers, and phytosanitary, waste treatment, etc.) and social (contribution of the company to the job satisfaction of its employees, customers and farmers). CSR certifications provide the opportunity for companies to demonstrate that commitment clearly and reliably.
CSR is intended to be a long-term strategy. Managers should not expect, therefore, a short-term ROI in the form of greater financial benefit, since returns, at first, can come in the form of intangible assets that are worth protecting, such as the reputation, and satisfaction of its employees, customers, and farmers. However, it is important to measure and monitor how CSR practices and the improved relationships with their stakeholders facilitate the transformation of CSR, over time, into financial benefit.

7. Limitations and Proposals for Future Research Lines

We recognize the existence of various limitations in the present study that, at the same time, can be considered opportunities for future research. On the one hand, the proposed model has been only been applied in the field of the marketing of fruit and vegetable products in southeastern Spain. Its generalizations are, therefore, conditioned upon sectors with similar characteristics to the studied context.
Another limitation of this work is the cross-sectional nature of the data, which may prevent the recording of some of the effects derived from the application of CSR practices that differ over time. Also, the use of cross-sectional data does not allow us to eliminate the possibility of reverse causality in the model. In fact, all the analyses are correlational in nature and results should not be viewed as causal. However, our focus is on the view of CSR as a critical factor that determines business performance and, under this lens, the direction of the proposed relationships has been theoretically justified. Further research using longitudinal data and cross-lagged analysis will be necessary to exclude the potential for reverse causality bias and to study the relationships between the variables over time.
The hypotheses of this research have been tested with data gathered from managers, which may be conditioned by psychological biases that can affect the results, especially when evaluating concepts such as IR or SS. Some authors such as Galbreath and Shum [36]; Weiss et al. [146] or Ping [147] also based their studies on managers perceptions to measure variables such as reputation and customers’ satisfaction. These authors introduce the additional requirement of using a self-administered survey to assure the anonymity for every people surveyed, as in the present study. Although the research design has attempted to control for these biases, it is difficult to eliminate them. Therefore, this is important that the results and recommendations of this study should be considered with caution. An opportunity for future research, derived from this limitation, could be to test the hypotheses of this study through the perceptions of other stakeholders. In line with the recommendations of Godfrey and Hatch [32], another line of future research could be to disaggregate the dimensions of CSR, to assess the influence of each of these on business performance and its different components. In this way, a clear indication could be obtained about which CSR factors companies should influence, to maximize the possible impact on their business performance.

8. Conclusions

The results of this study show that the firm commitment of companies in the agri-food sector in southeastern Spain for CSR helps them increase their economic benefits in addition to their intangible assets, difficult to imitate, which can guarantee their viability and competitiveness in the future.
CSR can help companies in the sector to develop a differentiation strategy based not only on the social and environmental characteristics of their products, but on the recognition of the company by; customers, employees, farmers, and society as a responsible company. Both strategies, correlated with each other, will help them to increase the perceived value of their products and improve their performance.
CSR practices will improve the satisfaction of the predominant or critical stakeholders. As a result of this study, the importance of companies carrying out an adequate identification of their most relevant stakeholders is highlighted, as well as the potential threat or collaboration of each one, maintaining a proactive and permanent dialogue with them, and to know, at all times, what your expectations are, which may change over time.
CSR conceived as a long-term strategy, permanent and proactively adopted by companies (not only in response to market pressures) has a clear positive impact on the IR of companies in this sector. This will reduce the risk that certain negative social events may damage your reputation, eliminating or compensating for the negative impact of bad publicity during a crisis.

Author Contributions

conceptualization, A.M.-P., F.J.C.-G. and D.J.-C.; methodology, A.M.-P. and D.J.-C.; investigation, A.M.-P.; validation and supervision, D.J.-C. and F.J.C.-G.

Funding

This research received no external funding.

Conflicts of Interest

The authors declare no conflict of interest.

References

  1. Mishra, S.; Suar, D. Does Corporate Social Responsibility Influence Firm Performance of Indian Companies? J. Bus. Ethics 2010, 95, 571–601. [Google Scholar] [CrossRef]
  2. Preston, L.E.; O’Bannon, D.P. The Corporate Social-Financial Performance Relationship. Bus. Soc. 1997, 36, 419–429. [Google Scholar] [CrossRef]
  3. Roman, R.M.; Hayibor, S.; Agle, B.R. The Relationship between Social and Financial Performance. Bus. Soc. 1999, 38, 109–125. [Google Scholar] [CrossRef]
  4. Waddock, S.A.; Graves, S.B. The Corporate Social Performance-Financial Performance Link. Strat. Manag. J. 1997, 18, 303–319. [Google Scholar] [CrossRef]
  5. Orlitzky, M.; Schmidt, F.L.; Rynes, S.L. Corporate Social and Financial Performance: A Meta-Analysis. Organ. Stud. 2003, 24, 403–441. [Google Scholar] [CrossRef]
  6. Attamimi, A.A.B.; Ameer, R. Readability of Corporate Social Responsibility Communication in Malaysia. SSRN Electron. J. 2010, 18, 50–60. [Google Scholar] [CrossRef]
  7. Oeyono, J.; Samy, M.; Bampton, R. An examination of corporate social responsibility and financial performance: A study of the top 50 Indonesian listed corporations Positivism to Social Constructivism: An emerging trend for CSR researchers View project. J. Glob. Responsib. 2011, 2, 100–112. [Google Scholar] [CrossRef]
  8. Hasan, I.; Kobeissi, N.; Liu, L.; Wang, H. Corporate Social Responsibility and Firm Financial Performance: The Mediating Role of Productivity. J. Bus. Ethics 2018, 149, 671–688. [Google Scholar] [CrossRef]
  9. Busch, T.; Friede, G. The Robustness of the Corporate Social and Financial Performance Relation: A Second-Order Meta-Analysis. Corp. Soc. Responsib. Environ. Manag. 2018, 25, 583–608. [Google Scholar] [CrossRef]
  10. McWilliams, A.; Siegel, D. Corporate Social Responsibility: A Theory of the Firm Perspective. Acad. Manag. Rev. 2001, 26, 117–127. [Google Scholar] [CrossRef]
  11. Griffin, J.J.; Mahon, J.F. The Corporate Social Performance and Corporate Financial Performance Debate. Bus. Soc. 1997, 36, 5–31. [Google Scholar] [CrossRef]
  12. Aupperle, K.E.; Carroll, A.B.; Hatfield, J.D. An Empirical Examination of the Relationship between Corporate Social Responsibility and Profitability. Acad. Manag. J. 1985, 28, 446–463. [Google Scholar]
  13. Lima, V.L.; Freire, F.d.S.; Vasconcellos, F.C. Corporate social responsibility, firm value and financial performance in Brazil. Soc. Responsib. J. 2011, 7, 295–309. [Google Scholar] [CrossRef]
  14. Lin, W.L.; Ho, J.A.; Sambasivan, M. Impact of Corporate Political Activity on the Relationship Between Corporate Social Responsibility and Financial Performance: A Dynamic Panel Data Approach. Sustainability 2018, 11, 60. [Google Scholar] [CrossRef]
  15. Maqbool, S.; Bakr, A. The curvilinear relationship between corporate social performance and financial performance. J. Glob. Responsib. 2019, 10, 87–100. [Google Scholar] [CrossRef]
  16. Van Marrewijk, M. Concepts and Definitions of CSR and Corporate Sustainability: Between Agency and Communion. J. Bus. Ethics 2003, 44, 95–105. [Google Scholar] [CrossRef]
  17. Maignan, I.; Ferrell, O.C. Measuring Corporate Citizenship in Two Countries: The Case of the United States and France. J. Bus. Ethics 2000, 23, 283–297. [Google Scholar] [CrossRef]
  18. Surroca, J.; Tribó, J.A.; Waddock, S. Corporate responsibility and financial performance: The role of intangible resources. Strateg. Manag. J. 2010, 31, 463–490. [Google Scholar] [CrossRef]
  19. Alvarado, A.; Schlesinger, M.W. Dimensionalidad de la Responsabilidad Social Empresarial percibida y sus efectos sobre la Imagen y la Reputación: Una aproximación desde el modelo de Carroll. Estud. Gerenc. 2008, 24, 37–59. [Google Scholar] [CrossRef]
  20. Perrini, F.; Russo, A.; Tencati, A.; Vurro, C. Deconstructing the Relationship Between Corporate Social and Financial Performance. J. Bus. Ethics 2011, 102, 59–76. [Google Scholar] [CrossRef]
  21. Carroll, A.B. A Three Dimensional Conceptual Model of Corporate Social Performance. Acad. Manag. Rev. 1979, 4, 497–505. [Google Scholar] [CrossRef]
  22. Bansal, P. Evolving sustainably: A longitudinal study of corporate sustainable development. Strateg. Manag. J. 2005, 26, 197–218. [Google Scholar] [CrossRef]
  23. Apostolakou, A.; Jackson, G. Corporate Social Responsibility in Western Europe: An Institutional Mirror or Substitute? J. Bus. Ethics 2010, 94, 371–394. [Google Scholar] [CrossRef]
  24. Chow, W. Corporate sustainable development: Testing a new scale based on the mainland Chinese context. J. Bus. Ethics 2012, 28, 519–533. [Google Scholar] [CrossRef]
  25. Elkington, J. Partnerships from cannibals with forks: The triple bottom line of 21st Century business. Environ. Qual. Manag. 1998, 8, 37–51. [Google Scholar] [CrossRef]
  26. Öberseder, M.; Schlegelmilch, B.B.; Murphy, P.E.; Gruber, V. Consumers’ Perceptions of Corporate Social Responsibility: Scale Development and Validation. J. Bus. Ethics 2014, 124, 101–115. [Google Scholar] [CrossRef]
  27. Parada, A.D.; Daponte, R.R.; Vázquez, E.G. Valoración de la rsc por el consumidor y medición de su efecto sobre las compras. Rev. Adm. Empresas 2014, 54, 39–52. [Google Scholar] [CrossRef]
  28. Luo, J.M.; Lam, C.F.; Chau, K.Y.; Shen, H.W.; Wang, X. Measuring Corporate Social Responsibility in Gambling Industry: Multi-Items Stakeholder Based Scales. Sustainability 2017, 9, 2012. [Google Scholar] [CrossRef]
  29. Turker, D. Measuring Corporate Social Responsibility: A Scale Development Study. J. Bus. Ethics 2009, 85, 411–427. [Google Scholar] [CrossRef]
  30. Fatma, M.; Rahman, Z.; Khan, I. Multi-Item Stakeholder Based Scale to Measure CSR in the Banking Industry. Int. Strateg. Manag. Rev. 2014, 2, 9–20. [Google Scholar] [CrossRef]
  31. Donaldson, T.; Preston, L.E. The Stakeholder Theory of the Corporation: Concepts, Evidence, and Implications. Acad. Manag. Rev. 1995, 20, 65–91. [Google Scholar] [CrossRef]
  32. Agarwal, S.; Erramilli, M.K.; Dev, C.S. Market orientation and performance in service firms: Role of innovation. J. Serv. Mark. 2003, 17, 68–82. [Google Scholar] [CrossRef]
  33. Camisón, C. Shared, Competitive, and Comparative Advantages: A Competence-Based View of Industrial-District Competitiveness. Environ. Plan. A Econ. Space 2004, 36, 2227–2256. [Google Scholar] [CrossRef]
  34. Camisón, C.; Garrigós, F.; Palacios, D. Estrategias competitivas y desempeño empresarial: Estudio comparativo de los modelos de Robinson & Pearce y Miles & Snow en el sector hotelero Español. IEDEE 2007, 13, 161–182. [Google Scholar]
  35. Alafi, K.; Hasoneh, A.B. Corporate Social Responsibility Associated With Customer Satisfaction and Financial Performance a Case Study with Housing Banks in Jordan. Int. J. Hum. Soc. Sci. 2012, 2, 102–115. [Google Scholar]
  36. Galbreath, J.; Shum, P. Do customer satisfaction and reputation mediate the CSR–FP link? Evidence from Australia. Aust. J. Manag. 2012, 37, 211–229. [Google Scholar] [CrossRef]
  37. Luo, X.; Bhattacharya, C. Corporate Social Responsibility, Customer Satisfaction, and Market Value. J. Mark. 2006, 70, 1–18. [Google Scholar] [CrossRef]
  38. Saeidi, S.P.; Sofian, S.; Saeidi, P.; Saeidi, S.P.; Saaeidi, S.A. How does corporate social responsibility contribute to firm financial performance? The mediating role of competitive advantage, reputation, and customer satisfaction. J. Bus. Res. 2015, 68, 341–350. [Google Scholar] [CrossRef]
  39. Godfrey, P.C.; Hatch, N.W. Researching Corporate Social Responsibility: An Agenda for the 21st Century. J. Bus. Ethics 2007, 70, 87–98. [Google Scholar] [CrossRef]
  40. Heyder, M.; Theuvsen, L. Corporate Social Responsibility in Agribusiness: Empirical Findings from Germany. In A resilient European food industry and food chain in a challenging world. In Proceedings of the European Association of Agricultural Economists (EAAE), 113th EAAE Seminar, Chania, Greece, 3–6 September 2009. [Google Scholar]
  41. Schulze, B.; Wocken, C.; Spiller, A. Relationship quality in agri-food chains: Supplier management in the German pork and dairy sector. J. Chain Netw. Sci. 2006, 6, 55–68. [Google Scholar] [CrossRef]
  42. Torres, A.; Akridge, J.T.; Gray, A.; Boehlje, M.; Widdows, R. An Evaluation of Customer Relationship Management (CRM) Practices among Agribusiness Firms. Int. Food Agribus. Manag. 2007, 10. [Google Scholar]
  43. Bremmers, H.; Omta, O.; Haverkamp, D.J. A Stakeholder View on Sustainable Food and Agribusiness Chain Development. In Proceedings of the 14th Annual IAMA Conference, Montreux, Switzerland, 12–15 June 2004; Available online: https://www.researchgate.net/publication/40122187 (accessed on 19 July 2019).
  44. Schiebel, W.; Pöchtrager, S. Corporate ethics as a factor for success—The measurement instrument of the University of Agricultural Sciences (BOKU), Vienna. Supply Chain Manag. Int. J. 2003, 8, 116–121. [Google Scholar] [CrossRef] [Green Version]
  45. Christensen, L.J.; Peirce, E.; Hartman, L.P.; Hoffman, W.M.; Carrier, J. Ethics, CSR, and Sustainability Education in the Financial Times Top 50 Global Business Schools: Baseline Data and Future Research Directions. J. Bus. Ethics 2007, 73, 347–368. [Google Scholar] [CrossRef]
  46. Epstein, E.M. The Corporate Social Policy Process: Beyond Business Ethics, Corporate Social Responsibility, and Corporate Social Responsiveness. Calif. Manag. Rev. 1987, 29, 99–114. [Google Scholar] [CrossRef]
  47. Bloom, P.N.; Gundlach, G.T. Handbook of Marketing and Society, 1st ed.; Sage: London, UK, 2001. [Google Scholar]
  48. Smith, N.C. Corporate Social Responsibility: Whether or How? Calif. Manag. Rev. 2003, 45, 52–76. [Google Scholar] [CrossRef]
  49. Panwar, R.; Hansen, E.; Anderson, R. Students’ perceptions regarding CSR success of the US forest products industry. Soc. Responsib. J. 2010, 6, 18–32. [Google Scholar] [CrossRef]
  50. Watson, M.; Mackay, J. Auditing for the environment. Manag. Audit. J. 2003, 18, 625–630. [Google Scholar] [CrossRef]
  51. Inyang, B.J.; Awa, H.O.; Enuoh, R.O. CSR-HRM Nexus: Defining the Role Engagement of the Human Resources Professionals. Int. J. Bus. Soc. Sci. 2011, 2, 118–126. [Google Scholar]
  52. Freeman, R.E. Strategic Management: A Stakeholder Perspective; Pitman: Boston, MA, USA, 1984. [Google Scholar]
  53. Mitchell, R.K.; Agle, B.R.; Wood, D.J. Toward a Theory of Stakeholder Identification and Salience: Defining the Principle of who and What Really Counts. Acad. Manag. Rev. 1997, 22, 853–886. [Google Scholar] [CrossRef]
  54. Wheeler, D.; Sillanpää, M. The Stakeholder Corporation: A Blueprint for Maximizing Stakeholder Value; Pitman: London, UK, 1997. [Google Scholar]
  55. Luhmann, H.; Theuvsen, L. Corporate Social Responsibility in Agribusiness: Literature Review and Future Research Directions. J. Agric. Environ. Ethics 2016, 29, 673–696. [Google Scholar] [CrossRef]
  56. Robertson, G.; Swinton, S.M. Reconciling agricultural productivity and environmental integrity: A grand challenge for agriculture. Front. Ecol. Environ. 2005, 3, 38–46. [Google Scholar] [CrossRef]
  57. Van Huylenbroeck, G.; Vandermeulen, V.; Mettepenningen, E.; Verspecht, A. Multifunctionality of Agriculture: A Review of Definitions, Evidence and Instruments. Living Rev. Landsc. Res. 2007, 1, 1–43. [Google Scholar] [CrossRef]
  58. Atance, I.; Tió, C. La multifuncionalidad de la agricultura: Aspectos económicos e implicaciones sobre la política agraria. Estud. Agrosoc. Pesq. 2000, 189, 29–48. Available online: https://ageconsearch.umn.edu/bitstream/165041/2/pdf_reeap-r189_02.pdf (accessed on 3 November 2018).
  59. Abler, D. Multifunctionality, Agricultural Policy, and Environmental Policy. Agric. Resour. Econ. Rev. 2004, 33, 8–17. [Google Scholar] [CrossRef] [Green Version]
  60. Gopalakrishnan, S. Unraveling the links between dimensions of innovation and organizational performance. J. High Technol. Manag. Res. 2000, 11, 137–153. [Google Scholar] [CrossRef]
  61. Richard, P.J.; DeVinney, T.M.; Yip, G.S.; Johnson, G. Measuring Organizational Performance: Towards Methodological Best Practice. J. Manag. 2009, 35, 718–804. [Google Scholar] [CrossRef] [Green Version]
  62. Ferraz, F.A.D.; Gallardo-Vázquez, D.; Ferraz, F.A.V.G.D. Measurement tool to assess the relationship between corporate social responsibility, training practices and business performance. J. Clean. Prod. 2016, 129, 659–672. [Google Scholar] [CrossRef]
  63. Franco-Santos, M.; Lucianetti, L.; Bourne, M. Contemporary performance measurement systems: A review of their consequences and a framework for research. Manag. Acc. Res. 2012, 23, 79–119. [Google Scholar] [CrossRef] [Green Version]
  64. Cavusgil, S.T.; Zou, S. Marketing Strategy-Performance Relationship: An Investigation of the Empirical Link in Export Market Ventures. J. Mark. 1994, 58, 1–21. [Google Scholar] [CrossRef]
  65. Siegel, D.S.; Vitaliano, D.F. An Empirical Analysis of the Strategic Use of Corporate Social Responsibility. J. Econ. Manag. Strat. 2007, 16, 773–792. [Google Scholar] [CrossRef] [Green Version]
  66. Boehe, D.M.; Cruz, L.B. Corporate Social Responsibility, Product Differentiation Strategy and Export Performance. J. Bus. Ethics 2010, 91, 325–346. [Google Scholar] [CrossRef]
  67. Hansen, U. Gesellschaftliche Verantwortung als Business Case: Ansatze, Defizite und Perspektiven der deutschsprachigen Betriebswirtschaftslehre. In Betriebswirtschaftslehre und Gesellschaftliche Verantwortung: Mit Corporate Social Responsibility zu mehr Engagement, 1st ed.; Schneider, U., Steiner, P., Eds.; Gabler: Wiesbaden, Germany, 2004; pp. 59–83. [Google Scholar] [CrossRef]
  68. Epstein, M.J.; Roy, M.-J. Sustainability in Action: Identifying and Measuring the Key Performance Drivers. Long Range Plan. 2001, 34, 585–604. [Google Scholar] [CrossRef]
  69. Rondinelli, D.A.; London, T. How corporations and environmental groups cooperate: Assessing cross-sector alliances and collaborations. Acad. Manag. Perspect. 2003, 17, 61–76. [Google Scholar] [CrossRef]
  70. Barin, L.; Boehe, D.M.; Ogasavara, M.H. CSR-based Differentiation Strategy of Export Firms From Developing Countries: An Exploratory Study of the Strategy Tripod. Bus. Soc. 2015, 54, 723–762. [Google Scholar] [CrossRef]
  71. Motlaghi, E.A.; Mostafavi, M. Studying the Effect of Social Responsibility of SMEs on Export Performance by Considering the Intermediate Role of Competitive Advantage and Organizational Reputation. QUID 2017, 1, 392–406. [Google Scholar]
  72. Theoharakis, V.; Bicakcioglu, N.; Tanyeri, M. Green Business Strategy and Export Performance: An Examination of Boundary Conditions from an Emerging Economy. Int. Market. Rev. 2019, 1, 5–35. [Google Scholar] [CrossRef]
  73. Pérez, A.; Rodríguez del Bosque, I. Identidad, imagen y reputación de la empresa: Integración de propuestas teóricas para una gestión exitosa. Cuad. Gestión 2014, 14, 97–126. [Google Scholar] [CrossRef]
  74. Fombrun, C.J. Reputation: Realizing Value from the Corporate Image; Harvard Business School Press: Boston, MA, USA, 1996. [Google Scholar] [CrossRef]
  75. Post, J.E.; Griffin, J.J. Corporate Reputation and External Affairs Management. Part VII: Managing Reputation: Pursuing Everyday Excellence. Corp. Reput. Rev. 1997, 1, 165–171. [Google Scholar] [CrossRef]
  76. Ferguson, T.D.; Deephouse, D.L.; Ferguson, W.L. Do strategic groups differ in reputation? Strateg. Manag. J. 2000, 21, 1195–1214. [Google Scholar] [CrossRef]
  77. Olcese, A.; Rodríguez, M.; Alfaro, J. Manual de la Empresa Responsable y Sostenible. Conceptos, ejemplos y herramientas de la Responsabilidad Social Corporativa o de la Empresa; McGraw Hill: Madrid, Spain, 2008. [Google Scholar]
  78. Brammer, S.J.; Pavelin, S. Corporate Reputation and Social Performance: The Importance of Fit. J. Manag. Stud. 2006, 43, 435–455. [Google Scholar] [CrossRef]
  79. Al-Eryani, O.; Jönsson, G.; Mchugh, J. Corporate Social Responsibility (CSR): Using Stakeholder Engagement to Improve Organizational Performance; Jönköping International Business School: Jönköping, Sweden, 2019. [Google Scholar]
  80. Fombrun, C.; Shanley, M. What’s in a Name? Reputation Building and Corporate Strategy. Acad. Manag. J. 1990, 33, 233–258. [Google Scholar]
  81. Bear, S.; Rahman, N.; Post, C. The Impact of Board Diversity and Gender Composition on Corporate Social Responsibility and Firm Reputation. J. Bus. Ethics 2010, 97, 207–221. [Google Scholar] [CrossRef]
  82. Minor, D.; Morgan, J. CSR as Reputation Insurance: Primum Non Nocere. Calif. Manag. Rev. 2011, 53, 40–59. [Google Scholar] [CrossRef] [Green Version]
  83. Bianchi, E.; Bruno, J.M.; Sarabia-Sanchez, F.J. The impact of perceived CSR on corporate reputation and purchase intention. Eur. J. Manag. Bus. Econ. 2019, 28, 206–221. [Google Scholar] [CrossRef] [Green Version]
  84. Vishwanathan, P.; Van Oosterhout, H.J.; Heugens, P.P.M.A.R.; Duran, P.; Essen, M.; Van Essen, M. Strategic CSR: A Concept Building Meta-Analysis. J. Manag. Stud. 2019. [Google Scholar] [CrossRef] [Green Version]
  85. Strong, K.C.; Ringer, R.C.; Taylor, S.A. The Rules of Stakeholder Satisfaction (Timeliness, Honesty, Empathy). J. Bus. Ethics 2001, 32, 219–230. [Google Scholar] [CrossRef]
  86. Polonsky, M.J. A stakeholder theory approach to designing environmental marketing strategy. J. Bus. Ind. Mark. 1995, 10, 29–46. [Google Scholar] [CrossRef]
  87. Chung, K.-H.; Yu, J.-E.; Choi, M.-G.; Shin, J.-I. The Effects of CSR on Customer Satisfaction and Loyalty in China: The Moderating Role of Corporate Image. J. Econ. Bus. Manag. 2015, 3, 542–547. [Google Scholar] [CrossRef] [Green Version]
  88. Irshad, A.; Rahim, A. The impact of corporate social responsibility on customer satisfaction and customer loyalty, moderating effect of corporate image (evidence from Pakistan). City Univ. Res. J. 2017, 1, 63–73. [Google Scholar]
  89. Zhang, Q.; Cao, M.; Zhang, F.; Liu, J.; Li, X. Effects of corporate social responsibility on customer satisfaction and organizational attractiveness: A signaling perspective. Bus. Ethics A Eur. Rev. 2019. [Google Scholar] [CrossRef]
  90. Barakat, S.R.; Isabella, G.; Boaventura, J.M.G.; Mazzon, J.A. The influence of corporate social responsibility on employee satisfaction. Manag. Decis. 2016, 54, 2325–2339. [Google Scholar] [CrossRef] [Green Version]
  91. Onkila, T. Pride or Embarrassment? Employees’ Emotions and Corporate Social Responsibility. Corp. Soc. Responsib. Environ. Manag. 2015, 22, 222–236. [Google Scholar] [CrossRef]
  92. Zhu, Q.; Yin, H.; Liu, J.; Lai, K. How is Employee Perception of Organizational Efforts in Corporate Social Responsibility Related to Their Satisfaction and Loyalty Towards Developing Harmonious Society in Chinese Enterprises? Corp. Soc. Responsib. Environ. Manag. 2014, 21, 28–40. [Google Scholar] [CrossRef]
  93. Kappel, C. An Employee Perspective: E Impact of CSR Perception on Job Satisfaction and Organizational Identification. Master’s Thesis, University of Twente, Enschede, The Netherlands, 2018. [Google Scholar]
  94. Koch, C.; Bekmeier-Feuerhahn, S.; Bögel, P.M.; Adam, U. Employees’ perceived benefits from participating in CSR activities and implications for increasing employees engagement in CSR. Corp. Commun. Int. J. 2019, 24, 303–317. [Google Scholar] [CrossRef]
  95. Omer, S.K. The impact of corporate social responsibility on employee’s job satisfaction. J. Process. Manag. 2018, 6, 56–64. [Google Scholar] [CrossRef] [Green Version]
  96. Walker, H.; Jones, N. Sustainable supply chain management across the UK private sector. Supply Chain Manag. Int. J. 2012, 17, 15–28. [Google Scholar] [CrossRef]
  97. Vurro, C.; Russo, A.; Perrini, F. Shaping Sustainable Value Chains: Network Determinants of Supply Chain Governance Models. J. Bus. Ethics 2009, 90, 607–621. [Google Scholar] [CrossRef]
  98. Skjong, R.; Wentworth, B.H. Expert judgment and risk perception. In Proceedings of the Eleventh International Offshore and Polar Engineering Conference, Stavanger, Norway, 17–22 June 2001. [Google Scholar]
  99. Wall, T.D.; Michie, J.; Patterson, M.; Wood, S.J.; Sheehan, M.; Clegg, C.W.; West, M. On the validity of subjective measures of company performance. Pers. Psychol. 2004, 57, 95–118. [Google Scholar] [CrossRef]
  100. Dess, G.G.; Robinson, R.B. Measuring organizational performance in the absence of objective measures: The case of the privately-held firm and conglomerate business unit. Strateg. Manag. J. 1984, 5, 265–273. [Google Scholar] [CrossRef]
  101. Kandemir, D.; Yaprak, A.; Cavusgil, S.T. Alliance Orientation: Conceptualization, Measurement, and Impact on Market Performance. J. Acad. Mark. Sci. 2006, 34, 324–340. [Google Scholar] [CrossRef]
  102. Calantone, R.J.; Cavusgil, S.T.; Zhao, Y. Learning orientation, firm innovation capability, and firm performance. Ind. Mark. Manag. 2002, 31, 515–524. [Google Scholar] [CrossRef]
  103. Shaoming, Z.; Taylor, C.R.; Osland, G.E. The EXPERF Scale: A Cross-National Generalized Export Performance Measure. J. Int. Mark. 1998, 6, 37–58. [Google Scholar] [CrossRef] [Green Version]
  104. Lages, L.F.; Jap, S.D.; Griffith, D.A. The role of past performance in export ventures: A short-term reactive approach. J. Int. Bus. Stud. 2008, 39, 304–325. [Google Scholar] [CrossRef]
  105. Ahimbisibwe, G.M.; Nkundabanyanga, S.K.; Nkurunziza, G.; Nyamuyonjo, D. Knowledge absorptive capacity: Do all its dimensions matter for export performance of SMEs? World J. Entrep. Manag. Sustain. Dev. 2016, 12, 139–160. [Google Scholar] [CrossRef]
  106. Ahearne, M.; Bhattacharya, C.B.; Gruen, T. Antecedents and Consequences of Customer-Company Identification: Expanding the Role of Relationship Marketing. J. Appl. Psychol. 2005, 90, 574–585. [Google Scholar] [CrossRef] [Green Version]
  107. Martínez-Salinas, E.; Pina-Pérez, J. Modeling the brand extensions’ influence on brand image. J. Bus. Res. 2008, 62, 50–60. [Google Scholar] [CrossRef]
  108. Quinn, R.E.; Rohrbaugh, J. A Spatial Model of Effectiveness Criteria: Towards a Competing Values Approach to Organizational Analysis. Manag. Sci. 1983, 29, 363–377. [Google Scholar] [CrossRef] [Green Version]
  109. Kumar, N.; Stern, L.W.; Achrol, R.S. Assessing Reseller Performance from the Perspective of the Supplier. J. Mark. Res. 1992, 29, 238–253. [Google Scholar] [CrossRef]
  110. Zaichkowsky, J.L. Measuring the Involvement Construct. J. Consum. Res. 1985, 12, 341–352. [Google Scholar] [CrossRef]
  111. Ouellet, J.-F. Consumer Racism and Its Effects on Domestic Cross-Ethnic Product Purchase: An Empirical Test in the United States, Canada, and France. J. Mark. 2007, 71, 113–128. [Google Scholar] [CrossRef]
  112. Aaker, J.L.; Benet-Martínez, V.; Garolera, J. Consumption symbols as carriers of culture: A study of Japanese and Spanish brand personality constructs. J. Pers. Soc. Psychol. 2001, 81, 492–508. [Google Scholar] [CrossRef] [PubMed]
  113. Molina-Herrera, J. El papel de la agricultura intensiva en la economía de la provincia de almería. Rev. Humanid. Cienc. Soc. 2004, 19, 13–38. [Google Scholar]
  114. Cortés, F.J.; García, R.; Molina, J. Claves para la interpretación del modelo económico almeriense basado en la agricultura del alto rendimiento. Meditterráneo Económico 2002, 2, 283–311. [Google Scholar]
  115. Galdeano-Gómez, E.; Aznar-Sánchez, J.A.; Pérez-Mesa, J.C. Sustainability dimensions related to agricultural-based development: The experience of 50 years of intensive farming in Almería (Spain). Int. J. Agric. Sustain. 2013, 11, 125–143. [Google Scholar] [CrossRef]
  116. Galdeano-Gómez, E.; Aznar-Sánchez, J.A.; Pérez-Mesa, J.C.; Piedra-Muñoz, L. Exploring Synergies Among Agricultural Sustainability Dimensions: An Empirical Study on Farming System in Almería (southeast Spain). Ecol. Econ. 2017, 140, 99–109. [Google Scholar] [CrossRef]
  117. Delgado, M.; Reigada, A.; Neira, D.P.; Soler, M. Evolución histórica y sostenibilidad social, económica y ecológica de la agricultura almeriense. In Proceedings of the Old and New Worlds: The Global Challenges of Rural History International Conference, Lisbon, Portugal, 27–30 January 2016; Available online: https://lisbon2016rh.files.wordpress.com/2015/12/onw-0097.pdf (accessed on 25 July 2019).
  118. Aznar- Sánchez, J.Á. El proceso de internacionalización comercial de la horticultura intensiva almeriense. Revista de Estudios Empresariales. Segunda Época 2007, 1, 55–72. [Google Scholar]
  119. Hair, J.F.; Hult, G.; Ringle, C.; Sarstedt, M. A Primer on Partial Least Squares Structural Equation Modeling (PLS-SEM), 2nd ed.; Sage: Thousand Oaks, CA, USA, 2014. [Google Scholar]
  120. Barclay, D.; Higgins, C.; Thompson, R. The partial least squares (PLS) approach to casual modeling: Personal computer adoption ans use as an Illustration. Technol. Stud. 1995, 2, 287–309. [Google Scholar]
  121. Cohen, J. Statistical Power Analysis for the Behavioral Sciences, 2nd ed.; Laurence Erlbaum Associates: Hillsdale, NJ, USA, 1988. [Google Scholar] [CrossRef]
  122. Green, S.B. How Many Subjects Does It Take To Do A Regression Analysis. Multivar. Behav. Res. 1991, 26, 499–510. [Google Scholar] [CrossRef]
  123. Nitzl, C. The use of partial least squares structural equation modelling (PLS-SEM) in management accounting research: Directions for future theory development. J. Acc. Lit. 2016, 37, 19–35. [Google Scholar] [CrossRef]
  124. Faul, F.; Erdfelder, E.; Buchner, A.; Lang, A.-G. Correlation Problems Referring to One Correlation Comparison of a correlation with a constant 0 (bivariate normal model) Comparison of a correlation with 0 (point biserial model) Comparison of a correlation with a constant 0 (tetrachoric correlation model). Behav. Res. Methods 2009, 4, 1149–1160. [Google Scholar] [CrossRef] [Green Version]
  125. Reinartz, W.; Haenlein, M.; Henseler, J. An empirical comparison of the efficacy of covariance-based and variance-based SEM. Int. J. Res. Mark. 2009, 26, 332–344. [Google Scholar] [CrossRef] [Green Version]
  126. Diamantopoulos, A.; Winklhofer, H.M. Index Construction with Formative Indicators: An Alternative to Scale Development. J. Mark. Res. 2001, 38, 269–277. [Google Scholar] [CrossRef]
  127. Edwards, J.R.; Bagozzi, R.P. Psychological Methods On the Nature and Direction of Relationships Between Constructs and Measures. Psychol. Methods 2000, 5, 155–174. [Google Scholar] [CrossRef] [PubMed]
  128. Podsakoff, P.M.; Jarvis, C.B.; MacKenzie, S.B. A Critical Review of Construct Indicators and Measurement Model Misspecification in Marketing and Consumer Research. J. Consum. Res. 2003, 30, 199–218. [Google Scholar]
  129. Chin, W.W. FAQ—Partial Least Squares and PLSGraf. 2000. Available online: http://disc-nt.cba.uh.edu/chin/plsfaq.htm (accessed on 23 May 2019).
  130. Moutinho, L.; Huarng, K.-H. Quantitative Modelling in Marketing and Management. In Quantitative Modelling in Marketing and Management; World Scientific: Singapore, 2012; pp. 43–78. [Google Scholar]
  131. Werts, C.; Linn, R.; Jöreskog, K. Intraclass Reliability Estimates: Testing Structural Assumptions. Educ. Psychol. Meas. 1974, 34, 25–33. [Google Scholar] [CrossRef]
  132. Fornell, C.; Larcker, D.F. Evaluating Structural Equation Models with Unobservable Variables and Measurement Error. J. Mark. Res. 1981, 18, 39–50. [Google Scholar] [CrossRef]
  133. Mathieson, K.; Peacock, E.; Chin, W.W. Extending the technology acceptance model: The influence of perceived user resources. ACM SIGMIS 2001, 32, 86–118. [Google Scholar] [CrossRef]
  134. Hair, J.F.; Ringle, C.M.; Sarstedt, M. PLS-SEM: Indeed a Silver Bullet. J. Mark. Theory Pract. 2011, 19, 139–152. [Google Scholar] [CrossRef]
  135. Carmines, E.; Zeller, R. Reliability and Validity Assessment; Sage University Paper Series on Quantitative Applications in the Social Sciences 07-017; Sage: Newbury Park, CA, USA, 1979. [Google Scholar]
  136. Nunnally, J.C. Psychometric Theory, 2nd ed.; McGraw-Hill: New York, NY, USA, 1978. [Google Scholar]
  137. Henseler, J.; Ringle, C.M.; Sarstedt, M. A new criterion for assessing discriminant validity in variance-based structural equation modeling. J. Acad. Mark. Sci. 2014, 43, 115–135. [Google Scholar] [CrossRef] [Green Version]
  138. Falk, R.F.; Miller, N.B. A Primer for Soft Modeling; University of Akron Press: Akron, OH, USA, 1992. [Google Scholar]
  139. Teo, T.S.H.; Srivastava, S.C.; Jiang, L. Trust and Electronic Government Success: An Empirical Study. J. Manag. Inf. Syst. 2008, 25, 99–132. [Google Scholar] [CrossRef]
  140. Shmueli, G.; Ray, S.; Estrada, J.M.V.; Chatla, S.B. The elephant in the room: Predictive performance of PLS models. J. Bus. Res. 2016, 69, 4552–4564. [Google Scholar] [CrossRef]
  141. Geisser, S. The Predictive Sample Reuse Method with Applications. J. Am. Stat. Assoc. 1975, 70, 320–328. [Google Scholar] [CrossRef]
  142. Hair, J.F.; Sarstedt, M.; Ringle, C.M.; Gudergan, S.P. Advanced Issues in Partial Least Squares Structural Equation Modeling; Sage: Thousand Oaks, CA, USA, 2018. [Google Scholar]
  143. Hu, L.-T.; Bentler, P.M. Fit indices in covariance structure modeling: Sensitivity to underparameterized model misspecification. Psychol. Methods 1998, 3, 424–453. [Google Scholar] [CrossRef]
  144. Dijkstra, T.K.; Henseler, J. Consistent partial least squares path modeling 1. MIS Q. 2015, 39, 297–316. [Google Scholar] [CrossRef]
  145. Ringle, C. Advanced PLS-SEM Topics: PLS Multigroup Analysis; Working Paper; University of Seville: Seville, Spain, 2016. [Google Scholar]
  146. Weiss, A.M.; Anderson, E.; Maclnnis, D.J. Reputation Management as a Motivation for Sales Structure Decisions. J. Mark. 1999, 63, 74–89. [Google Scholar] [CrossRef] [Green Version]
  147. Ping, R.A., Jr. The effects of satisfaction and structural constraints on retailer exiting, voice, loyalty, opportunism, and neglect. J. Retail. 1993, 69, 320–352. [Google Scholar] [CrossRef]
Figure 1. Conceptual Model.
Sustainability 11 06390 g001
Figure 2. Results of the structural model.
Sustainability 11 06390 g002
Table 1. Statistical summary and correlations regarding the constructs of study.
Construct123456789101112
1. Farmers1.000
2. Clients0.6671.000
3. Competitors0.5590.5481.000
4. Community0.3990.3920.3281.000
5. Employees0.5700.5590.4680.3341.000
6. Environment0.6120.6000.5030.3590.5131.000
7. Partners0.5520.5410.4530.3240.4620.4961.000
8. EXP0.0820.224−0.030.231−0.020.137−0.081.000
9. FP0.0300.2300.0180.0720.1540.1100.1060.5981.000
10. IR−0.08−0.490.1560.1870.1840.1640.0110.4850.6151.000
11. CSR0.8250.8090.6780.4840.6910.7420.6690.3920.5310.7891.000
12. SS0.1850.2030.0900.2040.2230.1440.0200.3590.4790.7840.7461.000
Number items6633763447343
Mean16.166.155.605.635.685.126.145.295.285.705.785.67
Standard deviation1.371.211.521.521.321.751.051.401.041.121.390.81
1All items were measured on a 7-point scale (1 = in no measure, 7= in maximum degree). For the items corresponding to the CSR, Farmers, Clients, Competitors, Community, Employees, Environment, Partners (1 = strongly disagree, 7 = strongly agree).
Table 2. Convergence of Reliability and Validity.
Variables and ItemsWeight (p-Value)(t-Value)Load (p-Value)(t-Value)Reliability
(a) Employees
(Emp1) Our company has established flexible policies to provide a good work-life balance for its employees.0.030(0.14)0.553 *** (4.20)
(Emp2) Our company has established training and personal development programs for employees.0.404 *(2.39)0.760 ***(7.73)
(Emp3) In general, our company promotes positive discrimination programs in favor of women and people with disabilities.0.485 ***(3.79)0.661 *** (6.88)
(Emp4) Our company promotes stable employment and recognizes its importance for both employees and society.−0.216(0.92)0.451 *(2.54)N/A
(Emp5) Our company has a communication channel with its employees and is receptive to their proposals and complaints.0.161(0.83)0.488 ***(3.39)
(Emp6) Our company periodically evaluates the work environment and employee satisfaction.0.257(1.38)0.596 ***(4.82)
(Emp7) Our company has internal policies that prevent discrimination against ethnic minorities.0.373 *(2.04)0.595 ***(4.12)
(b) Partners
(Part1) Our company always tries to obtain the maximum profit from its activities. 0.460 **(2.98)0.623 ***(4.92)
(Part2) Our company provides its partners / shareholders with clear, complete, and accurate information on its policies, decisions, and activities.0.161(0.72)0.697 *** (5.88)N/A
(Part3) Our company has an adequate communication channel with its partners / shareholders and is receptive to their proposals.0.679 **(3.09)0.885 ***(10.12)
(c) Clients
(Cli1) Our company has extensive capacity to supply its customers throughout the year.0.231(1.84)0.674 ***(7.10)
(Cli2) Our company has a wide range of products, standardized in terms of quality and prices.0.195 (1.58)0.741 ***(7.85)
(Cli3) Our company conducts studies on customer satisfaction.0.108(0.89)0.570 ***(4.58)N/A
(Cli4) Our company provides complete and accurate information about its products to its customers.-0.041 (0.32)0.586 ***(6.02)
(Cli5) Our company establishes control procedures to ensure compliance with customers.0.562 *** (4.40)0.923 ***(18.53)
(Cli6) Our company responds to customer complaints.0.184(1.25)0.780 ***(10.98)
(d) Farmers
(Agr1) Our company contributes to the growth of farmers / producers and to the continued profitability of their farms.0.063 (0.25)0.732 ***(6.79)
(Agr2) Our company has procedures to control the working conditions and the hiring policy of its suppliers.0.389 *(2.56)0.701 ***(5.99)
(Agr3) Our company has a communication channel with its farmers / producers and is receptive to their proposals and complaints.0.288 (1.85)0.657 ***(5.42)N/A
(Agr4) Our company cooperates with its farmers / producers, providing technical advice for the improvement of their products.0.118(0.53)0.632 ***(5.07)
(Agr5) Our company promotes organic and / or integrated production among its farmers / producers.0.217(1.21)0.625 ***(3.94)
(Agr6) Our company considers it essential that its farmers / producers have the appropriate good agricultural practices, food safety, and environmental certifications.0.375 *(2.49)0.751 ***(7.07)
(e) Environment
(Env1) Our company properly manages waste.−0.226 (1.14)0.244(1.41)
(Env2) Our company has an energy saving program.0.403(1.89)0.754 ***(7.61)
(Env3) Our company adopts programs for the use of alternative energy.−0.158 (0.79)0.594 *** (5.20)
(Env4) Our company has implemented a program to reduce water consumption.0.408 *(2.22)0.837 ***(10.32)N/A
(Env5) Our company periodically conducts environmental audits.0.294 (1.80)0.690 ***(6.24)
(Env6) Our company promotes an efficient use of inputs (water, fertilizers, and phytosanitary products), as well as adequate treatment of agricultural waste among its farmers / producers.0.386 *(2.22)0.779 *** (7.25)
(f) Community
(Com1) Our company gives priority to hiring employees in our municipality or region.−0.598 *(2.55)0.114 (0.69)
(Com2) Our company gives priority to hiring suppliers in our region.0.754 ***(3.21)0.606 *** (4.06)N/A
(Com3) Our company dedicates part of its budget to charitable donations and actively sponsors or finances social events (sports, music, etc.)0.756 ***(4.97)0.809 ***(6.23)
(g) Competitors
(Comp1) Our company promotes free competition among companies in its sector.0.462 *(2.50)0.721 ***(5.26)
(Comp2) Our company promotes cooperation (alliances, associations) with companies in its sector for commercial purposes.0.247 (0.99)0.797 ***(6.94)N/A
(Comp3) Our company carries out cooperation initiatives (alliances, associations) for innovation purposes.0.545 *0.545 *0.860 ***(9.02)
(h) Financial Performance
(FP1) Sales have increased.N/AN/A0.891 ***(27.32)
(FP2) Market share has increased.N/AN/A0.861 ***(19.41)CA= 0.853 CR= 0.901
(FP3) Profitability has increased.N/AN/A0.804 ***(20.16)AVE=0.696
(FP4) Productivity has increased.N/AN/A0.776 ***(6.60)
(i) Export Performance
(ExP1) In recent years, our export sales have increased.N/AN/A0.915 ***(19.63)
(ExP2) The percentage of exports of the company’s total sales has grown in recent years.N/AN/A0.915 ***(19.43)CA = 0.942 CR =0.958,
(ExP3) We have expanded our operations in profitable foreign markets.N/AN/A0.927 ***(40.19)AVE=0.851
(ExP4) We are satisfied with the rate of expansion in the new markets. N/AN/A0.933 ***(49.30)
(j) Image and Reputation
(ImR1) Our company is a dynamic company.N/AN/A0.871 ***(38.20)
(ImR2) Our company is an innovative company.N/AN/A0.824 ***(25.96)
(ImR3) Our company is a company with high quality standards.N/AN/A0.822 ***(23.10)CA=0.936 CR=0.948
(ImR4) Our company is an efficient company.N/AN/A0.809 ***(16.73)AVE=0.723
(ImR5) Our company is a recognized company.N/AN/A0.864 ***(33.57)
(ImR6) Our company is an admired company.N/AN/A0.846 ***(33.62)
(ImR7) Our company is a prestigious company.N/AN/A0.911 ***(51.20)
(a) Stakeholder Satisfaction
(SS1) The overall satisfaction of our customers with our company has increased.N/AN/A0.892 ***(36.41)CA=0.883 CR=0.928
(SS2) The overall satisfaction of our farmers/suppliers with our company has increased.N/AN/A0.928 ***(57.28)AVE=0.810
(SS3) The satisfaction and motivation of our employees has increased.N/AN/A0.880 ***(39.83)
Note: CA= Cronbach’s Alpha; CR: Compound reliability; AVE= Average Extracted Variance. *** p< 0.001; ** p< 0.01; * p< 0.05. N/A= Not applicable.
Table 3. Discriminant validity between latent variables with reflective indicators.
Export PerformanceFinancial PerformanceImage and ReputationStakeholder Satisfaction
Export Performance0.9220.6710.5120.394
Financial Performance0.5960.8340.6880.555
Image and Reputation0.4820.6140.8500.862
Stakeholder Satisfaction0.3610.4810.7830.900
Note: Values on the diagonal are square roots of AVE. Under the diagonal: correlation between factors. Above the diagonal: HTMT ratio.
Table 4. Predictive Relevance of Indicators of the Model.
R2Q2Predictive Q2
Export Performance0.1530.120−0.106
Financial Performance0.2820.1800.183
Image and Reputation0.6230.4130.621
Stakeholder Satisfaction0.5560.4250.570

