Article

Kinetic Determination of Urease Activity in Fresh Pig Feces and Slurry and the Effect on Ammonia Production at Different Conditions

1
Institute of Environmental Biotechnology and Functional Materials, School of Environmental Science and Engineering, Shandong University, Qingdao 266237, China
2
State Key Laboratory of Atmospheric Boundary Layer Physics and Atmospheric Chemistry (LAPC), Institute of Atmospheric Physics, Chinese Academy of Sciences, Beijing 100029, China
3
Jiangxi Province Key Laboratory of the Causes and Control of Atmospheric Pollution, East China University of Technology, Nanchang 330013, China
*
Authors to whom correspondence should be addressed.
Sustainability 2019, 11(22), 6396; https://doi.org/10.3390/su11226396
Submission received: 29 October 2019 / Revised: 12 November 2019 / Accepted: 12 November 2019 / Published: 14 November 2019

Abstract

:
Ammonia (NH3) emissions have become a serious environmental pollution problem, and livestock production is an important source of NH3 emissions, especially pig farming. The origin of NH3 release is the hydrolysis of urea in urine that is catalyzed by urease present in feces. This research determined the urease activity in fresh feces by Michaelis–Menten kinetics and then compared the process of urea hydrolysis and ammonia production in fresh slurry. For feces, the kinetic parameters Vmax and Km were calculated by determining the concentration of ammonium in initial 5 minutes in closed vessels, and the resulting Vmax and Km were 26.9 ± 1.2 mmol·[urea]·kg−1·min−1 and 99.7 ± 3.5 mmol·[urea]·l−1, respectively. In fresh slurry, the rate of urea hydrolysis determined directly was higher than the ammonium formation rate in the early stage (0–8 h) and was accompanied by a rapid rise in pH. In addition, we further explored the effects of temperature, pH, and mixing rate on urease activity within different periods (0–5 min, 5 min–2 h and 2 h–8 h). Our observations show that the optimal urease activity occurred at 35 °C, pH 6.71, and 821.83 rpm of stirring, indicating that microbial species and communities associated with urease production are affected by environmental conditions.

1. Introduction

The NH3 emissions from anthropogenic activities have been rising since the industrial revolution. The total global NH3 emissions are 53.6 million tons NH3-N year−1, and anthropogenic sources account for about 80% of global NH3 [1]. From the state-of-the-art emission inventory EDGAR [2], the latest data shows that total global NH3 emissions were up to 58,942 Gg at 2012. The contribution of the livestock population (emissions from manure management and its application on fields) varies from 11,400 Gg NH3-N (1975) to 16,500 Gg NH3-N (2005), which accounts for 34.1% of total NH3 emissions [3]. NH3 emissions from agriculture originate from manure slurry (livestock housing, storage, and fertilization of fields) as well as urea-based mineral fertilizers [4,5,6]. China, the United States, and Europe are the main regions of agricultural NH3 emissions, with NH3 emissions from husbandry accounting for 21.77%, 35.68%, and 46.73% of total national emissions, respectively [3].
NH3 is a central problem in husbandry as it is an irritant and toxic to animal and staff. Atmospheric NH3 can also cause many negative effects (Figure 1). NH3 is an important precursor for the formation of fine particles (PM2.5) that contribute to great harm to human health [7]. In addition, NH3 as a major atmospheric pollutant can also lead to eutrophication of water, soil acidification, and loss of biodiversity [8,9].
Pig husbandry is one of the important sources of NH3 in the agriculture sector as it represents the largest livestock production sector in China and Europe [10,11,12]. NH3 release from buildings are the main source, accounting for about 50% of pig NH3 emissions [11]. Inside the pig house, the mixing of feces and urine promote the hydrolysis of urea in the urine by microbial urease present in the feces. One molecule of urea (CO(NH2)2) is decomposed into carbonic acid (H2CO3) and two volatile NH3 under the catalytic degradation of urease, as shown in Reaction 1 [13]. Urea is a very stable molecule with a half-life (t1/2) of approximately 40 years at 25 °C, and therefore, it is not spontaneously hydrolyzed (degraded) [14]. However, the half-time of the urease-catalyzed reaction is only 20 ms at 25 °C, making urease one of the most proficient enzymes known to date [14,15,16].
C O ( N H 2 ) 2   +   2 H 2 O   U r e a s e   H 2 C O 3 +   2 N H 3        
The factors affecting NH3 release in pig houses are varied, including housing and climate conditions, growth stages, diet composition, and manure management [11]. Since NH3 emission have received extensive attention in recent years, mitigation technologies have been developed, including diet manipulation, covering of storage tanks, acidification or cooling of manure, use of additives and solid–liquid separation. [17,18,19,20,21]. However, from the perspective of the source, the factors affecting NH3 volatilization in the field are very complicated and include, for example, urease activity, the manure management system, the pH values, the temperature, the relative humidity, and the air exchange flux [11,22,23,24]. Consequently, addition and use of urease inhibitors can effectively abate urease activity and reduce NH3 volatilization [11,25,26,27]. Therefore, the analysis of urease in pig feces is crucial.
However, most of the technologies are focused on animal manure management, but the mechanisms of ammonia production after the contact of feces and urine are unclear, especially the accurate determination of urease activity in fresh pig manure. As a result, the influencing factors are not clear, and these technologies are not significant enough. Previous studies on the livestock NH3 inventory were based on simply multiplying the emission factor by the AU (1 AU = [animal unit] = 500 kg) [28,29]. Furthermore, this simplicity of inventory magnifies the uncertainty of the atmospheric chemistry model. In order to develop prediction models and help NH3 mitigation, it is essential to better understand urease activity and NH3 production in the source.
The aim of this study was to determine the urease activity described by Michaelis-Menten kinetics and explore the influence of pH, temperature, and mixing rate on urease activity within 8 h of contact. In addition, the hydrolysis of urea and the change of NH4+ production and NH3 volatilization in the mixed reaction of fresh feces and urine were measured from the beginning of contact to 96 hours. The study carried out a regression analysis on the hydrolysis of urea and the NH3 production process, providing a theoretical basis for the prediction model of NH3 release in pig husbandry.

2. Materials and Methods

2.1. Sample Collection

Fresh manure of swine was collected in the house of fattening pig (120.58 E, 36.39 N) whose weights were between 60–120 kg and growth age was 3–6 months. Both feces and urine were grabbed manually at the excretion of pigs separately and were not exposed to the ground to avoid any pollution. The samples were kept in sealed plastic bags and placed in a 4 °C incubator during transportation. All feces and urine from five different pigs were evenly mixed with equivalent mass in the laboratory and stored in the biochemical refrigerator at 4 °C. In addition, some feces and urine were frozen at −20 °C for analysis of physical and chemical properties. Determinations for urease activity were completed on the day following sampling. To better understand the NH3 production, the feed for fattening pigs was collected. The fodder was a compound feed directly produced by the manufacturer, including crude protein (15.74%), crude fiber (5.21%), moisture (12.36%), coarse ash (4.86%), calcium (0.85%), total phosphorus (0.54%), sodium chloride (0.55%), and lysine (0.92%).

2.2. Analysis Methods

The fresh pig feces (PF) and urine (PU), including mixed slurry (MS), were analyzed in triplicate in terms of dry matter (DM), pH, total ammoniacal nitrogen (TAN = NH3-N+NH4+-N) concentration, urea concentration, and organic matter (OM) at the beginning and the end of the experiment (Table 1). The MS was prepared for mixing according to the ratio of feces: urine = 1:3 (weight: volume). The urine was centrifuged, the supernatant was taken, filtered, and diluted, and the fresh feces were dissolved in ultrapure water, shaken at 25 °C for 2 h, and then centrifuged and filtered. A high-pressure liquid chromatography (Shimadzu, SPD-20A, Kyota, Japan) and liquid chromatography column (Thermo Scientific, Hypersil GOLD aQ, Bellefonte, PA 16823, USA) were used for the determination of urea concentration. Ultrapure water was used as the mobile phase. The flow rate and detection wavelength were 0.6 mL·L−1 and 190 nm, respectively. An ion chromatograph (Dionex, ICS-900, San Jose, CA, USA) was used for the determination of concentration of TAN in all samples including NH3 acid absorption liquid and slurry samples, and the mobile phase was 20 mmol·L−1 (mM) methanesulfonic acid (Thermo Scientific, extra pure, ≥99%, USA). A pH meter (Mettler Toledo, FE28, Zurich, Switzerland) with ±0.01 pH units of accuracy was used for all pH measurements. For the measurements of pH, 5 g of fresh feces was weighed and thoroughly mixed with 15 mL of ultrapure water, and the slurry was directly measured with a pH meter at a later stage. The DM was determined by placing fresh PF and MS in a blast oven (HuiTai, DHG-9070A, Shanghai, China) at 105 °C for at least 24 h until the mass was constant. As for the determination of the OM content, the combustion weight loss method was employed. The dried fresh PF and MS were ground and crushed, filtered through a 40 mesh sieve, and then burned at 550 °C for 3 h in a muffle furnace (LongKou, SA2-4-14TP, Yantai, China) to calculate the lost mass. A constant temperature water bath magnetic stirrer (Great Wall, HWCL-1, Zhengzhou, China) was used for temperature control and stirring of the sample. A high-speed refrigerated centrifuge (Sigma, 3K15, Osterode, Germany) was used for centrifugation. With the exception of OM in the initial feces and final slurry, all the values were measured on a wet basis.

2.3. Experimental Setup

2.3.1. Kinetic Characterization of Urease in Fresh Pig Feces

To determine the kinetics of urease activity in fresh pig manure, it was first necessary to ensure the stability of the pH and temperature of the reaction system. Firstly, 0.2 M phosphate buffer solution with pH = 7.0 was prepared by mixing 1 M NaH2PO4·2H2O (Sinopharm, AR, ≥99.0%, Shanghai, China) and Na2HPO4·12H2O (Sinopharm, AR, ≥99.0%, Shanghai, China) in a certain proportion. May and Douglas [30] and Dai and Karring [31] used phosphate buffer to determine the urease activity in soil and animal feces, respectively. In addition, a constant temperature water bath controlled the reaction process at 25 °C, and a magnetic stirrer maintained the mixing process of the sample at 300 rpm. In fact, the complex waste generated by the livestock industry included not only feces and urine, but also feed residues and drinking water [32]. Therefore, some previous studies have suggested that the ratio of feces to urine was 1:3 (w: v) to simulate the production of fattening pig houses [33,34]. The PF samples were placed in a water bath at a constant temperature of 25 °C before the kinetic experiments. To achieve the best experimental results, the following urea concentrations were set: 0 mM, 20 mM, 40 mM, 80 mM, 100 mM, 200 mM, 400 mM, and 600 mM. Urea solid particles (Aladdin, metal basis, 99.999%, Shanghai, China) were used to make urea standard solutions and stock solutions. For each urea concentration, the amount of TAN produced during the 5 min reaction time was calculated by subtracting the initial amounts of TAN in feces from the final amount of TAN at the end of the reaction. After 5 min under closed conditions, 1 mL of the mixture sample was taken and added to 1 mL of a 0.1 M sulfuric acid solution to inhibit urease activity. After that, the sample was centrifuged at 7000 rpm for 10 min at 4 °C, and the supernatant was taken for ion chromatography to determine the ammonium nitrogen concentration.

2.3.2. Effect of Temperature, pH, and Mixing Rate on Urease Activity of Fresh Pig Feces

The fecal urease activity was determined at different temperature values of 15 °C, 20 °C, 25 °C, 30 °C, and 35 °C under the condition of pH 7.0 and 300 rpm of magnetic stirring. Then, the experiment further explored the effect of urease activity on different pH values at pH 5.0, 6.0, 7.0, 8.0, and 9.0. NaOH (Sinopharm, AR, ≥96%, Shanghai, China) and H2SO4 standard solution (Boyao, 1.0009 mol·L−1, Shanghai, China) were used to adjust the pH of fecal mixture. Acetic acid (Sinopharm, AR, ≥99.5%, Shanghai, China)/sodium acetate (Sinopharm, AR, ≥99.0%, Shanghai, China) buffer solution at a 0.2 M concentration was used in the reaction system for pH 5.0, 0.2 M phosphate buffer solution was used to maintain pH 6.0, 7.0, and 8.0, and 0.2 M boric acid (Sinopharm, AR, ≥99.5%, Shanghai, China)/borax (Sinopharm, AR, ≥99.5%, Shanghai, China) solution was used as a buffer for pH 9.0. Furthermore, the effect of stirring speed on urease activity was set to a gradient of 0 rpm, 200 rpm, 500 rpm, 800 rpm, and 1200 rpm at 25 °C and pH 7.0. According to the kinetic measurements of urease activity in feces, the optimal reaction rate occurred at a urea concentration of 400 mM. A concentration of 400 mM was used to measure the urease activity at different temperature, pH, and mixing rate to reflect the optimal potential of urease. After 5 min, 0.5 h, 1 h, 2 h, and 8 h of reaction, the TAN concentration was determined to analyze urease activity. In addition to pH, temperature and stirring rate were achieved by constant temperature water bath and magnetic stirring, respectively. All the experiments were performed in triplicate.

2.3.3. Determination of Urease Activity in Fresh Slurry

Fresh feces and urine mixed in a ratio of 1:3 (w: v) made up the fresh slurry. The reaction was carried out for a total of 96 h at 25 °C, the fresh MS was placed in closed vessel covered by a double layer of plastic wrap, and the sampling time was set to 5 min, 0.5 h, 1 h, 2 h, 8 h, 20 h, 48 h, 72 h, and 96 h, respectively. The TAN concentration, urea concentration, and pH were measured as soon as possible after mixing (time = 5 min). At the same time, the volatile NH3 was measured using acid with 10 mL 0.1 M H2SO4 placed in the gas cylinder. In this method, the pump worked to absorb the volatile NH3 from the headspace of each glass vessel into the acid solution. The experimental device is shown in Figure 2. The initial TAN concentration of slurry was obtained by the addition of fresh PF and PU alone. The determination of urease activity in fresh slurry directly evaluated the hydrolysis of urea, the changes of pH, and the production of TAN.

2.4. Statistical Data Treatment

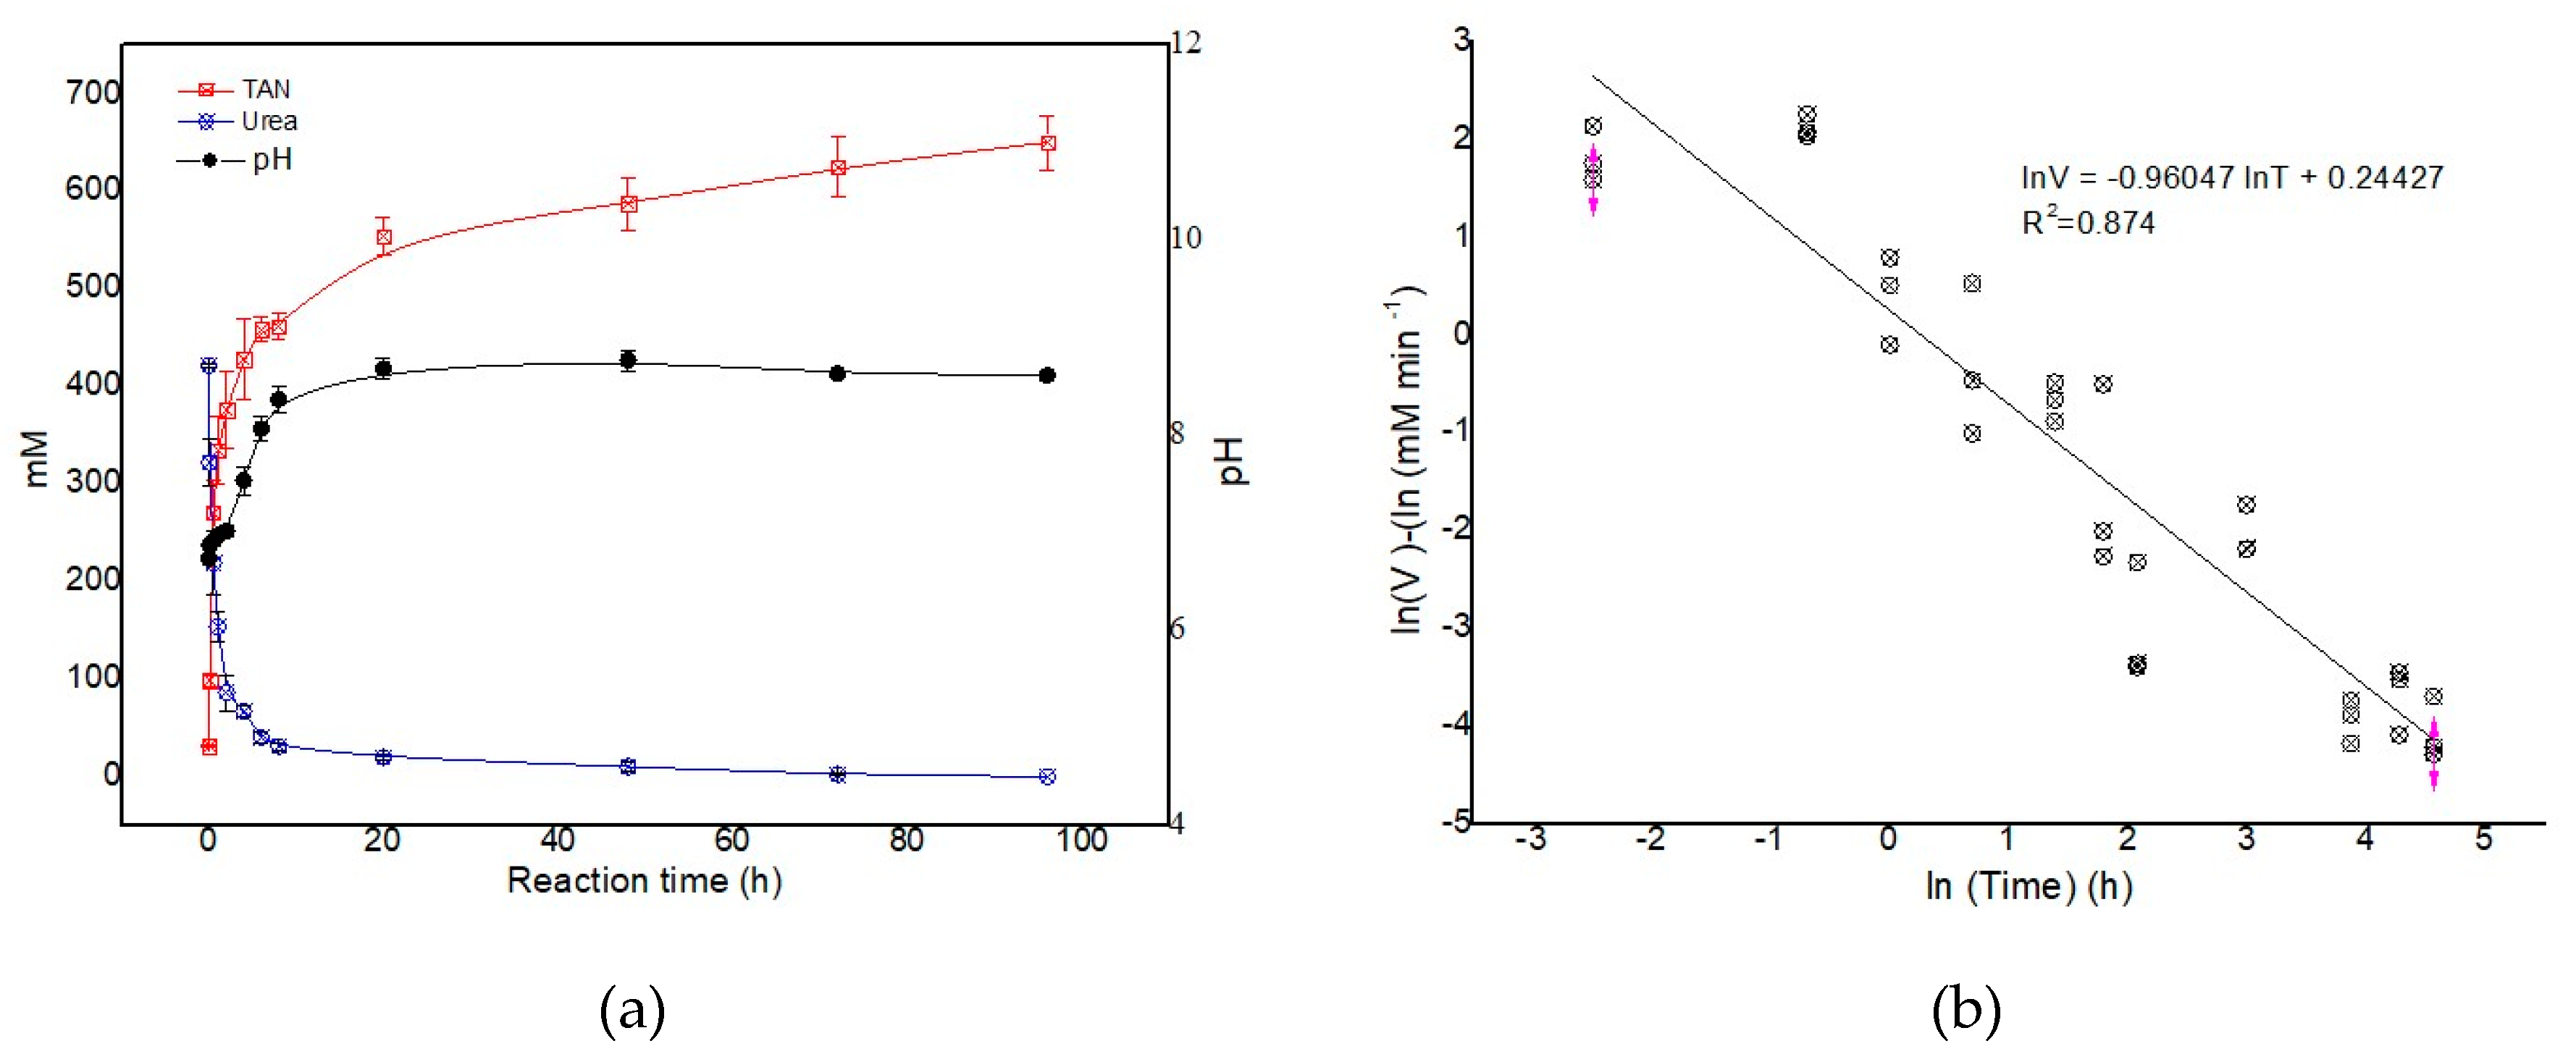
All the experiments were triplicated. The mean values for the main characteristics of fresh feces, urine, and slurry were analyzed by one-way analysis of variance (ANOVA) and the Tukey test at the p < 0.05 level. This method was also used to compare the evolution of TAN formation in different conditions. Regression analysis was used to determine the maximum urea hydrolysis level, the evolution of TAN, and urea concentration in slurry as shown in Figure 3b, Figure 6a,b. The IBM SPSS Statistics 22.0 software package was used for the statistical analyses, and Design-Expert 8.05 version was used in response surface methodology (RSM) under different conditions.
The DM and OM were calculated as Equation (1) and Equation (2):
DM   ( % ) = m initial     m dry   , final m   initial × 100 %
OM   ( % )   = m dry   , final     m burn ,   final m dry   , final × 100 %
where minitial is the mass of fresh pig feces, mdry, final represents the mass after drying, and mburu,final is the mass of the muffle after burning. All the experiments were performed in triplicate.
The enzymatic reactions of urease can be described by Michaelis–Menten kinetics according to Equation (3).
V   = V m a x [ S ] ( K m + [ S ] )
where V is the rate of the enzymatic reaction, [S] is the substrate concentration, Vmax is the maximum rate of the enzymatic reaction, and Km is the apparent Michaelis constant [33]. The Michaelis–Menten kinetic curve shows that the enzymatic reaction can be divided into two stages: a first-order reaction and zero-order reaction [35,36]. The Km value reflects the affinity between the substrate and the enzyme. The larger the Km value, the smaller the affinity and the lower the catalytic activity of the enzyme [35,37].
Equation (3) becomes linear in form upon taking the reciprocal of both sides, as shown in Equation (4), that is, it is a Lineweaver–Burk plot [37].
1 V =   K m V m a x [ S ] +   1 V m a x
When l/V is plotted against 1/[S], the ordinate intercept is 1/Vmax and the slope of the straight line is Km/Vmax, thus the urease activity can be evaluated by the regression method of Equation (4).

3. Results and Discussion

3.1. Chemical and Physical Properties of Fresh Pig Feces, Urine and Mixed Slurry

The initial properties including the TAN, urea concentration, the content of DM and OM, and pH of fresh PF, PU, and MS (after 96 h incubation) are given in Table 1. The pH values of both pig feces and urine were similar, at 6.73 ± 0.02 and 6.93 ± 0.01, respectively. Once the PF and PU contacted and mixed enough, the pH values rose rapidly and remained at 8.61 ± 0.04 after 96 h. The DM of PF (29.63 ± 0.26%) was approximately 22% higher than the MS (7.76 ± 0.18%) because of the addition of large amounts of liquid urine and the decomposition of some dry matter. In the meantime, changes in OM content also confirmed this observation. The OM content in the fully reacted slurry at 96 h decreased by 9.33% compared with the fresh feces, caused by the activities of microorganisms. The TAN value in the fresh feces (69.0 ± 8.1 mmol·kg−1) was higher than the urine (31.6 ± 1.3 mM), but the concentration of urea in the initial urea was as high as 421.7 ± 1.1 mM, which was 5.2 times higher than that in the feces (81.3 ± 5.2 mmol·kg−1) (p < 0.05). After 96 h incubation, the TAN values of MS increased significantly (p < 0.05), but the urea concentration became undetectable. The ammonium nitrogen in the slurry was mainly from the hydrolysis of urea in urine instead of the mineralization of feces throughout this period [6,16].
Dietary protein levels affect urea excretion and hence NH3 production in fattening pigs. The contents of crude protein, crude fiber, dry matter, and lysine in the collected feed were consistent with previous research [32,38]. The dry matter of feces observed was higher than the results of Dai and Karring [31] and coincided with those reported by Canh et al. [33]. The TAN and pH of fresh pig feces and urine (Table 1) was also consistent with previous results [31], but the values for slurry were higher than previously reported [38]. The urea concentrations of feces and urine were 2.16 and 4.25 times the concentrations of Canh et al. [33] (195.2 mM) and Dai and Karring [31] (99.2 ± 2.5 mM), respectively. These results show that the TAN and urea concentrations of pig urine and slurry in this study were relatively high.

3.2. Urease Activity in Fresh Feces from Fattening Pigs

The urease activity in fresh feces from fattening pigs were investigated by calculating the rates of TAN formation in the mixture of fresh PF and urea solutions of different concentrations. Since the rate of TAN formation decreased significantly with time, the reaction time was fixed at 5 minutes to achieve significant and optimal measurements [31]. When urea concentration increased from 0 to 600 mM, the fresh pig feces reached the maximum rate of TAN formation in 400 mM urea solution. It did not increase in 600 mM solution, probably due to the saturation of the reaction or inhibition from the substrate. According to the kinetic requirements of enzymatic reactions, the reaction rates of TAN formation per wet weight (mmol·kg−1·min−1) were calculated and converted into specific reaction rates of urea hydrolysis (mmol·[urea]·kg−1·min−1) based on Reaction 1. The rates of urea hydrolysis are presented in Michaelis-Menten curves and Lineweaver–Burk plots using regression analyses (Equations (5) and (6)). The specific Vmax and the Km values were determined. The maximum rate of TAN formation in reaction with fresh pig feces was 53.8 ± 2.5 mmol·kg−1·min−1 at a urea concentration of 400 mM. From the Michaelis–Menten curves, the specific Vmax and the Km values of urease activity in fresh pig feces were 26.9 ± 1.2 mmol·[urea]·kg−1·min−1 and 99.7 ± 3.5 mmol·[urea]·l−1, respectively (Figure 3). For comparison, the specific Vmax and the Km values were also measured from the Lineweaver-Burk plots and were 45.5 mmol·[urea]·kg−1·min−1 and 168.8 mmol·[urea]·l−1, respectively (Figure 3). These values were larger than those determined from the Michaelis-Menten curves since the Michaelis–Menten curve close to Vmax is a gradual process, and the predicted Vmax value is less than that measured after regression analysis. Consequently, the Vmax and Km values from the Lineweaver–Burk plots are more accurate.
V 0   =   6.716 l n   [ U r e a ] 14.544   ( R 2   =   0.952 )
1 V 0 = 3.71082 [ U r e a ] + 0.02918               ( R 2 = 0.942 )
The concentration of TAN formation was determined and compared in the mixtures of feces-urine and feces–urea solution (same as urea concentration in urine) in the initial 5 minutes, 30 minutes, and 1 hour. The hydrolysis of urea was faster in urea solution than in urine. The corresponding rates of TAN formation were converted into the urea-based hydrolysis rate (mmol·[urea]·kg−1·min−1) for better comparison and description of kinetics (Figure 3a). The maximum rate of urea hydrolysis and the Km value are larger than those previously reported by Dai and Karring [31] (Vmax = 2.06 ± 0.08 mmol·[urea]·kg−1·min−1, Km = 32.59 ± 5.65 mmol·[urea]·l−1). Several factors including the collected sample, microbial activities, experimental temperature, reaction time, agitation degree, and determination method may lead to the large variations [13]. This study has been strictly controlled from sample collection to experimental procedures. Compared with the Vmax and Km value of urease in cattle feces, pig feces had a higher Km value in the same conditions [31]. The urease in plants (like jack bean) is the most widespread in nature, and the Km values were between 2.9–3.6 mmol·[urea]·l−1 for jack bean urease and between 0.2–0.6 mmol·[urea]·l−1 for soybean [39]. This shows that plant urease has better affinity with the substrate than urease in feces.

3.3. TheEffects of Temperature, pH, and Mixing Rate on Urease Activity in Fresh Pig Feces

To the best of our knowledge, there is no available data on the mechanism of NH3 emission under different conditions. In order to directly compare urease activity in fresh feces under different conditions, temperature, pH, and mixing rate were evaluated. The TAN concentrations of samples were determined at 5 min, 30 min, 1 h, 2 h, and 8 h. The reaction time was divided into 3 stages: the first 5 minutes, from 5 minutes to 2 hours, and from 2 hours to 8 hours. The rates and amount of TAN formation were calculated in three different stages at different temperature, pH, and mixing rate values (Figure 4). The reference condition of TAN formation is 25 °C, pH 7.0, and 300 rpm.
The total TAN production in the full 8 hours and the first 5 minutes were 414.5 mM and 170.2 mM (p < 0.05) at 25 °C (Figure 4). The relative total amounts of TAN formation were 18.46%, 45.57%, 103.47%, and 151.75% at temperature values of 15 °C, 20 °C, 30 °C, and 35 °C compared to 25 °C, respectively. The production of TAN was greatly reduced at low temperature (Figure 4a). The maximum rate determined for TAN formation reached 51.7 ± 10.2 mM·min−1 in the first 5 minutes at 35 °C. The pH values were stable at low temperature (15–20 °C), but once the temperature reached 25 °C or higher, the buffer capacity of the substrate would decrease, corresponding to the increase of pH values in third stage (2 h–8 h).This result proved that temperature was the key factor promoting urea hydrolysis from 15 °C to 35 °C. Dewes [40] and Van der Stelt et al. [41] also proved that NH3 volatilization in slurry was significantly affected by temperature.
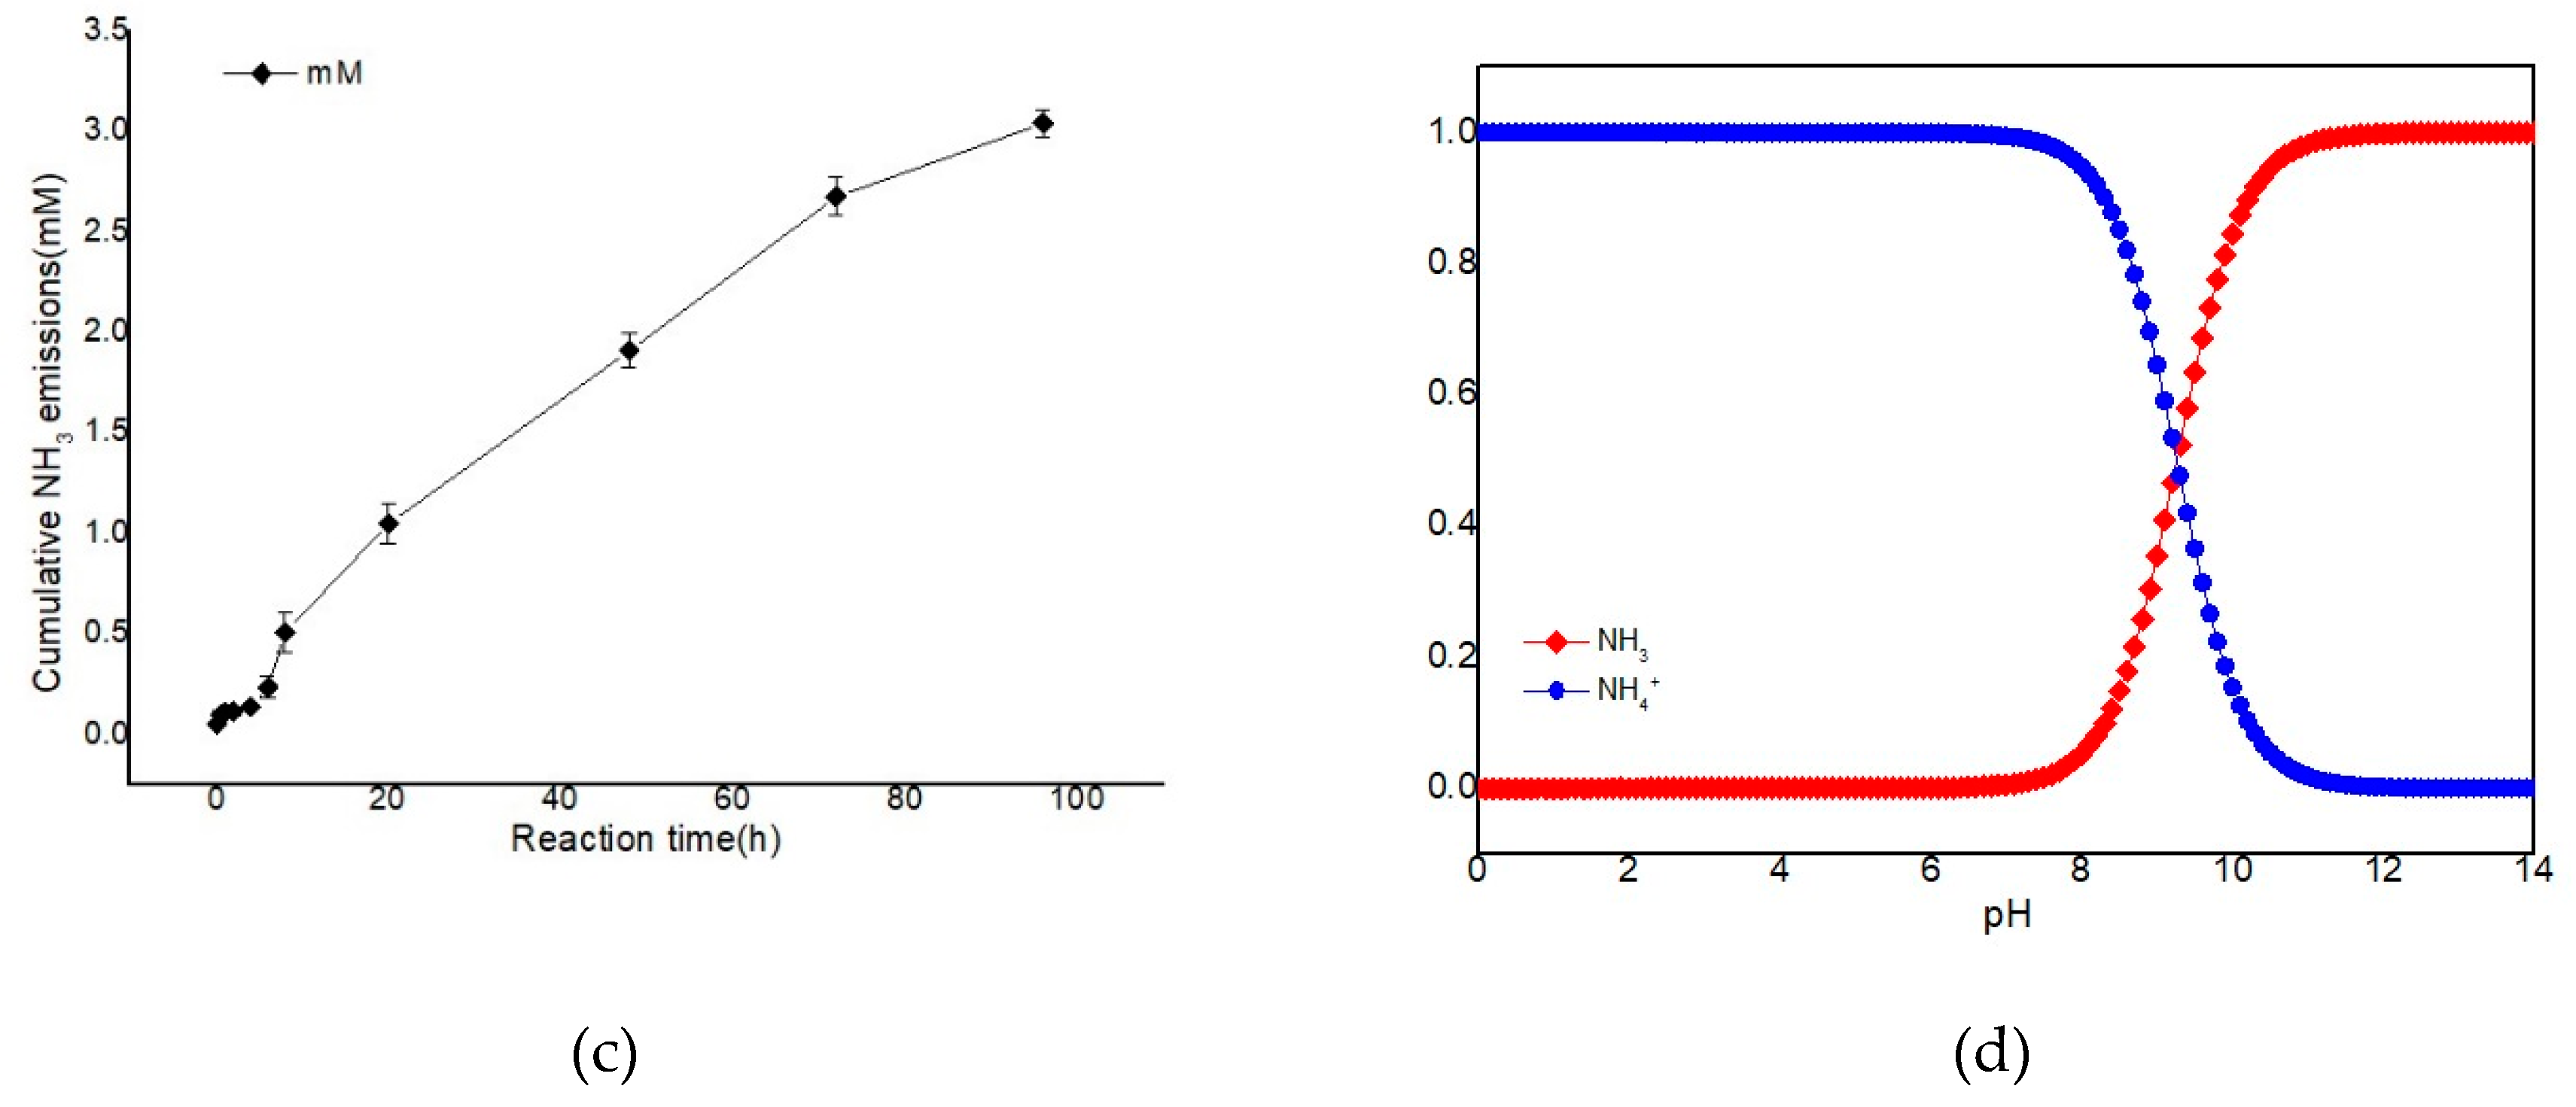
For different pH values, TAN production in 8 hours shows that the urease maintained high activity at lower pH values (5.0 and 6.0) (Figure 4b). The maximum TAN production was 501.8 mM at pH 6.0, while the TAN formation rate at pH 7.0 was the fastest (35.0 ± 2.8 mM·min−1) in the initial 5 minutes. The urease activity was sensitive to pH changes, and the optimum performance of the TAN formation rate was 7.7 ± 1.5, 27.0 ± 5.3, 6.0 ± 2.2, and 2.2 ± 0.6 mM·min−1 at pH 5.0, 6.0, 8.0, and 9.0, respectively. The relative amounts of TAN production were calculated with reference to the enzyme catalytic process at pH 7.0 in 8 hours and the first 5 minutes. At pH 5.0, 6.0, 7.0, 8.0, and 9.0, the amount of TAN formation in the first 5 minutes accounted for 8.83%, 26.89%, 39.89%, 10.43%, and 9.00% of that in 8 hours, respectively. The results suggest that the optimal pH for urea hydrolysis by urease in fresh pig feces is 7.0 in the first stage, and that is consistent with the report by Dewes [40] and Dai and Karring [31]. The pH values were stable in higher pH buffer solution (pH 8.0 and 9.0), but the buffer capacity of the buffer solution would decrease with TAN production, and the pH began to rise in the third stage at initial pH values of 5.0, 6.0, and 7.0; the pH finally reached 8.56, 8.83, and 8.86 after 8 hours, respectively. According to the balance of NH3-NH4+, the release of NH3 accounted for 5.21% and 35.47% of the total TAN production at pH 8.0 and 9.0, respectively (Figure 6d). The results indicated that the effect of pH conditions on the predominant ureolytic bacterial species was evident and the changes in ionic systems were more complex in the reaction process.
The maximum production of TAN in 8 hours was achieved at 500 rpm (686.3 ± 22.4 mM). The maximum rate of TAN formation occurred at the first 5 minutes at the magnetic stirring speed of 800 rpm (47.3 ± 8.1 mM·min−1) (Figure 4c). At the low agitation levels, the amount of TAN remaining in mixtures was significantly higher than at high speed (p < 0.05). Taking the TAN production at pH 7.0 and 300 rpm as a reference, the relative productions of TAN were 60.62%, 131.11%, 156.50%, 97.32%, and 80.96% in the whole process of 8 hours at mixing rate values of 0 rpm, 200 rpm, 500 rpm, 800 rpm, and 1200 rpm, respectively. The low agitation could not reduce TAN production for a long time, but the initial stage was significantly affected. Excessive mixing rates did not allow more TAN to remain in the fecal system. The excessive mixing rate probably caused the pH to rise rapidly, accompanied by a large release of gaseous NH3 (Figure 6d). Van der Stelt et al. [41] found that mixing promoted the volatilization of NH3 in the slurry in the presence of additives.
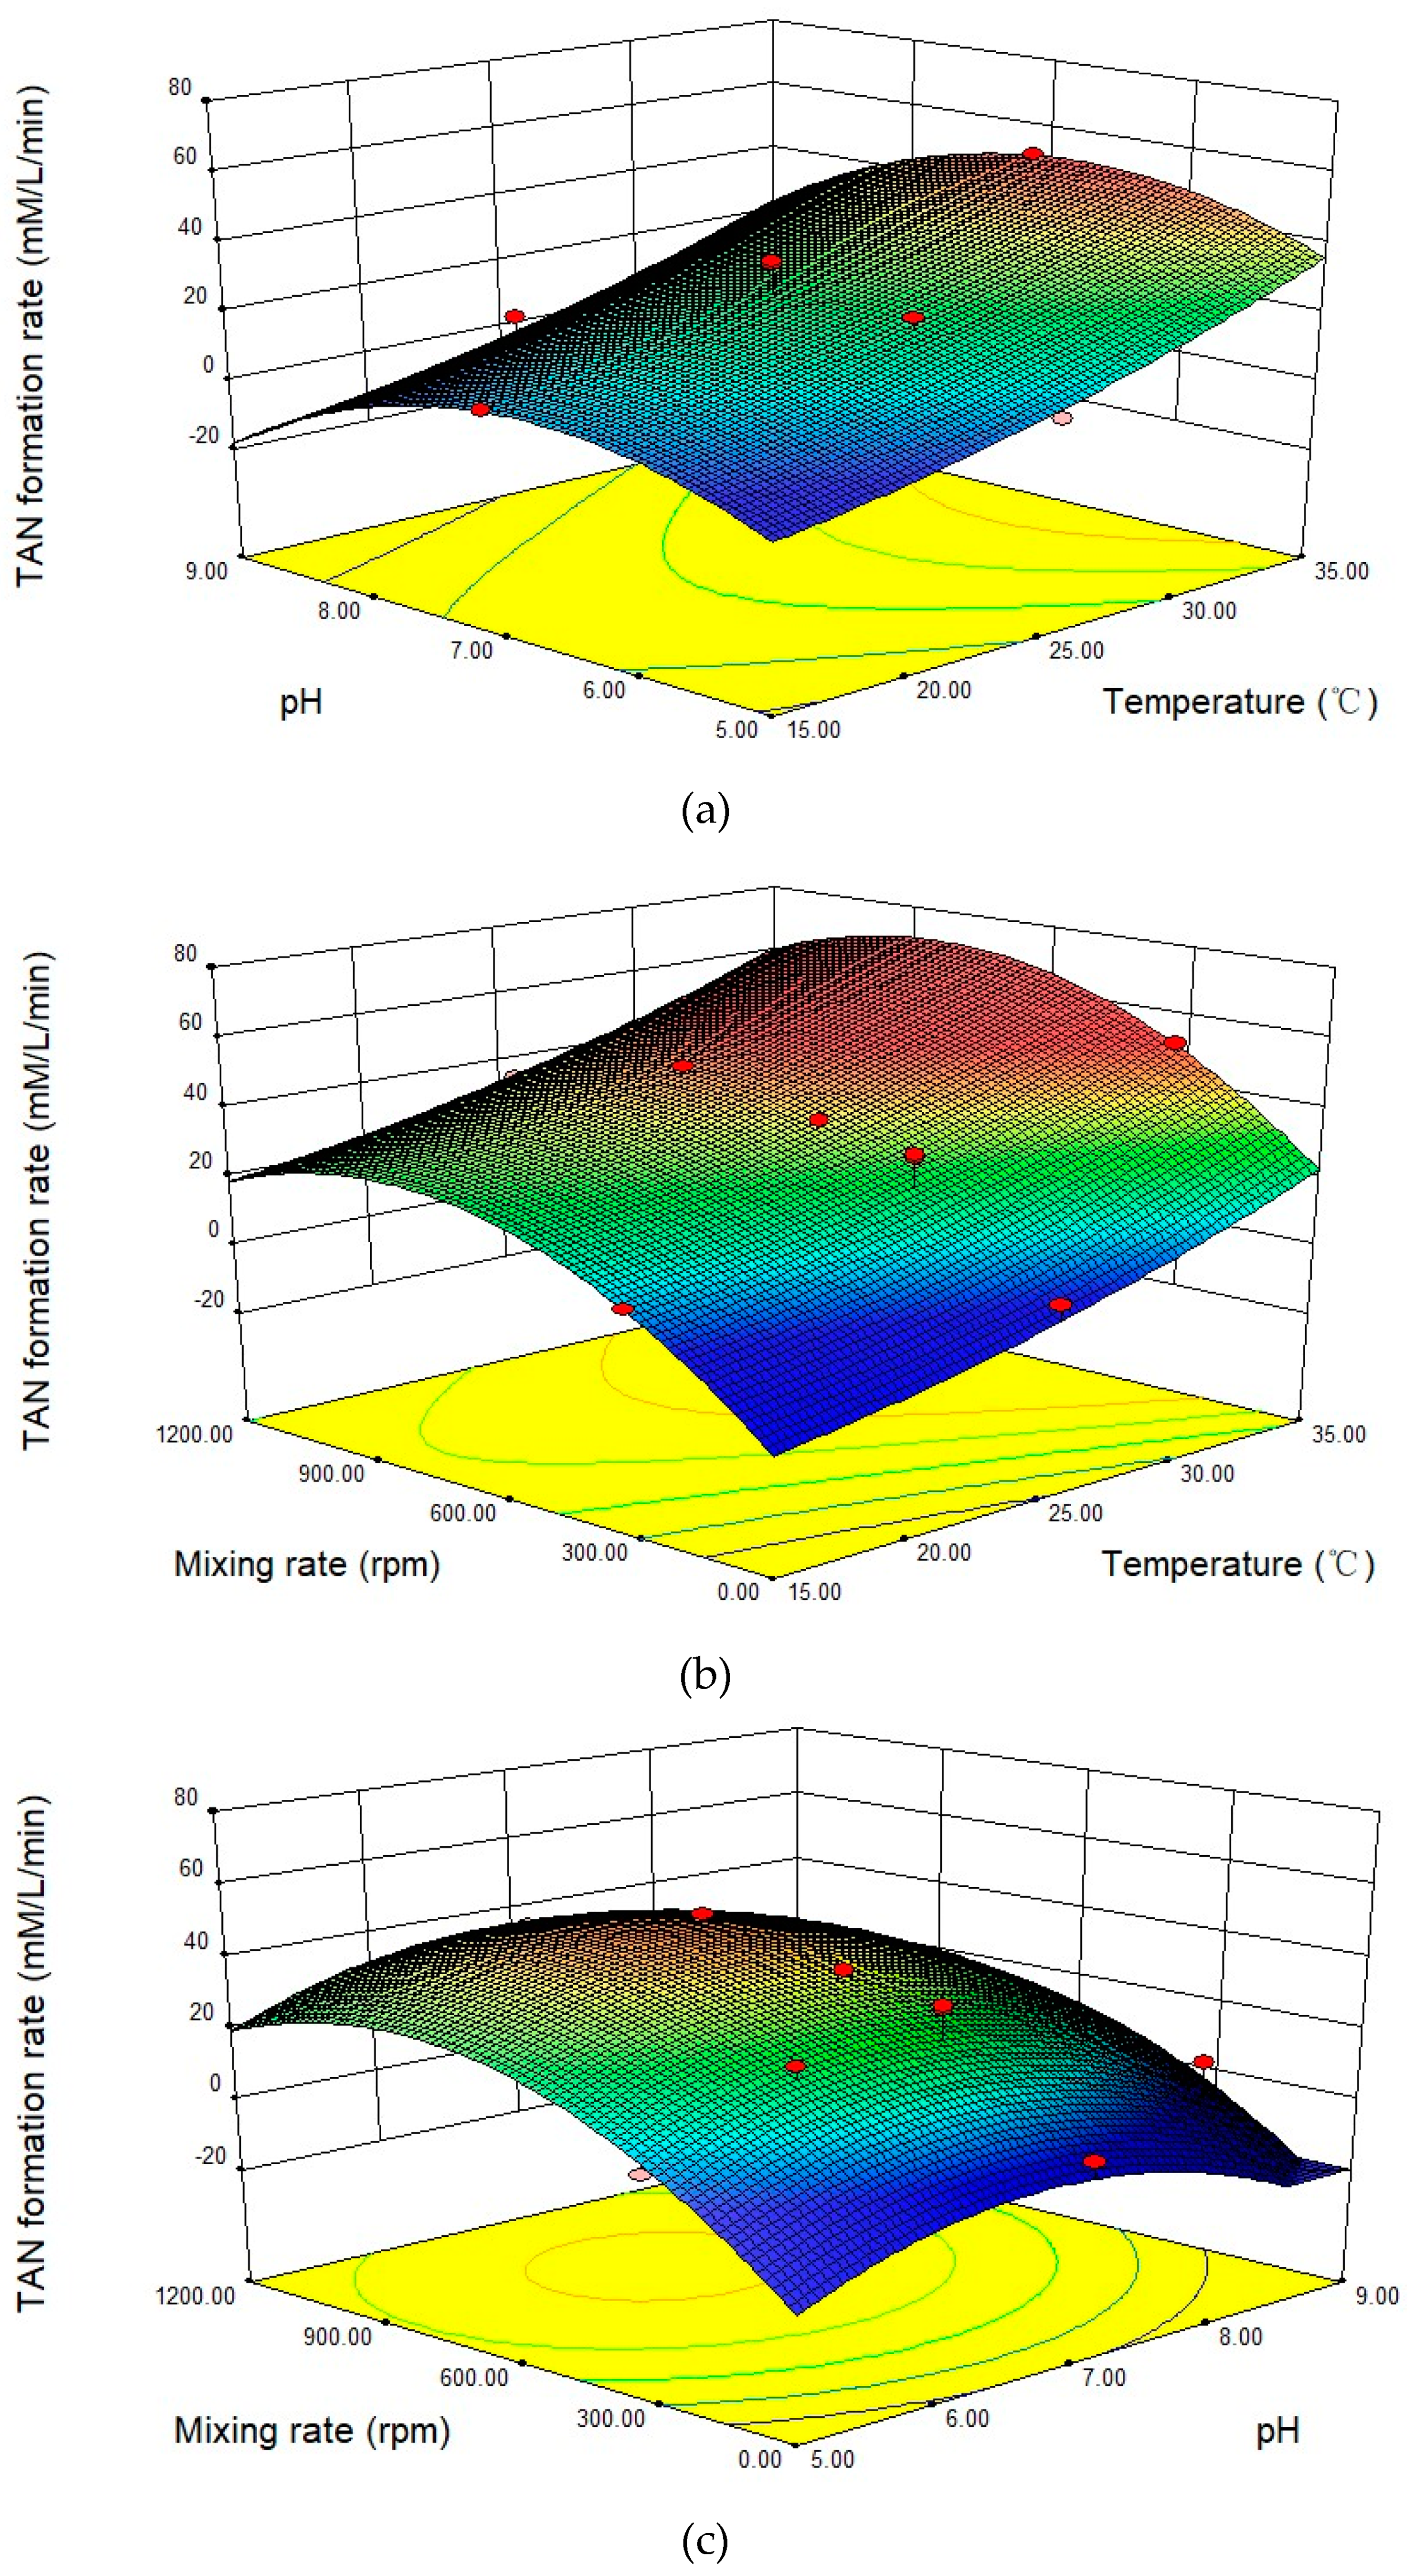
To further define the optimal experimental conditions affecting the production of TAN, a response surface analysis was performed. While maintaining a single factor constant, the TAN formation rate was used as the response value, and the interaction of the other two conditions on the response value was explored in the initial 5 minutes (Figure 5). From the above response surface analysis, when the temperature was 35°C, pH = 6.71, and the mixing rate reached 821.83 rpm in the initial 5 minutes, the urease in fresh PF showed the best activity. A higher temperature was not tested because there was not actually such a high temperature in the pig house.

3.4. The Hydrolysis of Urea and Production of TAN in Fresh Pig Slurry

To further explore urease activity in fresh slurry from fattening pigs, fresh feces and urine were mixed at ratio of 1:3 (w: v) [33,34]. The entire process continued for 96 hours. In addition to the TAN formation and urea hydrolysis, the changes in pH value and the volatilized NH3 were also measured. The maximum rate of TAN formation taken at the first 5 min was 13.4 ± 1.5 mM·min−1 (Figure 6b). Compared with the rate of TAN formation in cattle slurry, it was faster in pig slurry [31]. The maximum rate of urea hydrolysis was 20.0 ± 4.5 mM·min−1. In the initial 8 hours of the reaction, the hydrolysis rate of urea in the urine was higher than the rate of production of TAN. The concentration of formed TAN and the pH increased rapidly in the initial 8 hours, and the urea concentration in slurry also dropped very quickly at the same time (Figure 6a). The TAN concentration increased slowly after 20 h and eventually stayed at 650.2 ± 20.0 mM at the end of the experiment. However, urea was not detected at 96 h, and the total urea content in fresh pig urine was 421.7 ± 1.4 mM (Table 1). The regression analyses of the concentration of the formed TAN and urea in fecal slurry are shown in Equations (7) and (8). To better understand the process of TAN formation at different times, the rate of TAN formation and cumulative NH3 volatilization were calculated, respectively. According to the regression analyses of the TAN formation rate (Equation (9)), it reaches a plateau of 0.02 mM·min−1 after 8 h.
C T A N =   343.476   +   60.159 l n T       ( R 2 =   0.913 )
C U r e a   =   137.471 +   34.716 l n T       ( R 2 =   0.908 )
l n V   =   0.96047 l n T   +   0.24427 ( R 2 =   0.874 )
The pH in pig slurry eventually stabilized at 8.60 and increased by a total of 1.87 pH units from the initial pH of 6.73. The change in pH in cattle slurry was less than that in pig slurry at the same time [31]. The increase in pH is caused by the production of NH3. In addition, the cumulative release of NH3 reached 3.0 ± 1.4 mM during the entire experimental process based on the closed condition (Figure 6c). The maximum NH3 release rate was 0.0093 ± 0.0018 mM·min−1 at the initial stage of the reaction, and the rate reached a plateau between 0.0011 to 0.0021 mM·min−1 after 8 h. The results indicate that the total amounts of urea hydrolysis and TAN formation are substantially identical taking into account the biologically utilized NH4+ and volatilized NH3 during the whole process. Some previous studies have suggested that intermediates are produced in the reaction catalyzed by urease and the intermediate is mainly carbamate [42,43,44,45]. This also indirectly proves the result of a mismatch between urea hydrolysis and TAN production.
Data on the NH3 emissions from the contact between the feces and urine are lacking. The NH3 volatilization is similar to the results of Regueiro et al. [46] who directly collected fresh slurry during the same storage time. Probably due to the addition of wastewater, the cumulative NH3 emissions from the Van der Stelt et al. [42] experiment at 20 °C and 35 °C for 4 days are lower than in this paper. NH3 was not completely released as urea was hydrolyzed, and the release of NH3 was a slow and continuous process. This also proved the existence of intermediates. The hydrolysis of urea in slurry is mainly concentrated 8 hours after the mixing of the feces and urine (Figure 6a). Therefore, separation of feces and urine during the concentrated time of pig excretion is very effective in reducing the hydrolysis of urea. Such measures can not only reduce NH3 emissions from the origin but also effectively store urea in the urine. In this study, the main factors affecting the NH3 volatilization are changes in pH and mixing degree while maintaining the same temperature. The results show that the TAN production without stirring accounts for 4.09% of the 300 rpm in the initial 5 min. In addition, manure acidification is a highly praised technology that originated in Denmark in recent years, and by adding sulfuric acid to pH 5.0, urease activity can be abated to a certain extent and NH3 emission reduction can also be achieved [20,46]. Furthermore, there are still some measures that can reduce the evaporation of NH3, such as the cover of slurry, biological filter beds, reducing dietary crude protein, and so on [46,47]. Under strict control of sample collection and mixing conditions, this study accurately analyzed the process of TAN production, the hydrolysis of urea, and the change in pH in fresh slurry (after contact with feces and urine), as well as the volatilization of NH3. The exploration of the urea hydrolysis process can make the measures and technologies for reducing NH3 emissions more targeted and effective.

4. Conclusions

The results show that the maximum rate calculated for TAN formation was 53.8 ± 2.5 mmol·kg−1·min−1 at a urea concentration of 400 mM, and the specific Vmax and Km values of the urease activity in fresh pig feces were 26.9 ± 1.2 mmol·[urea]·kg−1·min−1 and 99.7 ± 3.5 mmol·[urea]·l−1, respectively. The optimal urease activity occurred at 35 °C, pH 6.71, and 821.83 rpm of stirring for the first 5 minutes. In fresh slurry, the rate of urea hydrolysis determined directly was higher than the corresponding TAN formation rate in the early stage of reaction (0–8 h) and was accompanied by a rapid rise in pH at the same time. The release of NH3 was a slow process in which intermediates were present during the hydrolysis of urea. Low temperature, low pH, and controlled agitation can effectively inhibit urease activity. The hydrolysis of urea in slurry is mainly concentrated 8 hours after the mixing of the feces and urine. Therefore, separation of feces and urine during the concentrated time of pig excretion is very effective in reducing the hydrolysis of urea.

Author Contributions

Conceptualization, C.H.; Data curation, C.H.; Formal analysis, Y.P.; Funding acquisition, Y.Z.; Investigation, C.H.; Methodology, Z.Z.; Project administration, Y.Z.; Resources, Y.Z. and Y.P.; Supervision, Y.Z. and Y.P.; Validation, Z.Z.; Visualization, C.H.; Writing—original draft, C.H.; Writing—review & editing, Y.Z.

Funding

This research was funded by the National Natural Science Foundation of China, grant number 21777085 and 21607094; and the Natural Science Foundation of Shandong Province, grant number ZR2016BQ29.

Acknowledgments

This work was financially supported by the National Natural Science Foundation of China under the Youth Science Fund Project (21607094), the National Natural Science Foundation of China (21777085) and the Youth Science Foundation of Natural Science Foundation of Shandong Province (ZR2016BQ29).

Conflicts of Interest

The authors declare no conflict of interest.

References

  1. Bouwman, A.F.; Lee, D.S.; Asman, W.A.H.; Dentener, F.J.; Van Der Hoek, K.W.; Olivier, J.G.J. A global high-resolution emission inventory for ammonia. Glob. Biogeochem. Cycles 1997, 11, 561–587. [Google Scholar] [CrossRef]
  2. Emission Database for Global Atmospheric Research (EDGAR), Release Version 4.3. Available online: https://edgar.jrc.ec.europa.eu/overview.php?v=432_AP (accessed on 28 June 2019).
  3. Behera, S.N.; Sharma, M.; Aneja, V.P.; Balasubramanian, R. Ammonia in the atmosphere: A review on emission sources, atmospheric chemistry and deposition on terrestrial bodies. Environ. Sci. Pollut. Res. 2013, 20, 8092–8131. [Google Scholar] [CrossRef] [PubMed]
  4. Asman, W.A.H.; Sutton, M.A.; Schjoerring, J.K. Ammonia: Emission, atmospheric transport and deposition. New Phytol. 1998, 139, 27–48. [Google Scholar] [CrossRef]
  5. Battye, W. Evaluation and improvement of ammonia emissions inventories. Atmos. Environ. 2003, 37, 3873–3883. [Google Scholar] [CrossRef]
  6. Jens, J.S.; Simon, S.; Henrik, K. The molecular processes of urea hydrolysis in relation to ammonia emissions from agriculture. Rev. Environ. Sci. Biotechnol. 2018, 17, 241–258. [Google Scholar]
  7. Squizzato, S.; Masiol, M.; Innocente, E.; Pecorari, E.; Rampazzo, G.; Pavoni, B. A procedure to assess local and long-range transport contributions to PM2.5 and secondary inorganic aerosol. J. Aerosol. Sci. 2012, 46, 64–76. [Google Scholar] [CrossRef]
  8. Pearson, J.; Stewart, G.R. Tansley Review No. 56. The Deposition of Atmospheric Ammonia and Its Effects on Plants. New Phytol. 1993, 125, 283–305. [Google Scholar] [CrossRef]
  9. Krupa, S.V. Effects of atmospheric ammonia (NH3) on terrestrial vegetation: A review. Environ. Pollut. 2003, 124, 179–221. [Google Scholar] [CrossRef]
  10. Zhang, Y.; Dore, A.J.; Ma, L.; Liu, X.J.; Ma, W.Q.; Cape, J.N.; Zhang, F.S. Agricultural ammonia emissions inventory and spatial distribution in the North China Plain. Environ. Pollut. 2010, 158, 490–501. [Google Scholar] [CrossRef]
  11. Philippe, F.; Cabaraux, J.; Nicks, B. Ammonia emissions from pig houses: Influencing factors and mitigation techniques. Agric. Ecosyst. Environ. 2011, 141, 245–260. [Google Scholar] [CrossRef]
  12. FAOSTAT. Agriculture Statistics. 2014. Available online: http://faostat3.fao.org/browse/G1/GM/E (accessed on 25 May 2015).
  13. Mobley, H.L.; Island, M.D.; Hausinger, R.P. Molecular biology of microbial ureases. Microbiol. Rev. 1995, 59, 451–480. [Google Scholar]
  14. Callahan, B.P.; Yuan, Y.; Wolfenden, R. The burden borne by urease. J. Am. Chem. Soc. 2005, 127, 10828–10829. [Google Scholar] [CrossRef]
  15. Laidler, K.J.; Hoare, J.P. The molecular kinetics of the urea-urease system. III. Heats and entropies of complex formation and reaction. J. Am. Chem. Soc. 1950, 72, 2489–2494. [Google Scholar] [CrossRef]
  16. Estiu, G.; Merz, K.M. The Hydrolysis of Urea and the Proficiency of Urease. J. Am. Chem. Soc. 2004, 126, 6932–6944. [Google Scholar] [CrossRef]
  17. Portejoie, S.; Dourmad, J.Y.; Martinez, J.; Lebreton, Y. Effect of lowering dietary crude protein on nitrogen excretion, manure composition and ammonia emission from fattening pigs. Livest. Prod. Sci. 2004, 91, 45–55. [Google Scholar] [CrossRef]
  18. Balsari, P.; Dinuccio, E.; Gioelli, F. A low cost solution for ammonia emission abatement from slurry storage. Int. Congr. Ser. 2006, 1293, 323–326. [Google Scholar] [CrossRef]
  19. Aarnink, A.J.A.; Verstegen, M.W.A. Nutrition, key factor to reduce environmental load from pig production. Livest. Sci. 2007, 109, 194–203. [Google Scholar] [CrossRef]
  20. Fangueiro, D.; Hjorth, M.; Gioelli, F. Acidification of animal slurry—A review. J. Environ. Manag. 2015, 149, 46–56. [Google Scholar] [CrossRef]
  21. Hjorth, M.; Christensen, K.V.; Christensen, M.L.; Sommer, S.G. Solid-liquid separation of animal slurry in theory and practice. A review. Agron. Sustain. Dev. 2010, 30, 153–180. [Google Scholar] [CrossRef]
  22. Kupper, T.; Bonjour, C.; Menzi, H. Evolution of farm and manure management and their influence on ammonia emissions from agriculture in Switzerland between 1990 and 2010. Atmos. Environ. 2015, 103, 215–221. [Google Scholar] [CrossRef]
  23. Wood, D.; Cowherd, S.; Van Heyst, B. A summary of ammonia emission factors and quality criteria for commercial poultry production in North America. Atmos. Environ. 2015, 115, 236–245. [Google Scholar] [CrossRef]
  24. Bougouin, A.; Leytem, A.; Dijkstra, J.; Dungan, R.S.; Kebreab, E. Nutritional and Environmental Effects on Ammonia Emissions from Dairy Cattle Housing: A Meta-Analysis. J. Environ. Qual. 2016, 45, 1123. [Google Scholar] [CrossRef] [PubMed]
  25. Mack, E.; Villars, D.S. Synthesis of urea with the enzyme urease. J. Am. Chem. Soc. 1923, 45, 505–510. [Google Scholar] [CrossRef]
  26. Regueiro, I.; Coutinho, J.; Fangueiro, D. Alternatives to sulfuric acid for slurry acidification: Impact on slurry composition and ammonia emissions during storage. J. Clean. Prod. 2016, 131, 296–307. [Google Scholar] [CrossRef]
  27. Varel, V.H.; Nienaber, J.A.; Freetly, H.C. Conservation of nitrogen in cattle feedlot waste with urease inhibitors. J. Anim. Sci. 1999, 77, 1162–1168. [Google Scholar] [CrossRef]
  28. Gac, A.; Béline, F.; Bioteau, T.; Maguet, K. French inventory of gaseous emissions (CH4, N2O, NH3) from livestock manure management using a mass-flow approach. Livest. Sci. 2007, 112, 252–260. [Google Scholar] [CrossRef]
  29. Wang, Y.; Dong, H.; Zhu, Z.; Gerber, P.J.; Xin, H.; Smith, P.; Opio, C.; Steinfeld, H.; Chadwick, D. Mitigating Greenhouse Gas and Ammonia Emissions from Swine Manure Management: A System Analysis. Environ. Sci. Technol. 2017, 51, 4503–4511. [Google Scholar] [CrossRef]
  30. May, P.B.; Douglas, L.A. Assay for soil urease activity. Plant. Soil. 1976, 45, 301–305. [Google Scholar] [CrossRef]
  31. Dai, X.; Karring, H. A determination and comparison of urease activity in feces and fresh manure from pig and cattle in relation to ammonia production and pH changes. PLoS ONE 2014, 9, e110402. [Google Scholar] [CrossRef]
  32. Canh, T.T.; Aarnink, A.J.A.; Schutte, J.B.; Sutton, A.; Langhout, D.J.; Verstegen, M.W.A. Dietary protein affects nitrogen excretion and ammonia emission from slurry of growing–finishing pigs. Livest. Prod. Sci. 1998, 56, 181–191. [Google Scholar] [CrossRef]
  33. Canh, T.T.; Verstegen, M.W.; Aarnink, A.J.; Schrama, J.W. Influence of dietary factors on nitrogen partitioning and composition of urine and feces of fattening pigs. J. Anim. Sci. 1997, 75, 700–706. [Google Scholar] [CrossRef]
  34. Canh, T.T.; Sutton, A.L.; Aarnink, A.J.; Verstegen, M.W.; Schrama, J.W.; Bakker, G.C. Dietary carbohydrates alter the fecal composition and pH and the ammonia emission from slurry of growing pigs. J. Anim. Sci. 1998, 76, 1887–1895. [Google Scholar] [CrossRef] [PubMed]
  35. Michaelis, L.; Menten, M.L. The kinetics of the inversion effect. Biochem. Z. 1913, 49, 333–369. [Google Scholar]
  36. Muck, R.E. Urease Activity in Bovine Feces. J. Dairy. Sci. 1982, 65, 2157–2163. [Google Scholar] [CrossRef]
  37. Lineweaver, H.; Burk, D. The determination of enzyme dissociation constants. J. Am. Chem. Soc. 1934, 56, 658–666. [Google Scholar] [CrossRef]
  38. Hernández, F.; Martínez, S.; López, C.; Megías, M.D.; López, M.; Madrid, J. Effect of dietary crude protein levels in a commercial range, on the nitrogen balance, ammonia emission and pollutant characteristics of slurry in fattening pigs. Animal 2011, 5, 1290–1298. [Google Scholar] [CrossRef] [PubMed]
  39. Krajewska, B.; Ureases, I. Functional, catalytic and kinetic properties: A review. J. Mol. Catal. B Enzym. 2009, 59, 9–21. [Google Scholar] [CrossRef]
  40. Dewes, T. Effect of pH, temperature, amount of litter and storage density on ammonia emissions from stable manure. J. Agric. Sci. 1996, 127, 501–509. [Google Scholar] [CrossRef]
  41. Van der Stelt, B.; Temminghoff, E.J.M.; Van Vliet, P.C.J.; Van Riemsdijk, W.H. Volatilization of ammonia from manure as affected by manure additives, temperature and mixing. Bioresour. Technol. 2007, 98, 3449–3455. [Google Scholar] [CrossRef]
  42. Sumner, J.B.; Hand, D.B.; Holloway, R.G. Studies of the intermediate products formed during the hydrolysis of urea by urease. J. Biol. Chem. 1931, 91, 333–341. [Google Scholar]
  43. Blakeley, R.L.; Hinds, J.A.; Kunze, H.E.; Webb, E.C.; Zerner, B. Jack bean urease (EC 3.5.1.5). Demonstration of a carbamoyl-transfer reaction and inhibition by hydroxamic acids. Biochemistry 1969, 8, 1991–2000. [Google Scholar] [CrossRef] [PubMed]
  44. Amtul, Z.; Siddiqui, R.; Choudhary, M. Chemistry and Mechanism of Urease Inhibition. Curr. Med. Chem. 2002, 9, 1323–1348. [Google Scholar] [CrossRef] [PubMed]
  45. Petersen, S.O.; Andersen, A.J.; Eriksen, J. Effects of Cattle Slurry Acidification on Ammonia and Methane Evolution during Storage. J. Environ. Qual. 2012, 41, 88–94. [Google Scholar] [CrossRef] [PubMed]
  46. Portejoie, S.; Martinez, J.; Guiziou, F.; Coste, C.M. Effect of covering pig slurry stores on the ammonia emission processes. Bioresour. Technol. 2003, 87, 199–207. [Google Scholar] [CrossRef]
  47. Panetta, D.M.; Powers, W.J.; Lorimor, J.C. Management Strategy Impacts on Ammonia Volatilization from Swine Manure. J. Environ. Qual. 2005, 34, 1119. [Google Scholar] [CrossRef]
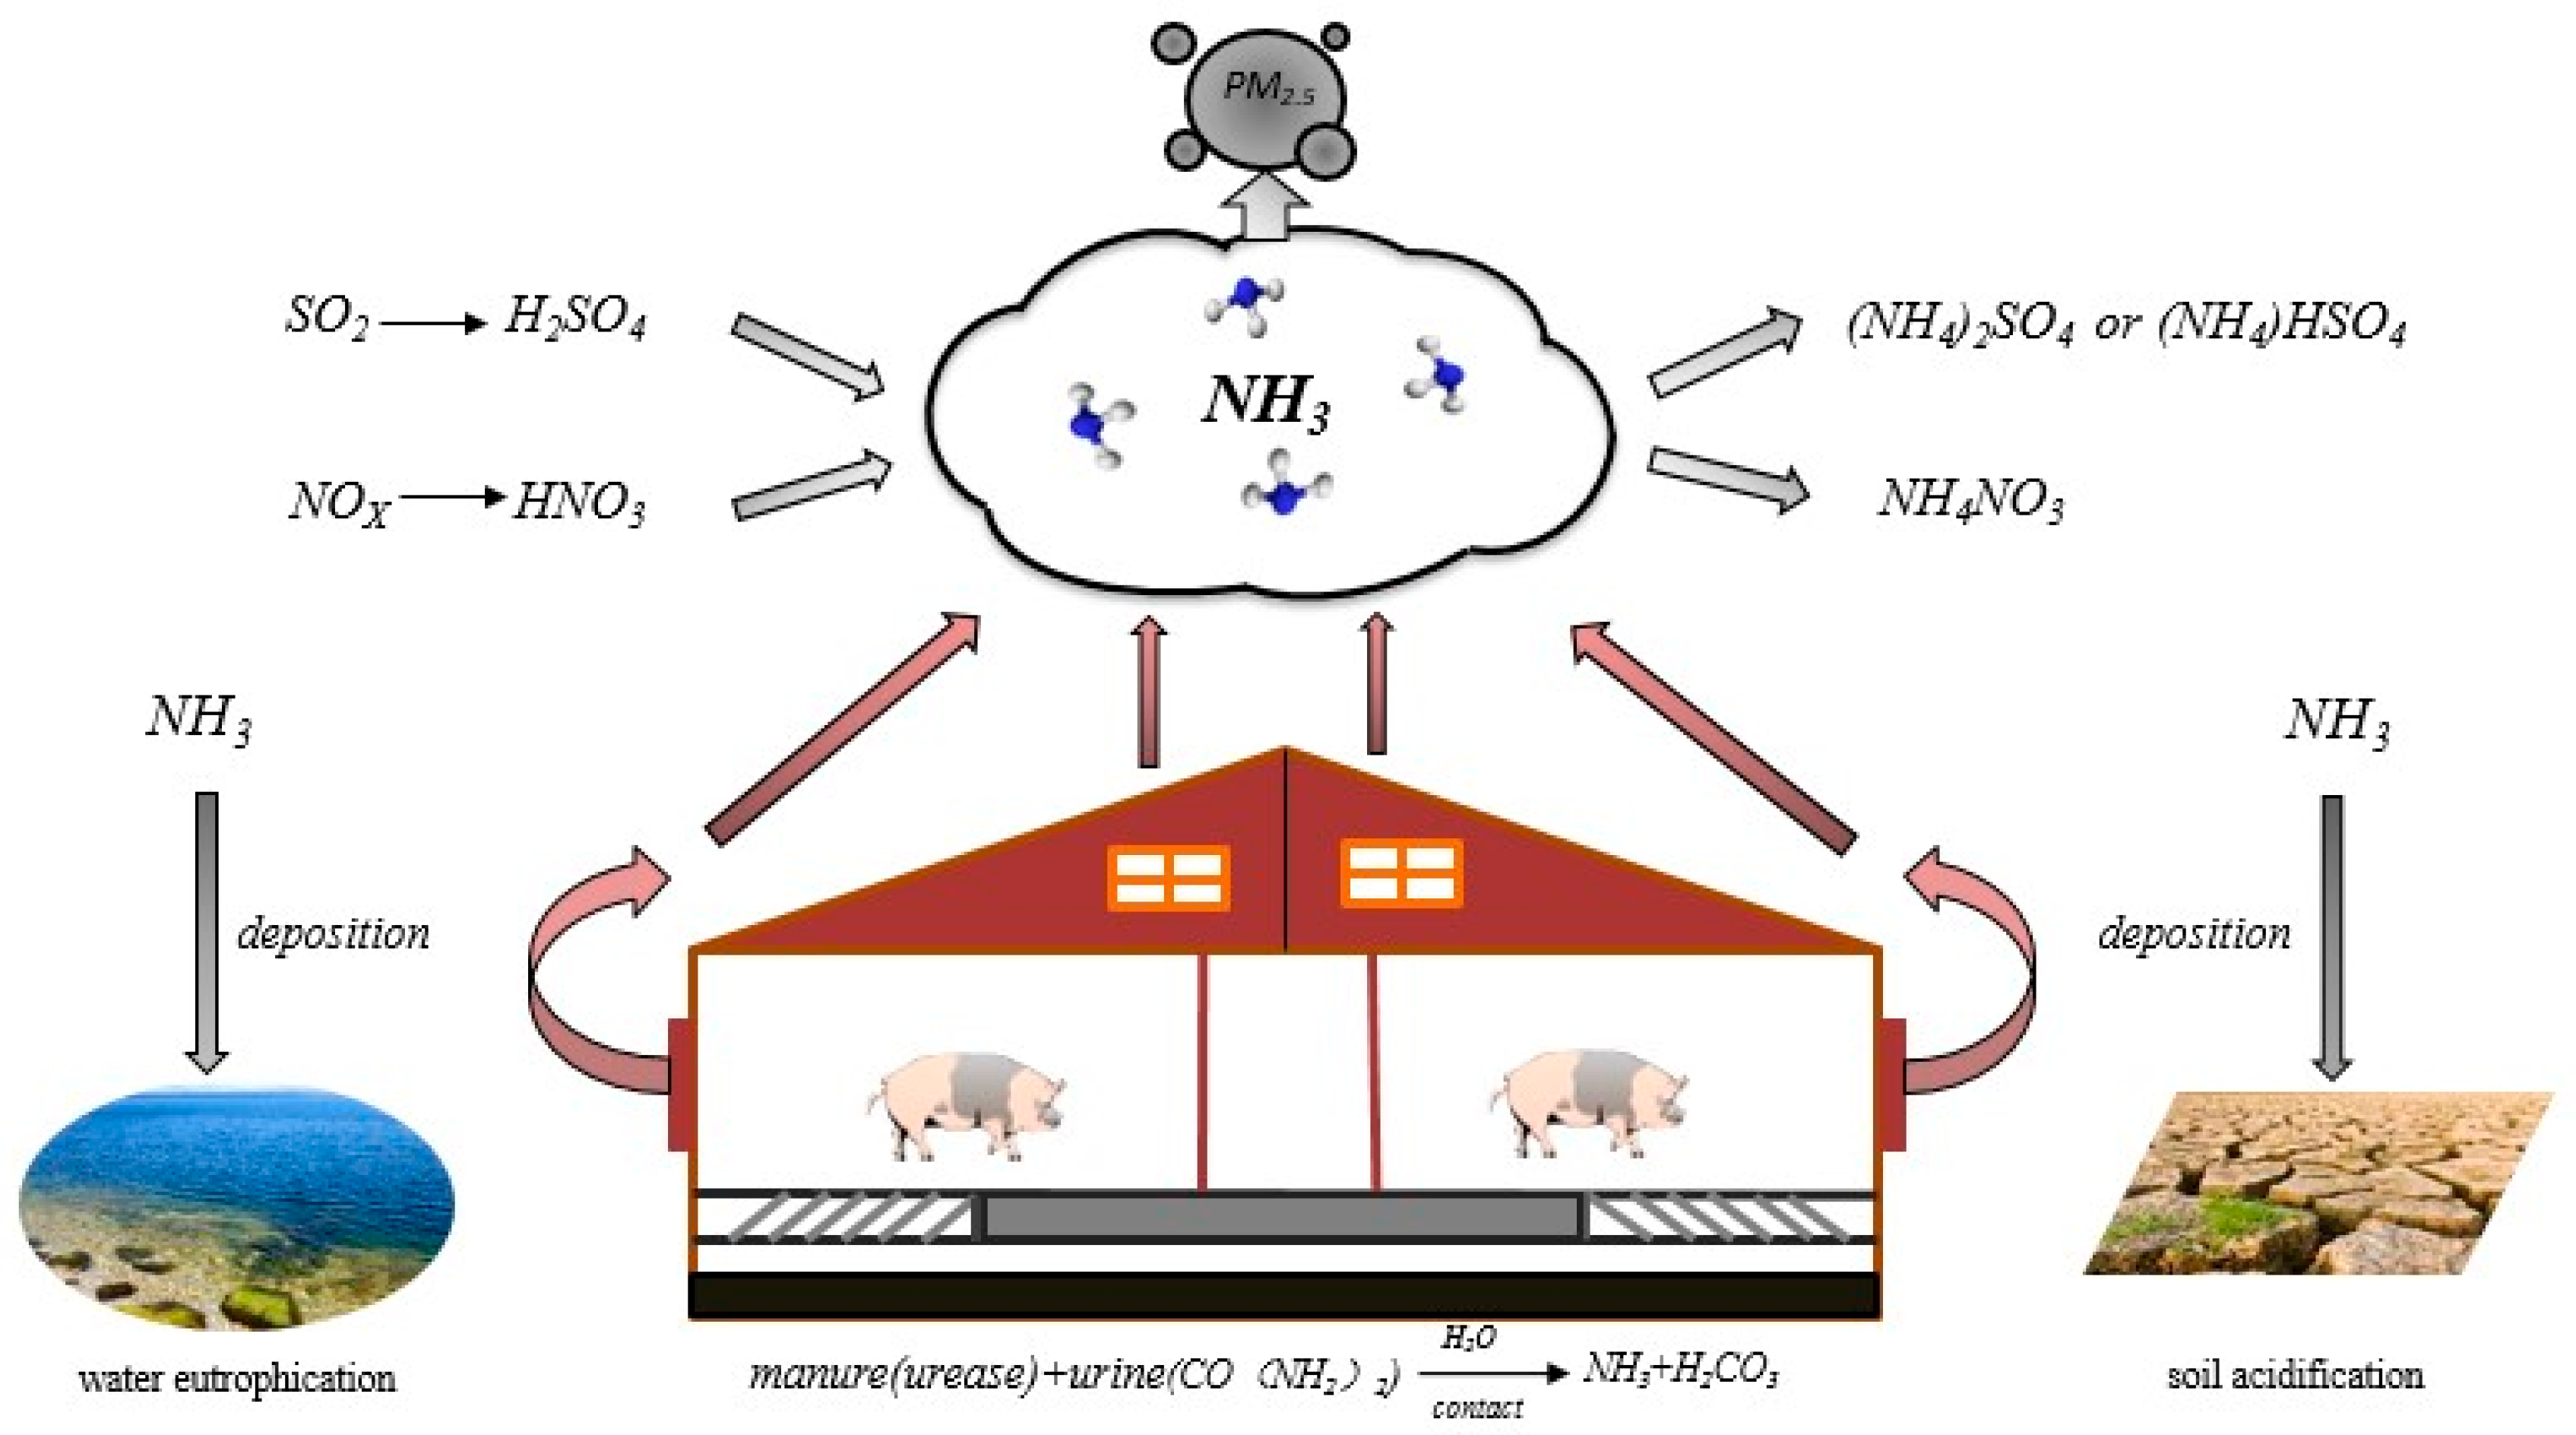
Figure 1. Sources of ammonia production in a pig house and paths of ammonia pollution to the ecological environment.
Sustainability 11 06396 g001
Figure 2. Experimental setup to capture volatilized NH3.
Sustainability 11 06396 g002
Figure 3. The Michaelis–Menten kinetics of urease activity in fresh pig feces, (a) Michaelis–Menten curve; (b) Lineweaver–Burk plot.
Sustainability 11 06396 g003
Figure 4. The effects of temperature (a), pH (b), and mixing rate (c) on urease activity from fresh pig feces in 3 stages of 8 h. The cumulative column represented by different colors represents the production of TAN at three stages to reflect urease activity. The rpm unit means the speed of the magnetic stirrer. For each parameter, means of total ammoniacal nitrogen (TAN) production in 8 hours with different letters are significantly different from each other (p < 0.05). (n = 3, mean ± SD).
Sustainability 11 06396 g004
Figure 5. Effect of interaction of different conditions on urease activity in the initial 5 minutes (a) for temperature and pH interaction on TAN production at 300 rpm; (b) for temperature and mixing rate interaction on TAN production at pH 7.0; (c) for pH and mixing rate interaction on TAN production at 25 °C. (The red dots in the above figures indicate that the input values are higher than the analog values, while the pink dots are the opposite.).
Sustainability 11 06396 g005
Figure 6. Evolution of urea hydrolysis and volatile NH3 emissions in 96 hours, (a) the concentration of TAN formation and urea hydrolysis, pH evolution; (b) the rate of TAN formation in fresh slurry from pigs; (c) cumulative NH3 emissions; (d) the effect of slurry pH on its relative content of ammonium nitrogen [20].
Sustainability 11 06396 g006aSustainability 11 06396 g006b
Table 1. The physical and chemical properties of samples (Mean ± SD, n = 3.
Sample TAN Urea DM pHOM 1
mmol∙kg−1mM mmol∙kg−1mM %%
Pig Feces (PF)69.0 ± 8.1n.a 281.3 ± 5.2n.a29.63 ± 0.26 a6.93 ± 0.0 b83.89 ± 0.80 a
Pig Urine (PU)n.a31.6 ± 1.3 bn.a421.7 ± 1.1n.a6.73 ± 0.02 cn.a
Mixed Slurry 3 (MS)n.a650.2 ± 22.9 an.an.d 47.76 ± 0.18 b8.61 ± 0.04 a74.56 ± 1.29 b
For each parameter, means with different letters (vertical) are significantly different from each other (p < 0.05). 1 Only OM was calculated based on dry matter (dry basis); all others were wet-based. 2 n.a: not available. 3 Mixed: feces: urine = 1: 3, mixed reaction 96 h. 4. Urea cannot be detected after 96 h.