Applying Effective Sensory Marketing to Sustainable Coffee Shop Business Management


Abstract
:1. Introduction
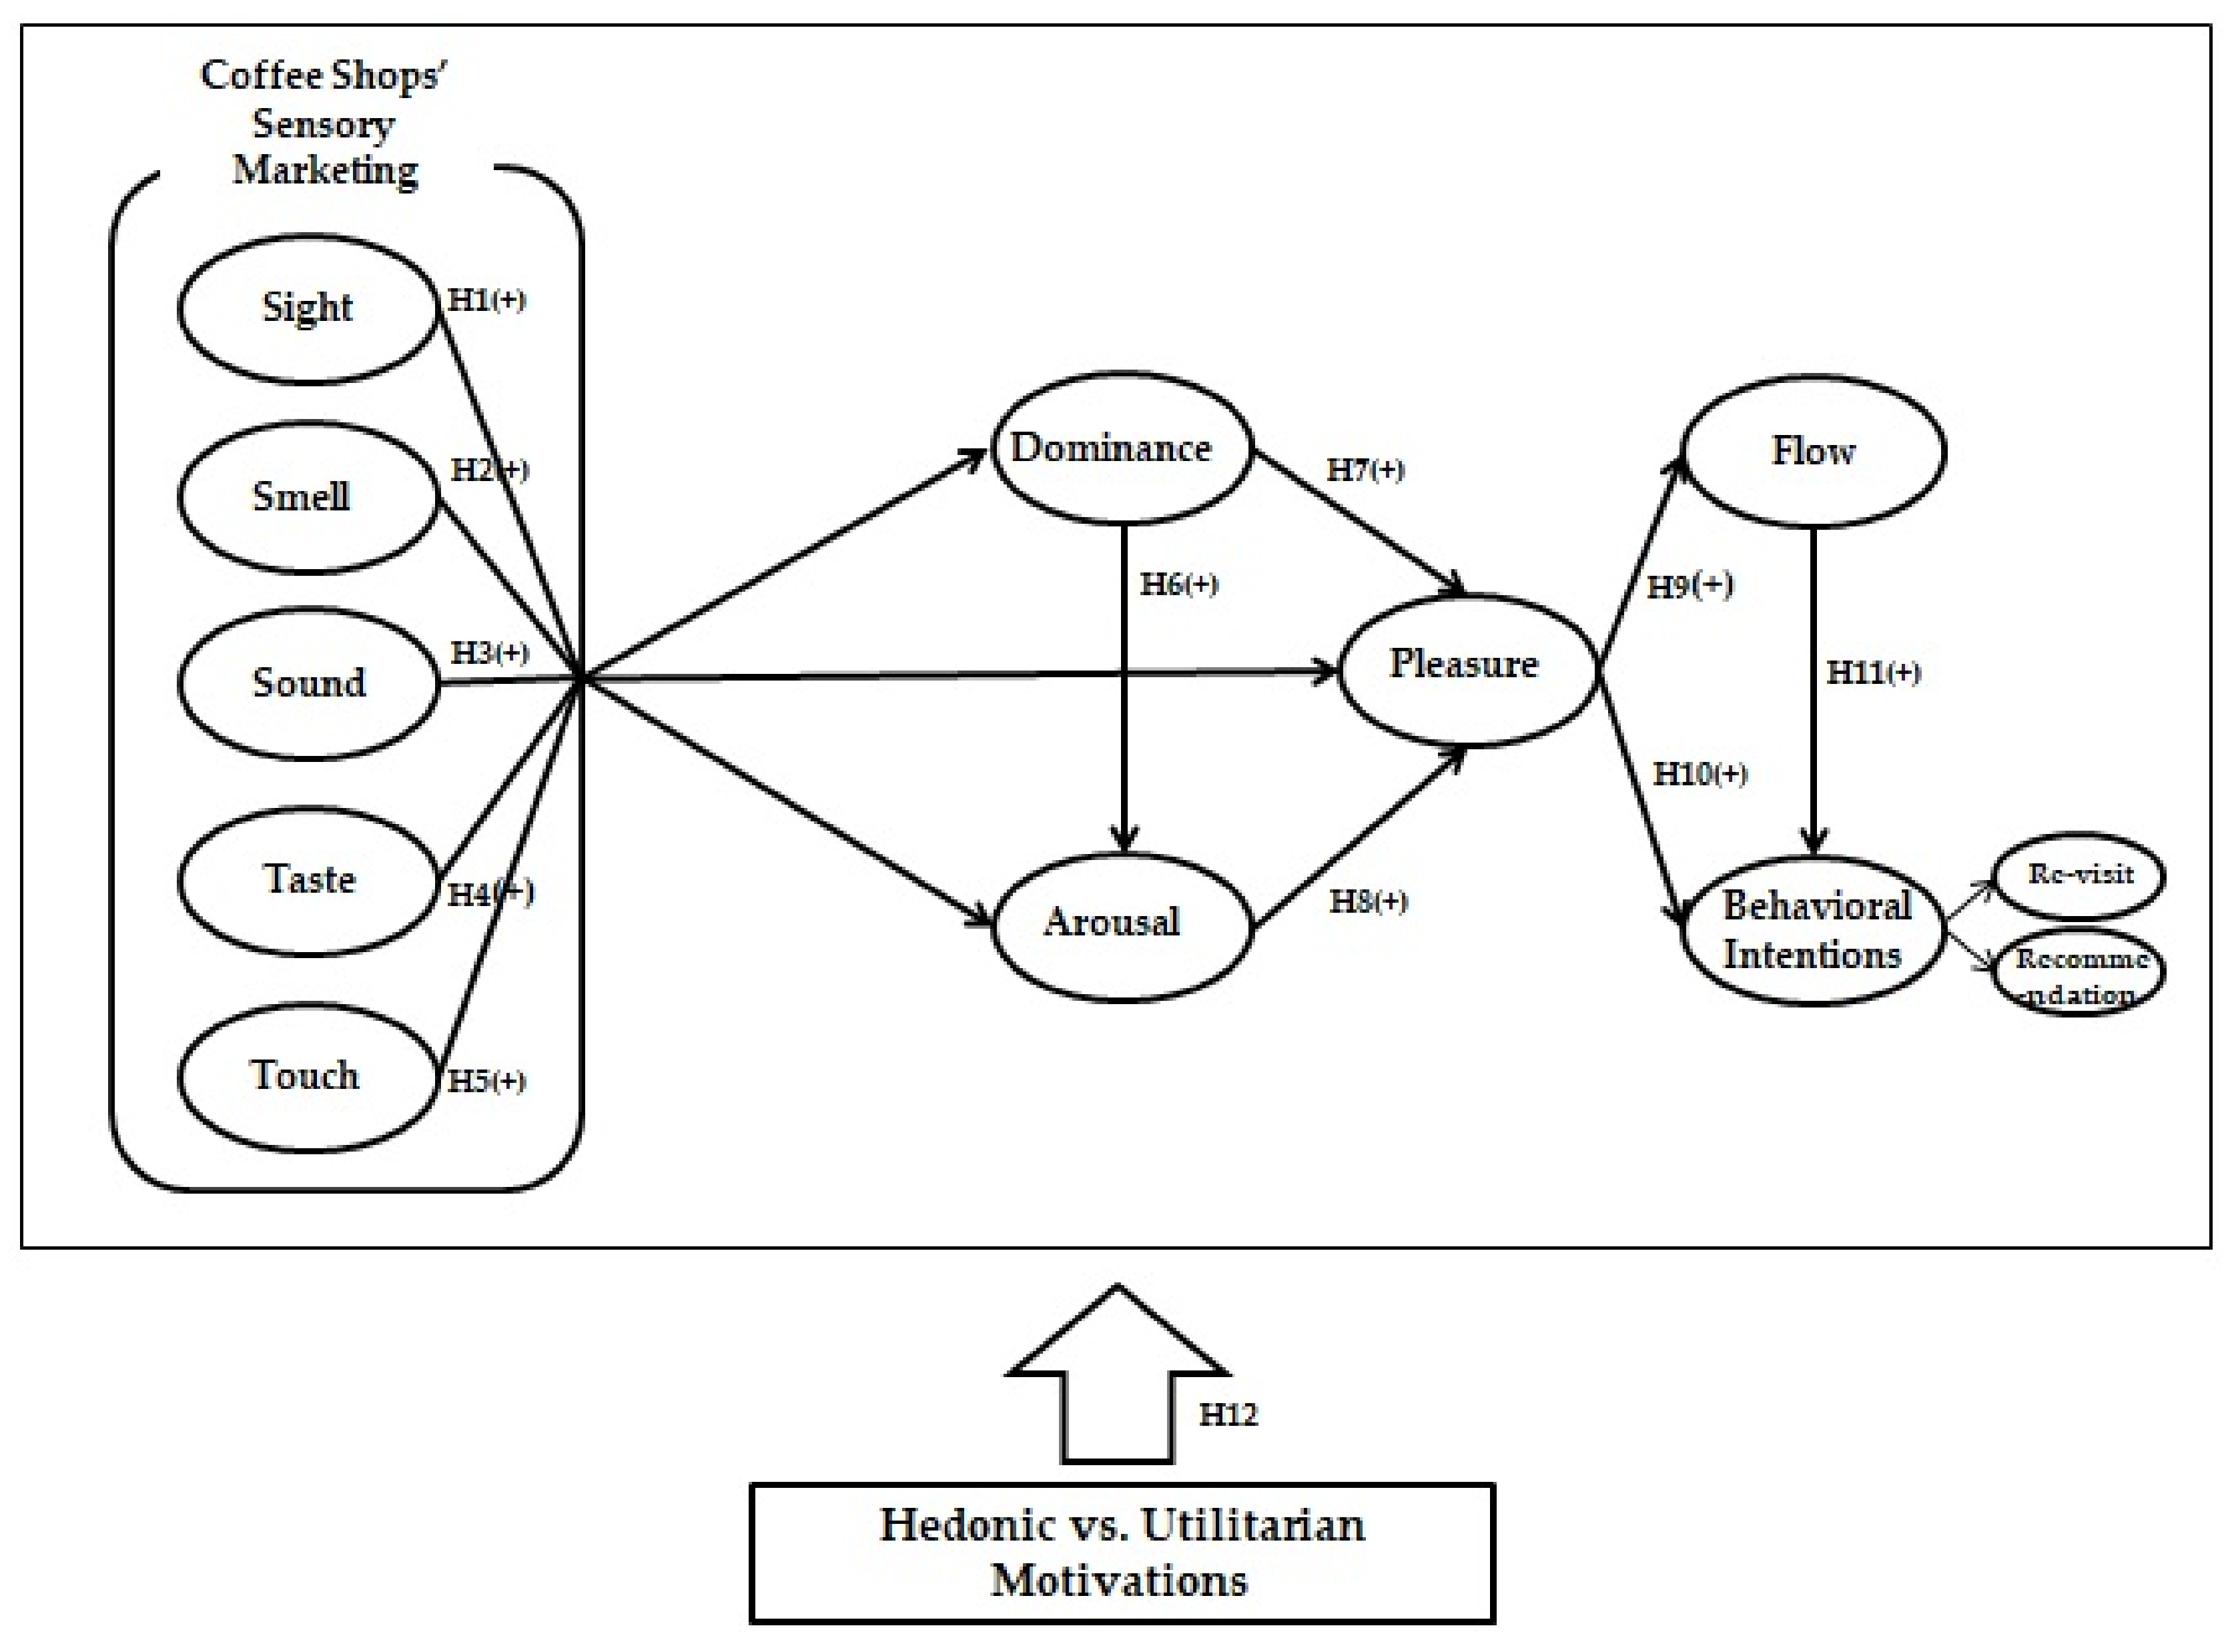
- Identify the relationships between the five sensory marketing factors and coffee shop customers’ PAD emotions;
- Identify the relationships among coffee shop customers’ PAD emotions;
- Identify the effects of coffee shop customers’ pleasure on their flow and behavioral intentions;
- Verify significant differences among the relationships previously mentioned, according to coffee shop customer usage motivations (emotional vs. utilitarian).
2. Research Background
2.1. Sensory Marketing Using Five Senses
2.2. Consumers’ Pleasure–Arousal–Dominance Emotions: PAD
2.3. Consumers’ Experiences: Flow
2.4. Development of Research Hypotheses
2.4.1. Effects of Coffee Shops’ Sensory Marketing on PAD Emotions
2.4.2. Relationships between PAD Emotions
2.4.3. Effects of Pleasure on Flow and Behavioral Intentions
2.4.4. Moderating Effects of Coffee Shop Usage Motivations (Hedonic vs. Utilitarian)
3. Methods
3.1. Data Collection and Sampling
3.2. Measurements for Testing Hypotheses
4. Results
4.1. Validity and Reliability of Measurements
4.2. Hypotheses Testing
5. Discussion and Conclusions
5.1. Theoretical Implications
5.2. Practical Implications
6. Limitations and Future Research
Author Contributions
Conflicts of Interest
References
- Purnomo, M. Contesting Indonesia’s Single Origin Coffee Market: A Dynamic Capabilities Perspective. Asian Soc. Sci. 2018, 14, 91–101. [Google Scholar] [CrossRef]
- Ahn, S.Y. Coffee Shops Going Out of Business. Available online: http://biz.chosun.com/site/data/html_dir/2019/09/17/2019091700430.html (accessed on 17 September 2019).
- Hooker, L. Is the UK Reaching Coffee Shop Saturation Point? Available online: https://www.bbc.com/news/business-41251451 (accessed on 14 September 2017).
- Jargon, J. Too Much Caffeine? Coffee Shops Face a Shakeout. Available online: https://www.wsj.com/articles/american-retail-has-a-coffee-problem-1510056002 (accessed on 18 December 2017).
- Lee, T.-S. Korea’s Coffee Imports Fall in 2018 for 1st Time in 6 Years. Available online: http://www.koreaherald.com/view.php?ud=20190217000033&ACE_SEARCH=1 (accessed on 17 February 2019).
- de Jonge, J.; Peeters, M. The vital worker: Towards sustainable performance at work. Int. J. Environ. Res. Public Health 2019, 16, 910. [Google Scholar] [CrossRef] [PubMed]
- Chams, N.; García-Blandón, J. On the importance of sustainable human resource management for the adoption of sustainable development goals. Res. Conserv. Recycl. 2019, 141, 109–122. [Google Scholar] [CrossRef]
- Starbucks Global Responsibility Report. Global Social Impact 2017. Available online: https://globalassets.starbucks.com/assets/8c1f8c07efde407e9d48bfaf518c0b45.pdf (accessed on 1 October 2017).
- Chiang, W.Y. Applying data mining for online CRM marketing strategy: An empirical case of coffee shop industry in Taiwan. Br. Food J. 2018, 120, 665–675. [Google Scholar] [CrossRef]
- Rahmah, K.; Sumarwan, U.; Najib, M. The Effect of Brand Equity, Marketing Mix, And Lifestyle To Purchase Decision At Maxx Coffee, Bogor. J. Consum. Sci. 2018, 3, 1–15. [Google Scholar] [CrossRef]
- Kim, S.H.; Kim, M.; Holland, S. How customer personality traits influence brand loyalty in the coffee shop industry: The moderating role of business types. Int. J. Hosp. Tour. Adm. 2018, 19, 311–335. [Google Scholar] [CrossRef]
- Li, Y.; Liu, B.; Huan, T.C.T. Renewal or not? Consumer response to a renewed corporate social responsibility strategy: Evidence from the coffee shop industry. Tour. Manag. 2019, 72, 170–179. [Google Scholar] [CrossRef]
- Kuczamer-Kłopotowska, S. Sensory marketing as a new tool of supporting the marketing communication process in tourism services sector. Handel Wewnętrzny 2017, 367, 226–235. [Google Scholar]
- Kim, C.H.; Jung, Y.S. A Study on the Effects of Experiential Marketing on Satisfaction, Loyalty and Purchase Intention. Korean J. Bus. Adm. 2018, 31, 603–624. [Google Scholar]
- Hultén, B. Sensory Marketing: Theoretical and Empirical Grounds; Routledge: London, UK, 2015. [Google Scholar]
- Krishna, A. An integrative review of sensory marketing: Engaging the senses to affect perception, judgment and behavior. J. Consum. Psychol. 2012, 22, 332–351. [Google Scholar] [CrossRef]
- Krishna, A.; Cian, L.; Aydınoğlu, N.Z. Sensory aspects of package design. J. Retail. 2017, 93, 43–54. [Google Scholar] [CrossRef]
- Wade Clarke, D.; Perry, P.; Denson, H. The sensory retail environment of small fashion boutiques. J. Fash. Market. Manag. Int. J. 2012, 16, 492–510. [Google Scholar] [CrossRef]
- Doucé, L.; Janssens, W. The presence of a pleasant ambient scent in a fashion store: The moderating role of shopping motivation and affect intensity. Environ. Behav. 2013, 45, 215–238. [Google Scholar] [CrossRef]
- Hinestroza, N.B.; James, P. The effects of sensory marketing on the implementation of fast-food marketing campaigns. J. Manag. Market. Res. 2014, 14, 1–11. [Google Scholar]
- Hussain, S. The impact of sensory branding (five senses) on consumer: A case study on KFC (Kentucky Fried Chicken). Int. J. Res. Bus. Manag. 2014, 2, 2347–4572. [Google Scholar]
- Anvar, M. The Effect of Multi-Sensory Branding on Purchase Intention at Coffee Shops in South Africa. Master’s Thesis, Witwatersrand University, Johannesburg, South Africa, March 2016. [Google Scholar]
- Pierce, J.L.; Brown, G. Psychological ownership and the physical environment in organizations. Org. Behav. Phys. Environ. 2019, 1, 67–95. [Google Scholar]
- Mehrabian, A.; Russell, J.A. An Approach to Environmental Psychology; The MIT Press: Cambridge, MA, USA, 1974. [Google Scholar]
- Oh, S.K.; Yoon, H.S.; Yoon, H.H. Effect of Emotional-Utilitarian Motivation on Coffee Shop Selection Attribution. J. Korean Soc. Food Cult. 2017, 32, 111–117. [Google Scholar]
- Schmitt, B. Experiential marketing. J. Market. Manag. 1999, 15, 53–67. [Google Scholar] [CrossRef]
- Erdil, T.S. Effects of customer brand perceptions on store image and purchase intention: An application in apparel clothing. Procedia Soc. Behav. Sci. 2015, 207, 196–205. [Google Scholar] [CrossRef]
- Lindstrom, M. Brand Sense: How to Build Powerful Brands Through Touch, Taste, Smell, Sight and Sound; Strategic Direction: Bingley, UK, 2006; p. 22. [Google Scholar]
- Ebster, C. Store Design and Visual Merchandising: Creating Store Space That Encourages Buying; Business Expert Press: New York, NY, USA, 2011. [Google Scholar]
- Lindstrom, M. Broad sensory branding. J. Prod. Brand Manag. 2005, 14, 84–87. [Google Scholar] [CrossRef]
- Herz, R.S.; Engen, T. Odor memory: Review and analysis. Psychon. Bull. Rev. 1996, 3, 300–313. [Google Scholar] [CrossRef] [PubMed]
- Hultén, B.; Broweus, N.; Van Dijk, M. What Is Sensory Marketing? In Sensory Marketing; Palgrave Macmillan: London, UK, 2009; pp. 1–23. [Google Scholar]
- Ikeda, K. New seasonings. Chem. Senses 2002, 27, 847–849. [Google Scholar] [CrossRef] [PubMed]
- Helmefalk, M.; Hultén, B. Multi-sensory congruent cues in designing retail store atmosphere: Effects on shoppers’ emotions and purchase behavior. J. Retail. Consum. Serv. 2017, 38, 1–11. [Google Scholar] [CrossRef]
- Iqbal, J. Employing sensory marketing as a promotional advantage for creating brand differentiation and brand loyalty. Pak. J. Comm. Soc. Sci. 2016, 10, 725–734. [Google Scholar]
- Randhir, R.; Latasha, K.; Tooraiven, P.; Monishan, B. Analyzing the impact of sensory marketing on consumers: A case study of KFC. J. US-China Public Adm. 2016, 13, 278–292. [Google Scholar]
- Moreira, A.C.; Fortes, N.; Santiago, R. Influence of sensory stimuli on brand experience, brand equity and purchase intention. J. Bus. Econ. Manag. 2017, 18, 68–83. [Google Scholar] [CrossRef]
- Hultén, B. Sensory marketing: The multi-sensory brand-experience concept. Eur. Bus. Rev. 2011, 23, 256–273. [Google Scholar] [CrossRef]
- Rodrigues, C.; Hultén, B.; Brito, C. Sensorial strategies for value co-creation. Innov. Market. 2011, 7, 47–54. [Google Scholar]
- Havlena, W.J.; Holbrook, M.B. The varieties of consumption experience: Comparing two typologies of emotion in consumer behavior. J. Consum. Res. 1986, 13, 394–404. [Google Scholar] [CrossRef]
- Miller, S. Ends, Means, and Galumphing: Some Leitmotifs of Play 1. Am. Anthropol. 1973, 75, 87–98. [Google Scholar] [CrossRef]
- Csikszentmihalyi, M.; Csikszentmihalyi, I. Beyond Boredom and Anxiety; Jossey-Bass: San Francisco, CA, USA, 1975; Volume 721. [Google Scholar]
- Gao, L.; Bai, X. Online consumer behaviour and its relationship to website atmospheric induced flow: Insights into online travel agencies in China. J. Retail. Consum. Serv. 2014, 21, 653–665. [Google Scholar] [CrossRef]
- Reid, D. A model of playfulness and flow in virtual reality interactions. Presence Teleoper. Vir. Environ. 2004, 13, 451–462. [Google Scholar] [CrossRef]
- Mun, Y.J.; Lee, J.H. A Study on the Performance of Online Community Reputation, Social Presence, Interactivity, Playfulness: Mediating Role of Trust and Flow. Glob. E Bus. Assoc. 2008, 9, 75–99. [Google Scholar]
- Hoffman, D.L.; Novak, T.P. Marketing in hypermedia computer-mediated environments: Conceptual foundations. J. Mark. 1996, 60, 50–68. [Google Scholar] [CrossRef]
- Koufaris, M. Applying the technology acceptance model and flow theory to online consumer behavior. Inform. Syst. Res. 2002, 13, 205–223. [Google Scholar] [CrossRef]
- Ko, J.M.; Shin, J.Y.; Ko, E.J.; Chae, H.J. The Effects of Image Contents Based Fashion Brands’ SNS Toward Flow and Brand Attitude: Focus on Pleasure Emotion as Mediator. Fash. Text. Res. J. 2014, 16, 908. [Google Scholar] [CrossRef]
- Brengman, M. The Impact of Colour in the Store Environment: An Environmental Psychology Approach. Ph.D. Thesis, Ghent University, Ghent, Belgium, August 2002. [Google Scholar]
- Ryu, K.; Jang, S.S. The effect of environmental perceptions on behavioral intentions through emotions: The case of upscale restaurants. J. Hosp. Tour. Res. 2007, 31, 56–72. [Google Scholar] [CrossRef]
- Krishna, A.; Morrin, M.; Sayin, E. Smellizing cookies and salivating: A focus on olfactory imagery. J. Consum. Res. 2013, 41, 18–34. [Google Scholar] [CrossRef]
- Jung, J.Y. A Study on the Effects of the Food Space of Hotel Restaurants on Behavioral Intention. Master’s Thesis, Kyonggi University, Seoul, Korea, August 2015. [Google Scholar]
- Kang, T.H.; Kim, B.S. The Effect of Physical Environment in Japanese Restaurant on Emotional Reaction and Customer Loyalty. J. Hotel Resort 2016, 15, 421–439. [Google Scholar]
- Im, S.S. The Effect of Physical Environment of Dessert Cafe on the Emotional Responses and Purchasing Intentions. J. Tour. Leis. Res. 2017, 29, 275–294. [Google Scholar]
- Kim, J.; Noh, J. Effects of Casino Servicescape and Customer Interaction on Chinese and Japanese Customers’ Emotions and Loyalty. J. Serv. Res. Stud. 2018, 8, 1–24. [Google Scholar]
- Babin, B.J.; Darden, W.R. Consumer self-regulation in a retail environment. J. Retail. 1995, 71, 47–70. [Google Scholar] [CrossRef]
- Ward, J.C.; Barnes, J.W. Control and affect: The influence of feeling in control of the retail environment on affect, involvement, attitude, and behavior. J. Bus. Res. 2001, 54, 139. [Google Scholar] [CrossRef]
- Kuppens, P. Individual differences in the relationship between pleasure and arousal. J. Res. Pers. 2008, 42, 1053–1059. [Google Scholar] [CrossRef]
- Hanzaee, K.H.; Khanzadeh, M. Investigation of the effect of consumption emotions on satisfaction and word of mouth communications. Middle East J. Sci. Res. 2011, 9, 566–571. [Google Scholar]
- Clarke, S.G.; Haworth, J.T. ‘Flow’ experience in the daily lives of sixth-form college students. Br. J. Psychol. 1994, 85, 511–523. [Google Scholar] [CrossRef]
- Csikszentmihalyi, M. Play and intrinsic rewards. In Flow and the Foundations of Positive Psychology; Springer: Dordrecht, The Netherlands, 2014. [Google Scholar]
- Kulviwat, S.; Zhang, Y.; Fan, J.; Zheng, L. Understanding consumer shopping behaviour: A comparison of three theories of emotions in predicting online flow. Int. J. Electr. Mark. Retail. 2016, 7, 3–21. [Google Scholar] [CrossRef]
- Ryu, K.; Jang, S. DINESCAPE: A scale for customers’ perception of dining environments. J. Foodserv. Bus. Res. 2008, 11, 2–22. [Google Scholar] [CrossRef]
- Tantanatewin, W.; Inkarojrit, V. The influence of emotional response to interior color on restaurant entry decision. Int. J. Hosp. Manag. 2018, 69, 124–131. [Google Scholar] [CrossRef]
- Ali, F. Hotel website quality, perceived flow, customer satisfaction and purchase intention. J. Hosp. Tour. Technol. 2016, 7, 213–228. [Google Scholar] [CrossRef]
- Liu, H.; Chu, H.; Huang, Q.; Chen, X. Enhancing the flow experience of consumers in China through interpersonal interaction in social commerce. Comput. Hum. Behav. 2016, 58, 306–314. [Google Scholar] [CrossRef]
- Lunardo, R.; Mbengue, A. Perceived control and shopping behavior: The moderating role of the level of utilitarian motivational orientation. J. Retail. Consum. Serv. 2009, 16, 434–441. [Google Scholar] [CrossRef]
- Jin, N.; Lee, S.; Huffman, L. Impact of restaurant experience on brand image and customer loyalty: Moderating role of dining motivation. J. Travel Tour. Mark. 2012, 29, 532–551. [Google Scholar] [CrossRef]
- Margarita Orozco-Gómez, M.; Rialp, J.; González, E. Impact of the Attractiveness of a Shopping Center in the Consumer Satisfaction: The Moderator Role of the Motivations and the Frequency of Visits; ACR Latin American Advances: Duluth, MN, USA, 2017. [Google Scholar]
- Hyun, S.S.; Kang, J. A better investment in luxury restaurants: Environmental or non-environmental cues? Int. J. Hosp. Manag. 2014, 39, 57–70. [Google Scholar] [CrossRef]
- Kotler, P. Atmospherics as a marketing tool. J. Retail. 1973, 49, 48–64. [Google Scholar]
- Zhao, J.B.; Wang, Y.L.; Ma, Q.W.; Zhao, J.B.; Zhang, X.Y.; Zou, L.Q. The Chemosensory Pleasure Scale: A New Assessment for Measuring Hedonic Smell and Taste Capacities. Chem. Senses 2019, 44, 457–464. [Google Scholar] [CrossRef]
- Trevino, L.K.; Webster, J. Flow in computer-mediated communication: Electronic mail and voice mail evaluation and impacts. Commun. Res. 1992, 19, 539–573. [Google Scholar] [CrossRef]
- Oliver, R.L. Cognitive, affective, and attribute bases of the satisfaction response. J. Consum. Res. 1993, 20, 418–430. [Google Scholar] [CrossRef]
- Söderlund, M.; Rosengren, S. Receiving word-of-mouth from the service customer: An emotion-based effectiveness assessment. J. Retail. Consum. Serv. 2007, 14, 123–136. [Google Scholar] [CrossRef]
- Ryu, K.; Han, H.; Jang, S. Relationships among hedonic and utilitarian values, satisfaction and behavioral intentions in the fast-casual restaurant industry. Int. J. Contemp. Hosp. Manag. 2010, 22, 416–432. [Google Scholar] [CrossRef]
- Hair, J.F.; Black, W.C.; Babin, B.J.; Anderson, R.E. Multivariate Data Analysis; Pearson Education Limited: London, UK, 2014. [Google Scholar]
- Gębarowski, M.; Cholewa-Wójcik, A. Popularization of an ecological dimension of sustainable consumption using sensory marketing. J. Agrobus. Rural Dev. 2015, 3, 379–385. [Google Scholar] [CrossRef]
- Terlau, W.; Hirsch, D. Sustainable consumption and the attitude-behaviour-gap phenomenon-causes and measurements towards a sustainable development. Int. J. Food Syst. Dyn. 2015, 6, 159–174. [Google Scholar]
- Lee, J.E. Starbucks Management—The Secret of Loud ‘Places’ That Are Helpful for Studying. Available online: http://biz.chosun.com/site/data/html_dir/2019/01/02/2019010202232.html (accessed on 3 January 2019).
 significant effect;
  non-significant effect.
significant effect; non-significant effect.
non-significant effect.
significant effect; non-significant effect.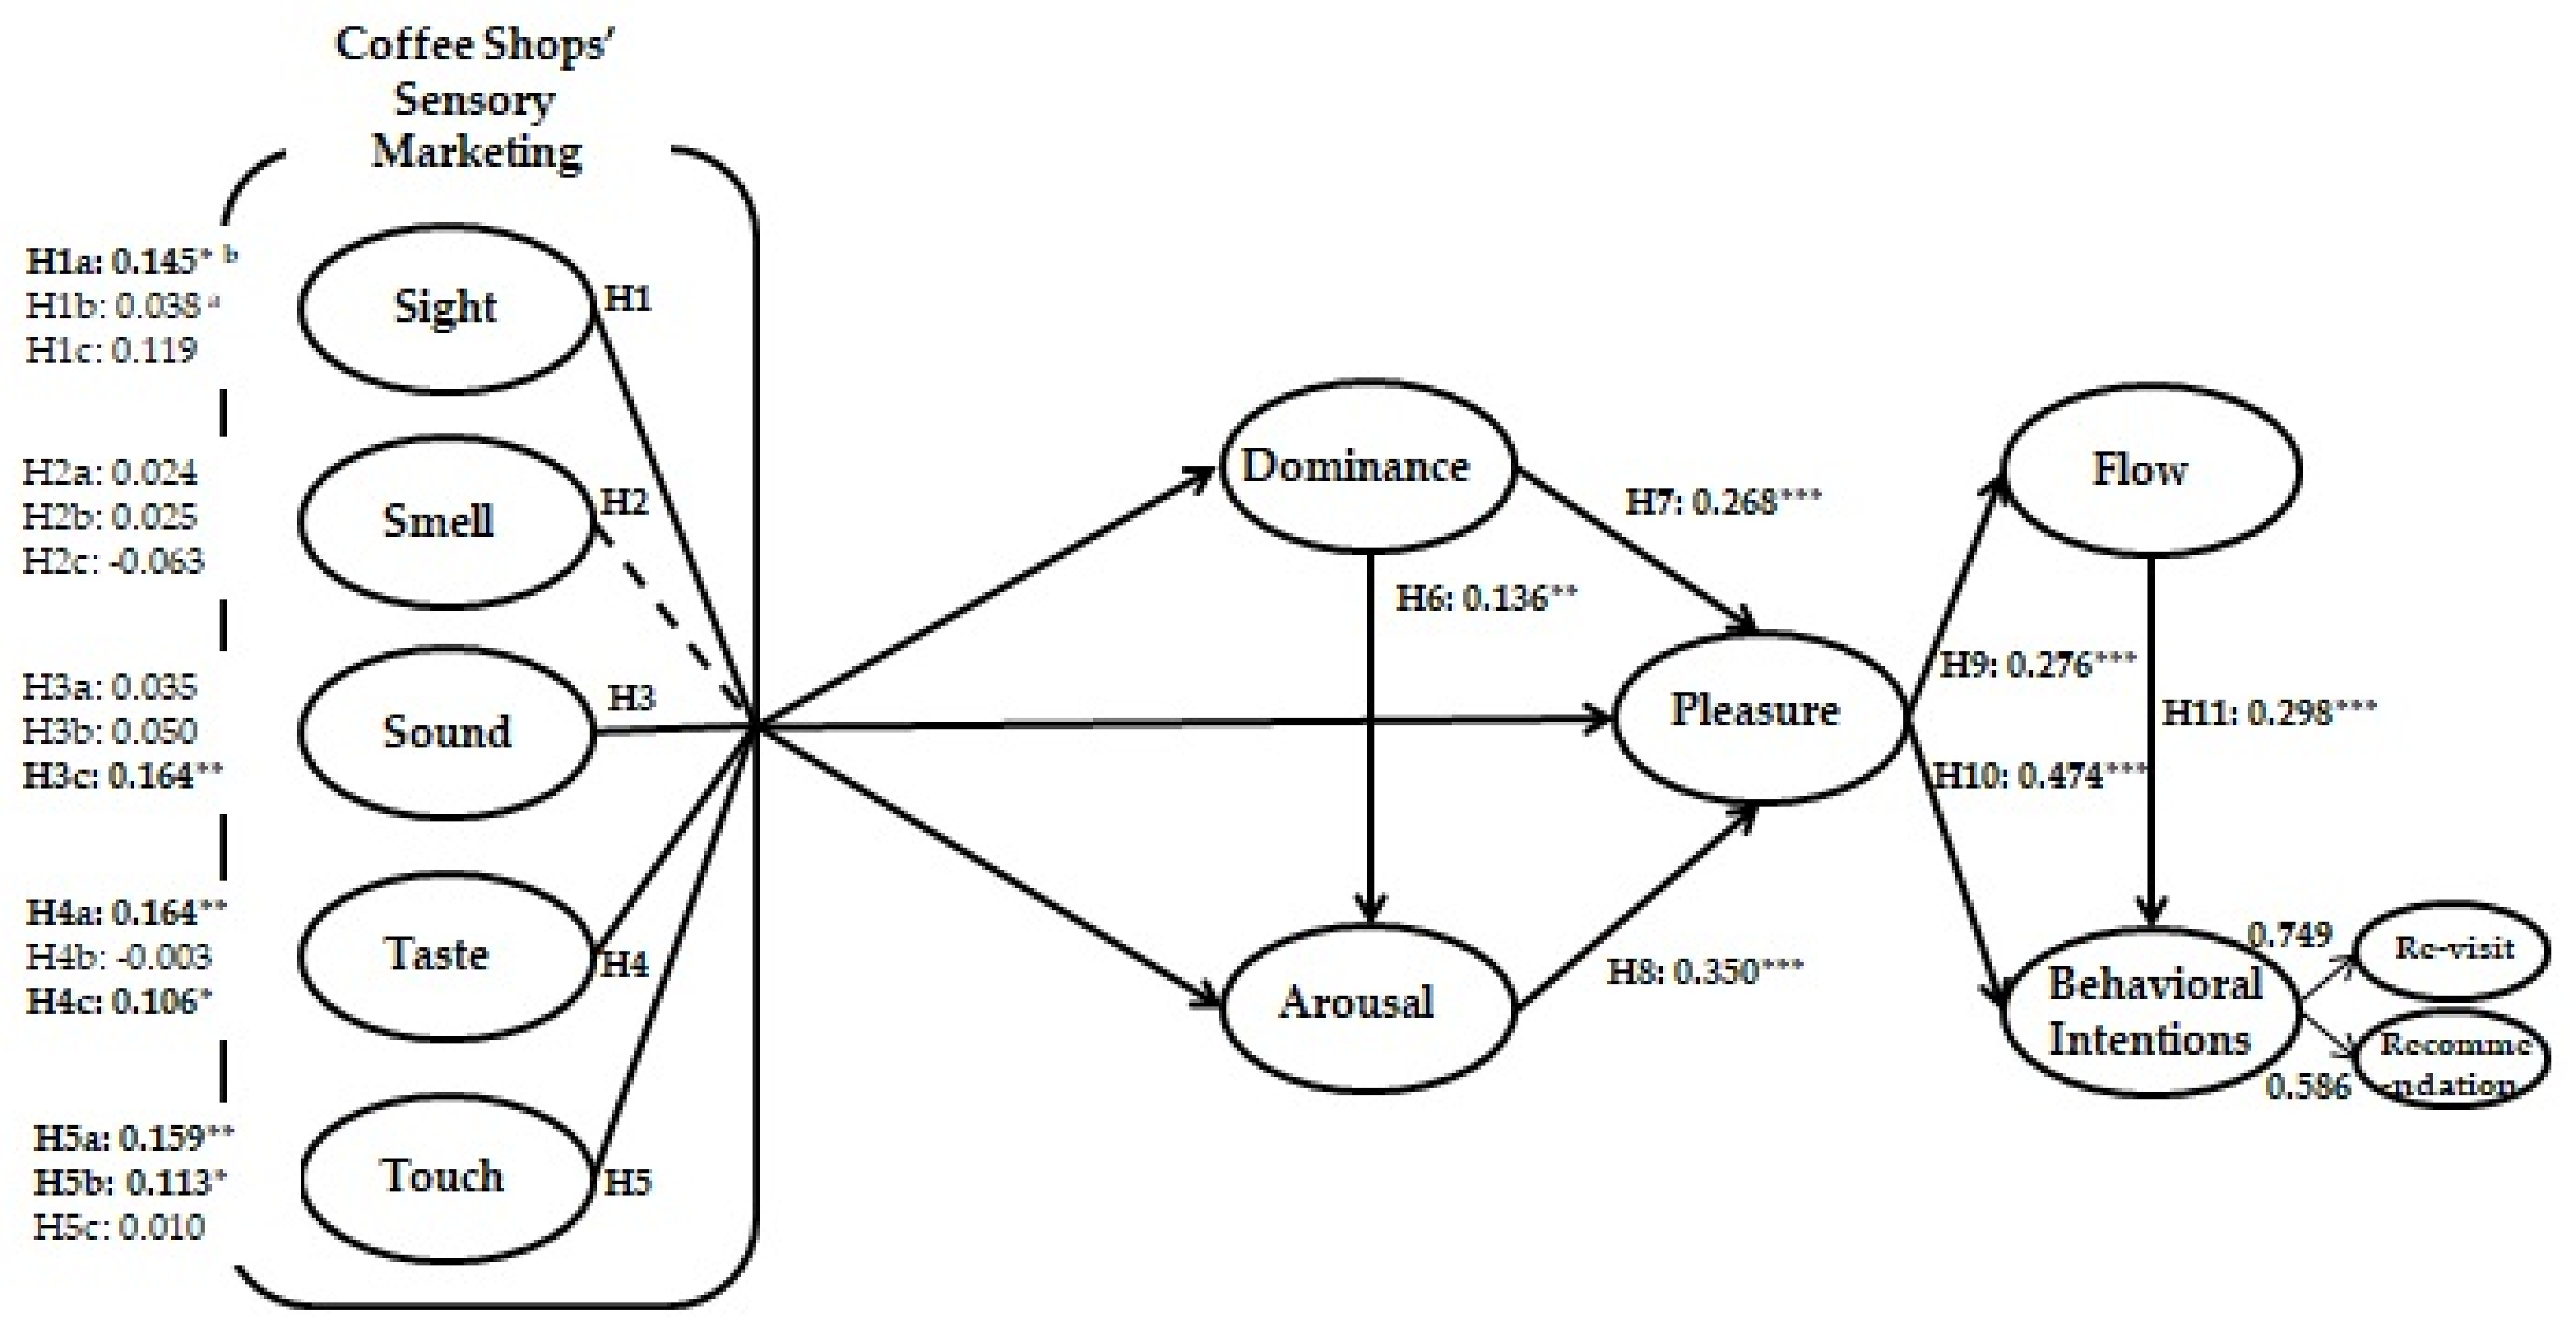

| Characteristics | n (%) | Characteristics | n (%) |
|---|---|---|---|
| Age | Marital status | ||
| 10s | 16 (2.6%) | Single | 338 (55.6%) |
| 20s | 267 (43.9%) | Married | 270 (44.4%) |
| 30s | 208 (34.2%) | Occupation | |
| 40s | 91 (15.0%) | Student | 77 (12.7%) |
| 50s | 20 (3.3%) | Office job | 317 (52.1%) |
| Over 60 | 6 (1.0%) | Self-employed | 23 (3.8%) |
| Gender | Professional job | 76 (12.5%) | |
| Male | 250 (41.1%) | Homemaker | 82 (13.5%) |
| Female | 358 (58.9%) | Other | 33 (5.4%) |
| Construct | Standardized Loadings | t-Value | CCRa | AVEb | Cronbach’s Alpha |
|---|---|---|---|---|---|
| Sight | 0.807 | 0.582 | 0.944 | ||
| The colors of the coffee shop are pleasing to the eye. | 0.791 | ||||
| The interior of the coffee shop is balanced. | 0.772 | 17.667*** | |||
| The interior decor of the coffee shop is appealing. | 0.724 | 16.774*** | |||
| Smell | 0.840 | 0.636 | 0.946 | ||
| The smell of the coffee shop fits the overall atmosphere of the coffee shop. | 0.849 | ||||
| I like the smell of the coffee shop. | 0.781 | 20.404*** | |||
| The smell of the coffee shop soothes me. | 0.760 | 19.822*** | |||
| Sound | 0.865 | 0.681 | 0.864 | ||
| I like the music in the coffee shop. | 0.847 | ||||
| The music playing at the coffee shop gives me pleasure. | 0.836 | 22.475*** | |||
| The volume of music in the coffee shop is appropriate. | 0.792 | 21.324*** | |||
| Taste | 0.948 | 0.859 | 0.804 | ||
| The food and drinks are delicious. | 0.962 | ||||
| There are several types of food and drinks. | 0.878 | 37.728*** | |||
| The ingredients in the food and drinks are fresh. | 0.938 | 46.839*** | |||
| Touch | 0.949 | 0.862 | 0.835 | ||
| The coffee shop is clean. | 0.955 | ||||
| The heating or air conditioning in the coffee shop is appropriate. | 0.912 | 41.745*** | |||
| The furniture in the coffee shop is comfortable. | 0.917 | 42.564*** | |||
| Pleasure | 0.913 | 0.778 | 0.793 | ||
| I feel satisfied by my visit to the coffee shop. | 0.932 | ||||
| I feel happy when I visit the coffee shop. | 0.923 | 35.628*** | |||
| I feel pleasure when I visit the coffee shop. | 0.783 | 26.006*** | |||
| Arousal | 0.853 | 0.660 | 0.853 | ||
| I feel energetic when I visit the coffee shop. | 0.837 | ||||
| I feel excited when I visit the coffee shop. | 0.802 | 20.977*** | |||
| I feel a sense of arousal when I visit the coffee shop. | 0.797 | 20.848*** | |||
| Dominance | 0.804 | 0.577 | 0.802 | ||
| I feel confident in the coffee shop. | 0.726 | ||||
| I can act as I wish in the coffee shop. | 0.783 | 16.025*** | |||
| I am intimated by the atmosphere of the coffee shop. | 0.769 | 15.912*** | |||
| Flow | 0.949 | 0.860 | 0.945 | ||
| I forget about the outside world when I am in the coffee shop. | 0.954 | ||||
| It feels as if time flies when I am in the coffee shop. | 0.885 | 38.009*** | |||
| I feel oblivious to the flow of time when I am in the coffee shop. | 0.942 | 46.241*** | |||
| Behavioral Intention | |||||
| I will continue to visit the coffee shop. | 0.879 | 0.884 | 0.718 | 0.881 | |
| I am inclined to visit the coffee shop repeatedly. | 0.770 | 22.490*** | |||
| I will revisit the coffee shop. | 0.888 | 26.936*** | |||
| I will recommend the coffee shop to my acquaintances. | 0.921 | 0.927 | 0.809 | 0.925 | |
| I will actively talk about the positive features of the coffee shop to my acquaintances. | 0.841 | 30.093*** | |||
| I will share the positive features of the coffee shop to my acquaintances. | 0.933 | 37.456*** |
| Construct | 1 | 2 | 3 | 4 | 5 | 6 | 7 | 8 | 9 | 10 | 11 | Mean | SD | |
|---|---|---|---|---|---|---|---|---|---|---|---|---|---|---|
| 1 | Sight | 0.58a | 0.41c | 0.18 | 0.17 | 0.20 | 0.10 | 0.07 | 0.05 | 0.02 | 0.11 | 0.03 | 3.55 | 0.64 |
| 2 | Smell | 0.64b** | 0.63 | 0.29 | 0.16 | 0.23 | 0.07 | 0.07 | 0.05 | 0.02 | 0.09 | 0.08 | 3.50 | 0.64 |
| 3 | Sound | 0.42** | 0.54** | 0.68 | 0.08 | 0.16 | 0.04 | 0.07 | 0.08 | 0.02 | 0.08 | 0.07 | 3.33 | 0.65 |
| 4 | Taste | 0.41** | 0.40** | 0.29** | 0.85 | 0.20 | 0.10 | 0.06 | 0.07 | 0.03 | 0.11 | 0.07 | 3.48 | 0.64 |
| 5 | Touch | 0.44** | 0.48** | 0.40** | 0.44** | 0.86 | 0.10 | 0.09 | 0.04 | 0.04 | 0.08 | 0.04 | 3.62 | 0.65 |
| 6 | Dominance | 0.31** | 0.28** | 0.22** | 0.31** | 0.31** | 0.57 | 0.16 | 0.06 | 0.01 | 0.18 | 0.05 | 3.67 | 0.57 |
| 7 | Pleasure | 0.28** | 0.28** | 0.27** | 0.26** | 0.31** | 0.40** | 0.77 | 0.22 | 0.17 | 0.10 | 0.30 | 3.83 | 0.52 |
| 8 | Arousal | 0.24** | 0.24** | 0.29** | 0.27** | 0.20** | 0.25** | 0.47** | 0.66 | 0.07 | 0.17 | 0.10 | 3.11 | 0.74 |
| 9 | Flow | 0.16** | 0.16** | 0.17** | 0.18** | 0.22** | 0.13** | 0.41** | 0.27** | 0.86 | 0.08 | 0.13 | 3.26 | 0.78 |
| 10 | Re-visit | 0.34** | 0.31** | 0.28** | 0.33** | 0.29** | 0.42** | 0.32** | 0.42** | 0.29** | 0.71 | 0.23 | 4.06 | 0.60 |
| 11 | Recommen-dation | 0.18** | 0.29** | 0.26** | 0.27** | 0.20** | 0.24** | 0.55** | 0.38** | 0.37** | 0.48** | 0.80 | 3.34 | 0.83 |
| Structural Relationship | Hedonic (N = 415) | Utilitarian (N = 193) | Free | Constrained | △χ2 | Results | |||
|---|---|---|---|---|---|---|---|---|---|
| t-value | t-value | χ2(df=916) | χ2(df=917) | ||||||
| H1a | Sight→Dominance | 0.223 | 2.451* | 0.044 | 0.388 | 1694.402 | 1696.225 | 1.823 | Rejected |
| H1b | Sight→Pleasure | −0.028 | −0.364 | 0.072 | 0.782 | 1694.402 | 1695.068 | 0.666 | Rejected |
| H1c | Sight→Arousal | 0.106 | 1.235 | 0.094 | 0.973 | 1694.402 | 1694.413 | 0.011 | Rejected |
| H2a | Smell→Dominance | 0.071 | 0.767 | −0.077 | −0.593 | 1694.402 | 1695.245 | 0.843 | Rejected |
| H2b | Smell→Pleasure | 0.065 | 0.830 | −0.032 | −0.294 | 1694.402 | 1694.943 | 0.541 | Rejected |
| H2c | Smell→Arousal | 0.020 | 0.230 | −0.243 | −2.168* | 1694.402 | 1697.450 | 3.048 | Rejected |
| H3a | Sound→Dominance | 0.026 | 0.384 | 0.029 | 0.278 | 1694.402 | 1694.402 | 0 | Rejected |
| H3b | Sound→Pleasure | 0.068 | 1.153 | 0.023 | 0.261 | 1694.402 | 1694.595 | 0.193 | Rejected |
| H3c | Sound→Arousal | 0.146 | 2.248* | 0.277 | 3.008** | 1694.402 | 1695.796 | 1.394 | Rejected |
| H4a | Taste→Dominance | 0.111 | 1.761 | 0.205 | 2.263* | 1694.402 | 1695.176 | 0.774 | Rejected |
| H4b | Taste→Pleasure | 0.053 | 0.980 | −0.069 | −0.924 | 1694.402 | 1696.090 | 1.688 | Rejected |
| H4c | Taste→Arousal | 0.130 | 2.175* | 0.117 | 1.498 | 1694.402 | 1694.404 | 0.002 | Rejected |
| H5a | Touch→Dominance | 0.154 | 2.463* | 0.229 | 2.196* | 1694.402 | 1694.730 | 0.328 | Rejected |
| H5b | Touch→Pleasure | 0.015 | 0.278 | 0.289 | 3.348*** | 1694.402 | 1701.987 | 7.585 | Supported |
| H5c | Touch→Arousal | −0.025 | −0.425 | 0.174 | 1.922 | 1694.402 | 1697.852 | 3.45 | Rejected |
| H6 | Dominance→Arousal | 0.165 | 2.611** | 0.012 | 0.151 | 1694.402 | 1696.370 | 1.968 | Rejected |
| H7 | Dominance→Pleasure | 0.329 | 5.476*** | 0.182 | 2.473* | 1694.402 | 1696.244 | 1.842 | Rejected |
| H8 | Arousal→Pleasure | 0.310 | 5.722*** | 0.396 | 5.412*** | 1694.402 | 1695.006 | 0.604 | Rejected |
| H9 | Pleasure→Flow | 0.192 | 3.730*** | 0.431 | 6.124*** | 1694.402 | 1701.560 | 7.158 | Supported |
| H10 | Pleasure→Behavioral Intention | 0.480 | 7.108*** | 0.473 | 5.004*** | 1694.402 | 1694.707 | 0.305 | Rejected |
| H11 | Flow→Behavioral Intention | 0.321 | 5.090*** | 0.266 | 3.011** | 1694.402 | 1694.403 | 0.001 | Rejected |
© 2019 by the authors. Licensee MDPI, Basel, Switzerland. This article is an open access article distributed under the terms and conditions of the Creative Commons Attribution (CC BY) license (http://creativecommons.org/licenses/by/4.0/).
Share and Cite
Jang, H.-W.; Lee, S.-B. Applying Effective Sensory Marketing to Sustainable Coffee Shop Business Management. Sustainability 2019, 11, 6430. https://doi.org/10.3390/su11226430
Jang H-W, Lee S-B. Applying Effective Sensory Marketing to Sustainable Coffee Shop Business Management. Sustainability. 2019; 11(22):6430. https://doi.org/10.3390/su11226430
Chicago/Turabian StyleJang, Ha-Won, and Soo-Bum Lee. 2019. "Applying Effective Sensory Marketing to Sustainable Coffee Shop Business Management" Sustainability 11, no. 22: 6430. https://doi.org/10.3390/su11226430