Abstract
Drawing on literature from environmental psychology and urban planning, this study evaluates the relationships between environmental satisfaction, residential satisfaction, and place attachment in the context of both rural and urban areas in China. A field survey was carried out with 490 valid questionnaires collected in rural areas and 420 from urban areas in China. Partial least squares path modeling was applied for testing the relationships between the three main constructs. The results indicate a significant mediating role of residential satisfaction between environmental satisfaction and place attachment, suggesting the importance of residential satisfaction in residents’ attachment-building to place. This study also found significant differences between rural and urban contexts with the mediating effect of residential satisfaction being absent from the rural sample.
1. Introduction
Residential satisfaction has long been a topic of great interest in environmental psychology [1,2,3]. It is defined as an attitude reflecting the fulfillment of residents living in a specific place in relation to their needs, expectations, and objectives [4,5]. A substantial amount of research has investigated the antecedents and consequences of residential satisfaction [3,4]. With respect to factors that influence residential satisfaction, the majority of research has focused on objective and subjective attributes of the residential environment as well as on the personal characteristics of residents [3,6,7]. Residential satisfaction has also been shown to be a critical predictor of cognitive, affective, and behavioral characteristics of the residents, including such aspects as life satisfaction [3], neighborhood attachment [8,9], mental/human wellbeing [10], and residential mobility [11].
A related attitude in the literature on environmental psychology is environmental satisfaction, which is defined as contentment with local environmental conditions and government environmental policies [12]. Both environmental satisfaction and residential satisfaction are influenced by characteristics of the environment (e.g., environmental quality [13] and are predictors of individuals’ cognitive, affective, and behavioral characteristics, such as mental health, human comfort, and place attachment (e.g., [14]). Place attachment is comprehended as “a positive connection or bond between a person and a particular place” [15,16]. However, despite the extensive research on residential and environmental satisfaction, there is a dearth of research investigating their relationship. Nevertheless, understanding the resident-place relationship from an individual, environmental, and socially sustainable point of view is critical for urban planning and development.
Investigations of how long-term resident-place relationships are constructed can provide great insights for researchers and policymakers, especially in developing countries characterized by rapid urbanization and severe environmental problems. For instance, China’s urbanization rate increased from 30% in 1985–2013 [17] to 56.1% in 2015 [18], and is expected to reach over 70% by 2050 [18]. Rapid urbanization and industrialization have had negative environmental consequences [19] such as significant haze pollution [20]. Furthermore, urbanization has led to demographic changes in both urban and rural areas of China [21], resulting in particular phenomena such as the “elderly village” [17] in which younger people have migrated from rural villages to urban centers. Thus, in order to best formulate effective policies in urban and rural planning it is important to understand residents’ attitudes and behavior toward both the environment and their domicile under these changing circumstances.
This study investigated the relationship between environmental satisfaction, residential satisfaction, and place attachment in rural and urban areas of China. A second-order structural model was proposed to capture the complexity in the paths between 13 latent variables and three second-order constructs. This model was tested using survey data on a sample of 904 residents in China (420 from urban areas and 484 from rural areas). The research contributes to the relevant literature in three ways. First, it enriches the understanding of how environmental satisfaction influences residential attitude and behaviors in the relationship between people and place. Second, it extends prior research on the factors that influence residential satisfaction by considering satisfaction with the local environment and government environmental policies. Third, the comparison of psychological relationships in rural and urban areas provides another perspective through which to investigate how residential psychology is affected by environmental differences [22,23].
2. Theoretical Frameworks
2.1. Residential Satisfaction
Residential satisfaction is a topic of great interest in geography, psychology, and urban planning studies [1,2,4,24,25]. Among the immense number of studies of residential satisfaction, some have analyzed satisfaction within a particular residential realm (house, neighborhood, or community/city) while many others have investigated overall residential satisfaction [22].
Residential satisfaction has been studied as an important criterion for evaluating residential environment quality [26] and has been explored in a number of contexts, including housing [27], health [28], finance [29], and leisure [30]. Analysis of the quality of life in a residential environment ranges from a focus on the individual to friendships, marriage, family, community, and place of residence [31,32], as well as different quality dimensions of the environment [33,34]. Perceived residential characteristics depend on individuals’ cognitive understanding of natural and artificial endogenous and exogenous components as well as their perceived value [34].
Past research on evaluating environment quality from a resident’s perception has developed a multidimensional construct with several psychological measures of specific aspects of environmental quality, including perceived environmental quality indices (PEQI) [30] and perceived residential environment quality indices (PREQI) [31,35]. Four macro aspects form the latter’s indices: the spatial, human, functional, and contextual dimensions [31]. In this framework, the spatial dimension refers to architectural and urban planning while the human dimension refers to people and social relationships. The functional dimension refers to services and facilities within a given place, and the contextual dimension reflects the pace of life, environmental health, and pollution as well as upkeep and care.
2.2. Environmental Satisfaction
Environmental satisfaction is a specific response toward the natural environment. Prester, Rohrmann, and Schellhammer [36] argued that whether individuals participate in environmental activism is determined by their dissatisfaction with the condition of the environment and expectation of significant improvement of their environment quality. Based on this, Pelletier, Legault, and Tuson [12] developed a bidimensional residential satisfaction index. The first dimension involves the subjective appraisal of a given natural environment, including water quality, noise level, and air pollution, which indicates to what degree the given environment meets the expectations and needs of the residents. Natural environments bring many benefits for residents, such as restoration from negative affections and improvement of wellbeing [37,38,39,40,41,42,43,44,45,46,47]. Some studies also suggest that perceived natural environment conditions correlate to life/neighborhood satisfaction [48,49]. Above all, perceived natural environmental quality affects overall residential satisfaction.
The second dimension is the subjective assessment of government policies regarding the environment. Local government policy development related to the environment has a direct impact on resident psychology, reasoning, and further pro-environmental behaviors [50,51]. Poor government policies regarding the environment lead to negative resident attitude toward the government and further the place [52,53]. When residents have a positive attitude toward government environment policies, they have greater confidence in the quality of living conditions, which, in turn, enhances their satisfaction toward this place (e.g., [54]). Thus, satisfaction with government policies plays an important role in overall residential satisfaction. Based on the above analysis, this study hypothesized the following:
Hypothesis 1 (H1).
One’s environmental satisfaction has a positive impact on his/her residential satisfaction with a given place.
2.3. Place Attachment
The affective component of residential satisfaction has been studied in terms of affective quality and place attachment [8]. Many studies in different contexts, including attachment theory, recreation studies, tourism management studies, and environmental psychology, apply place attachment to describe the complex relationship between an individual and a given place [55,56,57,58,59,60]. Place attachment has been conceptualized in terms of its cognitive, affective, individual, and social dimensions [61,62].
The four widely accepted dimensions of place attachment are: (1) Place identity which is the outcome of the self-place identification process, whereby residents perceive and conceptualize themselves through a collective identity from a perspective centered on place [63]; (2) Place dependence that reflects a functional attachment, emphasizing the importance of the place in terms of how it provides necessary features and resources for basic living activities [15]; (3) Affective attachment which refers to what degree one is emotionally attached to a place, irrespective of evaluations, preferences, utilities, cognition, or objective judgments [64]; and (4) Social bonding, that indicates the social relationships in the people-place environment concerning human society as a collection or basic unity of family and friend zones [61,65].
Residential satisfaction has been considered an important predictor of place attachment [56,57,66]. Although “it is possible to be satisfied with where one lives and to not be particularly attached to place” [67], the majority of research views the relationship between these two constructs as positive [68]. Since residential satisfaction reflects cognitive evaluations of the residential environment, individuals tend to feel more strongly attached to a place if living in the place is perceived as meeting their needs, expectations, and objectives [69]. Comparative evaluations may also determine people’s attachment to a place. For instance, individuals may feel more attached to a place if alternative places are not perceived to be better [70]. There has been much empirical evidence showing that residential satisfaction has a positive impact on place attachment in a variety of different contexts. Using a sample of 497 inhabitants from 20 different neighborhoods in Rome (Italy), Bonaiuto, Aiello, Perugini, Bonnes, and Ercolani [35] showed that residential satisfaction, operationalized in terms of multidimensional perceived residential environment quality (PREQ), has a significantly positive effect on neighborhood attachment. Sam, Bayram, and Bilgel [71] obtained a similar finding in a sample of 466 inhabitants of 25 different neighborhoods in the metropolitan municipality of Bursa (Turkey), so as Beyer, Kamin, and Lang [72] using longitudinal data from a sample of 85 older, community-dwelling German adults. Furthermore, using survey data from a sample of 140 residents of two kibbutzim in Israel, Casakin and Reizer [73] found that individuals’ residential satisfaction has a positive effect on place attachment, which then predicts their life satisfaction.
Some researchers have argued that place attachment is an indicator of satisfaction. Kyle, Mowen, and Tarrant [74] investigated the effect of place attachment on the perceived values of tourists and found that it is an important factor in explaining the variance of perceived values. When the function of a place is able to meet tourists’ unique requirements, they develop an affective attachment to the place and then feel satisfied. This conclusion is supported by much research [75,76,77].
Both interpretations of the relationship between place satisfaction and place attachment have their theoretical arguments and empirical evidence. However, place satisfaction and place attachment likely intertwine and influence each other constantly in a dynamic fashion. This paper takes a practical point of view and chooses to study place attachment as the outcome construct for its context. Urbanization and migration are long-term processes and therefore require appropriate temporal perspectives in order to better understand residents’ psychology, behavior, and associated contributions to sustainability at different scales. Investigating residential satisfaction is important but has only limited implications for local government policy-making and place strategies given the changing situations and circumstances that they face. Place attachment may therefore provide greater understanding of the multiple scales at which place processes occur due to its multi-dimensional nature. Therefore, this study proposed the following hypothesis:
Hypothesis 2 (H2).
One’s residential satisfaction has a positive impact on his/her attachment to a given place.
Extending previous discussion and propositions, a mediating effect of residential satisfaction can be proposed between environmental satisfaction and place attachment, and this bridging effect of residential satisfaction has been shown to be essential in previous studies in environmental psychology. Moser [78] argued that promoting people–environment congruity, a reflection of place attachment in place identity, requires looking beyond the singular effects of environmental features to consider people’s overall relationship with their environment from their residential experiences. Other studies, such as [54], found evidence of trust in government and access to local natural resources interact directly with sense of place. Further, Shin [13] specifically noted that many studies of residential environments utilize satisfaction as an outcome of environmental factors and as a predictor of important constructs like place attachment. The literature overall suggests a partial mediation of residential satisfaction between environmental satisfaction and place attachment. Accordingly, the third hypothesis was proposed as follows:
Hypothesis 3 (H3).
Residential satisfaction can perform a mediating role between environmental satisfaction and place attachment.
Previous research has suggested different predictors of quality of life in urban environment, compared to rural regions [79]. Rural residents were further found to be satisfied differently compared to urban residents [80]. The different types of environments and lifestyles of urban and rural residents’ may lead to some fundamental variations between these two types of residents in their perception, evaluation, and long-term relationships with the place. Accordingly, the fourth hypothesis was proposed as follows:
Hypothesis 4 (H4).
The relationships proposed in previous hypotheses may vary between rural and urban contexts.
3. Research Methods
3.1. Data Collection
A survey was implemented for this study with data collected from several sources. Rural data were collected from two villages in Shandong Province and from three villages in Heilongjiang Province in China from July to August 2014. Both are among the top ten largest agricultural provinces in the country and have a large proportion of rural residents. To collecting this data, we visited the villages involved in previous projects, which were typical and representative in terms of size, population, natural environment, and government policies. We input the telephone number of villagers provided by the local government in the computer and use random number program to select candidates to interview them at their home. A total of 484 valid questionnaires were included in the rural data analysis. For urban data, we adopted an existing dataset through an online survey portal held by WJX.cn, an online survey agent served 90% universities and research institutes in China that provided an urban sample from their sample panel via a random selection process, and then approached the respondents by email to ask them to complete an online questionnaire. The data was collected in April 2015. Participants could come from any cities in China, participation was voluntary, and consent was obtained from all respondents. The survey contains no sensitive content nor questions related to participants’ personal information. In total, 1368 online survey entries were recorded and 420 valid questionnaires were obtained, resulting in a valid rate of 30.7%. The demographics of the sample are listed in Table 1.

Table 1.
Descriptive statistics of participant demographics.
In order to test the non-response bias of the online survey, we first compared the survey results to some known population parameters. For example, the rate of male to female respondents was approximately 1:1, which is close to the ratio across the whole country. In addition, the annual income of almost 90% of rural respondents was below 50,000 RMB while the annual income of nearly 90% of urban respondents was above this average level, which is in accordance with the significant economic disparity between rural and urban residents in China [81].
As another method of testing non-response bias, we also compared early-returned questionnaires to late-returned questionnaires using the variables of respondents’ age, annual income, and education level. The results showed that late respondents and non-respondents shared similar characteristics and response biases, indicating that non-response bias is not a major problem in our dataset.
3.2. Measurement
The measurement of residential satisfaction in this study was adapted from PREQ developed by Sam, Bayram, and Bilgel [71] to better fit with the Chinese context. There are seven dimensions: (a) pollution and lack of green areas (five items were used to measure pollution, and only one item from the original measure was included to measure a lack of green areas as it is not common in rural China); (b) non-punctual transportation (one item was dropped from the five original items because of low factor loading); (c) punctual commercial services (all five original items were included); (d) opportunities (all four original items were included, and two new items were added); (e) adequacy of social and health services (five original items were included, and two items about services for elder peoples were deleted as this is not common in rural China); (f) adequacy of educational services (three original items were included, and one item was deleted because of low factor loading); (g) cultural-recreational services (four original items were included, and two items pertaining to movie theaters and libraries were deleted as they are rare in rural China). The measurement of place attachment was adopted from Kyle, Graefe, and Manning’s [61] as well as Chen, Dwyer, and Firth’s [56,57,62] evaluation-based place attachment dimensionality and scales. As for the scale of environmental satisfaction, Pelletier, Legault, and Tuson’s [12] measure is applied for this study. All measurements were widely applied in different cultural contexts with high reliability, validity, and generalizability. For instance, the place attachment measuring was applied in both environmental psychology and tourism studies for instance in Australia, and China [56,57,62]. PREQ scales developed by Sam, Bayram, and Bilgel [71] were tested in Nigeria [82]. Pelletier, Legault, and Tuson’s [12] measure on environmental satisfaction was also applied in China in several studies [83,84]. The details of the measure are presented in the Appendix A (Table A1, Table A2 and Table A3).
Multiple-item, five-point Likert scales were adopted for all variables, with the lowest value “1” indicating “strongly disagree” and the highest value “5” indicating “strongly agree”. A preliminary English version of the survey instrument, derived from a thorough literature review of constructs and measures, was translated into Chinese and back into English by two separate groups of researchers as a double check. Two stages of pretesting were conducted to determine the effectiveness of the questionnaire. In the first pretest, participants were aware that they were taking a pretest. They were asked to describe their reactions to the flow of the questions, explain whether the instrument was difficult to complete or understand, and even give their interpretation of some specific questions. After that, an undeclared test was carried out, with the survey administered just as we intended to conduct it in the field. The purpose of this was to ensure that respondents had no trouble following the instructions and enable us to examine the frequencies of the items and check whether there were too many non-responses. Finally, the feedback from the pretests was incorporated into a revised version of the survey instrument.
3.3. Reliability and Validity
A confirmatory factor analysis was conducted based on the calculation of Cronbach’s alpha (α), composite reliability (CR), and average variance extracted (AVE). The results indicated acceptable reliability (see Table 2). All items loaded highly on their respective latent constructs (0.539–0.950), all instances of Cronbach’s α were higher than 0.79, and all CR scores were higher than 0.86 [85].
Table 2.
Assessment of the reliability and validity of the measurement model.
Discriminant validity was examined by comparing the square root of AVE for each construct with the correlations between pairs of latent variables [86]. All correlation coefficients were smaller than the AVE square roots, shown in Table 3, with the exception of one. Specifically, for this exception the correlation between affective attachment and social bonding (0.771) was slightly higher than the AVE square root for social bonding (0.766), suggesting an acceptance level of discriminant validity.
Table 3.
Testing discriminant validity.
4. Data Analysis and Results
This study applied a partial least squares (PLS)-based structural equation modeling (SEM) to test the aforementioned research hypotheses. The PLS-based approach was appropriate for this study for two main reasons. First, the PLS technique is robust and does not require data to be normally distributed [85,87,88]. Second, the PLS-based approach is superior to covariance-based SEM for complex model testing [89]. The measurement and structural models in this study encompassed a large number of paths with considerable complexity. Specifically, there were 13 latent variables and three second-order constructs on a sample size of 904 (420 from urban areas in China and 484 from rural areas in China). This complex model was suitable for applying a PLS-based SEM approach. Accordingly, this study used the software SmartPLS (version 3.2.3) to perform its analyses. As suggested by Hair et al. [88], the researchers ran a standard PLS algorithm (1000 iterations and a stop criterion of 10−7) and assessed the significance level of the estimates based on 1000 bootstraps.
4.1. Inner-Model Evaluation
For evaluating the structural model, effect sizes were calculated for the endogenous variables [55,85,90]. The full structural model was compared to models lacking each respective predicting construct to produce f2 effect sizes. The value f2 reflects the changes in the adjusted R2 in relation to the unexplained variance of an endogenous variable [89]. The effect sizes of 0.02/0.15/0.35 were regarded as weak/moderate/strong [90].
The results are listed in Table 4 for the endogenous variables of place attachment and the four dimensions of place attachment. Some of the f2 sizes for different dependent variables were close to zero, such as in residential satisfaction on place identity, suggesting these constructs were not relevant for directly explaining the variance observed. However, the f2 effect size of environmental satisfaction on place attachment was 0.115 while that of residential satisfaction was 0.304, justifying their inclusion in the structural model testing [87,91,92]. Specifically, the effect size of environmental satisfaction on place attachment illustrates a weak but close to moderate effect, and that of residential satisfaction suggests a moderate but almost strong effect.
Table 4.
f2 effect sizes for endogenous variables.
4.2. Hypotheses Testing
First, the potential impact of the variables of age, education, family size, gender, and income were examined on the targeted constructs. Significance levels were calculated on 1000 bootstrap samples [93] and no or only weak significant impacts were found (coefficients ranged from 0 to 0.2). Age had a negative effect on residential satisfaction (γ = −0.067, p = 0.045) but positive effects on environmental satisfaction (γ = 0.112, p = 0.002) and place attachment (γ = 0.080, p = 0.040). Education had no significant effects. Family size had a negative effect on residential satisfaction (γ = −0.172, p = 0.000) but a positive effect on environmental satisfaction (γ = 0.199, p = 0.000). As for gender, females tended to have higher environmental satisfaction (γ = 0.083, p = 0.006) but lower attachment to place (γ = −0.067, p = 0.011). Income had the opposite effects of age, with a positive impact on residential satisfaction (γ = 0.191, p. = 0.000) and negative effects on environmental satisfaction (γ = −0.206, p = 0.001) and place attachment (γ = −0.074, p = 0.028).
Figure 1 summarizes the path coefficients of the relationships in the tested second-order structural model and the R2 for the endogenous constructs. These relationships remained statistically significant after removing all the endogenous variables, suggesting a robust result of the hypothesized structural model. For the structural model, significance levels were calculated on 1000 bootstrap samples and t-statistics were calculated [94]. These statistics are listed in Table 5 for the second-order model testing. As is shown, environmental satisfaction had a direct effect on place attachment, which was positive and significant (γ = 0.278, p < 0.001). Furthermore, environmental satisfaction had a significant and positive effect on residential satisfaction (γ = 0.427, p < 0.001), which in turn, had a significant and positive effect on place attachment (γ = 0.469, p < 0.001). The above results supported both H1 and H2. In particular, the first-order reflective factors of residential satisfaction, environmental satisfaction, and place attachment were all significant, which also confirmed the reliability of our measures.
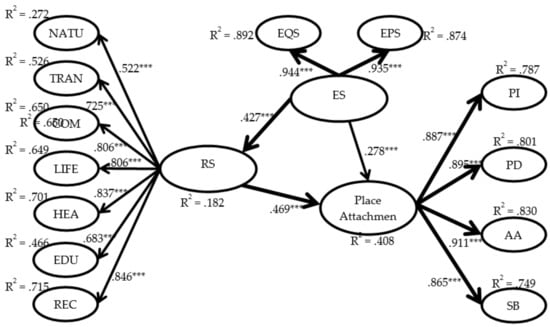
Figure 1.
The result of structural equation model. Note: *** p < 0.001; EQS = Satisfaction with environmental conditions; EPS = Satisfaction with government environmental policies; ES = Environmental satisfaction; NATU = Pollution and lack of green areas (reversed); TRAN = Transportation; COM = Punctual commercial services; LIFE = Lifestyle (opportunities); HEA = Adequacy of social and health services; EDU = Adequacy of educational services; REC = Cultural-recreational services; PI = Place identity; PD = Place dependence; AA = Affective attachment; SB = Social bonding; RS = Residential satisfaction.
Table 5.
Second-order model testing for estimates, t-statistics, and 95% bias corrected confidence intervals.
Research has suggested the use of confidence intervals to investigate mediating effects [89,95]. Accordingly, an indirect relationship testing was applied in the PLS based on 1000 bootstrap samples, and the results were consistent with the proposition on the mediating effect of perceived residential environment quality: for this indirect relationship, γ = 0.200, p < 0.001, t = 8.976, bias-corrected confidence interval was of (0.158, 0.246). Hence, H3 was supported. Also, from a post-hoc analysis removing residential satisfaction, the f2 effect size reflecting the changes in R2 (illustrated in Table 4) is 0.304, indicating a moderate (close to strong) effect of residential satisfaction in the structural model. This result again confirms that residential satisfaction plays a mediating effect between environmental satisfaction and place attachment [87,92].
4.3. Post hoc Multi-Group Analysis
The study population was divided into two groups by the location of data collection: rural areas and urban areas. A three-step procedure analyzing measurement invariance of composite models (MICOM) was applied to test: (1) configural invariance, (2) compositional invariance, and (3) the equality of composite mean values and variances [96,97]. From this analysis, no composite has a correlation in urban and rural group that is significantly lower than one, suggesting compositional invariance being established. Furthermore, all the permutation-based confidence intervals of differences in mean values and logarithms of variances between the construct scores of the two groups include the obtained differences, suggesting equal composite mean values and variances. Via this three-step permutation procedure, sufficient evidence was provided that the observed scale indicators/items under study measured the same theoretical constructs across the two groups of the sample [96].
To test whether the structural model differed in each group, this study conducted a multi-group analysis to calculate 95% bias-corrected bootstrap intervals in order to compare rural to urban sub-samples [98,99]. The calculation is based on a 1000 bootstrap run. There is no significant difference between the overall model and the rural and urban models (see Table 6). As for the differences between urban and rural samples, a number of significant differences were found. First, the relationship from environmental satisfaction to residential satisfaction was significantly stronger for the rural sample, and that from residential satisfaction to place attachment was significantly stronger for the urban sample. Second, residential satisfaction was more significantly reflected in education, health, lifestyle, and recreation in the urban sample while more in nature in the rural sample. Environmental satisfaction, on the other hand, was more significantly reflected in the environment policy satisfaction in the urban sample.
Table 6.
Second-order model group analysis for estimates and 95% bias corrected confidence intervals for comparisons between rural and urban groups.
A further first-order group analysis was conducted to compare rural to urban sub-samples, and several significantly different direct and indirect relationships were found as follows. (1) The effects of environment quality satisfaction on different aspects of residential satisfaction were generally positive in the rural sample, resulting in a significant difference in these relationships. (2) Transportation had a significant negative impact on place identity in the rural sample, but this relationship was not significant in the urban sample. (3) Education more significantly impacted affective attachment and place dependence in rural areas than in urban areas. (4) Environment policy satisfaction had more significant indirect impacts on dimensions of place attachment in urban areas. (5) Environment quality satisfaction had significant indirect effects on dimensions of place attachment in rural areas, while no significant indirect relationships were found in the urban areas.
5. Discussion, Conclusions and Implications
This study has proposed a theoretical framework to capture the relationships between environment satisfaction, residential satisfaction, and place attachment from the perspective of the resident. A second-order structural model was constructed and tested using a sample of both rural and urban residents in China. It was found that environmental satisfaction has an indirect positive effect on place attachment, via the mediating effect of residential satisfaction.
In addition, when separating the rural and urban samples, significant differences in the relationship of “environmental satisfaction-residential satisfaction-place attachment” were observed, indicating a systemic difference in the psychology of rural and urban populations. While environmental satisfaction had a significant impact on residential satisfaction in both urban and rural areas in China, the impact was more significant in rural areas than in cities. This suggests that satisfaction with their environmental conditions plays an important role for residents of rural areas of China. In addition, the impact of residential satisfaction on place attachment was more significant in urban areas. Currently, China is experiencing an accelerating rate of urbanization as result of migration to urban regions [100,101]. This may well be the key reason why place satisfaction affects urban residents’ attachment to a given place to a greater extent than it does rural residents’: it is easier for urban residents to migrate between urban regions; thus, their attachment to their resident place is more dependent on their level of satisfaction with it.
Simply put, urban residents’ attachment to a given place was more influenced by residential satisfaction than by environment satisfaction, while rural residents’ environment satisfaction affected their attachment to the place through both direct and indirect effects, with residential satisfaction as the mediator. This is consistent with the reality that other aspects of the residential environment play roles that are more important in urban residents’ attitude toward a place. The implications are substantial yet different for urban and rural government authorities. Local governments in rural areas of China should focus on the improving environmental qualities to strengthen residents’ attachment to the place. For example, they can put more efforts into facilitating transportation connectivity and access, enhancing the level of social services and generating employment opportunities. In urban areas of China, on the other hand, governments need to explicitly enhance residents’ satisfaction for a given place as well as improve overall environmental quality. For example, they can invest more in increasing greenspace, improving public transport and reducing pollution levels. In summary, both urban and rural government will need to improve amenity values however the nature of such amenities will potentially differ according to local circumstances and population profiles [102]. Nevertheless, a range of actions to strengthen place attachment will likely be required to make locations “sticky”, attract, and retain populations.
In examining the effects of environmental satisfaction in the first-order structural model, we found that satisfaction with environmental conditions had impacts on both place identity and affective attachment, while satisfaction with government environmental policies had an impact on place dependence alone. This is consistent with Moser’s [78] proposition on residential satisfaction’s mediating effect on person-environment congruity and suggests the importance of environmental conditions on the cognitive and affective aspects of residents’ relationship with a place. The implication is that the actual environmental conditions form the residents’ subjective and emotional connection to the place, and any modifications to these conditions may affect residents’ attachment to place. However, in the urban context, the actual environmental conditions had a very limited influence on residents’ attachment to the place.
Pollution and a lack of green areas were found to significantly influence residents’ satisfaction toward their place in both urban and rural areas of China, indicating a high level of awareness of the importance of the environment. This is consistent with the findings of past studies examining the effect of perceived residential environment quality on attachment [9,35]. This concern among Chinese citizens calls for future research on understanding the role of the resident in environmental and sustainable urbanization, as well as exploring new techniques for reducing pollution and new approaches for evaluation [6,103].
Interestingly, improvements in the transportation system have led to a decrease in place identity, especially in rural areas of China. It is reasonable that convenient transportation that connects different regions can reduce rural residents’ dependence on their local rural areas, as they are not necessarily bound to one place [104]. In fact, the development of transportation in the country (such as China’s high-speed railway) has been an important driver for urbanization in and of itself. This study further finds that adequacy of educational services is not a key factor affecting residents’ satisfaction toward a given place but is an important indicator of their attachment to the place in rural areas of China.
6. Limitations
Educational issues in China are relatively complex and require examination beyond the scope of this study. Improving educational services in the study regions may help local governments retain residents by strengthening their attachment to their respective regions. This said, education was not found to have a significant impact on any construct included in this study in terms of the overall sample, but the huge variance between rural and urban samples might be another reason leading to the systematic differences between rural and urban models. Therefore, this remains a limitation of this study and suggests the need for future research. This limitation also applies to the huge variance in age in the urban and rural samples of this study.
Another limitation of this study is that length of residence (often considered an important variable in environmental studies) is not emphasized here. Therefore, issues regarding length of residence require further examination especially in areas that have experienced large-scale in-migration.
This paper provides empirical evidence from a specific context (urban and rural China). It would be promising for future research to examine more individual physical and social factors, such as years of residence, collective efficacy, and criminal history, which have been shown to play a role in place attachment [105]. Studying the dynamics of residents’ psychology and behavior related to the environment can potentially provide a unique perspective for exploring and discussing urban planning issues.
Finally, although we attempted to obtain a valid sample for this study, there were still some limitations in the sampling process, and improvements are required in future studies. For the rural sample, we choose only two typical provinces and several villages there. Future studies should select more areas and try to confirm the results in a larger sample. For the urban sample, as we collected data with an online survey agent, the response rate was quite low, potentially causing sampling bias issues. Although the non-response tests showed that this was not a problem, future studies should aim to increase the response rate, for example, by applying a more appropriate survey technique to prevent non-response.
Author Contributions
N.C. proposes ideas, applies statistical and computational techniques to analyze study data; C.M.H. takes charge of specifically critical review, commentary and revision; K.Y. proposes ideas and writes the initial draft; C.Q. takes part in writing the initial draft.
Funding
This research was funded by [the Fundamental Research Funds for the Central Universities and the Research Funds of Renmin University of China] grant number [No. 18XNB032] and [Department of Management, Marketing & Entrepreneurship, University of Canterbury].
Conflicts of Interest
The authors declare no conflict of interest.
Appendix A
Table A1.
Environment Satisfaction (ES).
Table A1.
Environment Satisfaction (ES).
| Satisfaction with environmental conditions: |
| ES1. The local environmental conditions are excellent. |
| ES2. In most ways, the environmental conditions in my area are close to the ideal. |
| ES3. So far, I am content with the state of the environment in my area. |
| ES4. If I could change some aspect of the environmental condition in my area, I would change almost nothing. |
| Satisfaction with government environmental policies: |
| ES5. In most ways, the quality of the government’s environmental programs is very good. |
| ES6. The government policies developed to deal with the environmental situation are excellent. |
| ES7. For the most part, the programs developed by the government have addressed the most important environmental problems. |
| ES8. In my opinion, the amount of attention given to the environment by the government has been satisfactory. |
Table A2.
Residential Satisfaction (RS).
Table A2.
Residential Satisfaction (RS).
| Pollution and Lack of Green Areas (reversed): |
| RS1. The air in the neighborhood is very clean. |
| RS2. There is not too much noise in the neighborhood. |
| RS3. The road in the neighborhood is clean. |
| RS4. There are many green areas in the neighborhood. |
| Non-punctual services: transportation: |
| RS5. The existing public transportation guarantees good connections with other parts of the city/town. |
| RS6. There is enough choice of public transportation in the neighborhood. |
| RS7. The buses in the area are often too inconvenient. |
| RS8. The buses in this neighborhood are not overcrowded. |
| Punctual commercial services: |
| RS9. This is a very commercial area, well-furnished with stores. |
| RS10. There are all kinds of stores in the neighborhood. |
| RS11. The neighborhood has a convenient local market. |
| RS12. The stores in the neighborhood are also meeting places for the inhabitants. |
| RS13. The majority of things could be bought in the stores in this neighborhood. |
| Lifestyle (opportunities): |
| RS14. This neighborhood is not only a dormitory. |
| RS15. Many things can be done in this neighborhood. |
| RS16. Young people tend to stay in this neighborhood. |
| RS17. It is a neighborhood with many points of interest. |
| RS18. It is easy to communicate and get information in the neighborhood. |
| RS19. There are many training programs in the neighborhood. |
| Adequacy of social and health services: |
| RS20. There is a hospital that can be easily reached from the neighborhood. |
| RS21. The local health office in this area offers better services compared with others. |
| RS22. The neighborhood is well-equipped for medical tests and outpatient services. |
| RS23. The neighborhood is well-furnished with social services. |
| RS24. The municipal offices in the area respond adequately to the needs of the neighborhood. |
| Adequacy of educational services: |
| RS25. The neighborhood schools are generally good. |
| RS26. Schools and nurseries in the neighborhood are often held in suitable places. |
| RS27. Children and young people in neighborhood schools live in the area. |
| Cultural-recreational services: |
| RS28. The already functioning cultural canters satisfy the needs of this neighborhood. |
| RS29. You can always find a place to spend free time in this neighborhood. |
| RS30. There are many social activities. |
| RS31. The existence of a meeting place would gather around many of the young people of the neighborhood. |
Table A3.
Place Attachment (PA).
Table A3.
Place Attachment (PA).
| Place Identity: |
| PA1. I strongly identify this neighborhood. |
| PA2. I feel commitment to this neighborhood. |
| PA3. I feel that I can really be myself in this neighborhood. |
| PA4. This neighborhood is very special to me. |
| Place Dependence: |
| PA5. I cannot leave this neighborhood. |
| PA6. I prefer this neighborhood over others for what I want. |
| PA7. This neighborhood is my favorite place to be. |
| PA8. This neighborhood is better than any other place. |
| Affective Attachment: |
| PA9. I really miss this neighborhood when I am away from it for too long. |
| PA10. This neighborhood means a lot to me. |
| PA11. I feel a strong sense of belonging to this neighborhood. |
| PA12. I have emotional attachment to this neighborhood. |
| Social Bonding: |
| PA13. I have a special connection to this neighborhood and the people here. |
| PA14. My friends/family would be disappointed if I were to move from this neighborhood. |
| PA15. If I were to leave this neighborhood, I would lose contact with a number of friends. |
| PA16. Many of my friends/family prefer this neighborhood over others. |
| PA17. I have friends/family in this neighborhood. |
References
- Adriaanse, C.C.M. Measuring residential satisfaction: A residential environmental satisfaction scale (RESS). Neth. J. Hous. Environ. Res. 2007, 22, 287–304. [Google Scholar] [CrossRef]
- Baba, Y.; Austin, D.M. Neighborhood environmental satisfaction, victimization, and social participation as determinants of perceived neighborhood safety. Environ. Behav. 1989, 21, 763–780. [Google Scholar] [CrossRef]
- Fernández-Portero, C.; Alarcón, D.; Padura, Á.B. Dwelling conditions and life satisfaction of older people through residential satisfaction. J. Environ. Psychol. 2017, 49, 1–7. [Google Scholar] [CrossRef]
- Amérigo, M.; Aragonés, J.I. A theoretical and methodological approach to the study of residential satisfaction. J. Environ. Psychol. 1997, 17, 47–57. [Google Scholar] [CrossRef]
- Canter, D. The Psychology of Place; Architectural Press: London, UK, 1977. [Google Scholar]
- Ren, L.; Wang, W.; Wang, J.; Liu, R. Analysis of energy consumption and carbon emission during the urbanization of Shandong Province, China. J. Clean. Prod. 2015, 103, 534–541. [Google Scholar] [CrossRef]
- Rioux, L.; Werner, C. Residential satisfaction among aging people living in place. J. Environ. Psychol. 2011, 31, 158–169. [Google Scholar] [CrossRef]
- Bonaiuto, M. Residential satisfaction and perceived urban quality. Encycl. Appl. Psychol. 2004, 3, 267–272. [Google Scholar]
- Bonaiuto, M.; Fornara, F.; Bonnes, M. Indexes of perceived residential environment quality and neighbourhood attachment in urban environments: A confirmation study on the city of Rome. Landsc. Urban Plan. 2003, 65, 41–52. [Google Scholar] [CrossRef]
- Kamp, I.V.; Leidelmeijer, K.; Marsman, G.; Hollander, A.D. Urban environmental quality and human well-being: Towards a conceptual framework and demarcation of concepts; a literature study. Landsc. Urban Plan. 2003, 65, 5–18. [Google Scholar] [CrossRef]
- Lu, M. Do people move when they say they will? Inconsistencies in individual migration behavior. Popul. Environ. 1999, 20, 467–488. [Google Scholar] [CrossRef]
- Pelletier, L.G.; Legault, L.R.; Tuson, K.M. The Environmental Satisfaction Scale A measure of satisfaction with local environmental conditions and government environmental policies. Environ. Behav. 1996, 28, 5–26. [Google Scholar] [CrossRef]
- Shin, J.-H. Toward a theory of environmental satisfaction and human comfort: A process-oriented and contextually sensitive theoretical framework. J. Environ. Psychol. 2016, 45, 11–21. [Google Scholar] [CrossRef]
- Evans, G.W.; Kantrowitz, E.; Eshelman, P. Housing quality and psychological well-being among the elderly population. J. Gerontol. Ser. B Psychol. Sci. Soc. Sci. 2002, 57, P381–P383. [Google Scholar] [CrossRef] [PubMed]
- Williams, D.R.; Vaske, J.J. The measurement of place attachment: Validity and generalizability of a psychometric approach. For. Sci. 2003, 49, 830–840. [Google Scholar]
- Yu, K.; Chen, N.C.; Chen, Z. Study on the relationships between perceived residential environment quality, place attachment, and environment satisfaction in rural and urban areas of China. In Proceedings of the Innovation and Growth Strategies in Marketing, Australian & New Zealand Marketing Academy Conference (ANZMAC), Sydney, Australia, 30 November–2 December 2015; pp. 1081–1087. [Google Scholar]
- He, C.; Ye, J. Lonely sunsets: Impacts of rural–urban migration on the left-behind elderly in rural China. Popul. Space Place 2014, 20, 352–369. [Google Scholar] [CrossRef]
- Fan, J.L.; Zhang, Y.J.; Wang, B. The impact of urbanization on residential energy consumption in China: An aggregated and disaggregated analysis. Renew. Sustain. Energy Rev. 2016, 75, 220–233. [Google Scholar] [CrossRef]
- Hubacek, K.; Guan, D.; Barrett, J.; Wiedmann, T. Environmental implications of urbanization and lifestyle change in China: Ecological and Water Footprints. J. Clean. Prod. 2009, 17, 1241–1248. [Google Scholar] [CrossRef]
- Huang, R.-J.; Zhang, Y.; Bozzetti, C.; Ho, K.-F.; Cao, J.-J.; Han, Y.; Daellenbach, K.R.; Slowik, J.G.; Platt, S.M.; Canonaco, F.; et al. High secondary aerosol contribution to particulate pollution during haze events in China. Nature 2014, 514, 218–222. [Google Scholar] [CrossRef]
- Ji, Y.; Hu, X.; Zhu, J.; Zhong, F. Demographic change and its impact on farmers’ field production decisions. China Econ. Rev. 2017, 43, 64–71. [Google Scholar] [CrossRef]
- Lovejoy, K.; Handy, S.; Mokhtarian, P. Neighborhood satisfaction in suburban versus traditional environments: An evaluation of contributing characteristics in eight California neighborhoods. Landsc. Urban Plan. 2010, 97, 37–48. [Google Scholar] [CrossRef]
- Ren, H.; Folmer, H. Determinants of residential satisfaction in urban china: A multi-group structural equation analysis. Urban Stud. 2017, 54, 1407–1425. [Google Scholar] [CrossRef]
- Bardo, J.W. The structure of community satisfaction. J. Soc. Psychol. 1984, 124, 151–157. [Google Scholar] [CrossRef]
- Lee, S.-W.; Ellis, C.D.; Kweon, B.-S.; Hong, S.-K. Relationship between landscape structure and neighborhood satisfaction in urbanized areas. Landsc. Urban Plan. 2008, 85, 60–70. [Google Scholar] [CrossRef]
- Jansen, S.J.T. The impact of the have-want discrepancy on residential satisfaction. J. Environ. Psychol. 2014, 40, 26–38. [Google Scholar] [CrossRef]
- Kahlmeier, S.; Schindler, C.; Grize, L.; Braun-Fahrländer, C. Perceived environmental housing quality and wellbeing of movers. J. Epidemiol. Community Health 2001, 55, 708–715. [Google Scholar] [CrossRef]
- Schreckenberg, D.; Griefahn, B.; Meis, M. The associations between noise sensitivity, reported physical and mental health, perceived environmental quality, and noise annoyance. Noise Health 2010, 12, 7. [Google Scholar] [CrossRef]
- Walton, D.; Murray, S.J.; Thomas, J.A. Relationships between population density and the perceived quality of neighbourhood. Soc. Indic. Res. 2008, 89, 405–420. [Google Scholar] [CrossRef]
- Craik, K.H.; Zube, E.H. The development of perceived environmental quality indices. In Perceiving Environmental Quality; Springer: Boston, MA, USA, 1976; pp. 3–20. [Google Scholar]
- Fornara, F.; Bonaiuto, M.; Bonnes, M. Cross-validation of abbreviated perceived residential environment quality (PREQ) and neighborhood attachment (NA) indicators. Environ. Behav. 2010, 42, 171–196. [Google Scholar] [CrossRef]
- Marans, R.W. Understanding environmental quality through quality of life studies: The 2001 DAS and its use of subjective and objective indicators. Landsc. Urban Plan. 2003, 65, 73–83. [Google Scholar] [CrossRef]
- Burinskienė, M.; Rudzkienė, V. Variability and the relationship between quality of life and real estate prices in Lithuania. Int. J. Environ. Pollut. 2007, 30, 501–517. [Google Scholar] [CrossRef]
- Lazauskaitė, D.; Burinskienė, M.; Podvezko, V. Subjectively and objectively integrated assessment of the quality indices of the suburban residential environment. Int. J. Strat. Prop. Manag. 2015, 19, 297–308. [Google Scholar] [CrossRef]
- Bonaiuto, M.; Aiello, A.; Perugini, M.; Bonnes, M.; Ercolani, A.P. Multidimensional perception of residential environment quality and neighbourhood attachment in the urban environment. J. Environ. Psychol. 1999, 19, 331–352. [Google Scholar] [CrossRef]
- Prester, G.; Rohrmann, B.; Schellhammer, E. Environmental evaluations and participation activities: A social psychological field study. J. Appl. Soc. Psychol. 1987, 17, 751–787. [Google Scholar] [CrossRef]
- Appleton, J. The Experience of Landscape; Wiley: London, UK, 1975. [Google Scholar]
- Herzog, T.R.; Kaplan, S.; Kaplan, R. The prediction of preference for unfamiliar urban places. Popul. Environ. 1982, 5, 43–59. [Google Scholar] [CrossRef]
- Kaplan, S. Aesthetics, affect and cognition: Environmental preference from an evolutionary perspective. Environ. Behav. 1987, 19, 3–32. [Google Scholar] [CrossRef]
- Kaplan, R. The nature of the view from home: Psychological benefits. Environ. Behav. 2001, 33, 507–542. [Google Scholar] [CrossRef]
- Kaplan, S.; Kaplan, R.; Wendt, J.S. Rated preference and complexity for natural and urban visual material. Percept. Psychophys. 1972, 12, 354–356. [Google Scholar] [CrossRef]
- Lamb, R.; Purcell, A. Perception of naturalness in landscape and its relationship to vegetation structure. Landsc. Urban Plan. 1990, 19, 333–352. [Google Scholar] [CrossRef]
- Purcell, A.T.; Lamb, R.J. Landscape perception: An examination and empirical investigation of two central issues in the area. J. Environ. Manag. 1984, 19, 31–63. [Google Scholar]
- Rohde, C.L.E.; Kendle, A.D. Human Well-Being, Natural Landscapes and Wildlife in Urban Areas; English Nature: Peterborough, UK, 1994. [Google Scholar]
- Ulrich, R.S. Visual landscape preference: A model and application. Man Environ. Syst. 1977, 7, 279–293. [Google Scholar]
- Ulrich, R.S. Aesthetic and affective response to natural environment. In Behavior and the Natural Environment; Springer: Boston, MA, USA, 1983; pp. 85–125. [Google Scholar]
- Zube, E.H.; Pitt, D.G.; Anderson, T.W. Perception and Measurement of Scenic Resources in the Southern Connecticut River Valley; Pub. No. R-74-1; Institute for Man and His Environment, University of Massachusetts: Amherst, MA, USA, 1974. [Google Scholar]
- Capaldi, C.A.; Dopko, R.L.; Zelenski, J.M. The relationship between nature connectedness and happiness: A meta-analysis. Front. Psychol. 2014, 5, 976. [Google Scholar] [CrossRef] [PubMed]
- Mayer, F.; Frantz, C.M. The connectedness to nature scale: A measure of individuals’ feeling in community with nature. J. Environ. Psychol. 2004, 24, 503–515. [Google Scholar] [CrossRef]
- Lankford, B.; Pringle, C.; Dickens, C.; Lewis, F.; Chhotray, V.; Mander, M. The Impacts of Ecosystem Services and Environmental Governance on Human Wellbeing in the Pongola Region, South Africa; Technical Report for the Natural Environment Research Council; University of East Anglia and Institute of Natural Resources: Norwich, UK; Pietermaritzburg, South Africa, 2010. [Google Scholar]
- Nilsson, A.; Schuitema, G.; Bergstad, C.J.; Martinsson, J.; Thorson, M. The road to acceptance: Attitude change before and after the implementation of a congestion tax. J. Environ. Psychol. 2016, 46, 1–9. [Google Scholar] [CrossRef]
- Eriksson, L.; Garvill, J.; Nordlund, A.M. Acceptability of travel demand management measures: The importance of problem awareness, personal norm, freedom, and fairness. J. Environ. Psychol. 2006, 26, 15–26. [Google Scholar] [CrossRef]
- Jakobsson, C.; Fujii, S.; Gärling, T. Effects of economic disincentives on private car use. Transportation 2002, 29, 349–370. [Google Scholar] [CrossRef]
- Biedenweg, K.; Scott, R.P.; Scott, T.A. How does engaging with nature relate to life satisfaction? Demonstrating the link between environment-specific social experiences and life satisfaction. J. Environ. Psychol. 2017, 50, 112–124. [Google Scholar] [CrossRef]
- Chen, N.C.; Dwyer, L. Residents’ place satisfaction and place attachment on destination brand-building behaviors: Conceptual and empirical differentiation. J. Travel Res. 2018, 57, 1026–1041. [Google Scholar] [CrossRef]
- Chen, N.C.; Dwyer, L.; Firth, T. Effect of dimensions of place attachment on residents’ word-of-mouth behavior. Tour. Geogr. 2014, 16, 826–843. [Google Scholar] [CrossRef]
- Chen, N.C.; Dwyer, L.; Firth, T. Factors influencing Chinese students’ behavior in promoting Australia as a destination for Chinese outbound travel. J. Travel Tour. Mark. 2015, 32, 366–381. [Google Scholar] [CrossRef]
- Lewicka, M. Ways to make people active: The role of place attachment, cultural capital, and neighborhood ties. J. Environ. Psychol. 2005, 25, 381–395. [Google Scholar] [CrossRef]
- Lewicka, M. Place attachment, place identity, and place memory: Restoring the forgotten city past. J. Environ. Psychol. 2008, 28, 209–231. [Google Scholar] [CrossRef]
- Lewicka, M. Place attachment: How far have we come in the last 40 years? J. Environ. Psychol. 2011, 31, 207–230. [Google Scholar]
- Kyle, G.; Graefe, A.; Manning, R. Testing the dimensionality of place attachment in recreational settings. Environ. Behav. 2005, 37, 153–177. [Google Scholar] [CrossRef]
- Chen, N.C.; Dwyer, L.; Firth, T. Conceptualisation and measurement of the dimensionality of place attachment. Tour. Anal. 2014, 19, 323–338. [Google Scholar] [CrossRef]
- Ashforth, B.E.; Harrison, S.H.; Corley, K.G. Identification in organizations: An examination of four fundamental questions. J. Manag. 2008, 34, 325–374. [Google Scholar]
- Jorgensen, B.S.; Stedman, R.C. Sense of place as an attitude: Lakeshore owners’ attitudes toward their properties. J. Environ. Psychol. 2001, 21, 233–248. [Google Scholar]
- Altman, I.; Low, S.M. Place Attachment; Plenum Press: New York, NY, USA, 1992. [Google Scholar]
- Giuliani, M.V. Theory of attachment and place attachment. In Psychological Theories for Environmental Issues; Bonnes, M., Lee, T., Bonaiuto, M., Eds.; Ashgate: Aldershot, UK, 2003; pp. 137–170. [Google Scholar]
- Mesch, G.S.; Manor, O. Social ties, environmental perception, and local attachment. Environ. Behav. 1998, 30, 504–519. [Google Scholar] [CrossRef]
- Stedman, R.C. Toward a social psychology of place. Environ. Behav. 2002, 34, 561–581. [Google Scholar]
- Walker, A.J.; Ryan, R.L. Place attachment and landscape preservation in rural New England: A Maine case study. Landsc. Urban Plan. 2008, 86, 141–152. [Google Scholar]
- Stokols, D.; Shumaker, S.A. People in places: A transactional view of settings. In Cognition, Social Behavior, and the Environment; Harvey, J.H., Ed.; Erlbaum: Hillsdale, NJ, USA, 1981; pp. 441–488. [Google Scholar]
- Sam, N.; Bayram, N.; Bilgel, N. The perception of residential environment quality and neighbourhood attachment in a metropolitan city: A study on Bursa, Turkey. Can. J. Humanit. Soc. Sci. 2012, 1, 22–39. [Google Scholar]
- Beyer, A.; Kamin, S.T.; Lang, F.R. Housing in old age: Dynamical interactions between neighborhood attachment, neighbor annoyance, and residential satisfaction. J. Hous. Elder. 2017, 31, 382–393. [Google Scholar] [CrossRef]
- Casakin, H.; Reizer, A. Place attachment, residential satisfaction, and life satisfaction: Traditional and renewed kibbutz. J. Hum. Behav. Soc. Environ. 2017, 44, 639–655. [Google Scholar] [CrossRef]
- Kyle, G.T.; Mowen, A.J.; Tarrant, M. Linking place preferences with place meaning: An examination of the relationship between place motivation and place attachment. J. Environ. Psychol. 2004, 24, 439–454. [Google Scholar] [CrossRef]
- Hwang, S.-N.; Lee, C.; Chen, H.-J. The relationship among tourists’ involvement, place attachment and interpretation satisfaction in Taiwan’s national parks. Tour. Manag. 2005, 26, 143–156. [Google Scholar] [CrossRef]
- Prayag, G.; Ryan, C. Antecedents of tourists’ loyalty to Mauritius: The role and influence of destination image, place attachment, personal involvement, and satisfaction. J. Travel Res. 2012, 51, 342–356. [Google Scholar] [CrossRef]
- Yüksel, A.; Yüksel, F.; Bilim, Y. Destination attachment: Effects on customer satisfaction and cognitive, affective and conative loyalty. Tour. Manag. 2010, 31, 274–284. [Google Scholar] [CrossRef]
- Moser, G. Quality of life and sustainability: Toward person–environment congruity. J. Environ. Psychol. 2009, 29, 351–357. [Google Scholar] [CrossRef]
- Öztürk, S.; Bozdoğan, E. Determination of the perceived quality of urban life in new and traditional housing textures. Fresen. Environ. Bull. 2014, 23, 2415–2421. [Google Scholar]
- McCrea, R.; Shyy, T.K.; Stimson, R.J. Satisfied residents in different types of local areas: Measuring what’s most important. Soc. Indic. Res. 2014, 118, 87–101. [Google Scholar] [CrossRef]
- National Bureau of Statistics of China. China Statistical Year Book; China Statistics Press: Beijing, China, 2018. [Google Scholar]
- Olawuni, P.; Daramola, O. Exploring residential characteristics as determinants of environmental sanitation behavior in Ibadan, Nigeria. Environ. Pract. 2017, 19, 16–25. [Google Scholar] [CrossRef]
- Sun, Z.; Li, J. Citizens’ satisfaction with air quality and key factors in China—Using the anchoring vignettes method. Sustainability 2019, 11, 2206. [Google Scholar] [CrossRef]
- Wang, Z.; Mei, F. Environmental satisfaction and environmentally responsible behavior research: A case study on Shenzhen Coastal Ecological Park. Beijing Da Xue Xue Bao 2018, 54, 1303–1310. [Google Scholar]
- Henseler, J.; Ringle, C.M.; Sinkovics, R.R. The use of partial least squares path modeling in international marketing. Adv. Int. Mark. 2009, 20, 277–319. [Google Scholar]
- Fornell, C.; Larcker, D.F. Structural equation models with unobservable variables and measurement error: Algebra and statistics. J. Mark. Res. 1981, 18, 382–388. [Google Scholar] [CrossRef]
- Chin, W.W. The partial least squares approach to structural equation modeling. In Modern Methods for Business Research; Marcoulides, G.A., Ed.; Mahwah-Lawrence Erlbaum Associates, Inc.: New York, NY, USA, 1998; Volume 295, pp. 295–336. [Google Scholar]
- Hair, J.F.; Ringle, C.M.; Sarstedt, M. PLS-SEM: Indeed a silver bullet. J. Mark. Theory Pract. 2011, 19, 139–152. [Google Scholar] [CrossRef]
- Matzler, K.; Strobl, A.; Stokburger-Sauer, N.; Bobovnicky, A.; Bauer, F. Brand personality and culture: The role of cultural differences on the impact of brand personality perceptions on tourists’ visit intentions. Tour. Manag. 2016, 52, 507–520. [Google Scholar] [CrossRef]
- Hair, J.F.; Sarstedt, M.; Ringle, C.M.; Mena, J.A. An assessment of the use of partial least squares structural equation modeling in marketing research. J. Acad. Mark. Sci. 2012, 40, 414–433. [Google Scholar] [CrossRef]
- Cohen, J. A power primer. Psychol. Bull. 1992, 112, 155–159. [Google Scholar] [CrossRef]
- Hair, J.F.; Hult, G.T.M.; Ringle, C.M.; Sarstedt, M. A Primer on Partial Least Squares Structural Equation Modeling (PLS-SEM); Sage Publications: Thousand Oaks, CA, USA, 2016. [Google Scholar]
- Hair, J.F.; Sarstedt, M.; Hopkins, L.; Kuppelwieser, V.G. Partial least squares structural equation modeling (PLS-SEM) An emerging tool in business research. Eur. Bus. Rev. 2014, 26, 106–121. [Google Scholar] [CrossRef]
- MacKinnon, D.P.; Lockwood, C.M.; Hoffman, J.M.; West, S.G.; Sheets, V. A comparison of methods to test mediation and other intervening variable effects. Psychol. Methods 2002, 7, 83–104. [Google Scholar] [CrossRef]
- Zhao, X.; Lynch, J.G.; Chen, Q. Reconsidering Baron and Kenny: Myths and truths about mediation analysis. J. Consum. Res. 2010, 37, 197–206. [Google Scholar] [CrossRef]
- Hair, J.F.; Sarstedt, M.; Ringle, C.M.; Gudergan, S.P. Advanced Issues in Partial Least Squares Structural Equation Modeling (PLS-SEM); Sage: Thousand Oaks, CA, USA, 2018. [Google Scholar]
- Henseler, J.; Ringle, C.M.; Sarstedt, M. Testing measurement invariance of composites using partial least squares. Int. Mark. Rev. 2016, 33, 405–431. [Google Scholar] [CrossRef]
- Dibbern, J.; Chin, W.W. Multi-group comparison: Testing a PLS model on the sourcing of application software services across Germany and the USA using a permutation based algorithm. In Handbuch PLS-Pfadmodellierung: Methode, Anwendung, Praxisbeispiele; Schäffer-Poeschel: Stuttgart, Germany, 2005; pp. 135–160. [Google Scholar]
- Sarstedt, M.; Henseler, J.; Ringle, C.M. Multigroup analysis in Partial Least Squares (PLS) path modeling: Alternative methods and empirical results. Adv. Int. Mark. 2011, 22, 195–218. [Google Scholar]
- Cao, G.Y.; Chen, G.; Pang, L.H.; Zheng, X.Y.; Nilsson, S. Urban growth in China: Past, prospect, and its impacts. Popul. Environ. 2012, 33, 137–160. [Google Scholar] [CrossRef]
- Fischer, G.; Winiwarter, W.; Cao, G.Y.; Ermolieva, T.; Hizsnyik, E.; Klimont, Z.; Wilberg, D.; Zheng, X.Y. Implications of population growth and urbanization on agricultural risks in China. Popul. Environ. 2012, 33, 243–258. [Google Scholar] [CrossRef]
- Strandell, A.; Hall, C.M. Impact of the residential environment on second home use in Finland—Testing the compensation hypothesis. Landsc. Urban Plan. 2015, 133, 12–23. [Google Scholar] [CrossRef]
- Chen, W.; Yin, X.; Zhang, H. Towards low carbon development in China: A comparison of national and global models. Clim. Chang. 2016, 136, 95–108. [Google Scholar] [CrossRef]
- Barcus, H.R.; Brunn, S.D. Place elasticity: Exploring a new conceptualization of mobility and place attachment in rural America. Geogr. Ann. 2011, 92, 281–295. [Google Scholar] [CrossRef]
- Brown, B.; Perkins, D.D.; Brown, G. Place attachment in a revitalizing neighborhood: Individual and block levels of analysis. J. Environ. Psychol. 2003, 23, 259–271. [Google Scholar] [CrossRef]

© 2019 by the authors. Licensee MDPI, Basel, Switzerland. This article is an open access article distributed under the terms and conditions of the Creative Commons Attribution (CC BY) license (http://creativecommons.org/licenses/by/4.0/).