Sustainability of Urban Development with Population Decline in Different Policy Scenarios: A Case Study of Northeast China

Abstract
1. Introduction
2. Urban Shrinkage and Sustainable Development
3. Materials and Methods
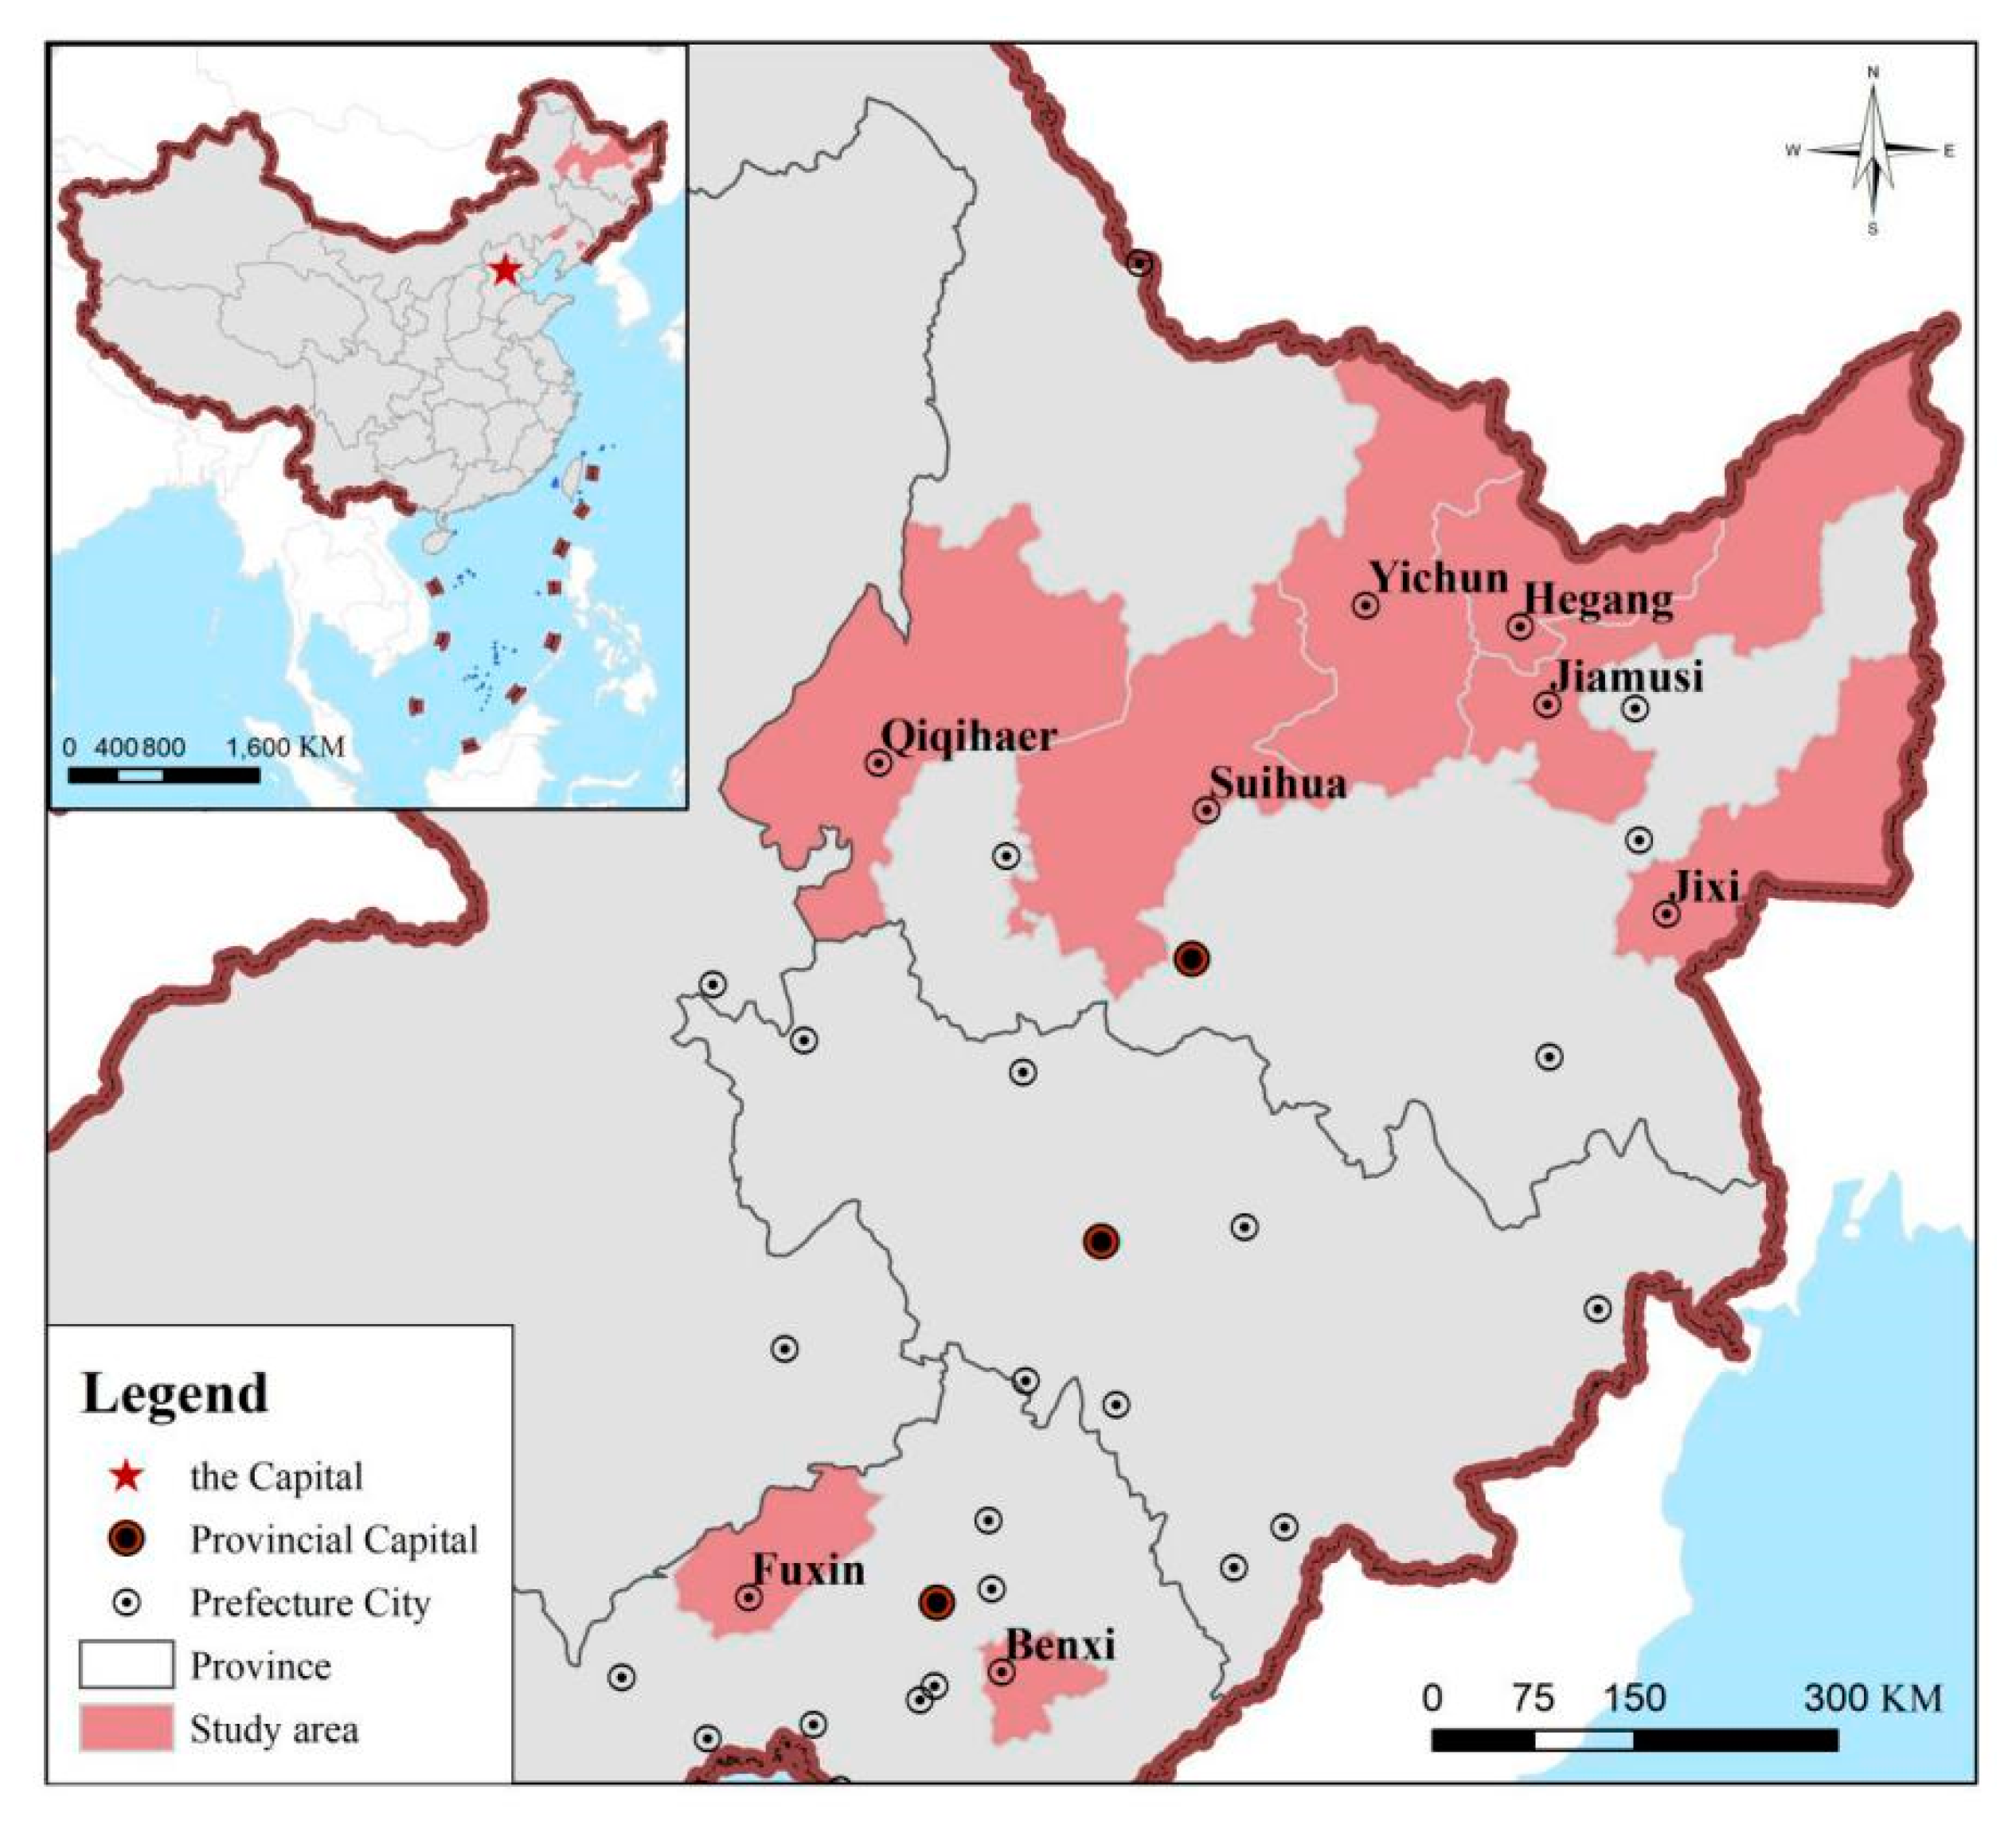
3.1. Study Area and Data
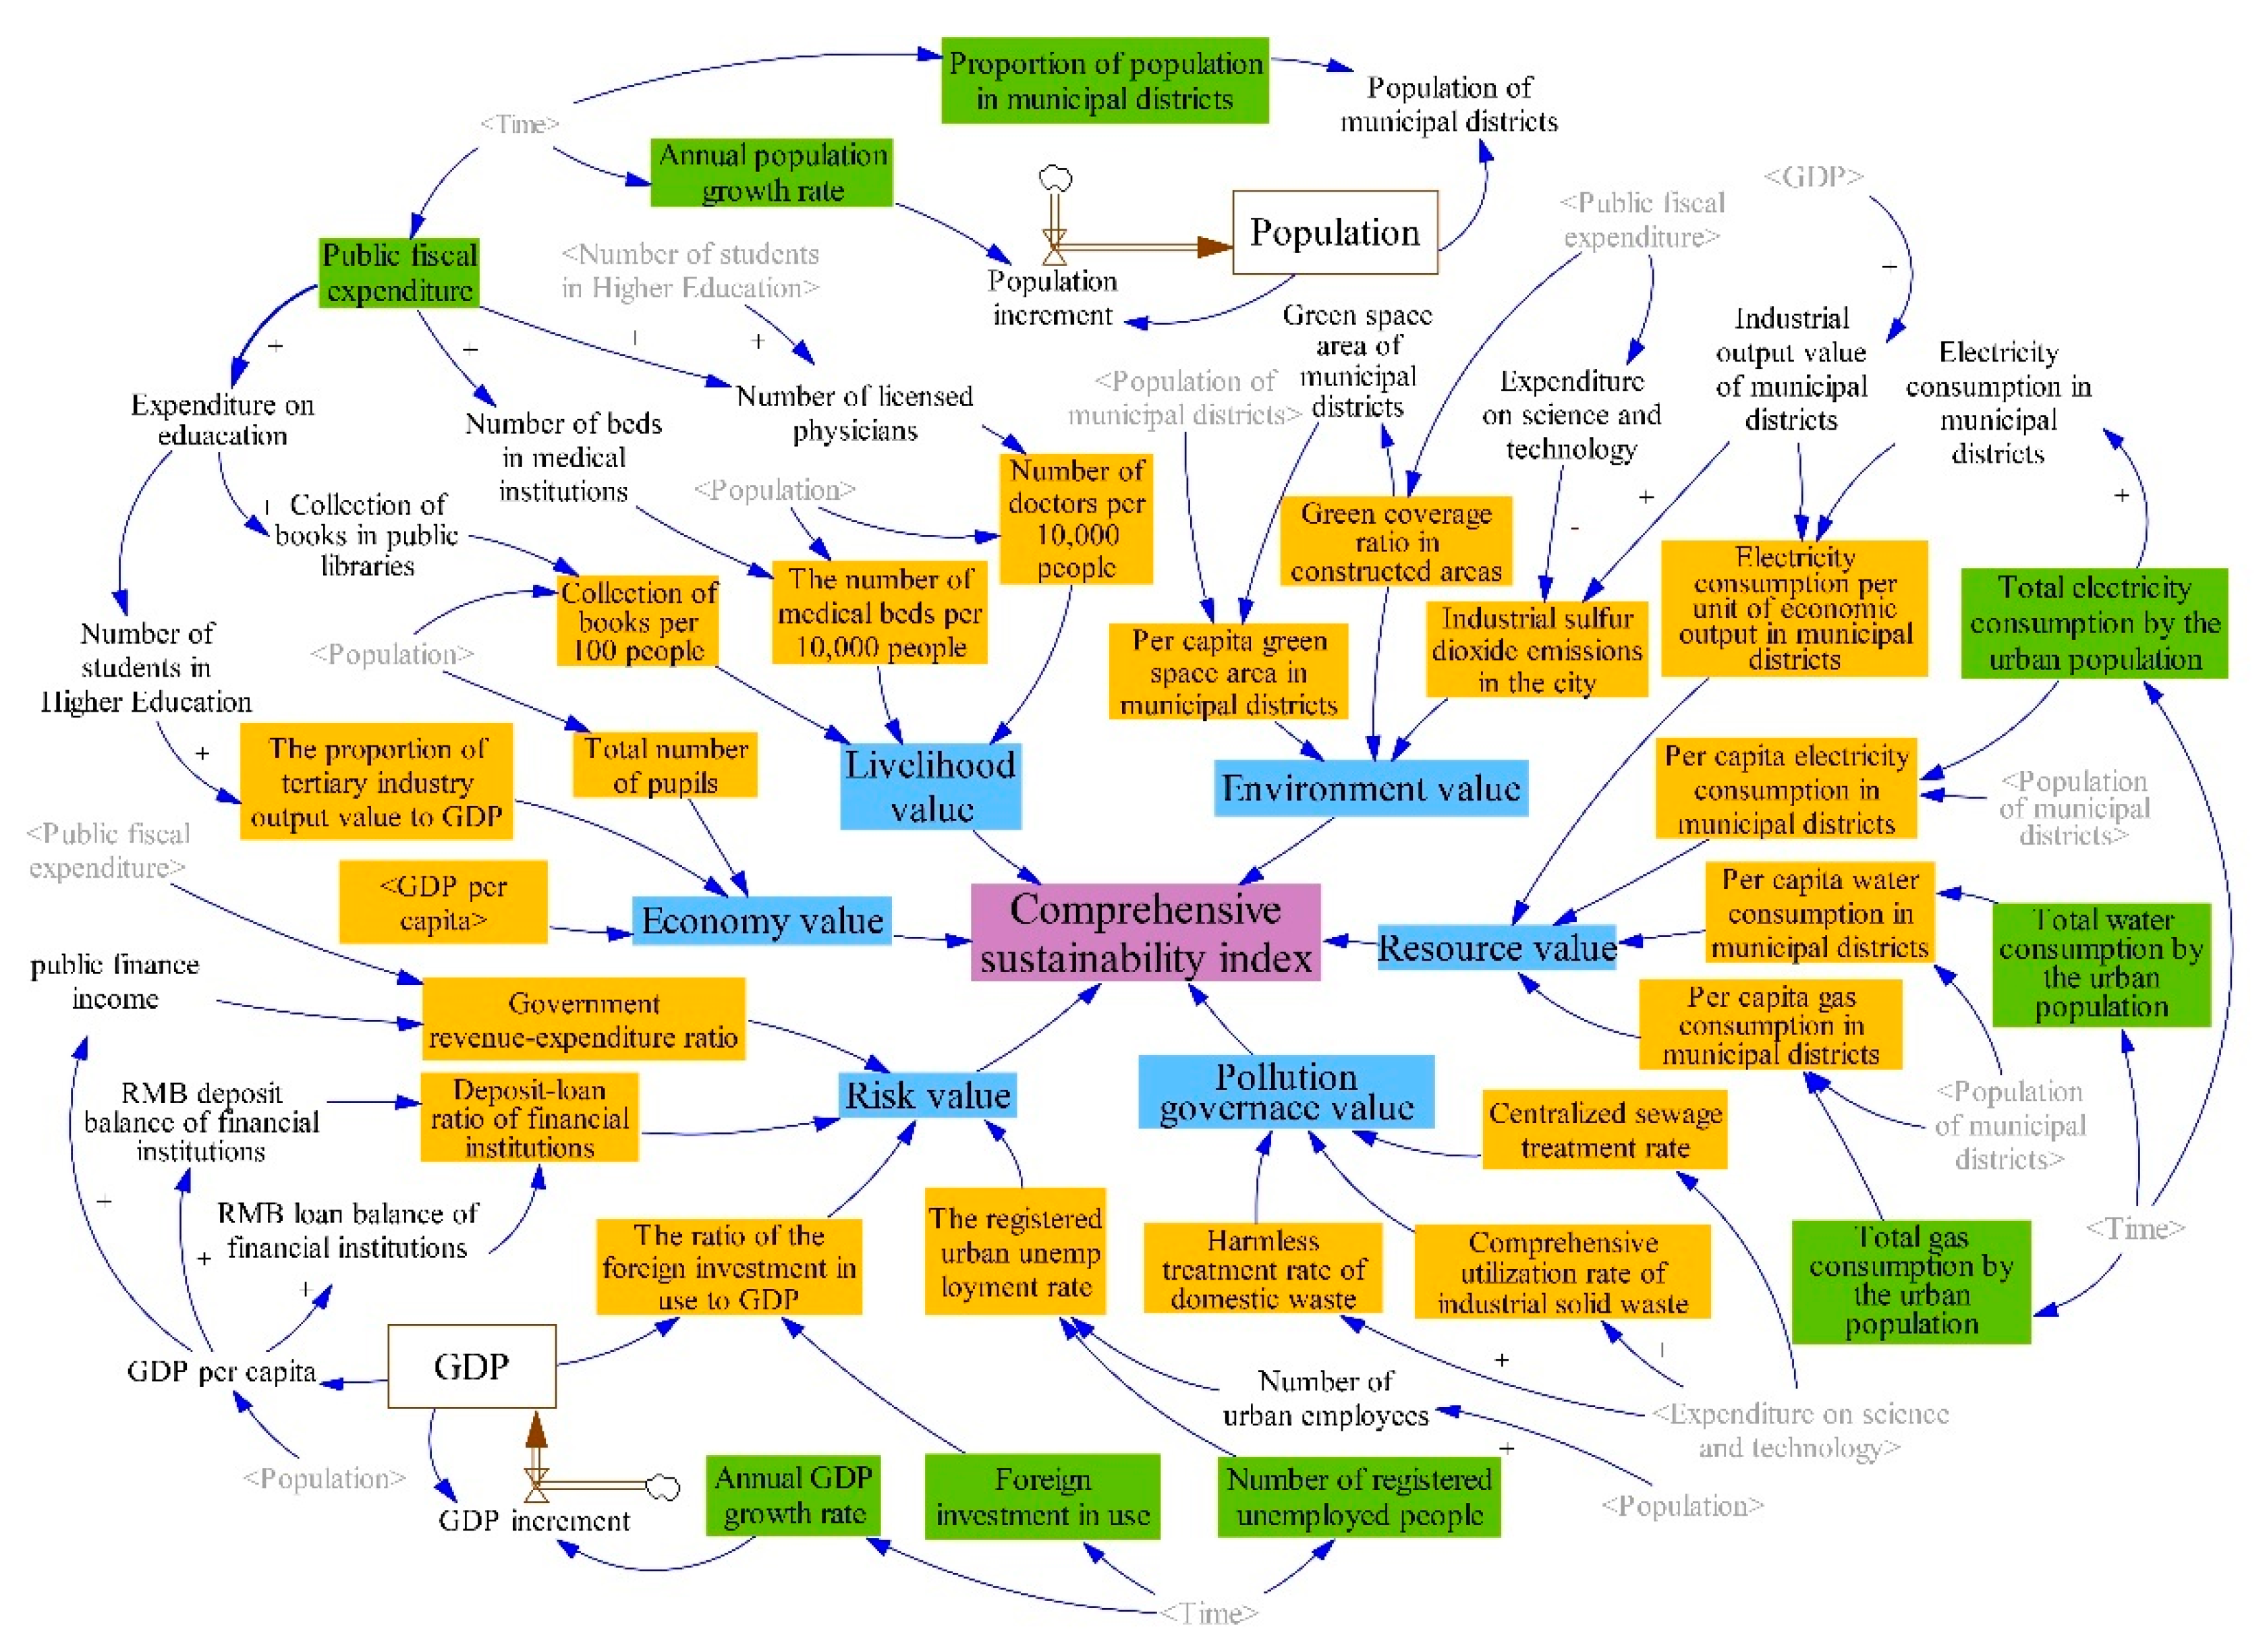
3.2. A System Dynamics Based Model
3.3. Scenario Analysis
4. Results
4.1. Accuracy Validation
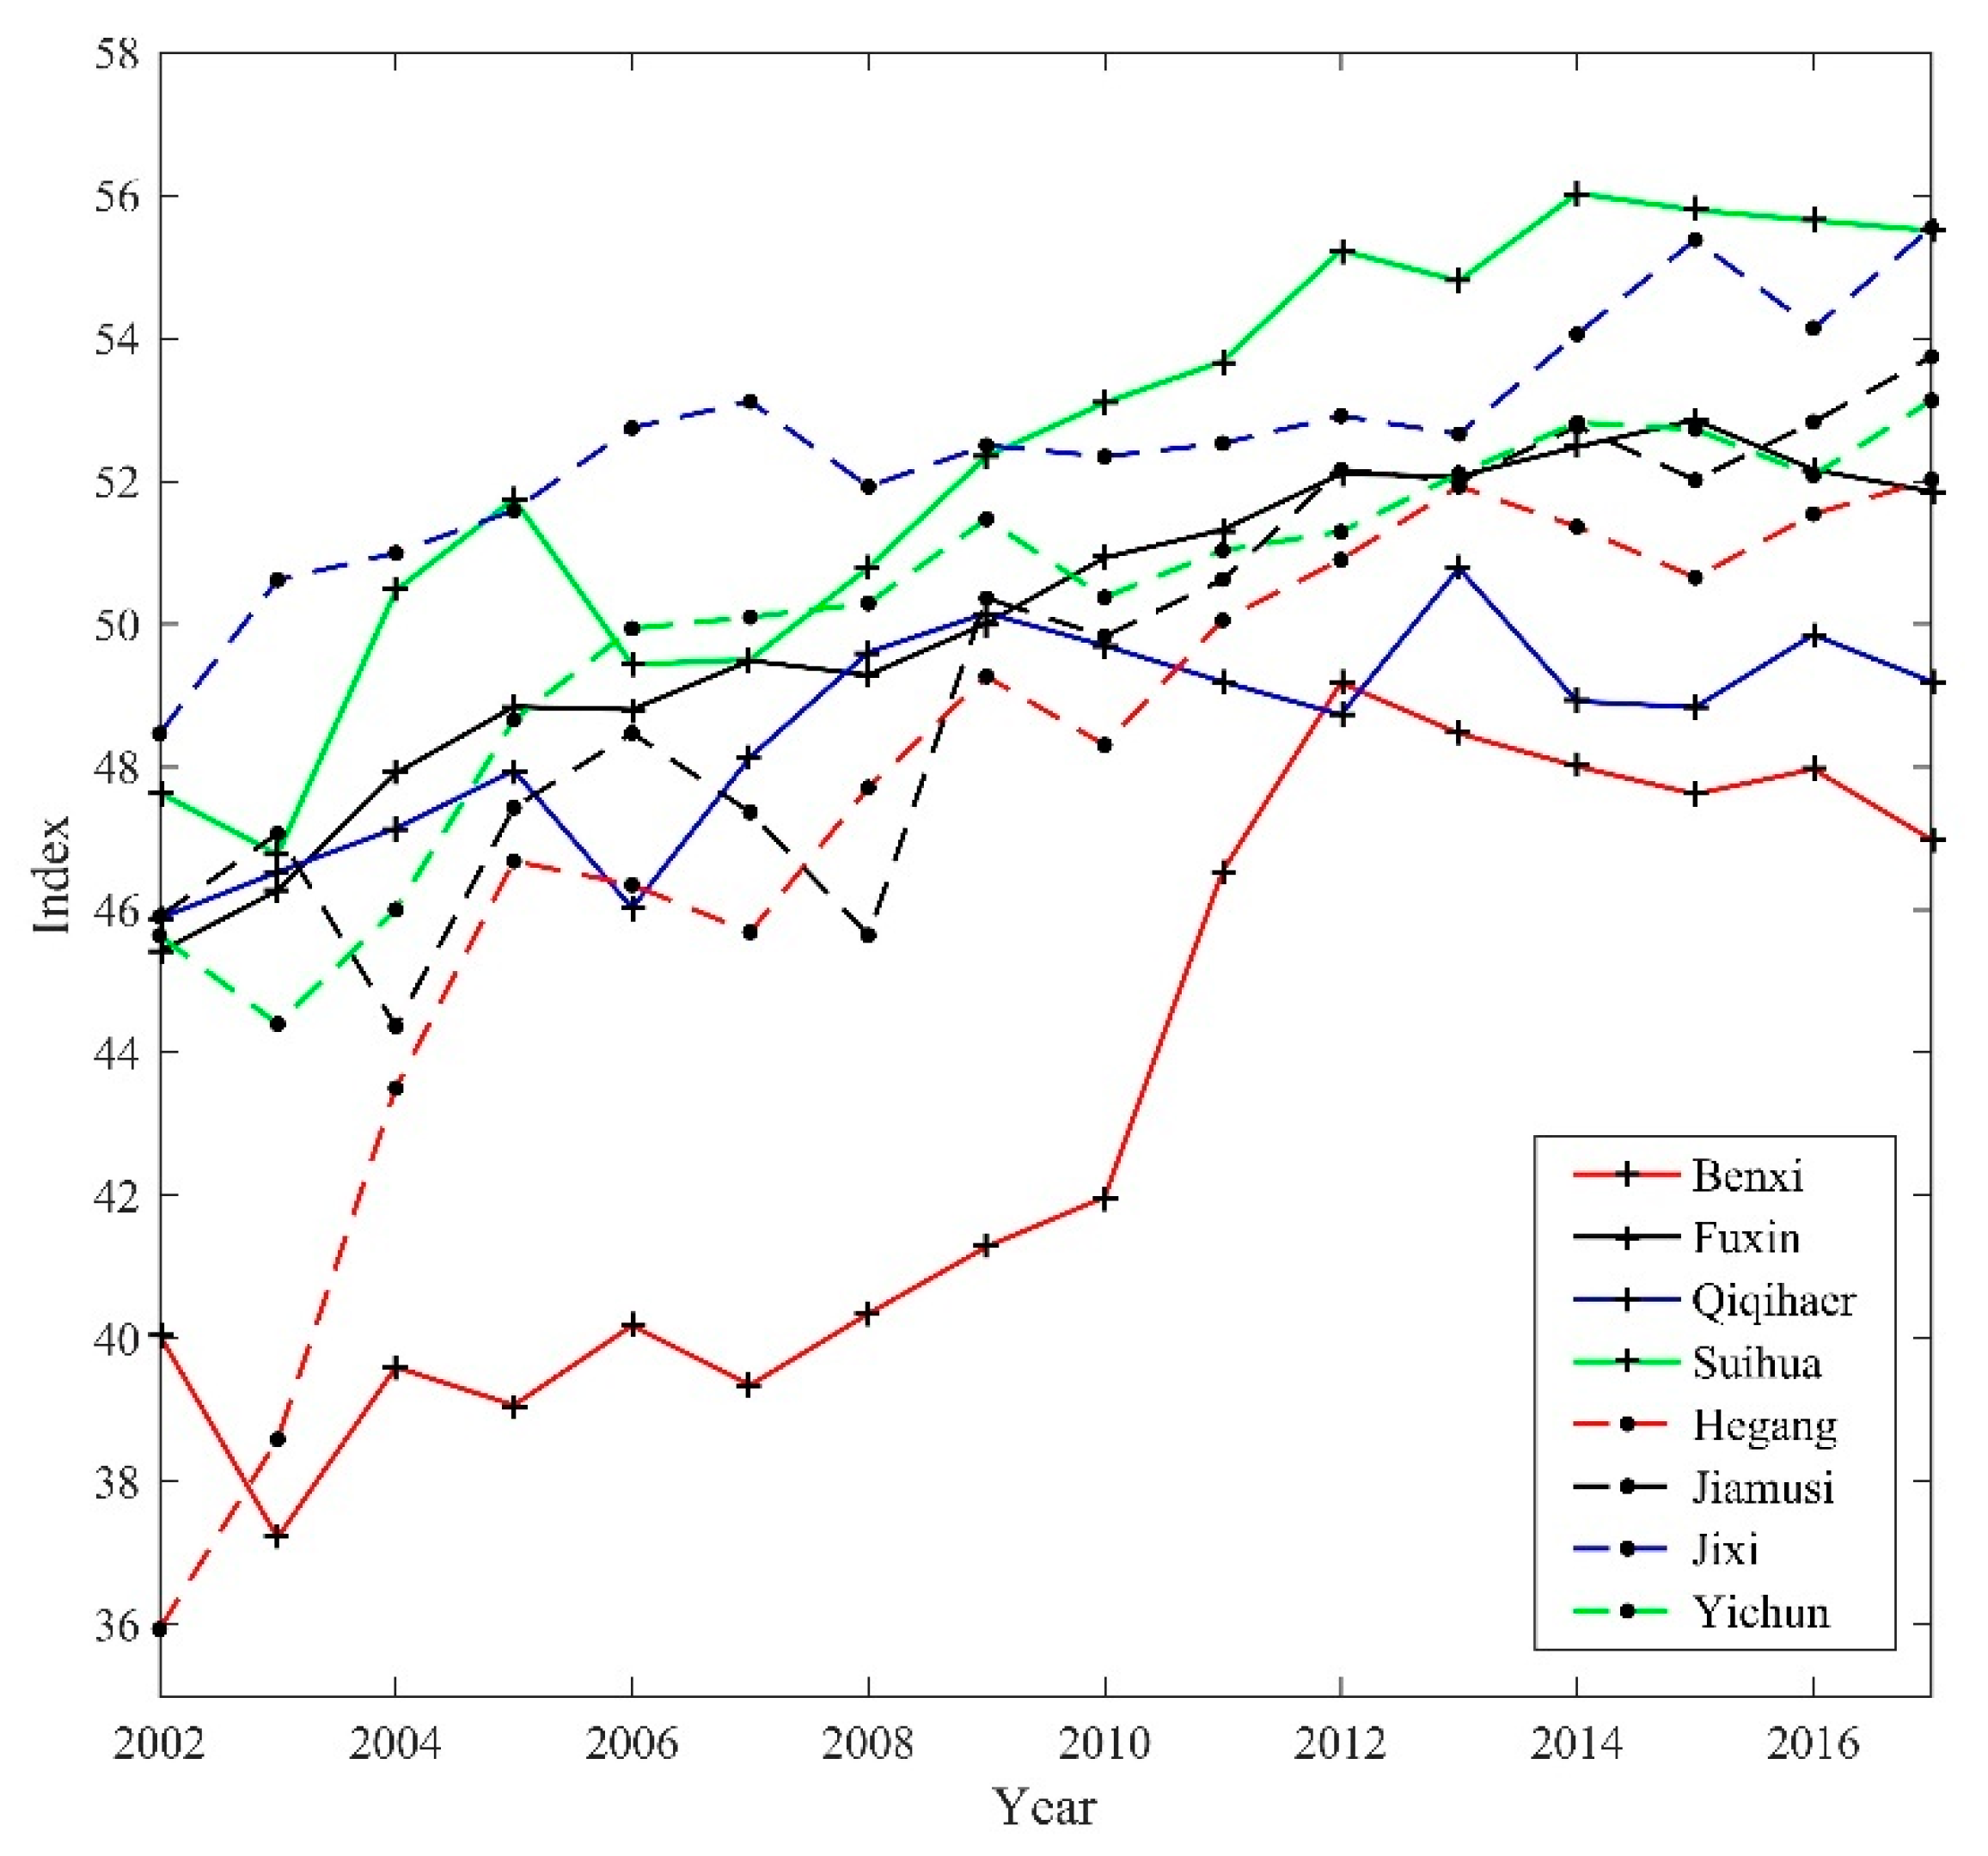
4.2. Historical Trends in the Development of Sustainability in Shrinking Cities
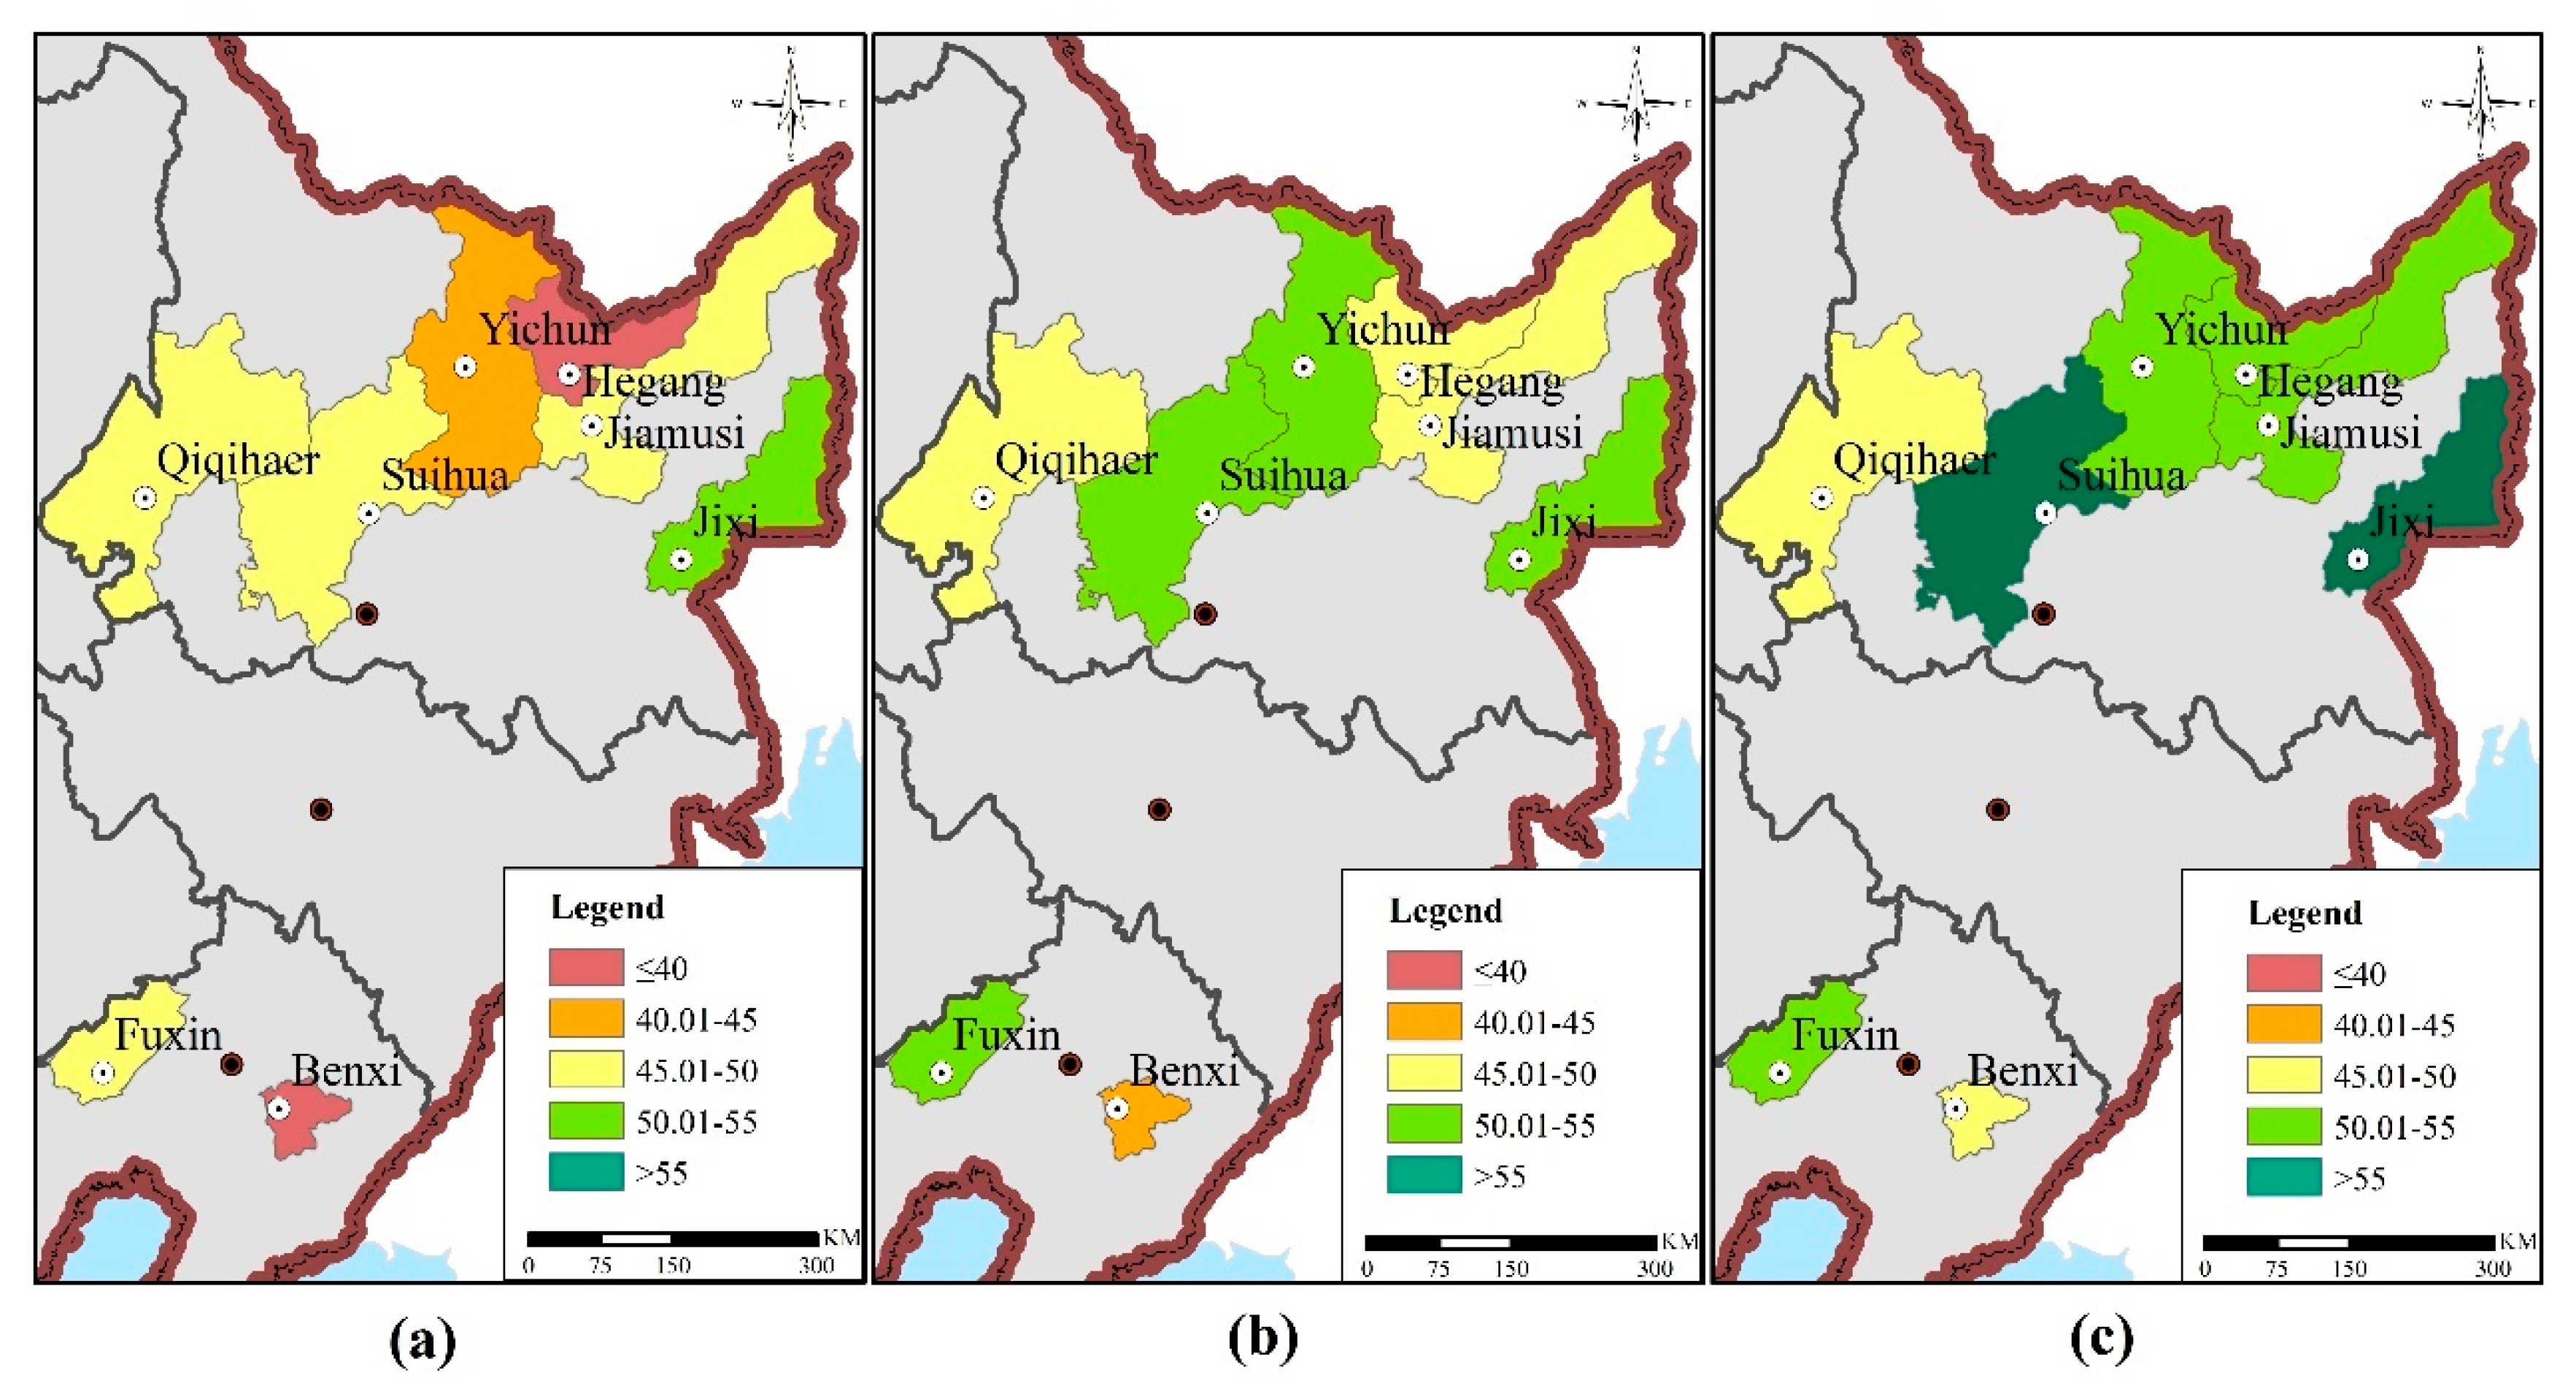
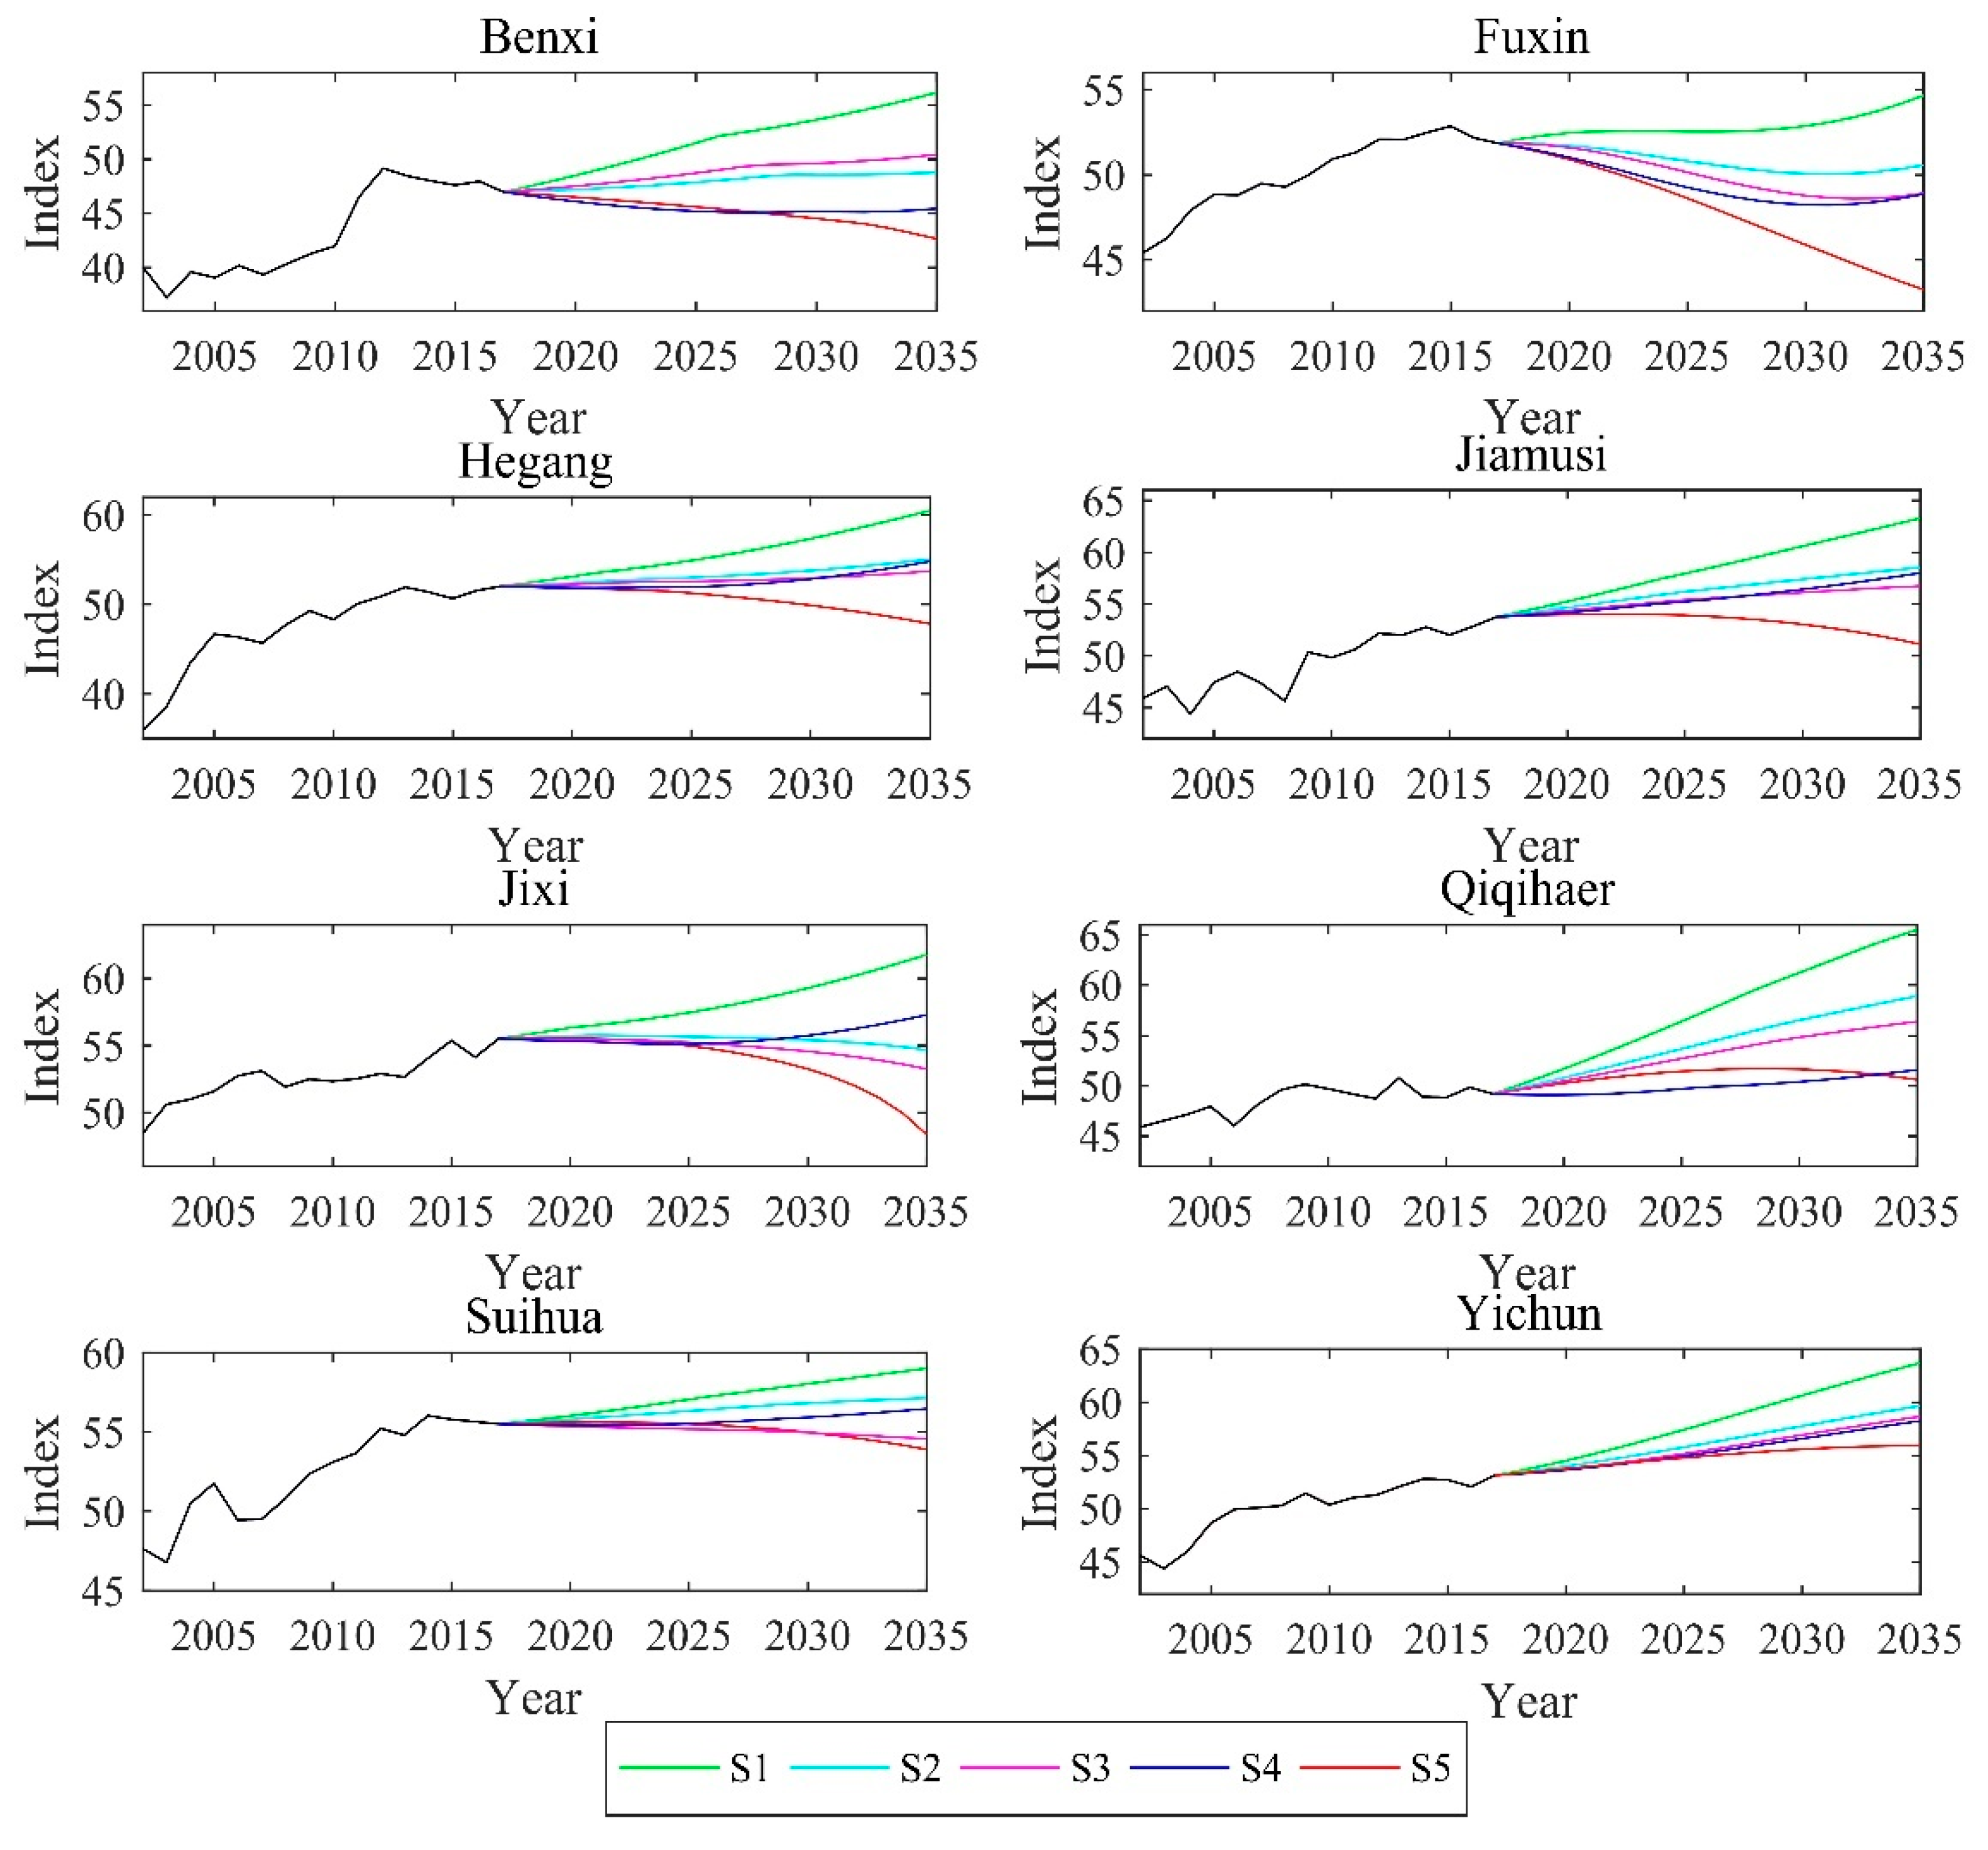
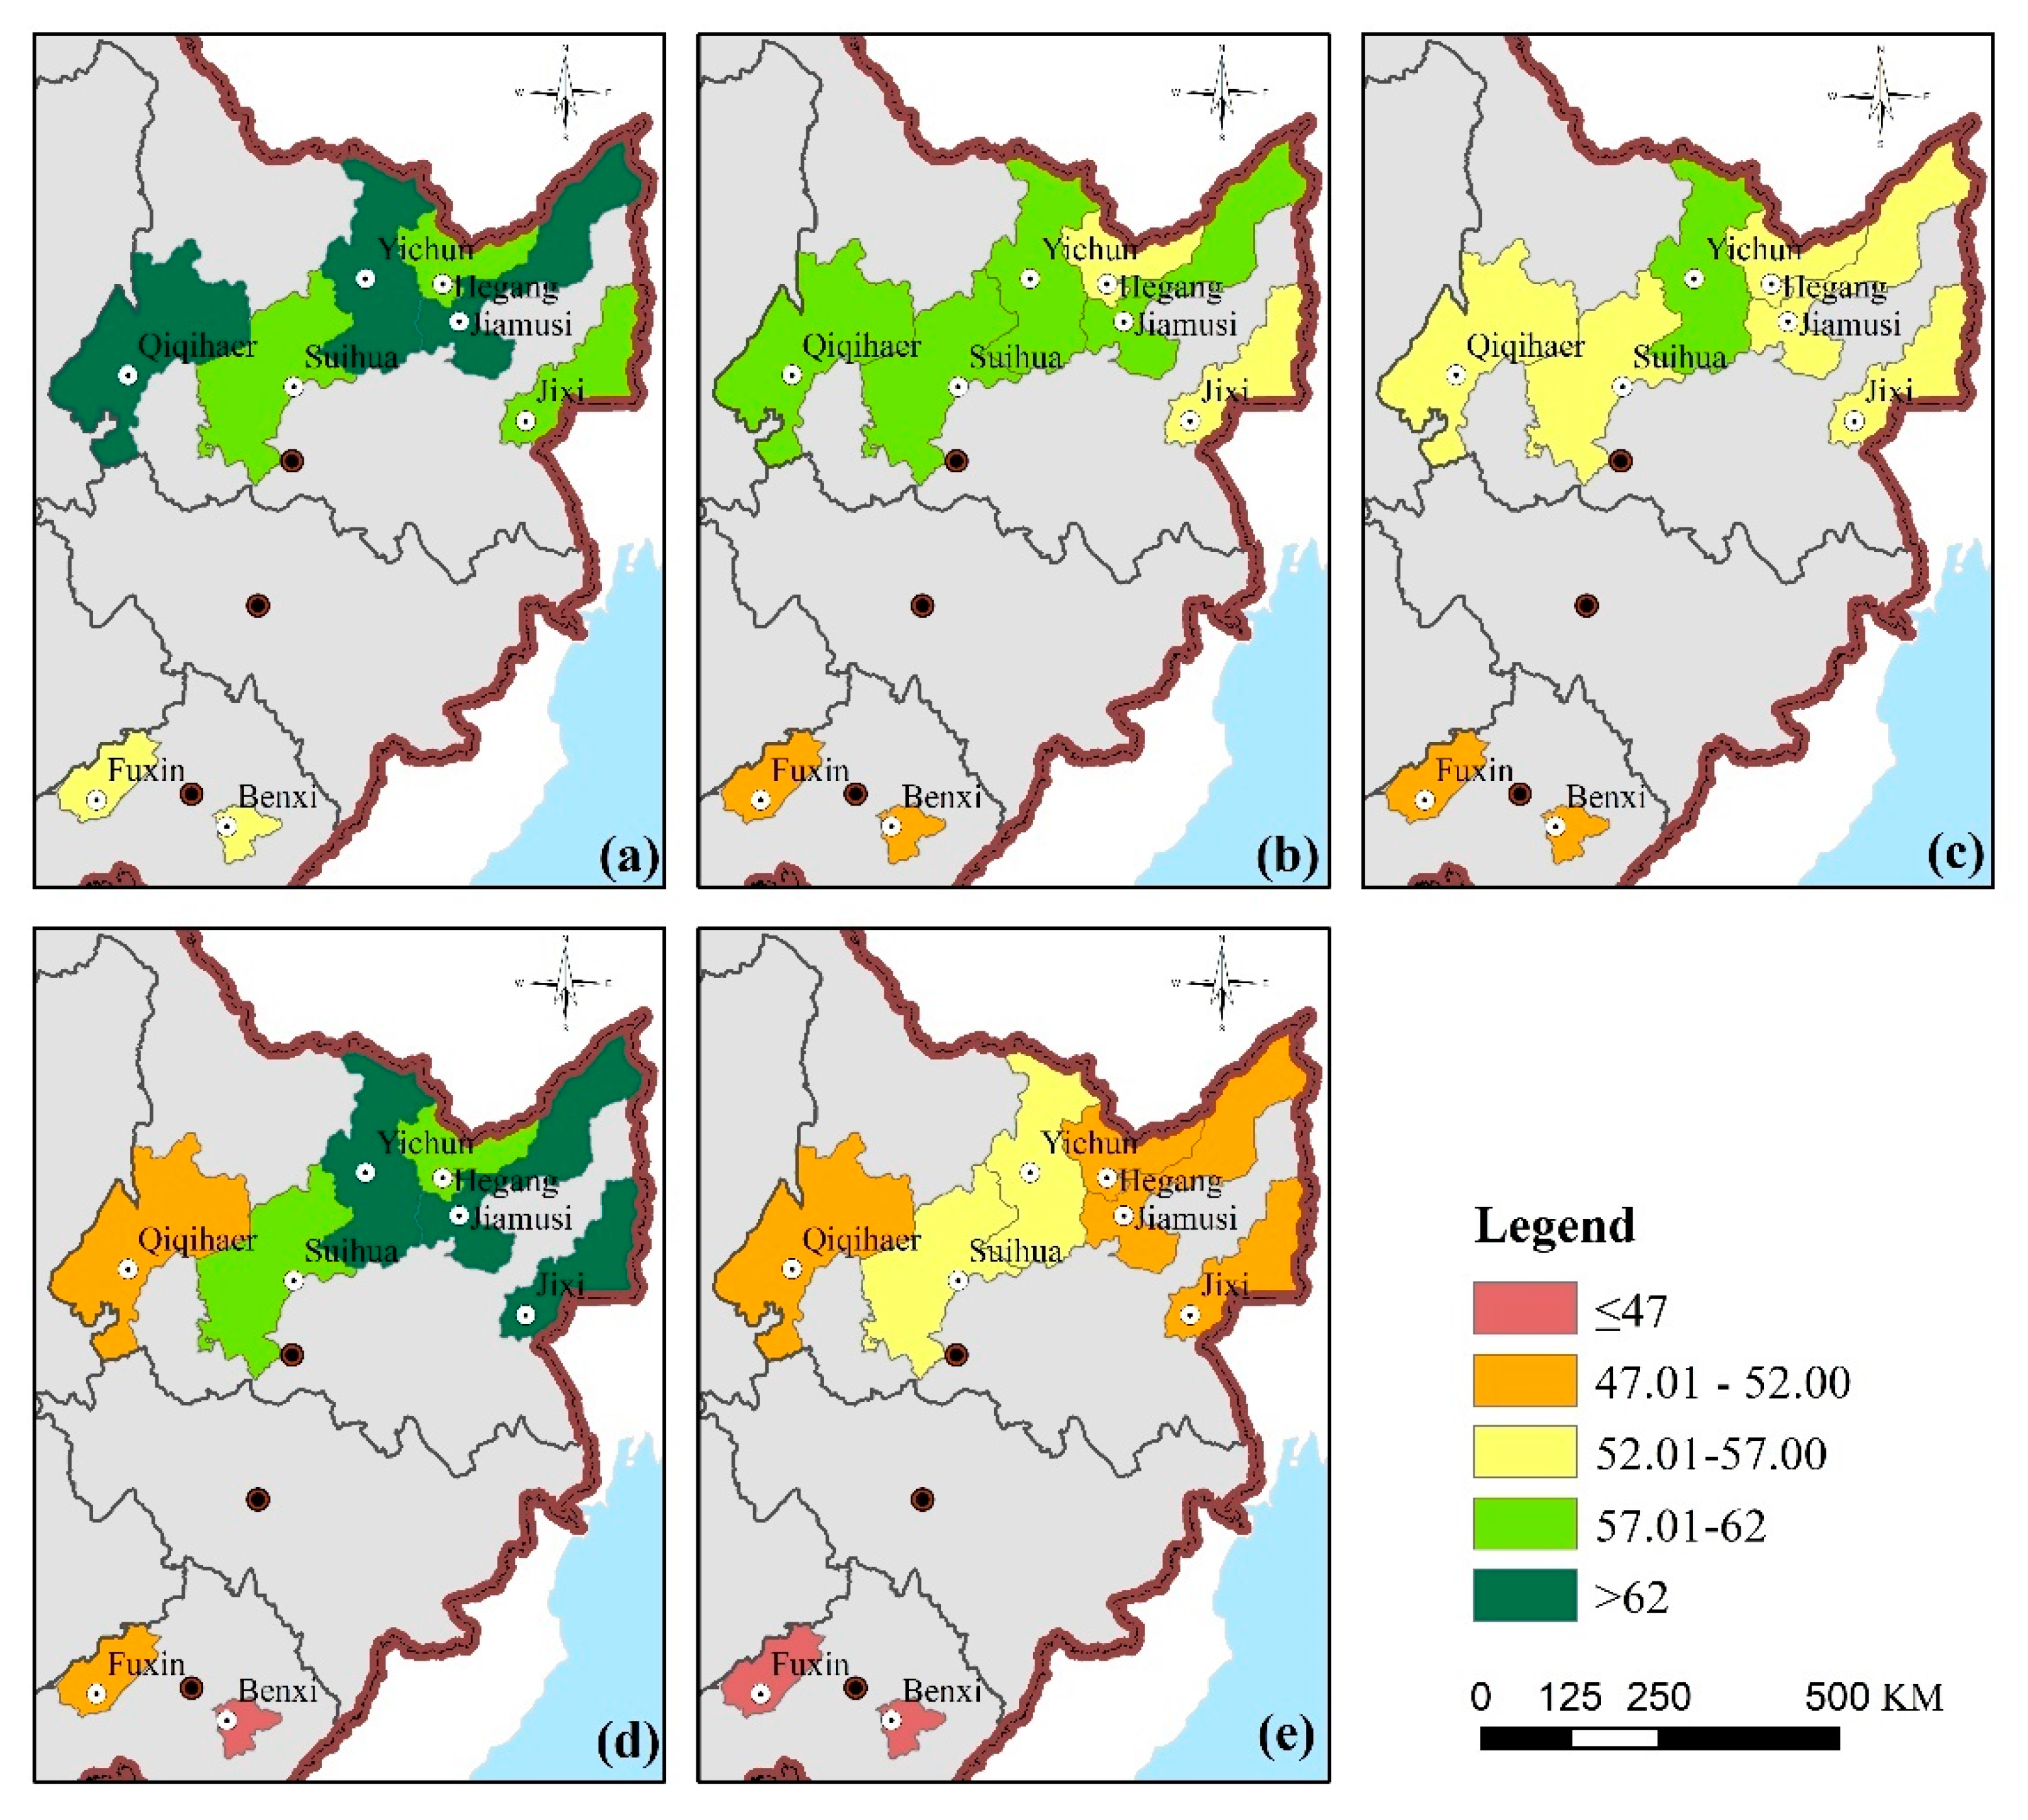
4.3. Analyzing the Trend of Shrinking Cities’ Sustainability in Difference Scenarios
5. Discussion
6. Conclusions
Supplementary Materials
Funding
Acknowledgments
Conflicts of Interest
References
- Martinez-Fernandez, C.; Weyman, T.; Fol, S.; Audirac, I.; Cunningham-Sabot, E.l.; Wiechmann, T.; Yahagi, H. Shrinking cities in Australia, Japan, Europe and the USA: From a global process to local policy responses. Prog. Plan. 2016, 105, 1–48. [Google Scholar] [CrossRef]
- Nakicenovic, N.; Lempert, R.J.; Janetos, A.C. A Framework for the Development of New Socio-Economic Scenarios for Climate Change Research: Introductory Essay. Clim. Chang. 2014, 122, 351–361. [Google Scholar] [CrossRef]
- van Vuuren, D.P.; Kriegler, E.; O’Neill, B.C.; Ebi, K.L.; Riahi, K.; Carter, T.R.; Edmonds, J.; Hallegatte, S.; Kram, T.; Mathur, R.; et al. A new scenario framework for Climate Change Research: Scenario matrix architecture. Clim. Chang. 2014, 122, 373–386. [Google Scholar] [CrossRef]
- Wu, K.; Sun, D.Q. Progress in Urban Shrinkage Research. Econ. Geogr. 2017, 37, 59–67. [Google Scholar]
- Morckel, V.C. Design after decline: How America rebuilds shrinking cities. J. Plan. Lit. 2013, 28, 32–33. [Google Scholar] [CrossRef]
- Yang, Z. Tools for Helping Comprehend Ageing China. Environ. Plan. A 2016, 48, 1211–1213. [Google Scholar] [CrossRef]
- Yang, Z.; Dunford, M. City shrinkage in China: An analysis of scalar processes of urban and Hukou population losses. Reg. Stud. 2018, 52, 1111–1121. [Google Scholar] [CrossRef]
- Akers, J.M. Making Markets: Think Tank Legislation and Private Property in Detroit. Urban Geogr. 2013, 34, 1070–1095. [Google Scholar] [CrossRef]
- Hollander, J.B.; Meth, J.N. The bounds of smart decline: A foundational theory for planning shrinking cities. Hous. Policy Debate 2011, 21, 349–367. [Google Scholar] [CrossRef]
- Huang, H. Smart Decline: Planning Measures for Urban Decay and Its Practice in US. J. Urban Reg. Plan. 2017, 9, 164. [Google Scholar]
- Bernt, M. Partnerships for Demolition: The Governance of Urban Renewal in East Germany’s Shrinking Cities. Int. J. Urban Reg. Res. 2009, 33, 754–769. [Google Scholar] [CrossRef]
- Hollander, J.B. Can a City Successfully Shrink? Evidence from Survey Data on Neighborhood Quality. Urban Aff. Rev. 2011, 47, 129–141. [Google Scholar] [CrossRef]
- Rhodes, J.; Russo, J. Shrinking ‘Smart’?: Urban Redevelopment and Shrinkage in Youngstown, Ohio. Urban Geogr. 2013, 34, 305–326. [Google Scholar] [CrossRef]
- Turok, I.; Mykhnenko, V. The trajectories of European cities, 1960–2005. Cities 2007, 24, 165–182. [Google Scholar] [CrossRef]
- Bontje, M. Facing the challenge of shrinking cities in East Germany: The case of Leipzig. GeoJournal 2004, 61, 13–21. [Google Scholar] [CrossRef]
- Schetke, S.; Haase, D. Multi-criteria assessment of socio-environmental aspects in shrinking cities. Experiences from eastern Germany. Environ. Impact Assess. Rev. 2008, 28, 483–503. [Google Scholar] [CrossRef]
- Cheng, J.Q.; Masser, I. Understanding spatial and temporal processes of urban growth: Cellular automata modelling. Environ. Plan. B Plan. Des. 2004, 31, 167–194. [Google Scholar] [CrossRef]
- Bernt, M.; Haase, A.; Grossmann, K.; Cocks, M.; Couch, C.; Cortese, C.; Krzysztofik, R. How does(n’t) Urban Shrinkage get onto the Agenda? Experiences from Leipzig, Liverpool, Genoa and Bytom. Int. J. Urban Reg. Res. 2014, 38, 1749–1766. [Google Scholar] [CrossRef]
- Cheng, J.Q.; Young, C.; Zhang, X.N.; Owusu, K. Comparing inter-migration within the European Union and China: An initial exploration. Migr. Stud. 2014, 2, 340–368. [Google Scholar] [CrossRef][Green Version]
- Hu, X.; Yang, C. Building a role model for rust belt cities? Fuxin’s economic revitalization in question. Cities 2018, 72, 245–251. [Google Scholar] [CrossRef]
- Xie, L.; Yang, Z.; Cai, J.; Cheng, Z.; Wen, T.; Song, T. Harbin: A rust belt city revival from its strategic position. Cities 2016, 58, 26–38. [Google Scholar] [CrossRef]
- Long, Y.; Wu, K. Shrinking cities in a rapidly urbanizing China. Environ. Plan. A 2016, 48, 220–222. [Google Scholar] [CrossRef]
- World Commission on Environment and Development. Our Common Future; Oxford University Press: Oxford, UK, 1987; Volume 17, pp. 1–91. [Google Scholar]
- United Nations, Development of Economic and Social Affairs. World Urbanization Prospects: The 2018 Revision (ST/ESA/SER.A/420); United Nations: New York, NY, USA, 2019. [Google Scholar]
- Pivo, G. Toward sustainable urbanization on Mainstreet Cascadia. Cities 1996, 13, 339–354. [Google Scholar] [CrossRef]
- Kissinger, M.; Rees, W.E.J.E.M. An interregional ecological approach for modelling sustainability in a globalizing world—Reviewing existing approaches and emerging directions. Ecol. Model. 2010, 221, 2615–2623. [Google Scholar] [CrossRef]
- Krueger, R.; Gibbs, D. The Sustainable Development Paradox: Urban Political Economy in the United States and Europe; Guilford Press: New York, NY, USA, 2007. [Google Scholar]
- Breckenfeld, G. Coping with city shrinkage. Civ. Eng. 1978, 48, 112–113. [Google Scholar]
- Booth, D.E. Regional Long Waves and Urban Policy. Urban Stud. 1987, 24, 447–459. [Google Scholar] [CrossRef]
- Beauregard, R.A. Aberrant cities: Urban population loss in the United States, 1820–1930. Urban Geogr. 2003, 24, 672–690. [Google Scholar] [CrossRef]
- Howe, S.R.; Allor, D.; Bier, T.; Finnerty, T.; Green, P. The shrinking central city amidst growing suburbs: Case studies of Ohio’s inelastic cities. Urban Geogr. 1998, 19, 714–734. [Google Scholar] [CrossRef]
- Peck, J.A.; Tickell, A. Local Modes of Social Regulation? Regulation Theory, Thatcherism and Uneven Development. Geoforum 1992, 23, 347–363. [Google Scholar] [CrossRef]
- Constantinescu, I.P. Shrinking Cities in Romania: Former Mining Cities in Valea Jiului. Built Environ. 2012, 38, 214–228. [Google Scholar] [CrossRef]
- Hartt, M. How cities shrink: Complex pathways to population decline. Cities 2018, 75, 38–49. [Google Scholar] [CrossRef]
- Haase, D.; Haase, A.; Kabisch, N.; Kabisch, S.; Rink, D. Actors and factors in land-use simulation: The challenge of urban shrinkage. Environ. Model. Softw. 2012, 35, 92–103. [Google Scholar] [CrossRef]
- Steffen, L.; Dagmar, H.; Ralf, S.; Nina, S. Simulating Demography and Housing Demand in an Urban Region under Scenarios of Growth and Shrinkage. Environ. Plan. B 2012, 39, 229–246. [Google Scholar]
- Haase, A.; Rink, D.; Grossmann, K.; Bernt, M.; Mykhnenko, V. Conceptualizing urban shrinkage. Environ. Plan. A 2014, 46, 1519–1534. [Google Scholar] [CrossRef]
- Hoekveld, J.J. Time-Space Relations and the Differences between Shrinking Regions. Built Environ. 2012, 38, 179. [Google Scholar] [CrossRef]
- Sousa, S.; Pinho, P. Planning for shrinkage: Paradox or paradigm. Eur. Plan. Stud. 2015, 23, 12–32. [Google Scholar] [CrossRef]
- Wu, K.; Long, Y.; Yang, Y. Urban Shrinkage in the Beijing-Tianjin-Hebei Region and Yangtze River Delta: Pattern, Trajectory and Factors. Mod. Urban Res. 2015, 9, 26–35. [Google Scholar]
- Liu, F.B.; Zhu, X.G.; Chen, J.; Sun, J.; Lin, X.Q. The Research on the Quantitative Identification and Cause Analysis of Urban Shrinkage from Different Dimensions and Scales: A Case Study of Northeast China during Transformation Period. Mod. Urban Res. 2018, 37–46. [Google Scholar] [CrossRef]
- Yang, Z.S.; Yang, D. Exploring Shrinking Areas in China Availing of City Development Index. Hum. Geogr. 2019, 34, 63–72. [Google Scholar]
- Guan, D.J.; Gao, W.J.; Su, W.C.; Li, H.F.; Hokao, K. Modeling and dynamic assessment of urban economy–resource–environment system with a coupled system dynamics – geographic information system model. Ecol. Indic. 2011, 11, 1333–1344. [Google Scholar] [CrossRef]
- Lee, S.; Geum, Y.; Lee, H.; Park, Y. Dynamic and multidimensional measurement of product-service system (PSS) sustainability: A triple bottom line (TBL)-based system dynamics approach. J. Clean. Prod. 2012, 32, 173–182. [Google Scholar] [CrossRef]
- Haghshenas, H.; Vaziri, M.; Gholamialam, A. Evaluation of sustainable policy in urban transportation using system dynamics and world cities data: A case study in Isfahan. Cities 2015, 45, 104–115. [Google Scholar] [CrossRef]
- Chen, Q.Y.; Song, Y.X. Study And Assessment of the Sustainable Development of Northeasy China. China Popul. Resour. Environ. 2004, 14, 80–85. [Google Scholar]
- Zheng, H.X.; Wang, Y.; Huang, B.R. A Research Review on Green Development Indicator System. J. Ind. Technol. Econ. 2013, 33, 142–152. [Google Scholar]
- Hou, J. Construction and Empirical Analysis of Regional Economic Sustainable Development. Syst. Eng. 2014, 32, 87–94. [Google Scholar]
- Chen, M.X.; Lu, D.D.; Zhang, H. Comprehensive Evaluation and the Driving Factors of China’s Urbanization. Acta Geogr. Sin. 2009, 64, 387–398. [Google Scholar]
- Chang, A.-Y.; Cheng, Y.-T. Analysis model of the sustainability development of manufacturing small and medium-sized enterprises in Taiwan. J. Clean. Prod. 2019, 207, 458–473. [Google Scholar] [CrossRef]
- Ding, L.; Shao, Z.; Zhang, H.; Xu, C.; Wu, D.J.S. A comprehensive evaluation of urban sustainable development in China based on the TOPSIS-Entropy method. Sustainability 2016, 8, 746. [Google Scholar] [CrossRef]
- Hospers, G.-J. Policy responses to urban shrinkage: From growth thinking to civic engagement. Eur. Plan. Stud. 2014, 22, 1507–1523. [Google Scholar] [CrossRef]
- Fang, W.; An, H.Z.; Li, H.J.; Gao, X.Y.; Sun, X.Q.; Zhong, W.Q. Accessing on the sustainability of urban ecological-economic systems by means of a coupled emergy and system dynamics model: A case study of Beijing. Energy Policy 2017, 100, 326–337. [Google Scholar] [CrossRef]
- Tan, Y.T.; Jiao, L.D.; Shuai, C.y.; Shen, L.Y. A system dynamics model for simulating urban sustainability performance: A China case study. J. Clean. Prod. 2018, 199, 1107–1115. [Google Scholar] [CrossRef]
- Hu, X.H.; Yang, C. Institutional change and divergent economic resilience: Path development of two resource-depleted cities in China. Urban Stud. 2019, 56, 3466–3485. [Google Scholar] [CrossRef]
- Yang, Z.S.; Sun, Y.y. Cith Shrinking: Phenomenon, Progress and Problems. Hum. Geogr. 2015, 30, 6–10. [Google Scholar]
- Haase, D.; Haase, A.; Rink, D. Conceptualizing the nexus between urban shrinkage and ecosystem services. Landsc. Urban Plan. 2014, 132, 159–169. [Google Scholar] [CrossRef]
- Frazier, A.E.; Bagchi-Sen, S.; Knight, J. The spatio-temporal impacts of demolition land use policy and crime in a shrinking city. Appl. Geogr. 2013, 41, 55–64. [Google Scholar] [CrossRef]
- Delken, E. Happiness in shrinking cities in Germany. J. Happiness Stud. 2008, 9, 213–218. [Google Scholar] [CrossRef]
- Elzerman, K.; Bontje, M. Urban Shrinkage in Parkstad Limburg. Eur. Plan. Stud. 2015, 23, 87–103. [Google Scholar] [CrossRef]
- Frazier, A.E.; Bagchi-Sen, S. Developing open space networks in shrinking cities. Appl. Geogr. 2015, 59, 1–9. [Google Scholar] [CrossRef]
- Zhang, H.; Lian, Y.L. Progresses of Shrinking Cities and Their Implications. J. Hum. Settlements West China 2018, 33, 28–36. [Google Scholar]


| City | Population in 2017 (unit: Million People) | GDP in 2017 (unit: Billion Yuan) | Average Annual Population Growth Rate in Urban District during 2002 and 2017 (unit: %) |
|---|---|---|---|
| Benxi | 1.50 | 76.7 | −0.315 |
| Fuxin | 1.89 | 40.8 | −0.179 |
| Hegang | 1.04 | 26.4 | −0.528 |
| Jixi | 1.81 | 51.8 | −0.663 |
| Jiamusi | 2.38 | 84.5 | −0.324 |
| Qiqihar | 5.44 | 132.5 | −0.337 |
| Suihua | 5.43 | 131.6 | −0.151 |
| Yichun | 1.18 | 25.1 | −0.769 |
| Subsystems | Indices | Index Attribute/Weight |
|---|---|---|
| Economy (weight: 0.18) | Ratio of tertiary industry to GDP | Positive/0.22 |
| Gross domestic product per capita | Positive/0.40 | |
| Total number of pupils | Positive/0.38 | |
| Livelihood (weight: 0.16) | Number of doctors per 10,000 people in the city | Positive/0.30 |
| Number of medical beds per 10,000 people in the city | Positive/0.20 | |
| Number of public books per 100 people in the city | Positive/0.50 | |
| Environment (weight: 0.16) | Industrial sulfur dioxide emissions in the city (t) | Negative/0.48 |
| Green space area per capita in municipal districts (m2/person) | Positive/0.32 | |
| Green coverage ratio in constructed areas (%) | Positive/0.20 | |
| Pollution governance (weight: 0.12) | Comprehensive utilization rate of industrial solid waste in the city (%) | Positive/0.19 |
| Centralized sewage treatment rate in the city (%) | Positive/0.53 | |
| Harmless treatment rate of domestic waste in the city (%) | Positive/0.28 | |
| Resource (weight: 0.2) | Electricity consumption per unit of economic output in municipal districts (kW·h/¥) | Negative/0.18 |
| Per capita electricity consumption in municipal districts (kW·h/person) | Negative/0.26 | |
| Per capita water consumption in municipal districts (m³/person) | Negative/0.28 | |
| Per capita gas consumption in municipal districts (m³/person) | Negative/0.28 | |
| Risk (weight: 0.18) | Ratio of foreign capital used to GDP (%) | Negative/0.27 |
| Registered urban unemployment rate (%) | Negative/0.26 | |
| Government revenue-expenditure ratio | Negative/0.25 | |
| Deposit-loan ratio of financial institutions | Negative/0.22 |
| Scenarios | S1 | S2 | S3 | S4 | S5 |
|---|---|---|---|---|---|
| Ideal Growth | Smart Shrinkage | Historical Trend | Resisting Shrinkage | Deteriorating Shrinkage | |
| V1 | 0.2% | −0.5% | −0.5% | 0.2% | −1.2% |
| V2 | 3.0% | 1.5% | 1.5% | 4.5% | −1.5% |
| V3 | 1.02% | −0.11% | −0.11% | 1.02% | −1.23% |
| V4 | 6.29% | 6.29% | * | 9.35% | 2.28% |
| V5 | −1.23% | 0.53% | * | 0.53% | 1.89% |
| V6 | 6.29% | 5.22% | * | 5.22% | 3.93% |
| V7 | 1.02% | 2.65% | * | 5.89% | 3.93% |
| V8 | −1.23% | −0.23% | * | 2.28% | 1.02% |
| V9 | 1.02% | 2.65% | * | 5.89% | 3.93% |
| City | GDP per Capita | Proportion of Tertiary Industry in GDP (%) | Unemployment Rate (%) | Fiscal Revenue-Expenditure Ratio | Medical Beds per 10,000 People | Green Coverage Rate (%) | Centralized Sewage Treatment Rate (%) | Electric Consumption per Capita | |
|---|---|---|---|---|---|---|---|---|---|
| Benxi | SD | 5.11 | 44.31 | 4.53 | 2.77 | 69.02 | 47.59 | 88.65 | 12,309.50 |
| HD | 5.11 | 47.70 | 4.59 | 2.48 | 76.10 | 48.39 | 95.12 | 12,309.50 | |
| RE | 0.00 | −0.07 | −0.01 | 0.12 | −0.09 | −0.02 | −0.07 | 0.00 | |
| Fuxin | SD | 2.16 | 50.07 | 5.70 | 4.00 | 58.63 | 41.80 | 98.00 | 5132.99 |
| HD | 2.16 | 49.19 | 5.69 | 3.85 | 60.38 | 43.34 | 88.50 | 5132.91 | |
| RE | 0.00 | 0.02 | 0.00 | 0.04 | −0.03 | −0.04 | 0.11 | 0.00 | |
| Hegang | SD | 2.54 | 31.14 | 6.22 | 5.91 | 68.56 | 44.44 | 72.41 | 5740.14 |
| HD | 2.54 | 35.81 | 6.06 | 5.63 | 76.52 | 42.57 | 75.55 | 5740.09 | |
| RE | 0.00 | −0.13 | 0.03 | 0.05 | −0.10 | 0.04 | −0.04 | 0.00 | |
| Jixi | SD | 2.86 | 40.04 | 4.83 | 4.26 | 71.45 | 37.20 | 50.99 | 4451.37 |
| HD | 2.86 | 40.08 | 5.11 | 4.73 | 64.83 | 39.05 | 50.00 | 4451.38 | |
| RE | 0.00 | 0.00 | −0.05 | −0.10 | 0.10 | −0.05 | 0.02 | 0.00 | |
| Jiamusi | SD | 3.55 | 44.67 | 5.25 | 6.44 | 60.16 | 42.02 | 77.50 | 2832.20 |
| HD | 3.55 | 47.28 | 5.01 | 6.25 | 62.78 | 41.61 | 85.00 | 2832.20 | |
| RE | 0.00 | −0.06 | 0.05 | 0.03 | −0.04 | 0.01 | −0.09 | 0.00 | |
| Qiqihar | SD | 2.44 | 48.48 | 5.24 | 8.38 | 53.21 | 39.94 | 66.82 | 2853.69 |
| HD | 2.44 | 46.38 | 5.34 | 8.68 | 47.93 | 37.86 | 75.04 | 2853.69 | |
| RE | 0.00 | 0.05 | −0.02 | −0.04 | 0.11 | 0.05 | −0.11 | 0.00 | |
| Suihua | SD | 2.45 | 39.41 | 3.21 | 6.55 | 28.75 | 26.51 | 100.00 | 826.76 |
| HD | 2.42 | 35.56 | 3.10 | 6.81 | 30.23 | 24.93 | 90.20 | 818.82 | |
| RE | 0.01 | 0.11 | 0.03 | −0.04 | −0.05 | 0.06 | 0.11 | 0.01 | |
| Yichun | SD | 2.13 | 34.56 | 7.50 | 8.49 | 55.27 | 30.24 | 84.94 | 2455.33 |
| HD | 2.13 | 38.03 | 7.91 | 9.04 | 54.68 | 30.54 | 87.90 | 2455.32 | |
| RE | 0.00 | −0.09 | −0.05 | −0.06 | 0.01 | −0.01 | −0.03 | 0.00 | |
| City | Year | Economic Subsystem | Risk Subsystem | Livelihood Subsystem | Environment Subsystem | Pollution Governance Subsystem | Resource Subsystem |
|---|---|---|---|---|---|---|---|
| Benxi | 2002 | 28.53 | 54.57 | 35.07 | 37.31 | 43.93 | 39.25 |
| 2017 | 37.74 | 53.20 | 44.90 | 48.15 | 54.64 | 45.23 | |
| Fuxin | 2002 | 24.81 | 33.29 | 10.01 | 44.89 | 77.94 | 80.57 |
| 2017 | 27.34 | 49.60 | 30.36 | 22.59 | 92.92 | 78.56 | |
| Hegang | 2002 | 16.77 | 16.91 | 6.76 | 48.18 | 45.87 | 82.44 |
| 2017 | 17.90 | 41.82 | 36.21 | 64.49 | 66.02 | 91.47 | |
| Jixi | 2002 | 20.58 | 59.59 | 6.26 | 52.26 | 66.55 | 81.42 |
| 2017 | 23.43 | 55.70 | 21.32 | 56.21 | 81.68 | 93.24 | |
| Jiamusi | 2002 | 24.89 | 47.03 | 10.83 | 43.94 | 54.31 | 86.79 |
| 2017 | 34.31 | 44.21 | 18.37 | 66.81 | 77.72 | 84.72 | |
| Qiqihar | 2002 | 38.71 | 35.33 | 9.26 | 28.82 | 56.69 | 91.49 |
| 2017 | 58.49 | 31.89 | 19.16 | 56.55 | 69.74 | 60.64 | |
| Suihua | 2002 | 30.19 | 62.04 | 5.21 | 46.46 | 35.44 | 98.99 |
| 2017 | 31.38 | 52.48 | 15.65 | 45.24 | 96.52 | 92.92 | |
| Yichun | 2002 | 18.16 | 34.63 | 13.70 | 57.37 | 55.96 | 94.50 |
| 2017 | 18.64 | 47.55 | 39.13 | 63.86 | 60.19 | 93.06 |
© 2019 by the author. Licensee MDPI, Basel, Switzerland. This article is an open access article distributed under the terms and conditions of the Creative Commons Attribution (CC BY) license (http://creativecommons.org/licenses/by/4.0/).
Share and Cite
Yang, Z. Sustainability of Urban Development with Population Decline in Different Policy Scenarios: A Case Study of Northeast China. Sustainability 2019, 11, 6442. https://doi.org/10.3390/su11226442
Yang Z. Sustainability of Urban Development with Population Decline in Different Policy Scenarios: A Case Study of Northeast China. Sustainability. 2019; 11(22):6442. https://doi.org/10.3390/su11226442
Chicago/Turabian StyleYang, Zhenshan. 2019. "Sustainability of Urban Development with Population Decline in Different Policy Scenarios: A Case Study of Northeast China" Sustainability 11, no. 22: 6442. https://doi.org/10.3390/su11226442
APA StyleYang, Z. (2019). Sustainability of Urban Development with Population Decline in Different Policy Scenarios: A Case Study of Northeast China. Sustainability, 11(22), 6442. https://doi.org/10.3390/su11226442