Abstract
Efficient application of nanoscale zero-valent iron (nZVI) particles in remediation processes relies heavily on the ability to modify the surfaces of nZVI particles to enhance their stability and mobility in subsurface layers. We investigated the effect of sodium carboxy-methyl-cellulose (CMC) polymer stabilizer, pH, particle concentration, and flow rate on the transport of nZVI particles in sand columns. Breakthrough curves (BTCs) of nZVI particles indicated that the transport of nZVI particles was increased by the presence of CMC and by increasing the flow rate. The relative concentration (RC) of the eluted CMC–nZVI nanoparticles was larger at pH 9 as compared to RC at pH 7. This is mainly attributed to the increased nZVI particle stability at higher pH due to the increase in the electrostatic repulsion forces and the formation of larger energy barriers. nZVI particle deposition was larger at 0.1 cm min−1 flow due to the increased residence time, which increases the aggregation and settlement of particles. The amount of CMC–nZVI particles eluted from the sand columns was increased by 52% at the maximum flow rate of 1.0 cm min−1. Bare nZVI were mostly retained in the first millimeters of the soil column, and the amount eluted did not exceed 1.2% of the total amount added. Our results suggest that surface modification of nZVI particles was necessary to increase stability and enhance transport in sandy soil. Nevertheless, a proper flow rate, suitable for the intended remediation efforts, must be considered to minimize nZVI particle deposition and increase remediation efficiency.
1. Introduction
Interest in the application of nanoscale zero-valent iron (nZVI) particles in remediation of point-source polluted sites has grown dramatically in recent years [1,2]. nZVI are characterized by a large surface area, high reactivity, and possible mobility in the subsurface due to its small size. Therefore, nZVI particles have been widely used in the remediation of a number of pollutants, including chlorinated organic compounds [3,4], heavy metals [5,6], and inorganic anions [7,8]. Despite their small size, nZVI particles traveling through porous media rapidly aggregate, forming larger-sized particles, hence increasing the possibility of settling and deposition of particles [9]. Attractive magnetic and van der Waals forces are responsible for the rapid aggregation of nZVI particles, which increase the size and reduce the surface charge on the agglomerated nZVI particles, resulting in higher deposition and limited transport in porous media [10].
Several studies have investigated the ability to reduce the settling of nZVI particles by modifying the surface of the nZVI particles using different coating materials [11,12,13]. Anionic and nonionic polymers are among the most common materials used for stabilizing nZVI particles. In particular, the food-grade anionic polymer sodium carboxy-methyl-cellulose (CMC) has been widely used in the stabilization of nZVI particles [14,15,16], and several other nanomaterials (NMs) and nanohybrids [17], for laboratory and field applications. Modification of the surface of nZVI particles using surface coatings has led to prolonged nZVI particle stability in aqueous solutions, which promotes greater mobility in porous media and increases the efficiency of nZVI particles in remediation processes [18,19,20]. Despite the enhanced deliverability of surface-modified nZVI particles as compared to that of bare nZVI particles, transport of nZVI particles in the subsurface porous media could also be limited by several other factors, such as solution chemistry (e.g., pH and ionic strength), collector grain size, and nZVI particle concentration [21].
The flow velocity also affects the mobility of nZVI particles in porous media and subsurface layers [13]. Several studies have evaluated the effect of pore water velocity on the transport of nZVI particles [13,16]. At larger pore water velocities, nZVI particles are subject to less tension in porous media due to the larger drag forces on the deposited particles, leading to the detachment of deposited particles [16]. Xu and Zhao [22] reported increased mobility of CMC–nZVI particles in a small soil column, with 81% of influent observed at full breakthrough. He et al. [14] investigated the effect of pore water velocities in the range of 1.1 to 4.2 cm min−1 on the transport of CMC–nZVI particles and found that the effluent concentration was increased by 10% as a result of the increase in the pore water velocity. Raychoudhury et al. [16] investigated the transport of 0.5 g L−1 bare nZVI particles in soil columns under a pore water velocity of 0.2 cm min−1, and found negligible mobility as indicated by the <1% nZVI effluent concentration. Several researches have used the Derjaguin, Landau, Verwey, and Overbeek (DLVO) theory to calculate the total interaction energy between nZVI–nZVI particles, to help in the assessment of the stability and transport of nZVI particles in porous media [16,23].
Most of the research investigating the transport of nZVI particles has been carried out using idealized porous media (e.g., glass beads, silica sand), a low nZVI particle concentration (i.e., ≤0.1 gL−1), high pore water velocity (i.e., >1.0 cm min−1), and saturated conditions [14]. These conditions do not represent the heterogeneity of natural porous media, and may overestimate the mobility of nZVI nanoparticles as compared to the expected mobility at lower velocities under natural water flow conditions in the field. Assessing the transport of nZVI under natural soil conditions is extremely important to mimic the actual complexity of nZVI particle transport in the subsurface soil layers [24,25]. In addition, there is a need to evaluate nZVI particle mobility under low pore water velocities of (i.e., <0.1 cm min−1), which is more representative of the range of velocities representing the slow ground water flow [16], and at large nZVI particle concentrations that is more applicable for field applications. Therefore, the objective of this research was to evaluate the effect of nZVI particle concentration (0.1 and 1.0 gL−1), pH (7 and 9), and flow rate (0.1, 0.5, and 1.0 cm min−1) on the transport and deposition of bare and CMC-stabilized nZVI particles in sandy soil under unsaturated flow conditions.
2. Materials and Methods
2.1. Soil Sampling and Analysis
The soil used in this research was collected from the 0–30-cm surface layer of the farm of the College of Food and Agricultural Sciences at King Saud University in Riyadh (latitude 24°43ʹ42ʹʹ N and longitude 46°36ʹ33ʹʹ E). The soil was air-dried and passed through a 2-mm sieve. Selected physical and chemical properties of the soil were determined according to standard procedures [26,27]. The soil texture was sand, and the percentages of clay, silt, and sand were 1%, 2%, and 97%, respectively. pH (paste extraction) was 8.4, electrical conductivity (paste extraction) was 1.4 dS m−1, and organic matter was 0.02%. The saturated hydraulic conductivity, as determined by the constant-head method [28], was 0.0184 cm s−1. The zeta potential of the soil was measured using a Zeta Sizer Nano Series Instrument (Malvern Instrument Ltd., UK). The soil was sieved through a 150 µm, and a 250 mg L−1 soil suspension was prepared using 50 mM NaHCO3 electrolyte solution. The soil suspension was allowed to settle down for 48 h, and the supernatant was collected. Prior to measurement, the suspension was sonicated for 30 min, cooled to room temperature, and stirred for 10 s right before analysis. Twenty zeta potential readings were recorded, and the average zeta potential was −16.8 mV.
2.2. Synthesis and Characterization of nZVI Nanoparticles
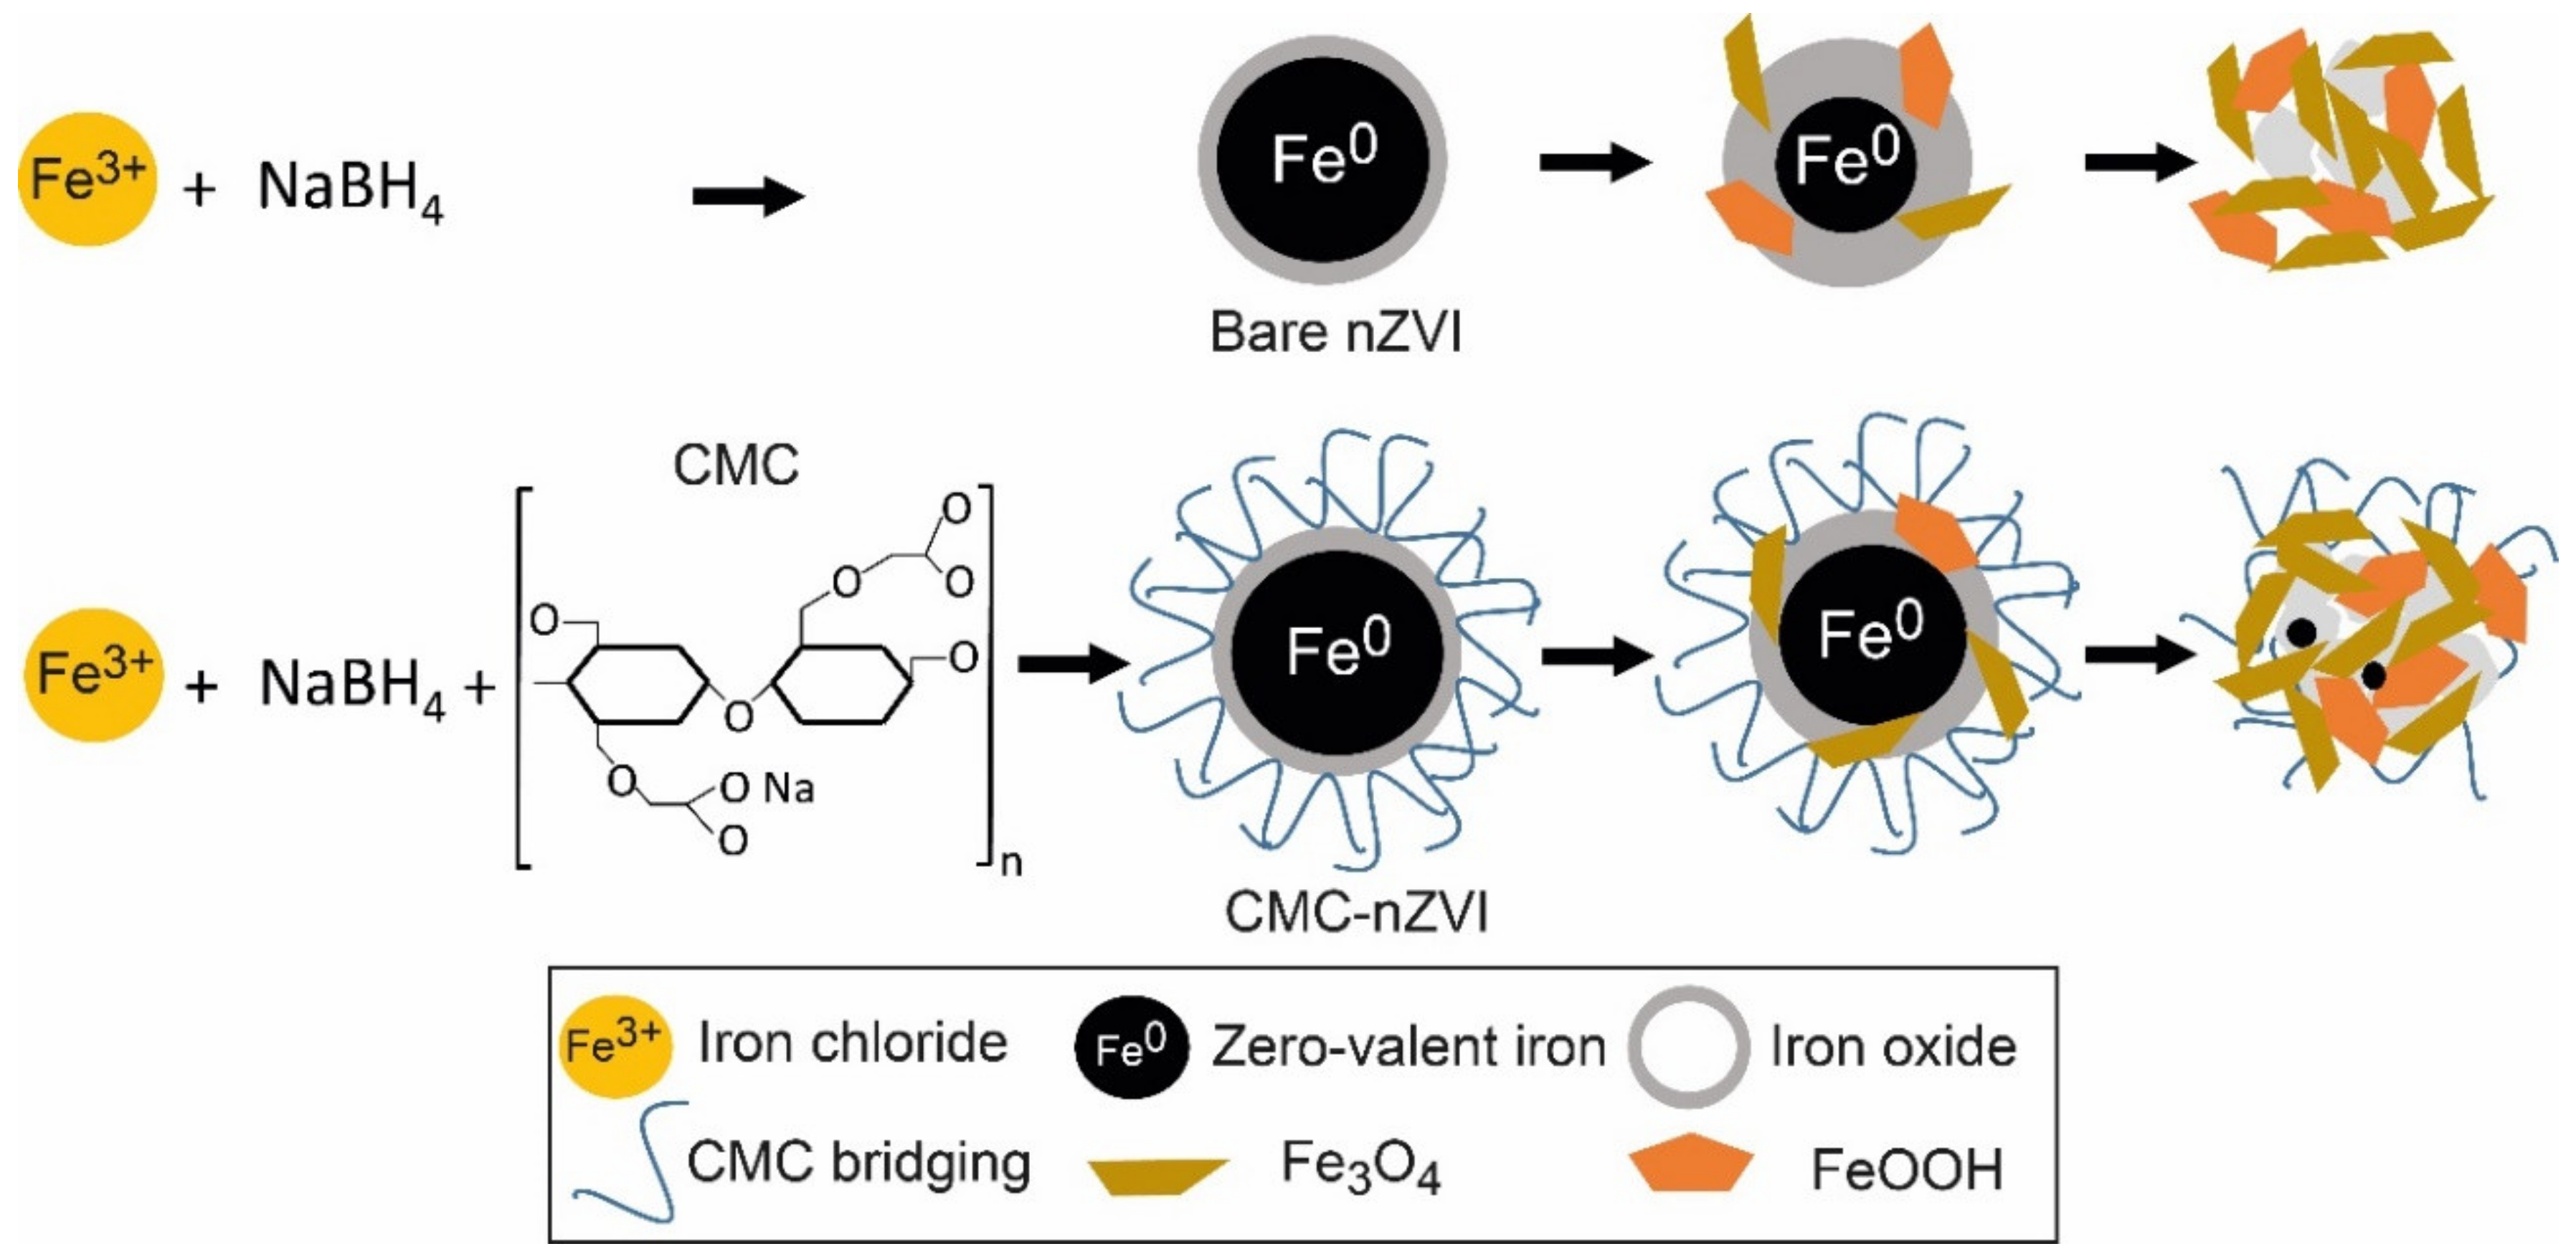
Analytical grade ferric chloride hexahydrate (FeCl3 • 6H2O), sodium bicarbonate (NaHCO3), sodium borohydride (NaBH4), and sodium carboxy-methyl-cellulose (CMC, MW = 90,000) were purchased from Sigma Aldrich. nZVI nanoparticles were produced by the reduction of ferric iron in the presence of sodium borohydride. Figure 1 shows a diagram of the synthesis of bare nZVI and CMC–nZVI particles, and their transformation to iron oxide and hydroxide over time. nZVI nanoparticles were prepared by adding 0.1 M NaBH4 aqueous solution drop wise to 0.1 M FeCl3.6H2O at ambient temperature, and 200 mL CMC with 2% concentration were added to the mixture [17]. The suspension was stirred for 30 min, filtered (Whatman 42) using a vacuum pump, washed with 25 mL of ethanol 3 times, and transported to a storage bottle. After the completion of the CMC–nZVI preparatory phase, the concentration of the prepared CMC–nZVI (~3.0 g L−1) particles was determined and stored in Duran bottles under a thin film of ethanol to protect it from atmospheric oxygen until the time of suspension preparation. For the preparation of bare nZVI particles, the procedures were carried out with the same steps but without the addition of CMC. Two final concentrations of 0.1 and 1.0 g L−1 for both bare and CMC–nZVI particles were prepared in a background electrolyte solution of 50 mM NaHCO3. The pH of the suspensions was adjusted to pH 7 and 9 using 0.01 M HCL or 0.01 M NaOH. All solutions and dilutions were prepared in nanopure water, which was purged with nitrogen gas for 1 h prior to usage. Fresh nZVI suspension was prepared at the beginning of each experimental measurement. All suspensions were sonicated for 10 min prior to its use.
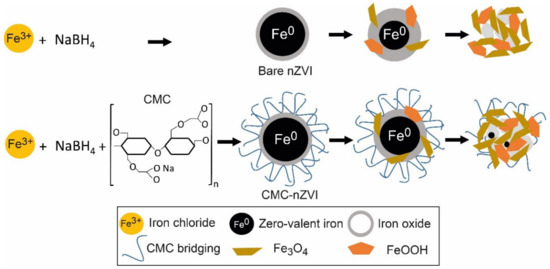
Figure 1.
Diagram of the synthesis of bare nanoscale zero-valent iron (nZVI) and carobxymethyl cellulose (CMC) CMC–nZVI, and its transformation to iron oxide and hydroxide over time.
The structure of the nZVI particles was investigated using X-ray diffraction (XRD). The XRD analysis was conducted with an Altima IV X-ray diffractometer (Rigaku, USA). nZVI nanoparticles were scanned from 20° to 90° at a rate of 2.0° min−1. A transmission electron microscope (TEM–JEOL, JEM1011), (JEOL, Inc., Peabody, MA) was used to characterize the shape of the nZVI particles. The specific surface area of the nZVI particles was determined by the Brunauer, Emmett and Teller (BET) method with nitrogen (N2) at 77 K using a surface area and microporosity analyzer (ASAP 2020, Micromeritics, USA). The hydrodynamic size of bare and CMC–nZVI particles in aqueous suspensions was measured using laser doppler velocimetery (Zetasizer Nano ZS, Malvern, UK). Zeta potential of the nZVI nanoparticles was determined by dynamic light scattering techniques by measuring the electrophoretic mobility of nZVI suspensions (Zetasizer Nano ZS, Malvern, UK). The pH of the zero-point charge (PZC) was determined over the pH range 2–11.
2.3. DLVO Calculations
The classical Derjaguin, Landau, Verwey, and Overbeek (DLVO) [29] theory was used to calculate the total interaction energy, determined as the sum of van der Waals attractive and electric double layer repulsive forces that exist between nZVI nanoparticles. The interaction between two nZVI nanoparticles was considered to be a sphere–sphere interaction. A detailed description of the equations used for the calculation of the DLVO interactions is presented in Appendix A.
2.4. Column Transport of nZVI Nanoparticles
The soil was wet packed (2% W/W) into an acrylic column with 2.5 cm internal diameter (I.D.) and 15 cm length. The soil was packed to a bulk density of 1.5 g cm−3 in 5-cm increments to eliminate particle segregation. One layer of a nylon membrane (45 μm pore opening) was placed at the bottom of the column. In a separate soil column, the values of the hydrodynamic dispersion coefficient and pore volume were estimated from breakthrough curves obtained with an inert tracer (KNO3). To pre-condition the column for the transport of nZVI nanoparticles, the column was flushed with nanopure water from the bottom using a peristaltic pump. At least 15 pore volumes (PVs) were passed through the column to ensure appropriate pre-conditioning of the soil matrix for the transport experiment. After pre-conditioning of the soil column, the column was flushed with 5 PV of 50 mM NaHCO3 solution at the specified flow rate in an up–down flow direction. This was followed by 5 PV of the prepared nZVI suspension, and finally another 5 PV of the background electrolyte solution were pumped through the column. Flow was carried out under unsaturated conditions, and the suspension of nZVI nanoparticles was pumped through the column using a peristaltic pump at three flow rates of 0.1, 0.5, and 1.0 cm min−1. The freshly prepared nZVI nanoparticle suspension was sonicated for 10 min before application. The outflow from the column was collected with a fraction collector. Transport experiments were conducted in triplicate. All experiments were conducted in ambient laboratory conditions (~23 °C).
The concentration of the nZVI nanoparticles in the effluent was determined by measuring the absorbance at a wavelength of 508 nm using a UV/VIS spectrophotometer. Before measurement, the vials containing the nZVI effluent were shaken by hand for about 10 s to disperse the particles. The concentration data were presented as averages of measurements, and breakthrough curves (BTCs) were plotted as a function of pore volume; that is, cumulative water outflow normalized by the column pore volume.
2.5. Statistical Analysis
Statistical analysis was performed using the software SPSS for Windows (SPSS Inc., version 2, Chicago, IL). Data values are presented as averages along with its standard deviation (±1SD). The least significant difference (LSD at p < 0.01) test was used to assess the differences among the means of the replicates [30].
3. Results
3.1. Properties of the Synthesized nZVI Particles
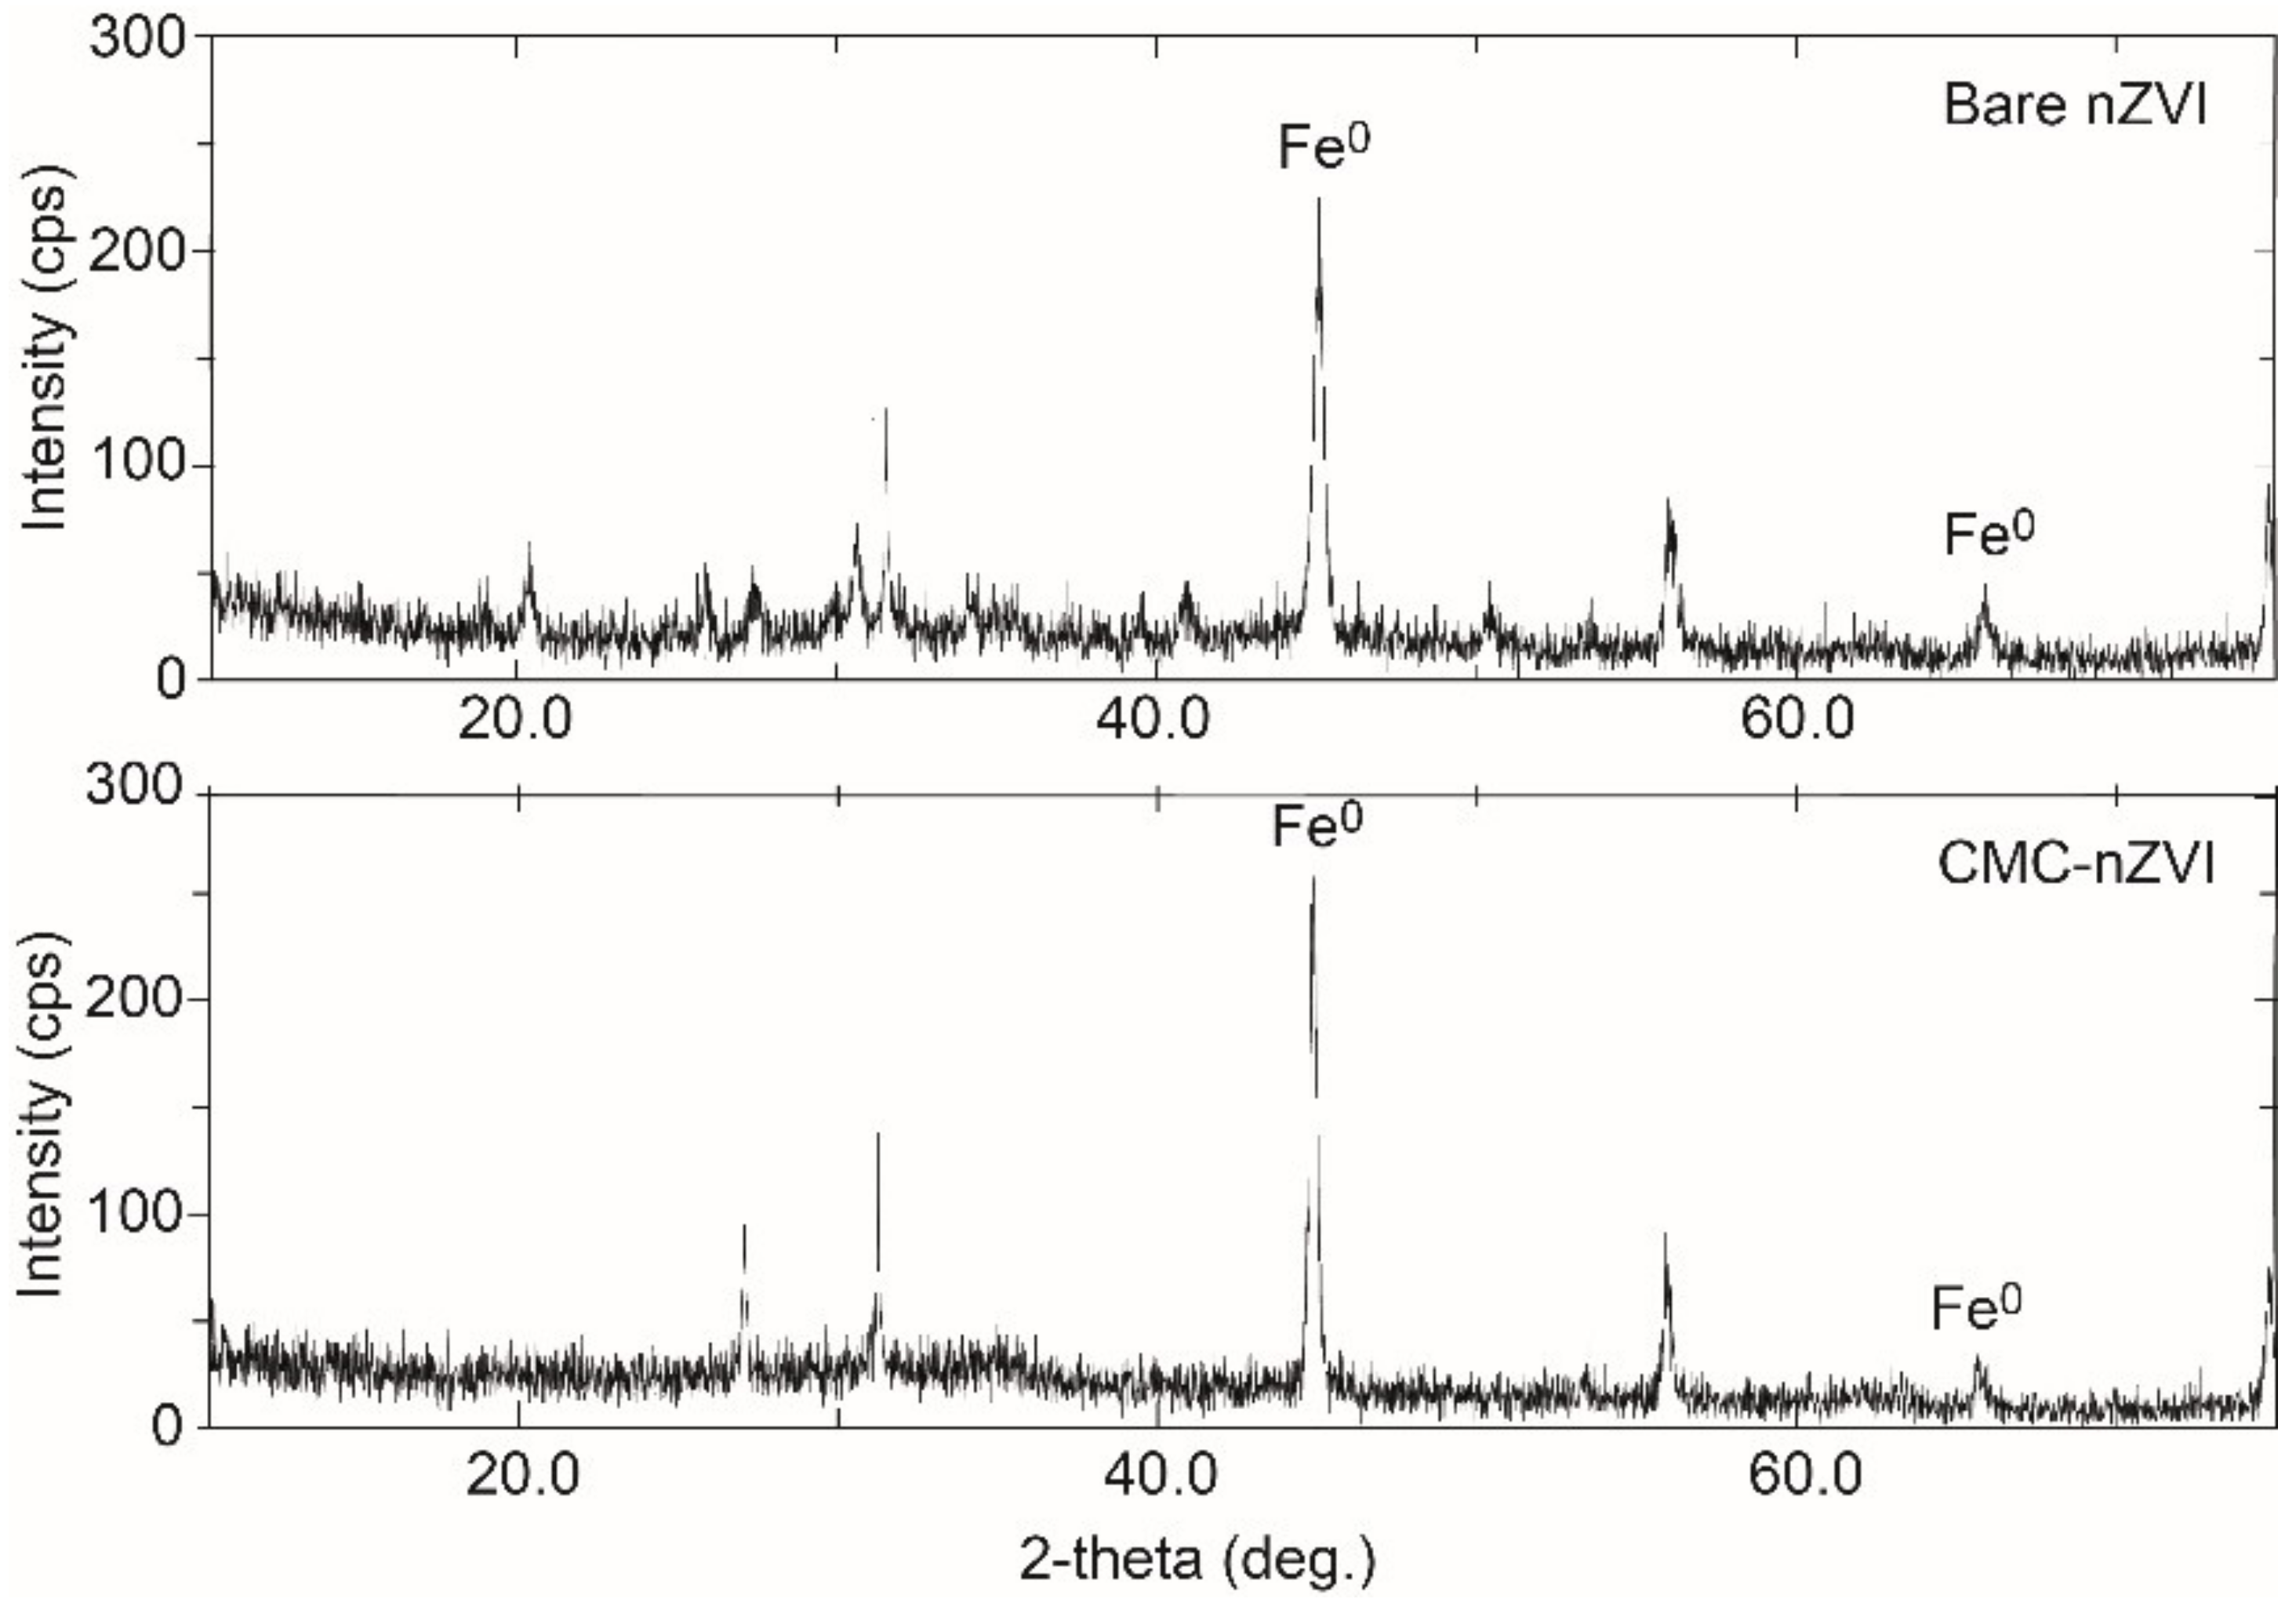
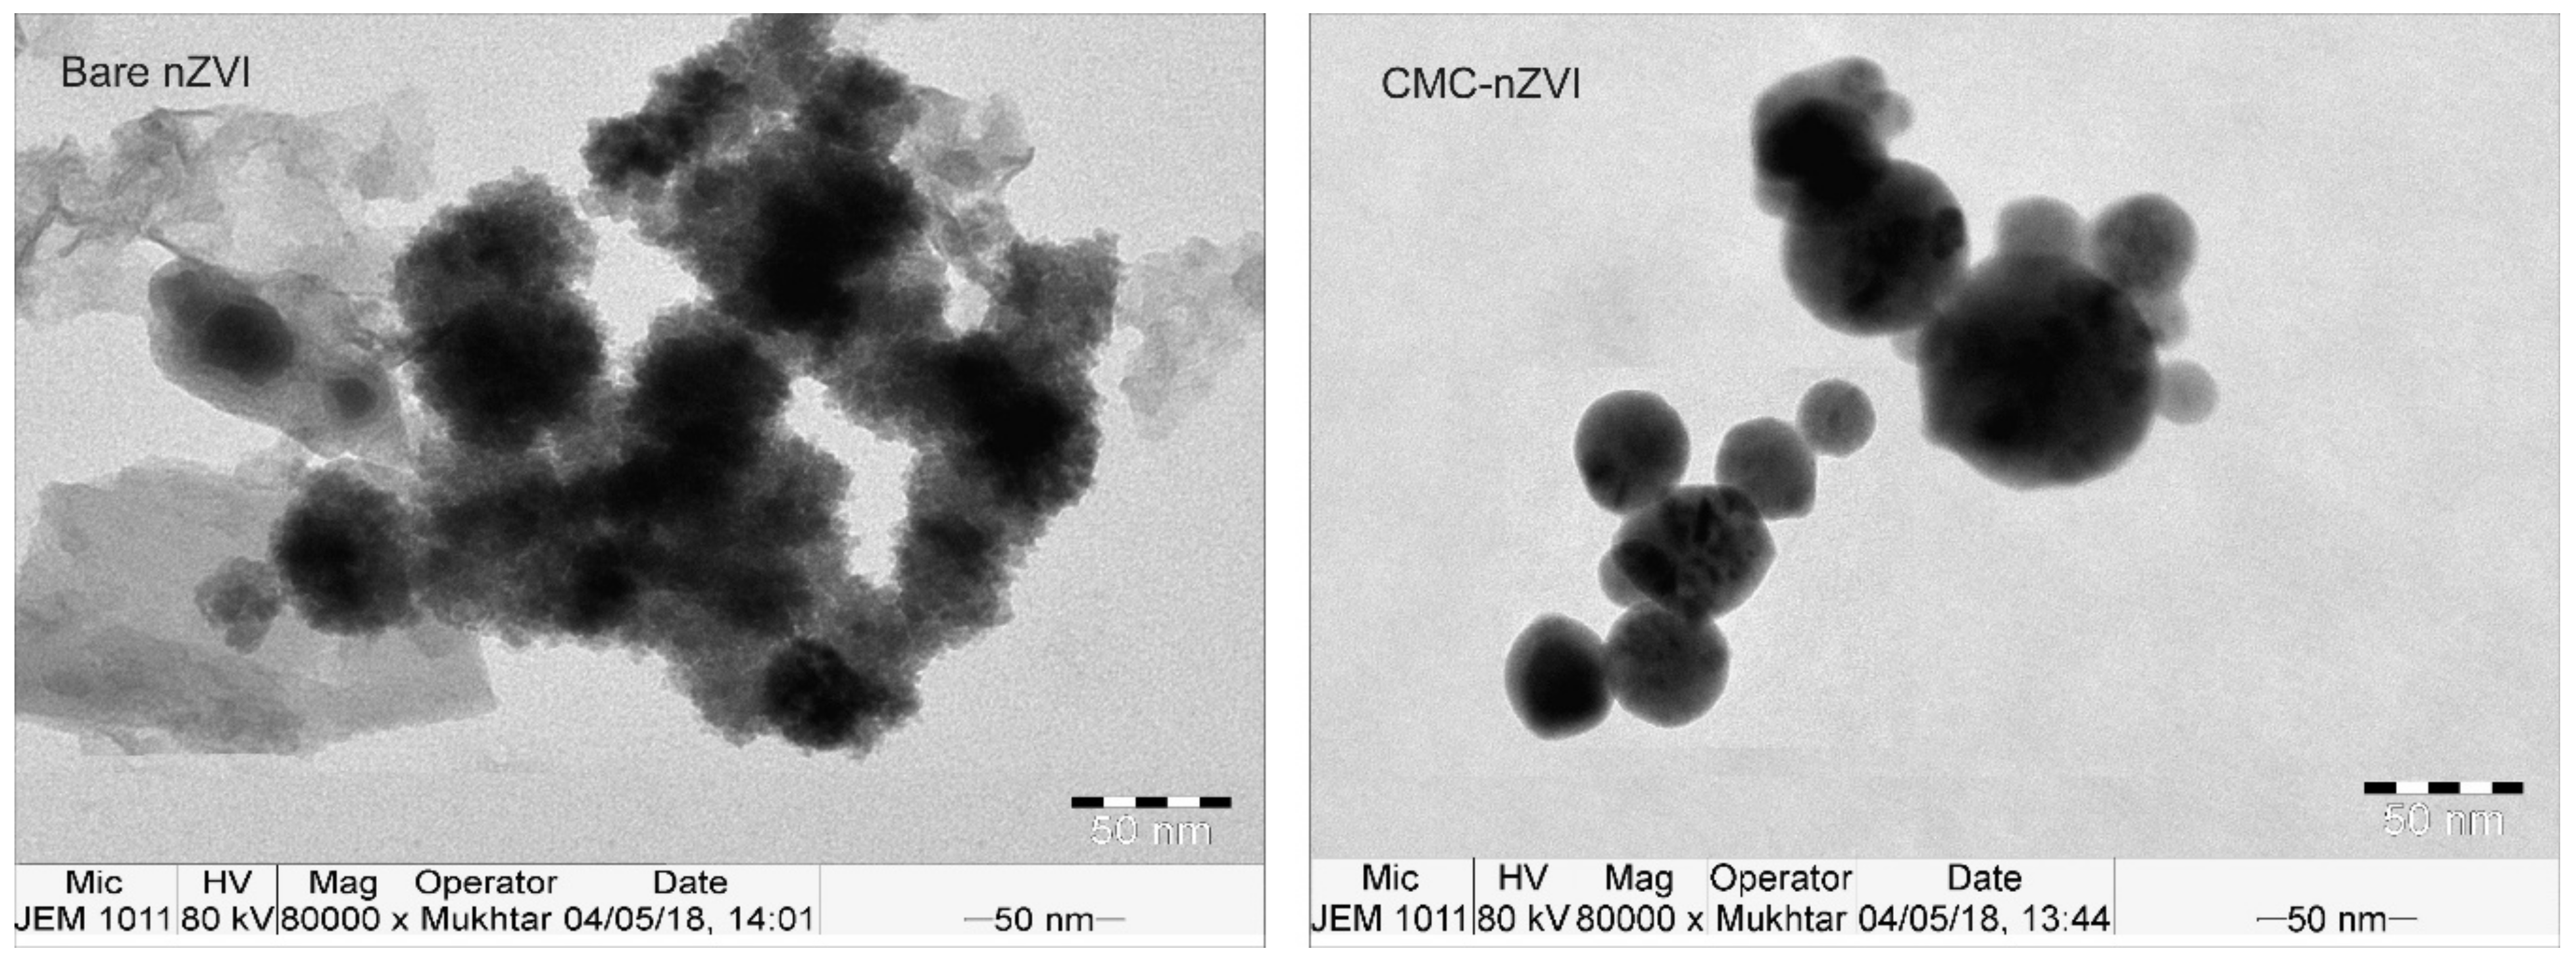
XRD analysis revealed that Fe0 was the dominant form in the prepared iron suspension (Figure 2), as confirmed by the characteristic diffraction peaks 2θ = 45.05° and 65.93°, and 2θ = 45.46° and 65.64° for the bare and CMC–nZVI particles, respectively. TEM analysis revealed that the average size of bare and CMC–nZVI nanoparticles ranged between 30 and 70 and 20 and 50 nm, respectively (Figure 3). These values are consistent with the results from several previous studies [15,31,32].
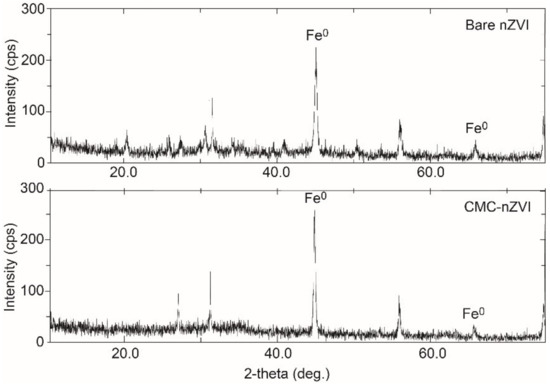
Figure 2.
X-ray diffraction (XRD) analysis of bare and CMC–nZVI nanoparticles.

Figure 3.
Transmission electron microscope (TEM) images of bare and CMC–nZVI nanoparticles.
The average hydrodynamic size measured by dynamic light scattering (DLS) of nZVI nanoparticles differed significantly from the diameter of single nZVI particles measured by TEM analysis (Table 1). nZVI nanoparticles suspended in an electrolyte solution tend to agglomerate, forming aggregates of two or more particles depending on the particle concentration and chemical conditions in the suspension. Therefore, the average diameters determined by DLS cannot be directly compared to TEM diameters [21]. The hydrodynamic size of nZVI nanoparticles measured by DLS was in general larger than the size range measured by TEM. At an nZVI nanoparticle concentration of 0.1 g L−1, the hydrodynamic size of the nZVI nanoparticles ranged between 107.4 and 188.1 and 92.6 and 145.3 nm for the bare and CMC–nZVI nanoparticles, respectively (Table 1). The total surface area was increased from 3.55 to 7.6 m2 g−1 when the nZVI nanoparticles were stabilized with CMC (Table 1). The increase in surface area between coated CMC–nZVI and bare nZVI is caused by the polymer coating of the particles, which prevents agglomeration [31].

Table 1.
Selected physical and chemical properties of the synthesized bare and CMC–nZVI nanoparticles.
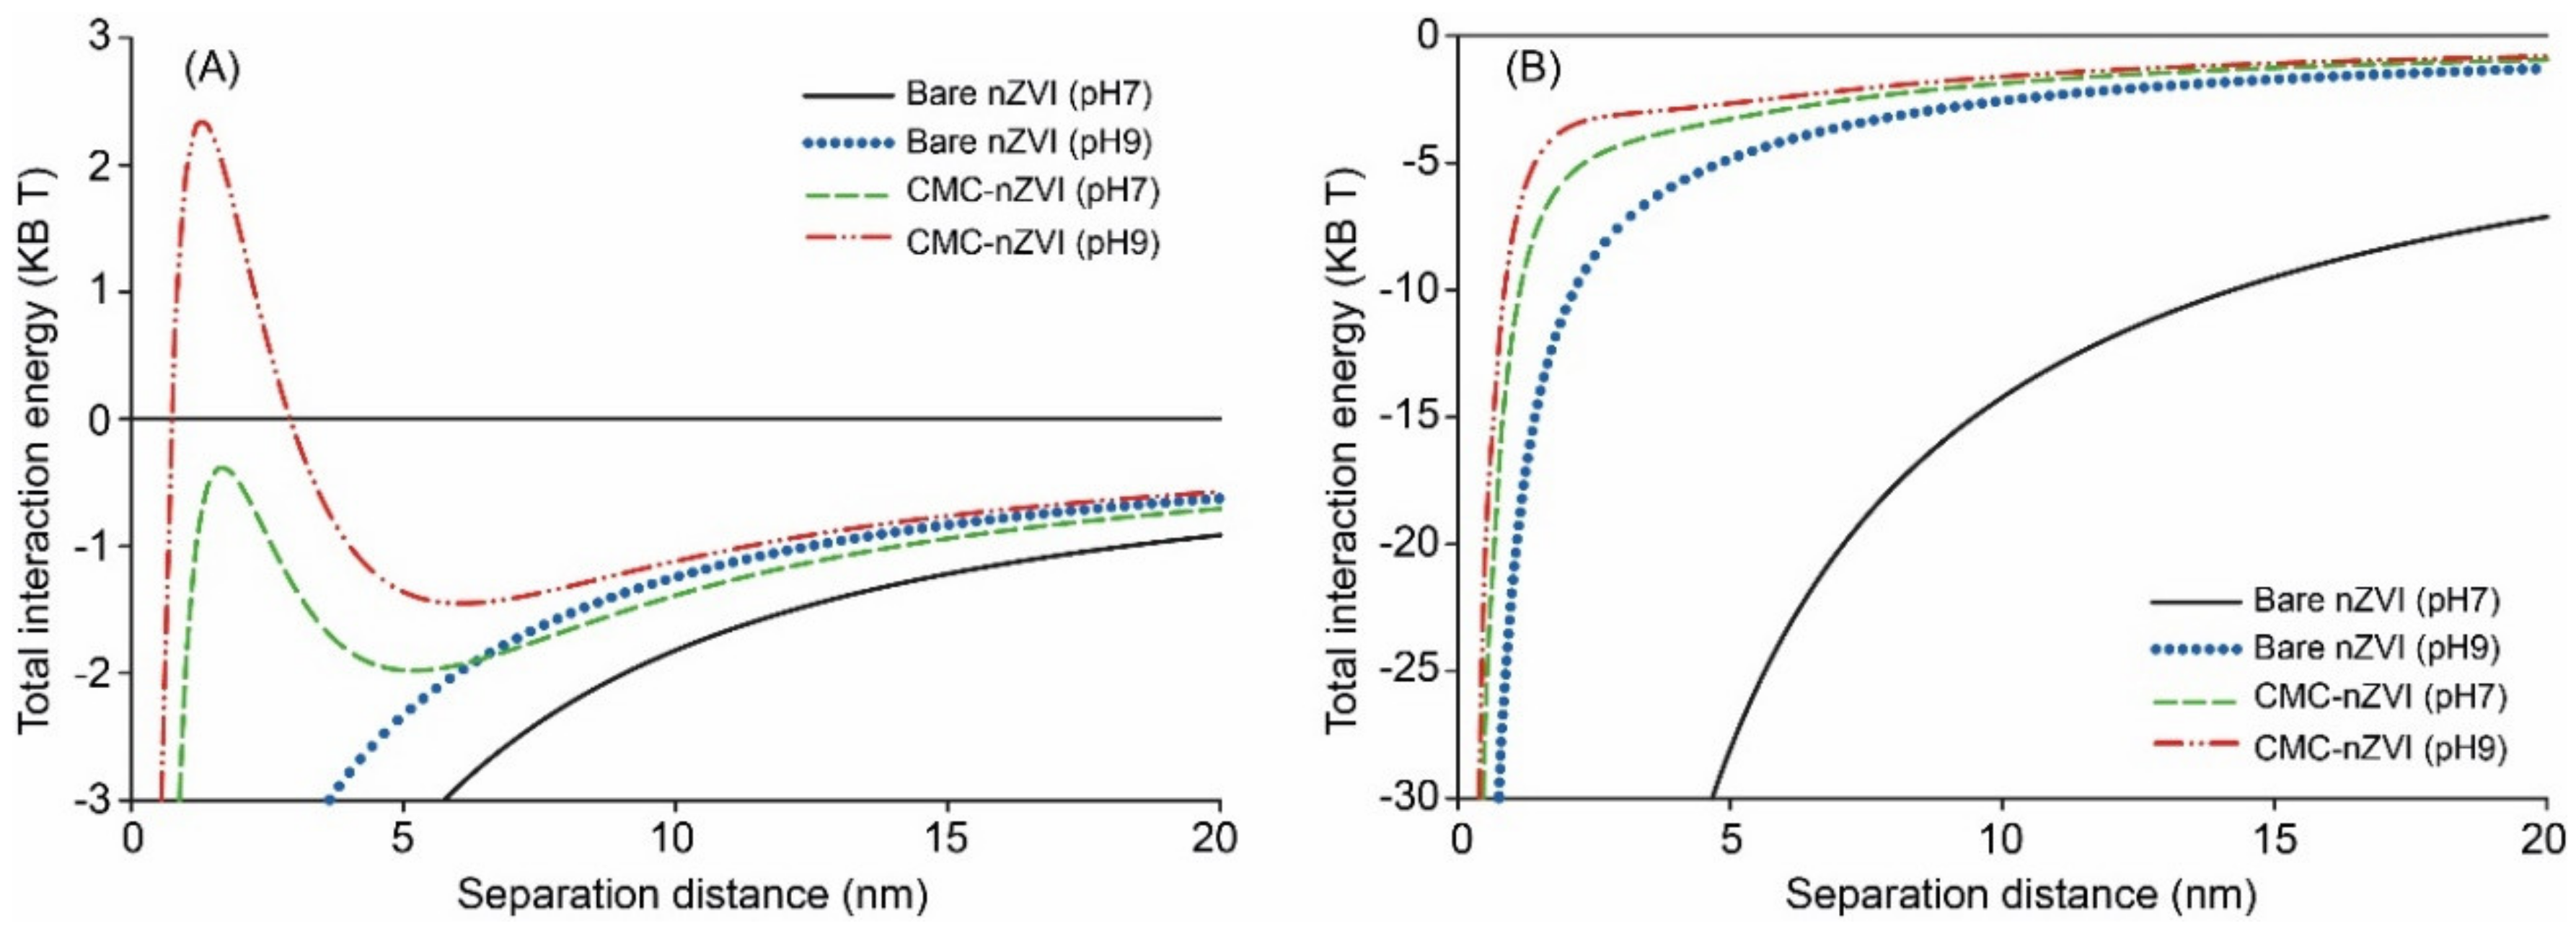
CMC polymer stabilizer increased the zeta potential of nZVI particles by two fold (Table 1). The zeta potential of bare nZVI nanoparticles was always positive at pH < 7 and negative at pH > 7. In contrast, the zeta potential of CMC–nZVI was always negative at all measured pH values (2–11). The average point of zero charge (PZC) for bare and CMC–nZVI particles was at pH 7.6 and <2.0, respectively (Table 1). These findings were consistent with DLVO calculations. The sum of the inter-particle interaction forces showed the formation of a small energy barrier of around 2.4 KB T only with 0.1 g L−1 CMC–nZVI particles at pH 9 (Figure 4). Whereas, the total interaction energy was negative (i.e., conditions favoring aggregation) at pH 7 for both bare and CMC–nZVI particles. At the larger nZVI particle concentration (1.0 g L−1), total interaction was dominated by attractive forces at both pH 7 and 9, with an increased extent in the absence of CMC (Figure 4B).
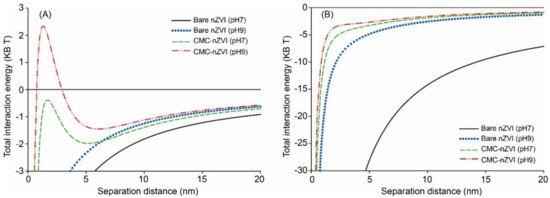
Figure 4.
Effect of pH and CMC polymer stabilizer on total interaction energy of 0.1 g L−1 (A), and 1.0 g L−1 (B) nZVI suspensions in 50 mM NaHCO3 as calculated by the Derjaguin, Landau, Verwey, and Overbeek (DLVO) theory.
3.2. Effect of Flow Rate on the Transport of nZVI Particles
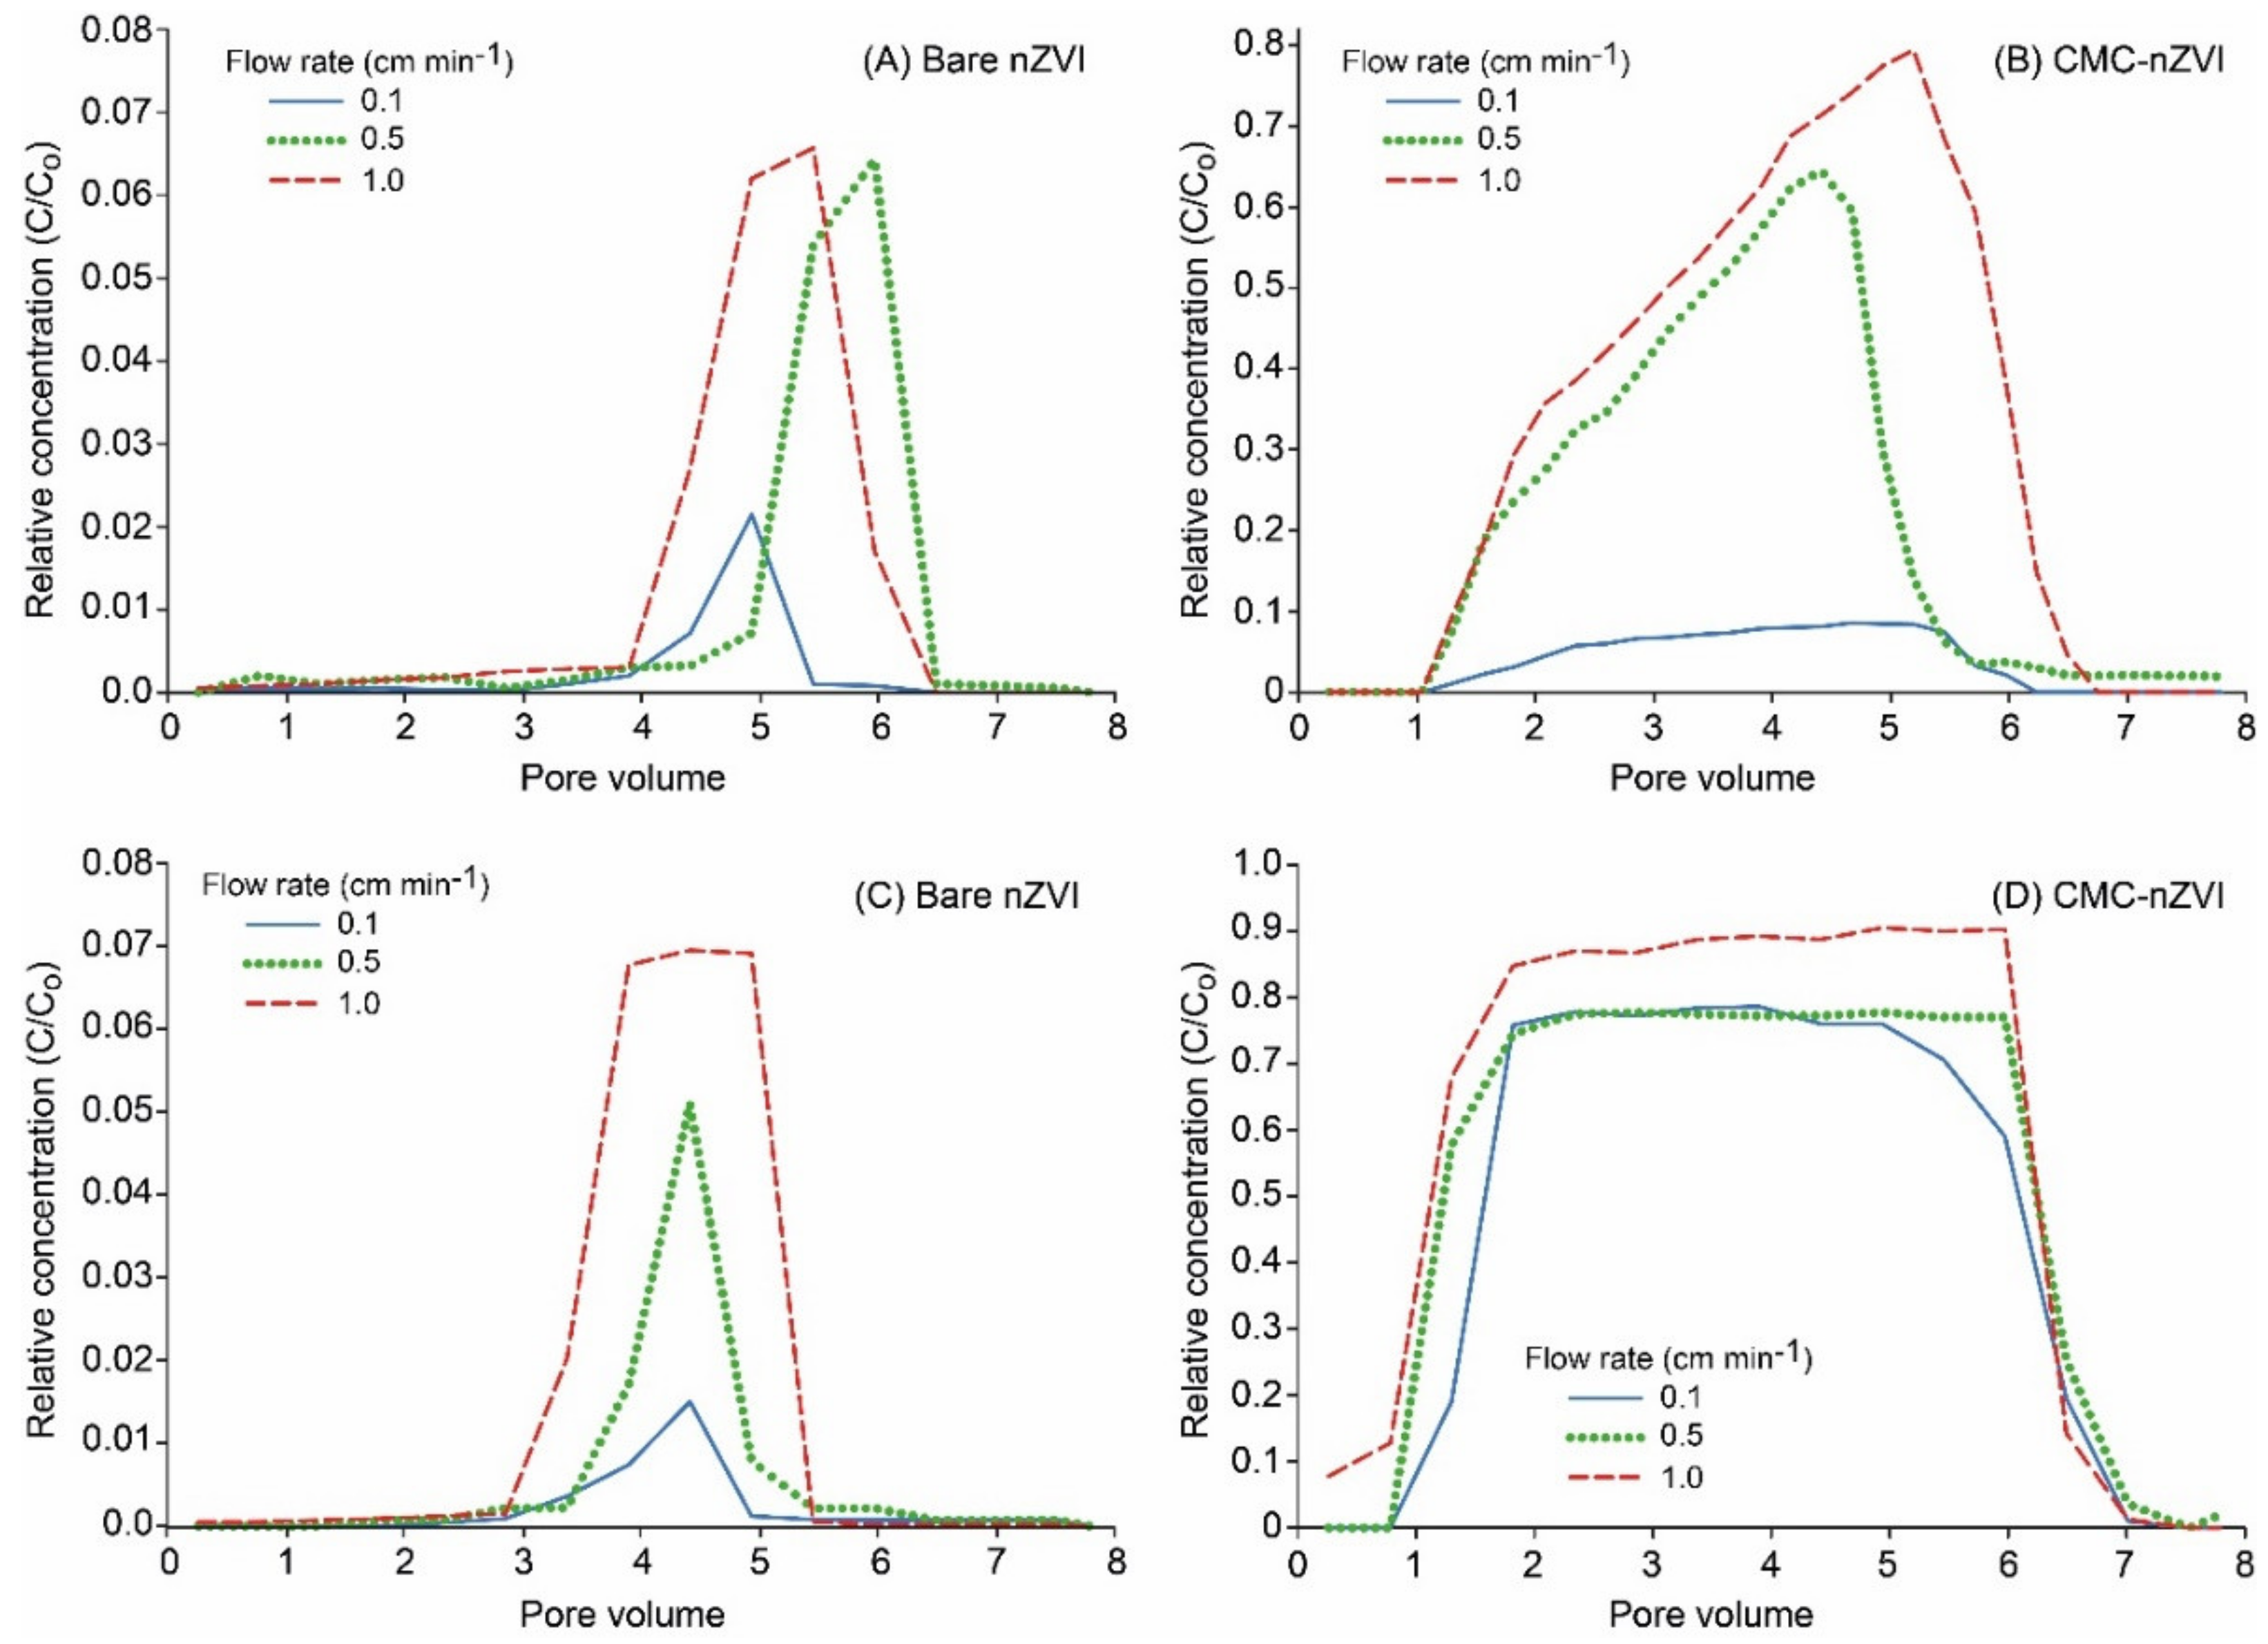
Breakthrough curves (BTCs) of nZVI showed that the relative concentration (RC) (i.e., eluted concentration normalized by the initial nZVI nanoparticle concentration) of nZVI nanoparticles was increased by increasing flow rates. This effect was more pronounced with bare nZVI particles and at lower particle concentrations (Figure 5). For example, at the particle concentration of 0.1 g L−1 and pH 9, maximum RC reached 0.02, 0.06, and 0.07 for bare nZVI particles and 0.09, 0.68, and 0.79 for CMC–nZVI particles at the flow rates 0.1, 0.5, and 1.0 cm min−1, respectively (Figure 5A,B). The increase in the eluted concentration of nZVI particles at high flow rates is usually attributed to larger drag forces on the deposited particles [33]. In addition, blocking was also suggested as a mechanism to increase the eluted concentration at high pore water velocity [34]. The reduced transport of nZVI particles at low flow rates is also related to the fact that under unsaturated flow, the transport of nZVI particles in the bulk fluid is limited, and the transport of nZVI particles will be highly associated with the interfacial forces acting at the moving air–water interface (Figure 5A,C) [35]. The increase in nZVI particle transport with the increase of the flow rate was less pronounced in the presence of CMC–nZVI particles and a particle concentration of 1.0 g L−1. The relative concentration of CMC–nZVI particles at pH 9 was increased from 0.77 to only 0.78 and 0.91 when the flow rate was increased from 0.1 to 0.5 and 1.0 cm min−1, respectively (Figure 5C,D). As the flow rates were increased, BTCs were characterized by early breakthrough and long tailing, indicting the existence of chemical and physical nonequilibrium conditions. At a flow rate of 1.0 cm min−1, the BTC of CMC–nZVI particles at pH 9 occurred early (approximately around the first pore volume, PV), and maximum RC occurred at 5 PV (Figure 5). At the flow rate of 0.1 cm min−1, the residence time of nZVI particles increases, allowing more aggregation and settling to occur, which results in a decrease in nZVI particle mobility and effluent concentrations [36]. As the flow rates increases to 0.5 and 1.0 cm min−1, the gravitational sedimentation and Brownian movement are reduced, hence the mobility of nZVI particles is enhanced [14].
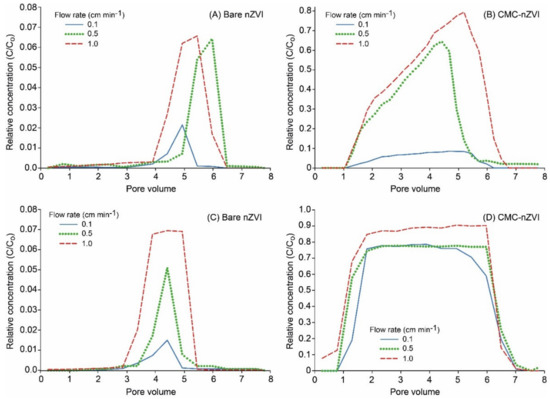
Figure 5.
Effect of the flow rate and CMC polymer stabilizer on the breakthrough curves (BTCs) of nZVI particles at pH 9, and particle concentration of 0.1 (A and B) and 1.0 g L−1 (C and D).
3.3. Effect of CMC Polymer Stabilizer and pH on the Transport of nZVI Particles
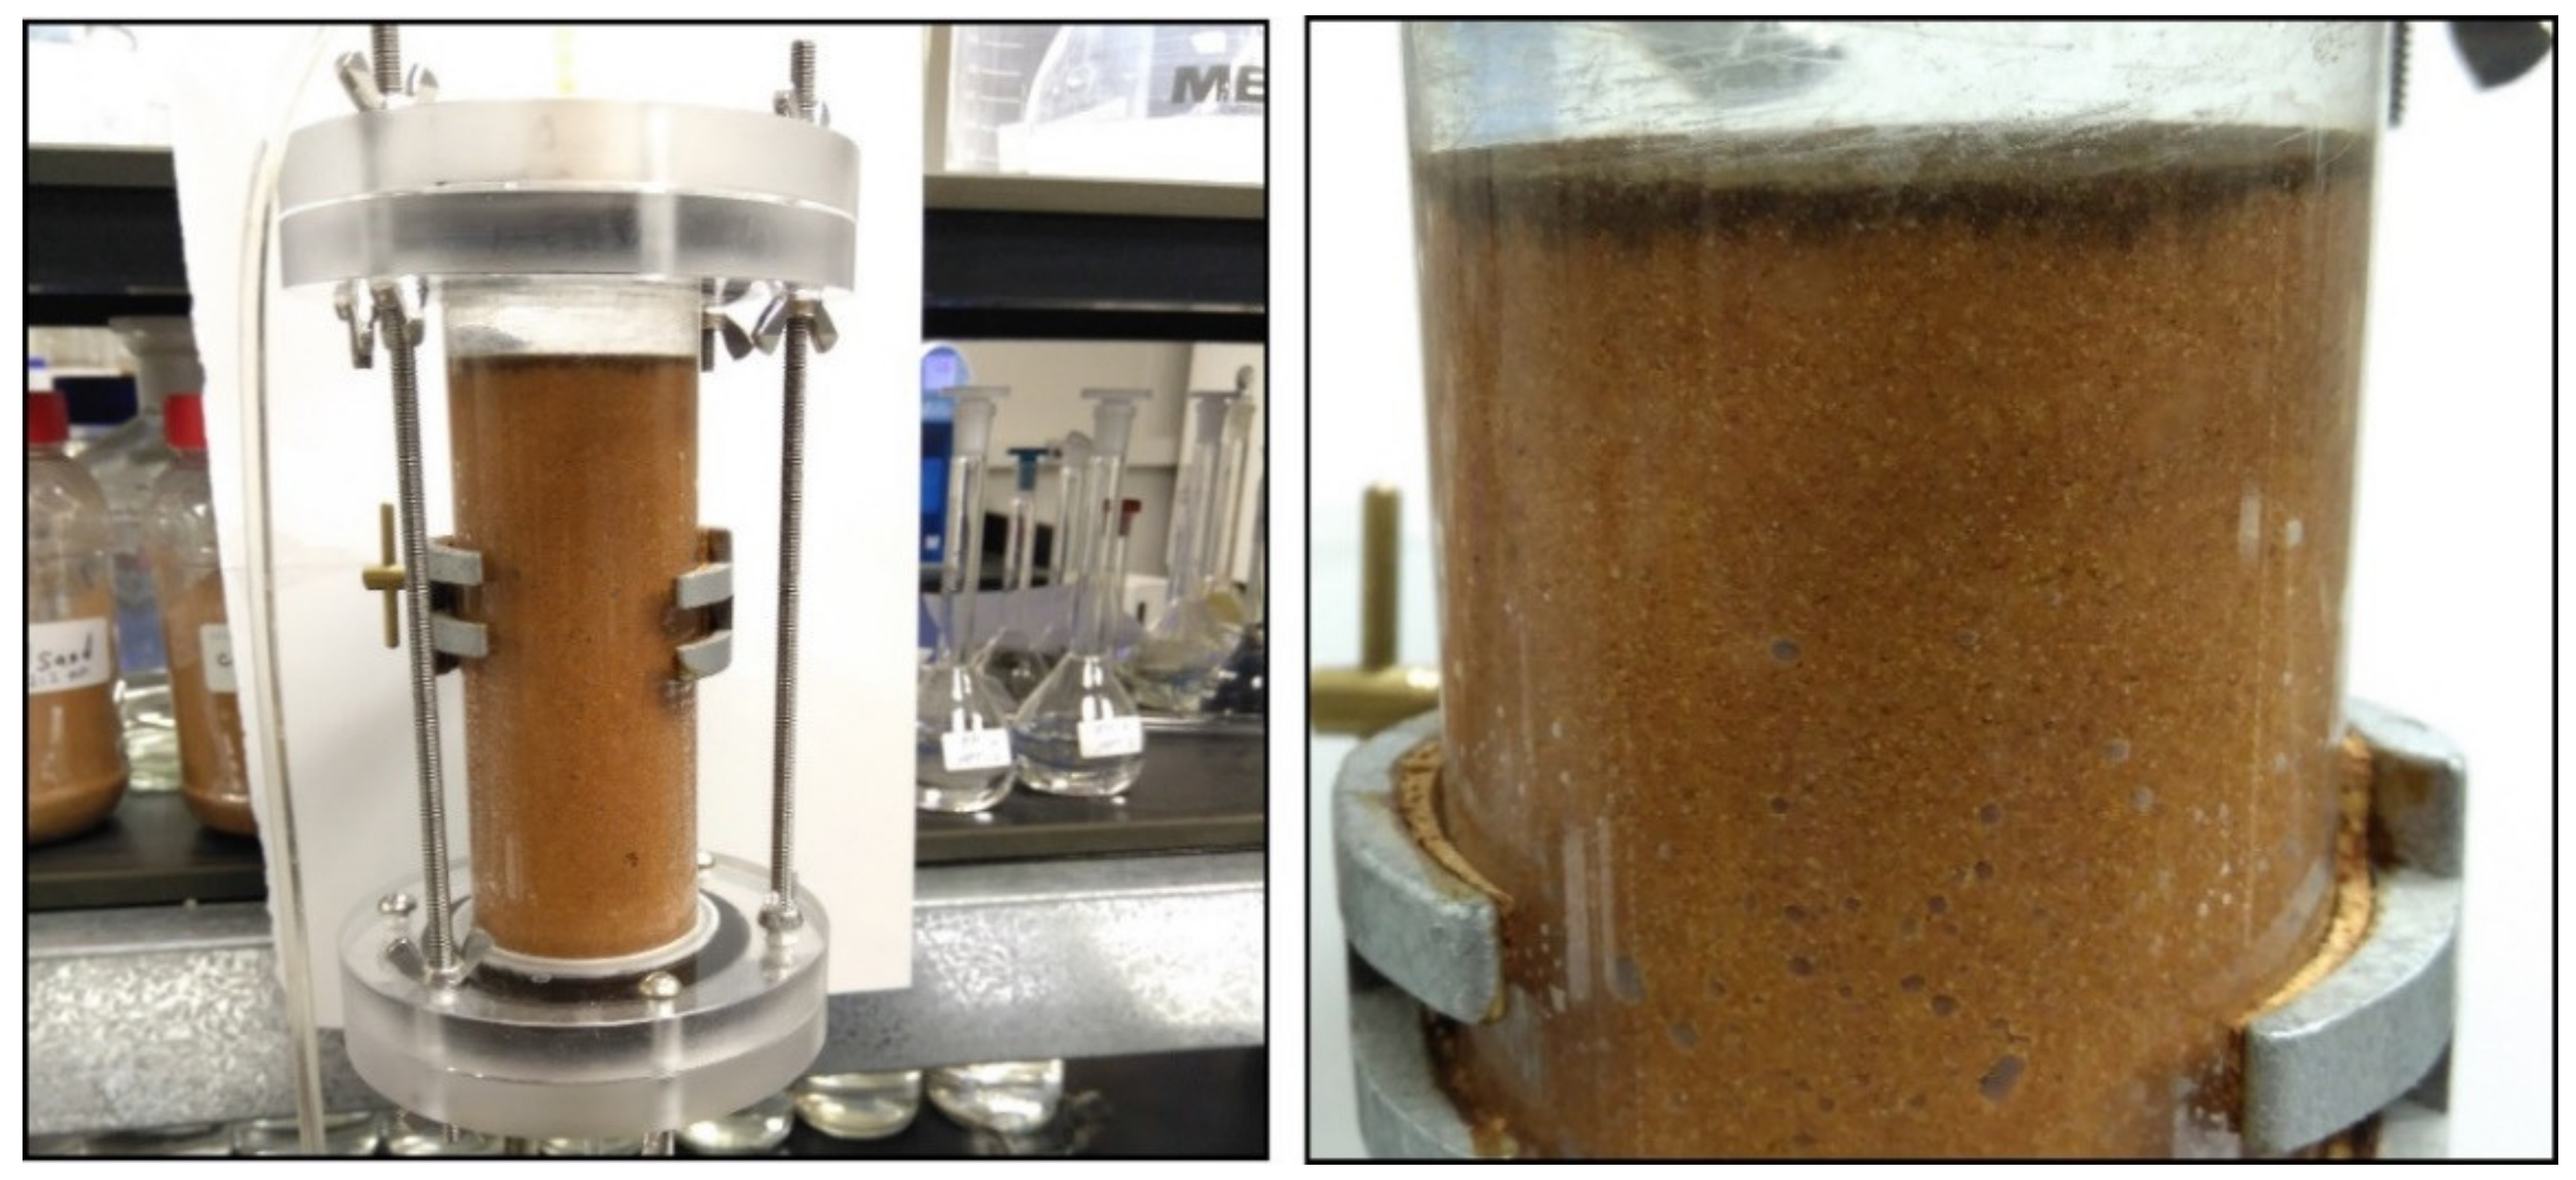
CMC polymer stabilizer greatly affected the transport of nZVI nanoparticles. At pH 7, bare nZVI nanoparticles were completely retained and deposited in the first few millimeters of the soil surface in the columns (Figure 6). The deposition of bare nZVI nanoparticle in the soil surface occurred at all flow rates (0.1, 0.5, and 1.0 cm min−1) and particle concentrations (0.1 and 1.0 g L−1), and the concentration of bare nZVI particles in the effluent was always zero or below detection (i.e., no BTC was obtained). PZC of bare nZVI particles was measured to be at pH 7.6 (Table 1), which is close to pH 7, hence maximum aggregation was expected due to the domination of attractive forces between nZVI particles. In contrast, PZC of CMC–nZVI particles was measured to be far from pH 7 (pH < 2). The zeta potential of CMC–nZVI particles at pH 7 was −20.1 mV (Table 1), indicating prolonged particle stability and better mobility in the soil. Several mechanisms were suggested for the possible retention of nZVI particles in the soil, including ripening, blocking, straining, agglomeration in the secondary minimum [37], and wedging at the contact point between nZVI particles and soil surfaces [38]. Under our experimental conditions, the size ratio between nZVI particles and the median sand size (M50 = 0.3 mm) was and for the bare and CMC–nZVI particles, respectively, which is much lower than the straining threshold value of 0.005 [39].

Figure 6.
The retention and deposition of bare nZVI nanoparticles at pH 7 in the top few millimeters of the soil column during transport experiments.
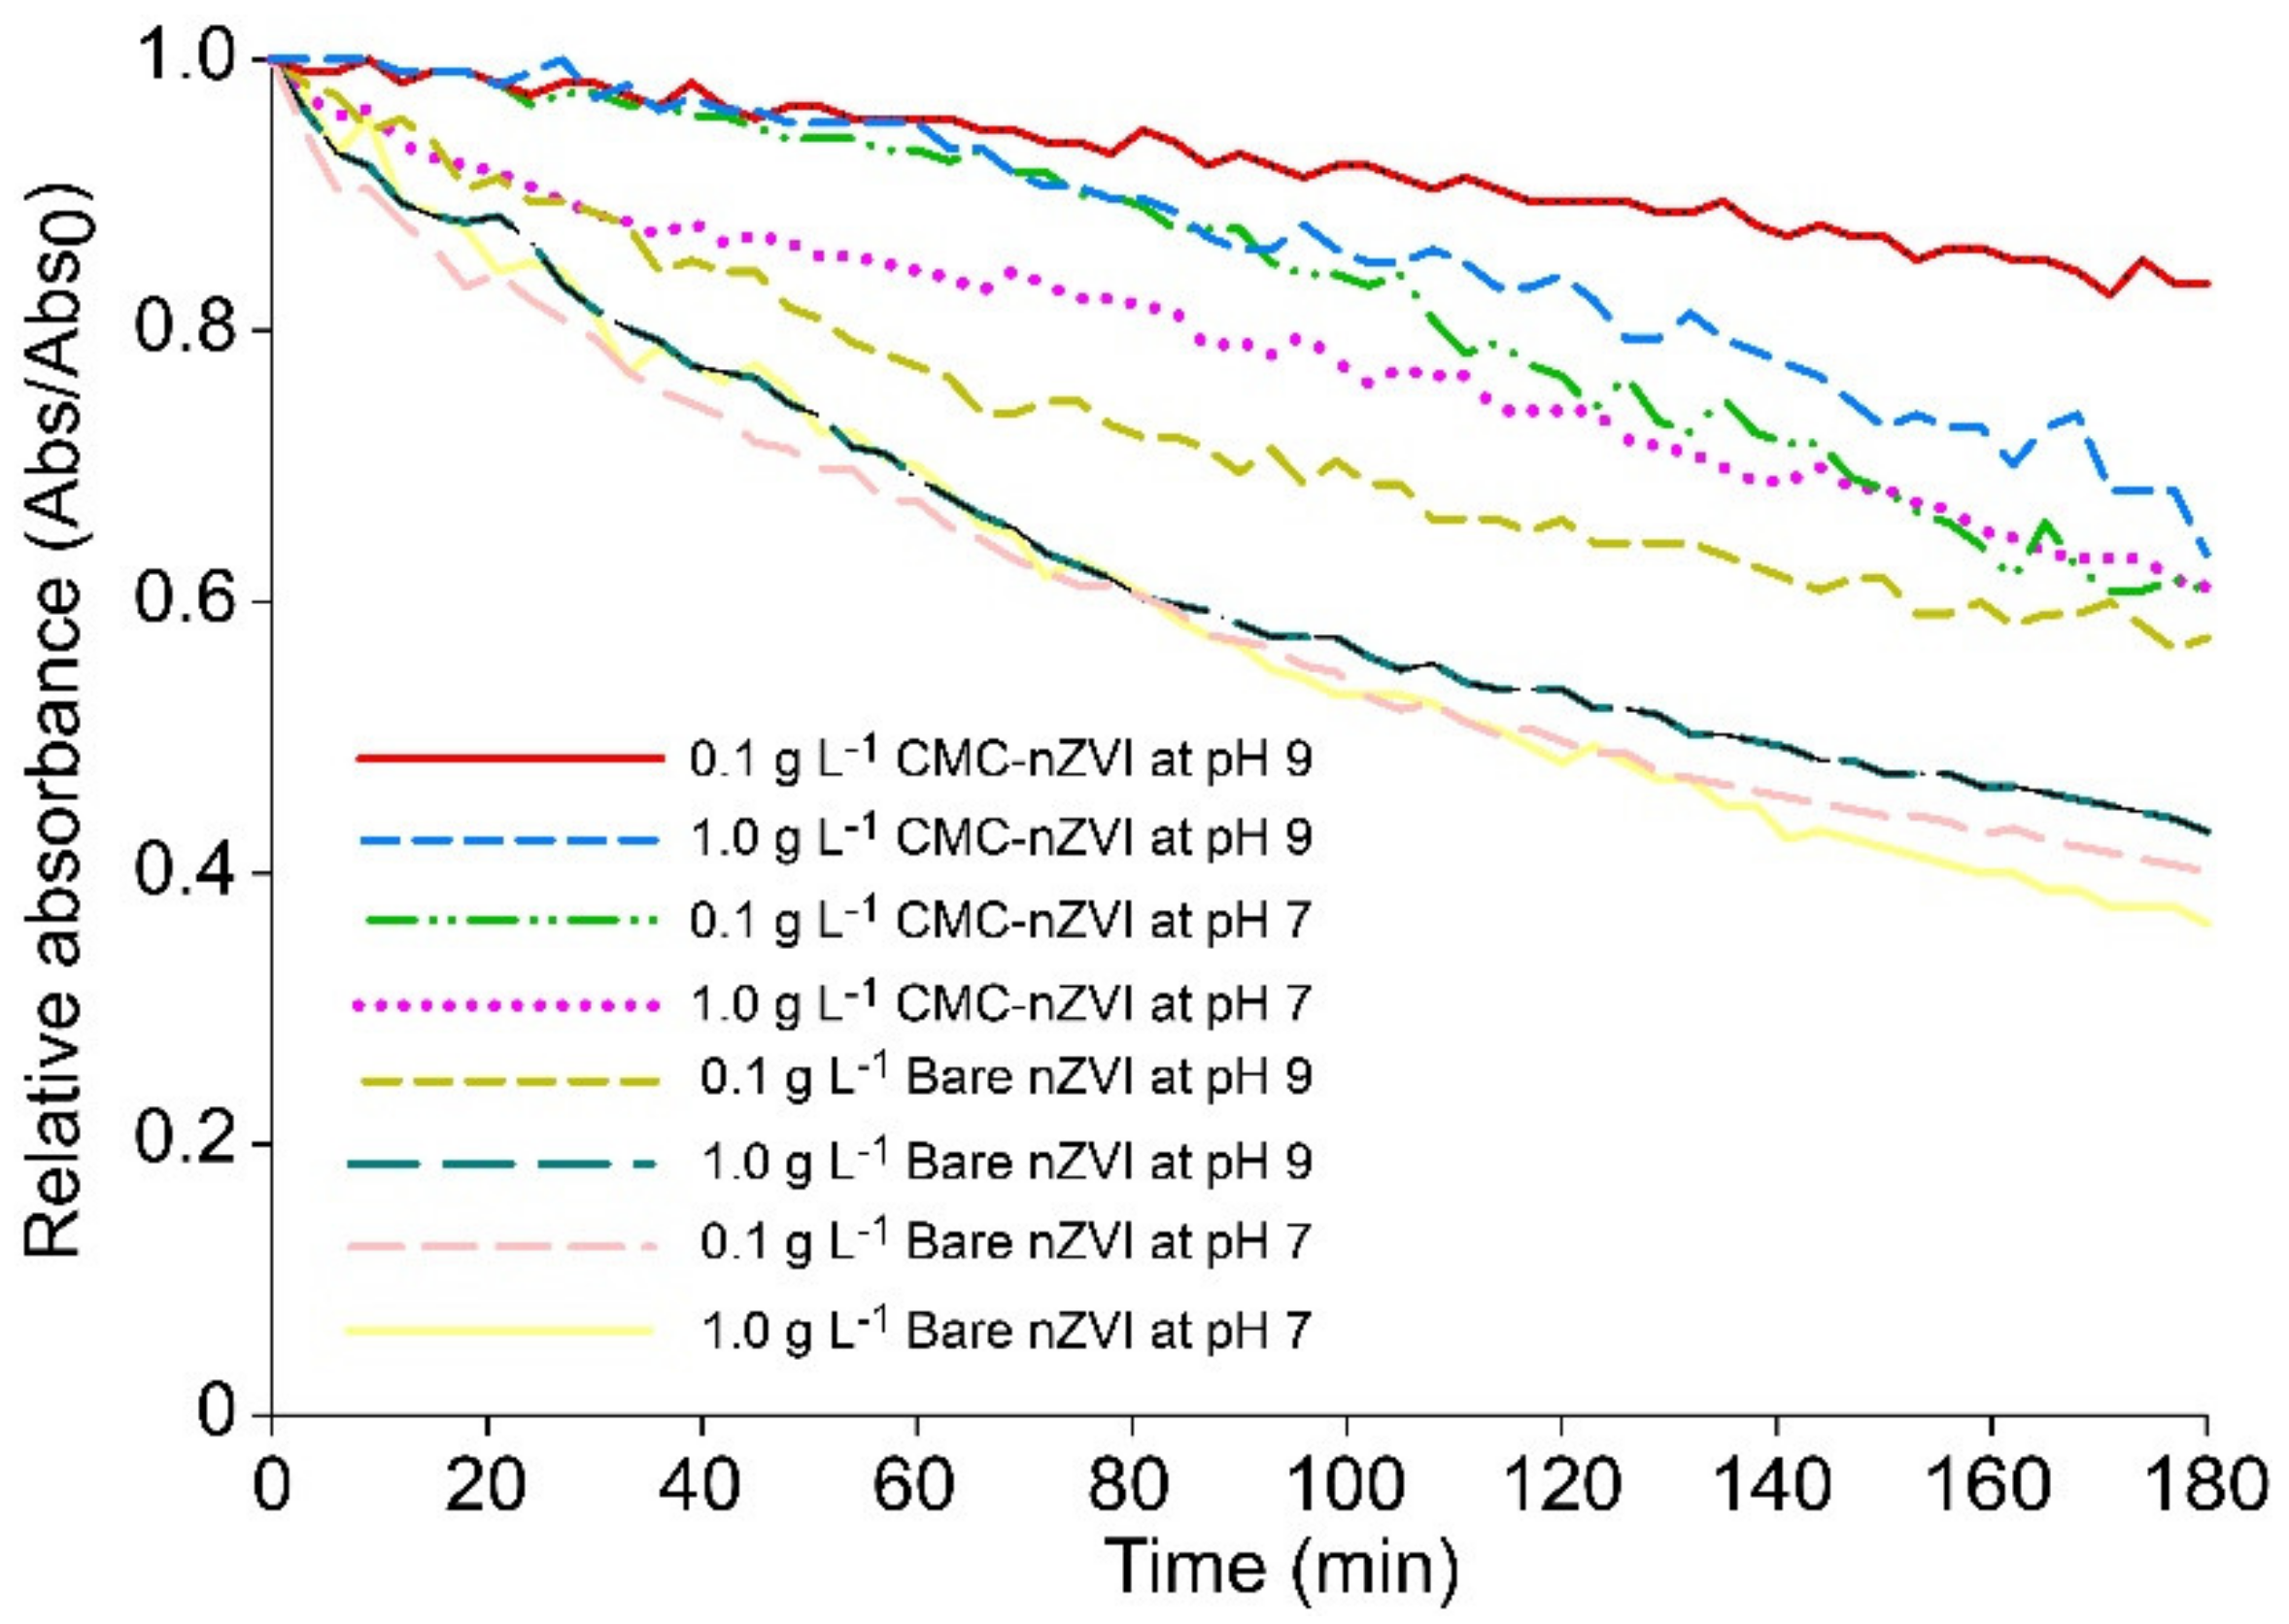
The time elapsed to run column transport and to collect the required pore volumes ranged between 60 to 120 min depending on the flow rate. The stability of nZVI particles under our experimental conditions was tested by measuring the dynamic aggregation of bare and CMC–nZVI suspensions using time-resolved optical absorbance. The relative absorbance of nZVI particles at a wavelength of 508 nm was monitored using a UV/VIS spectrophotometer (GENESYS 10S, Thermo, USA), every 3 min for a period of 3 h. During the experimental time of column transport (60–120 min), the relative absorbance of nZVI particles ranged between 0.5 to 0.78 and 0.72 to 0.98 for bare and CMC–nZVI particles, respectively (Figure 7). These results indicate that the retention of bare nZVI particles in the first few millimeters of the surface of the soil in the columns was mainly attributed to the deposition of particles after injection.
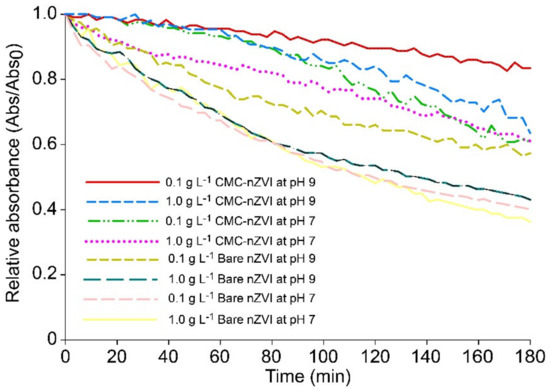
Figure 7.
Effect of CMC polymer stabilizer, particle concentration, and pH on the stability of nZVI particles.
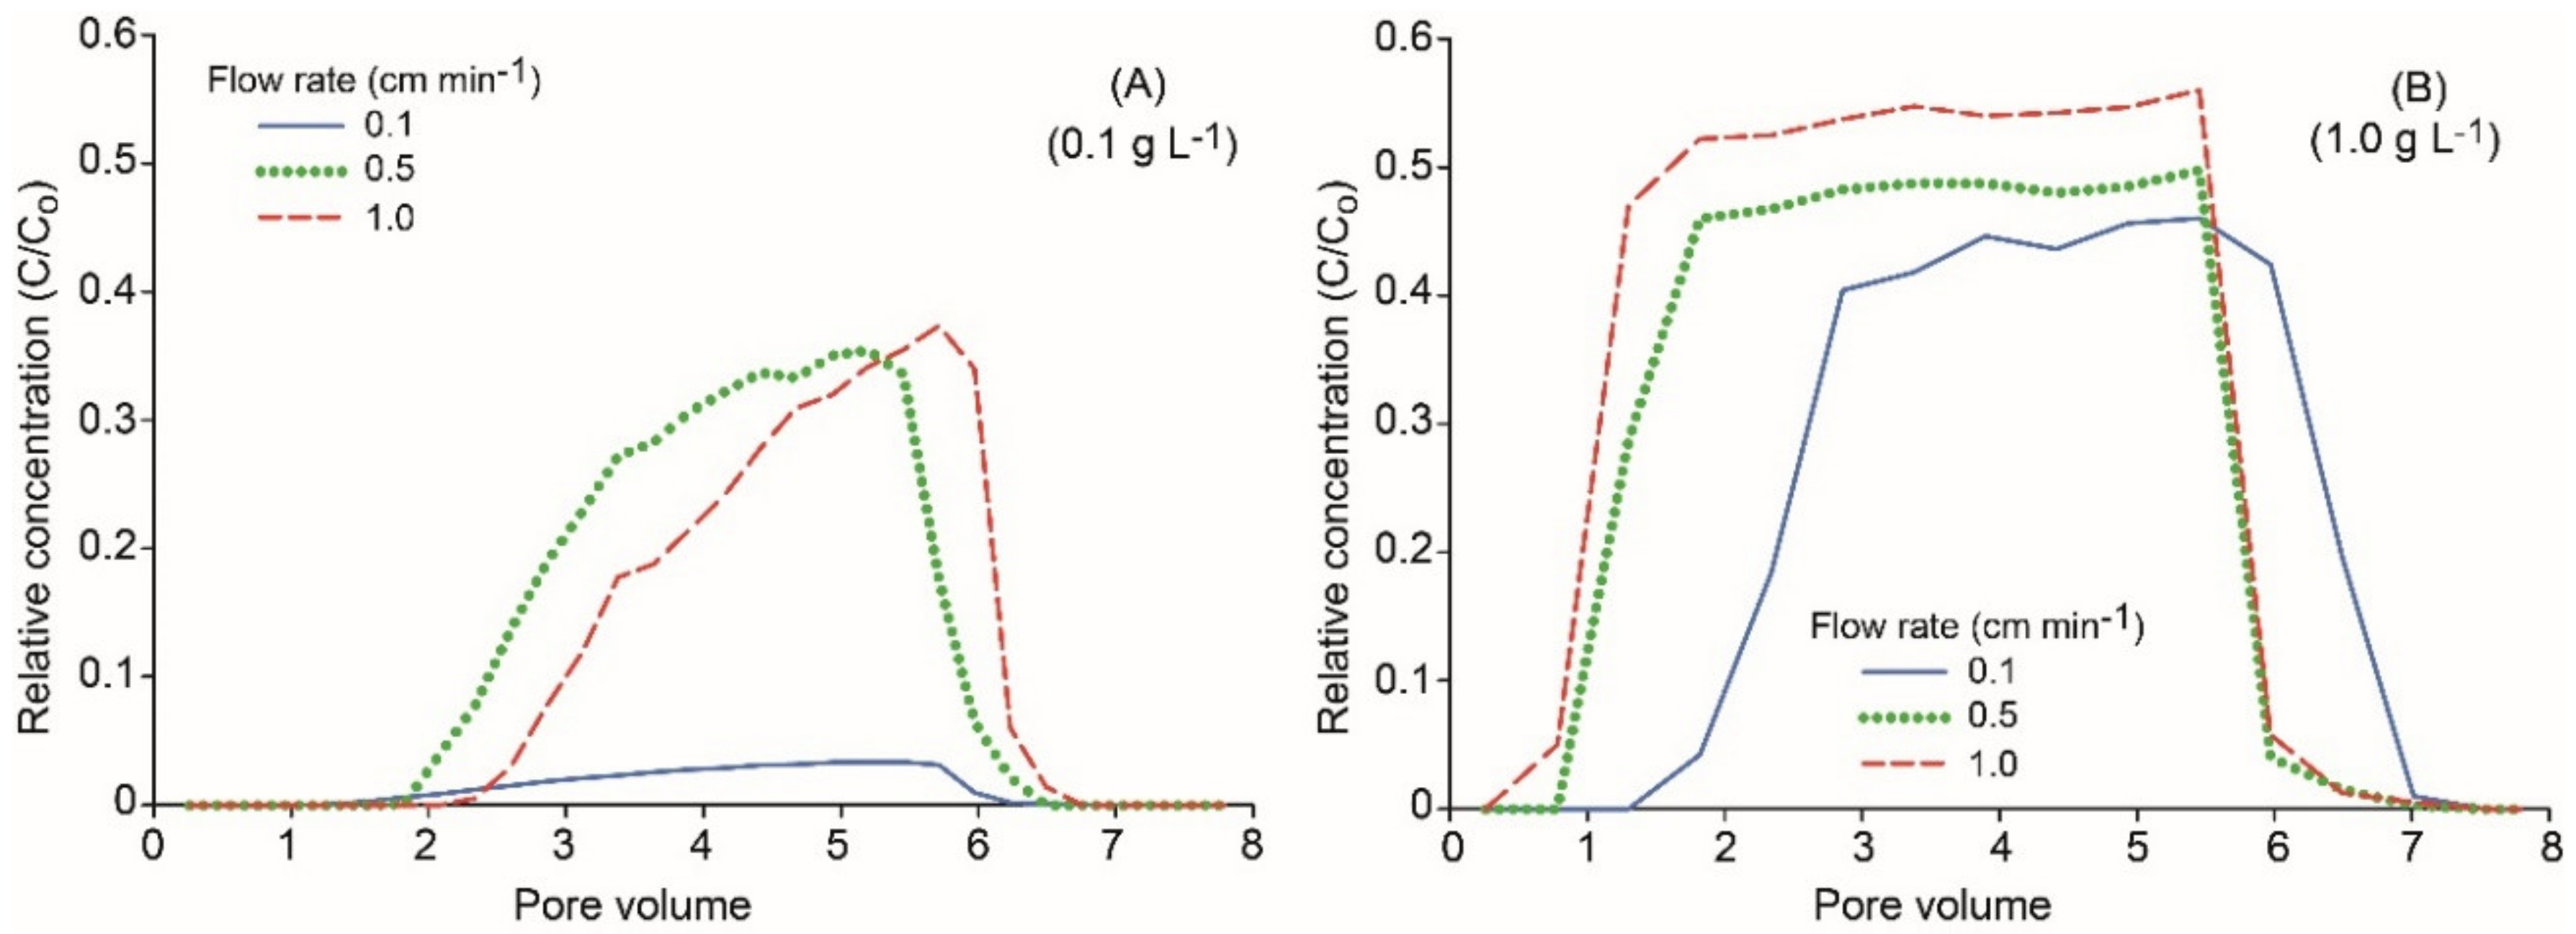
The BTC of CMC–nZVI particles at pH 7 showed that the particle concentration greatly affected the maximum RC, in particular with the lowest flow rate of 0.1 cm min−1, where RC of CMC–nZVI particles reached 0.03 and 0.46 for the 0.1 and 1.0 g L−1 particle concentration, respectively (Figure 8). The shape of the BTC in the case of the larger CMC–nZVI nanoparticle concentration (1.0 g L−1) was characterized by a long plateau at the maximum relative concentration. This is a typical shape for BTCs of the transport of solutes/particles present in large concentrations. These results are consistent with previous reports of a larger release and higher RC of CMC–nZVI particles in case of larger particle concentrations [40].
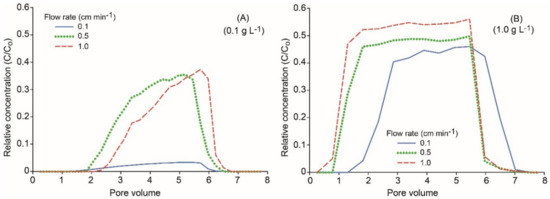
Figure 8.
Effect of flow rate and particle concentration of 0.1 (A) and 1.0 g L−1 (B) on the breakthrough curves (BTCs) of CMC–nZVI particles at pH 7.
The RC of CMC–nZVI particles was always larger at pH 9 as compared to RC at pH 7. This is mainly attributed to the increased nZVI particle stability at higher pH due to the increase in the electrostatic repulsion forces and the formation of larger energy barriers [41]. In addition, possible detachment of nZVI particles and the reversibility of aggregation in the secondary minimum has been reported to occur in the presence of polymer stabilizers [42]. Stable CMC–nZVI nanoparticles are smaller in size (<100 nm), and have large zeta potential values (<−20 mV) (Table 1); therefore, these particles will remain suspended in solution for a long time, which facilitates their transport to deeper depths.
At pH 9 and particle concentration of 0.1 g L−1, the RC of CMC–nZVI particles, as compared to the relative concentration at pH 7, was increased by 183%, 91%, and 107% at the flow rates of 0.1, 0.5, and 1.0 cm min−1, respectively (Figure 5D and Figure 8B). The large percentage of increase at the lowest flow rate is attributed to the long residence time of the CMC–nZVI nanoparticles inside the soil column, which allows more time for particle transport.
The same trend was also observed at the CMC nZVI particle concentration of 1.0 g L−1, where the RC of CMC–nZVI particles at pH 9 was increased by 67%, 56%, and 62%, as compared to RC of CMC–nZVI particles at pH 7, at the flow rates of 0.1, 0.5, and 1.0 cm min−1, respectively (Figure 5D and Figure 8B). Similar results were reported by Kim et al. [18], who found that varying the pH could limit nZVI particle transport by affecting the surface charge of nZVI nanoparticles, which subsequently affects its aggregation, and deposition to porous media. They indicated that aggregation and deposition increased with decreasing pH, especially in the range 6–8. Therefore, they recommended avoiding this pH range to enhance the transport of nZVI particles, by minimizing aggregation and deposition, when preparing nZVI suspensions for environmental application.
3.4. Amount of nZVI Particles Eluted
The total amount of nZVI particles added to each soil column at particle concentrations 0.1 and 1.0 g L−1 was 38.5 and 385 mg, respectively. Larger amounts of nZVI particles were eluted with the presence of CMC, pH values far from PZC (i.e., pH 9), larger flow rates, and larger particle concentrations (Table 2). The presence of CMC polymer stabilizer was the most important factor. In the absence of CMC, bare nZVI particles at pH 7 were totally retained in the soil column regardless of the flow rate or the nZVI particle concentration. Even at pH 9, where the solution chemistry favors more stability and greater transport, the amount of bare nZVI particles eluted did not exceed 1.2% of the total amount added (Table 2). These findings emphasize the importance of the addition of polymer stabilizer to nZVI nanoparticles to ensure better stability and enhanced efficiency when being applied in environmental applications [13,14,15].
Table 2.
Effect of flow rate, pH, and particle concentration on the amount eluted and retained of bare and CMC–nZVI particles during column transport.
The flow rate was the second important factor controlling the amount of nZVI eluted. At the lowest flow rate (0.1 cm min−1), the percentage of the 0.1 g L−1 CMC–nZVI particles eluted from the soil column was only 2.1% and 5.9% from the total amount added at pH 7 and 9, respectively. This percentage was increased to 17.7% and 33% at the flow rate of 0.5 cm min−1 and pH 7 and 9, respectively. The maximum percentage of the amount of CMC–nZVI nanoparticles eluted was observed with the highest flow rate of 1.0 cm min−1 and reached 19.9% and 52% at pH 7 and 9, respectively. The same trend was also observed for the 1.0 g L-1 CMC–nZVI particles but to a lesser extent.
The nZVI particle concentration had a significant effect on the total amount of CMC–nZVI particles eluted only at the lowest flow rate, where an increase from 2.1% to 18.1% at pH 7, and from 5.9% to 36.8% at pH 9 were observed when the particle concentration was increased from 0.1 to 1.0 g L−1, respectively (Table 2). Less variation in the eluted amount of the CMC–nZVI particles as affected by the particle concentration were observed with the flow rates were 0.5 and 1.0 cm min−1.
4. Conclusions
We investigated the effect of CMC polymer stabilizer, pH, nZVI particle concentration, and flow rate on the transport and deposition of nZVI particles in sand columns. Surface modification of nZVI particles using CMC increased the total surface area by almost 100% more than that of bare nZVI particles. CMC increased the zeta potential of nZVI particles by two fold as compared to that of bare nZVI particles. These findings were consistent with the DLVO calculations, which showed a greater increase in the electrical double layer repulsion forces in the presence of CMC. The relative concentration of nZVI effluent was increased by the presence of CMC and by increasing the flow rate. In the absence of CMC, bare nZVI particles were totally retained (>0.98%) in the top few millimeters of the soil column regardless of the flow rate or nZVI particle concentration. At the 0.1 cm min−1 flow rate, greater nZVI particle deposition was observed and the relative concentration of nZVI effluent was less due to an increased residence time, which increased the aggregation and settlement of particles. The BTCs of CMC–nZVI effluent were characterized by early breakthrough (~1.0 PV) and long tailing, indicting the existence of chemical and physical nonequilibrium conditions. The BTC of bare nZVI particles occurred at approximately 3.0 PV and the effect of long tailing was not present. The average amount of eluted nZVI was increased from 0.2%, 0.7%, and 1.1% for bare nZVI particles to 15.7%, 28.3%, and 36.1% for CMC–nZVI particles at the flow rates of 0.1, 0.5, and 1.0 cm min−1, respectively. Our results emphasize the importance of identifying a favorable solution chemistry for more stable nZVI particles, and appropriate flow rates for enhanced transport to ensure effective and efficient application of nZVI particles in remediation of contaminated soil and groundwater resources. Caution should be taken to prevent uncontrolled dispersion of nZVI particles, which could cause environmental problems, in particular with the possibility of facilitated transport of heavy metals and other contaminants attached to nZVI particle surfaces to deeper subsurface layers.
Author Contributions
Conceptualization, H.M.I. and M.A.; methodology, H.M.I. and M.A.; software, H.M.I.; validation, H.M.I. and M.A.; formal analysis, H.M.I. and M.A.; investigation, H.M.I., M.A., A.S.A.-F. and A.M.A.-T.; resources, H.M.I., A.S.A.-F., and A.M.A.-T.; data curation, H.M.I. and M.A.; writing—original draft preparation, H.M.I. and M.A.; writing—review and editing, H.M.I., A.S.A.-F., A.M.A.-T.; visualization, H.M.I., and A.S.A.-F.; supervision, H.M.I., and A.S.A.-F.; project administration, H.M.I.; funding acquisition, A.M.A.-T., A.S.A.-F., and H.M.I.
Funding
This research was funded by the National Plan for Science, Technology and Innovation (MAARIFAH), King Abdulaziz City for Science and Technology, Kingdom of Saudi Arabia, Award Number 11-NAN1487-02.
Conflicts of Interest
The authors declare no conflict of interest.
Appendix A. Equations Used for the Calculation of the DLVO Interactions
The total interaction energy was calculated as the sum of the electrostatic double layer force (EDL) and the van der Waals force (VDW). The total interaction energy between nZVI–nZVI particles was calculated based on sphere–sphere interaction. Calculation of the electrostatic double layer repulsion interaction was carried out according to Bhattacharjee and Elimelech [43] as:
The retarded van der Waals interaction energies for nZVI–nZVI nanoparticles was calculated according to Gregory [44] as:
The definition and measurement units of all symbols used are listed in Table A1.
Table A1.
Definition and measurement units of symbols used in the calculation of the total interaction energy of nZVI particles.
Table A1.
Definition and measurement units of symbols used in the calculation of the total interaction energy of nZVI particles.
| Symbol | Definition | Units/Comments |
|---|---|---|
| kB | Boltzmann Constant | J K−1 |
| T | Absolute Temperature | oK |
| e | Electron Charge | Coulomb |
| The Radius of the First Interacting nZVI | nm | |
| The Radius of the Second Interacting nZVI | nm | |
| The Bulk Number Density of Ions | - | |
| The Inverse Debye–Huckel Length | m | |
| The Surface Potentials of Interacting nZVI | mV | |
| The Separation Distance between two Particles | nm | |
| The Hamaker Constant for nZVI–water–nZVI | 3.5 × 10⁻²⁰ J | |
| The Characteristics Wavelength of the Interaction | 100 nm |
References
- Zhang, M.; He, F.; Zhao, D.; Hao, X. Transport of stabilized iron nanoparticles in porous media: Effects of surface and solution chemistry and role of adsorption. J. Hazard. Mater. 2017, 322, 284–291. [Google Scholar] [CrossRef] [PubMed]
- Grieger, K.; Fjordboge, A.; Hartmann, N.; Eriksson, E.; Bjerg, P.; Baun, A. Environmental benefits and risks of zero-valent iron nanoparticles (nZVI) for in situ remediation: Risk mitigation of trade-off. J. Contam. Hydrol. 2010, 118, 165–183. [Google Scholar] [CrossRef] [PubMed]
- Wang, C.; Zhang, W. Synthesizing nanoscale iron particles for rapid and complete dechlorination of TCE and PCBs. Environ. Sci. Technol. 1997, 31, 2154–2156. [Google Scholar] [CrossRef]
- Elliott, D.; Lien, H.; Zhang, W. Degradation of lindane by zero-valent iron nanoparticles. J. Environ. Eng. 2009, 135, 317–324. [Google Scholar] [CrossRef]
- Zhigang, Y.; Liming, H.; Irene, M. Transport of the arsenic (As)-loaded nano zero-valent iron in hroundwater-saturated sand columns: Roles of surface modification and As loading. Chemosphere 2019, 216, 428–436. [Google Scholar]
- Ponder, S.; Darab, J.; Mallouk, T. Remediation of Cr(VI) and Pb(II) aqueous solutions using supported nanoscale zero-valent iron. Environ. Sci. Technol. 2000, 34, 2564–2569. [Google Scholar] [CrossRef]
- Jiang, Z.; Lv, L.; Zhang, W.; Du, Q.; Pan, B.; Yang, L.; Zhang, Q. Nitrate reduction using nanosized zero-valent iron supported by polystyrene resins: Role of surface functional groups. Water Res. 2011, 45, 2191–2198. [Google Scholar] [CrossRef]
- Su, C.; Puls, R. Nitrate reduction by zerovalent iron: Effects of formate, oxalate, citrate, chloride, sulfate, borate, and phosphate. Environ. Sci. Technol. 2004, 38, 2715–2720. [Google Scholar] [CrossRef]
- Zhang, W. Nanoscale iron particles for environmental remediation: An overview. J. Nanopart. Res. 2003, 5, 323–332. [Google Scholar] [CrossRef]
- Yuan, S.; Li, Q.; Zhang, W.; Wang, P. A method for the preparation of stable dispersion of zero-valent iron nanoparticles. Colloids Surf. Physicochem. Eng. Asp. 2007, 308, 60–66. [Google Scholar]
- Tiraferri, A.; Chen, K.; Sethi, R.; Elimelech, M. Reduced aggregation and sedimentation of zero-valent iron nanoparticles in the presence of guar gum. J. Colloid Interface Sci. 2008, 324, 71–79. [Google Scholar] [CrossRef] [PubMed]
- Wu, L.; Shamsuzzoha, M.; Ritchie, S. Preparation of cellulose acetate supported zero-valent iron nanoparticles for the dechlorination of trichloroethylene in water. J. Nanopart. Res. 2005, 7, 469–476. [Google Scholar] [CrossRef]
- Chris, M.; Denis, M.; Sleep, E. Impact of nZVI stability on mobility in porous media. J. Contam. Hydrol. 2013, 145, 17–25. [Google Scholar]
- He, F.; Zhang, M.; Qian, T.; Zhao, D. Transport of carboxy methyl cellulose stabilized iron nanoparticles in porous media: Column experiments and modeling. J. Colloid Interface Sci. 2009, 334, 96–102. [Google Scholar] [CrossRef] [PubMed]
- Raychoudhury, T.; Tufenkji, N.; Ghoshal, S. Aggregation and deposition kinetics of carboxymethyl cellulose-modified zero valent iron nanoparticles in porous media. Water Res. 2012, 46, 1735–1744. [Google Scholar] [CrossRef] [PubMed]
- Raychoudhury, T.; Naja, G.; Ghoshal, S. Assessment of transport of two polyelectrolyte-stabilized zero valent iron nanoparticles in porous media. J. Contam. Hydrol. 2010, 118, 143–151. [Google Scholar] [CrossRef] [PubMed]
- Wang, D.; Park, C.; Masud, A.; Aich, N.; Su, C. Carboxymethylcellulose Mediates the Transport of Carbon Nanotube—Magnetite Nanohybrid Aggregates in Water-Saturated Porous Media. Environ. Sci. Technol. 2017, 51, 12405–12415. [Google Scholar] [CrossRef] [PubMed]
- Kim, H.; Phenrat, T.; Tilton, R.; Lowry, G. Fe0 nanoparticles remain mobile in porous media after aging due to slow desorption of polymeric surface modifiers. Environ. Sci. Technol. 2009, 43, 3824–3832. [Google Scholar] [CrossRef]
- Phenrat, T.; Kim, H.; Fagerlund, F.; Illangasekare, T.; Tilton, R.; Lowry, G. Particle size distribution, concentration, and magnetic attraction affect transport of polymer-modified Fe0 nanoparticles in sand columns. Environ. Sci. Technol. 2009, 43, 5079–5085. [Google Scholar] [CrossRef]
- Saleh, N.; Sirk, K.; Liu, Y.; Phenrat, T.; Dufour, B.; Matyjaszewski, K.; Tilton, R.; Lowry, G. Surface modifications enhance nanoiron transport and NAPL targeting in saturated porous media. Environ. Eng. Sci. 2007, 24, 45–57. [Google Scholar] [CrossRef]
- Fatisson, J.; Ghoshal, S.; Tufenkji, N. Deposition of carboxymethylcellulose-coated zero-valent iron nanoparticles onto silica: Roles of solution chemistry and organic molecules. Langmuir 2010, 26, 12832–12840. [Google Scholar] [CrossRef] [PubMed]
- Xu, Y.; Zhao, D. Reductive immobilization of chromate in water and soil using stabilized iron nanoparticles. Water Res. 2007, 41, 2101–2108. [Google Scholar] [CrossRef] [PubMed]
- Li, J.; Bhattacharjee, S.; Ghoshal, S. The effects of viscosity of carboxymethyl cellulose on aggregation and transport of nanoscale zerovalent iron. Colloids Surf. Physicochem. Eng. Asp. 2015, 481, 451–459. [Google Scholar] [CrossRef]
- Wang, D.; Ge, L.; He, J.; Zhang, W.; Jaisi, D.; Zhou, D. Hyperexponential and nonmonotonic retention of polyvinylpyrrolidone-coated silver nanoparticles in an Ultisol. J. Contam. Hydrol. 2014, 164, 35–48. [Google Scholar] [CrossRef] [PubMed]
- Wang, D.; Jaisi, D.; Yan, J.; Jin, Y.; Zhou, D. Transport and retention of polyvinylpyrrolidone-coated silver nanoparticles in natural soils. Vadose Zone J. 2015, 14. [Google Scholar] [CrossRef]
- Sparks, D.; Page, A.; Helmke, P.; Leoppert, R.; Soltanpour, P.; Tabatabai, M.; Johnston, G.; Sumner, M. Methods of Soil Analysis; Soil Science Society of America: Madison, WI, USA, 1996. [Google Scholar]
- Dane, J.; Topp, G. Methods of Soil Analysis; Dane, J., Topp, G., Eds.; Soil Science Society of America: Madison, WI, USA, 2002. [Google Scholar]
- Reynolds, W.; Elrick, D.; Youngs, E.; Amoozegar, A.; Booltink, H.; Bouma, J. Saturated and field-saturated water flow parameters. In Methods of Soil Analysis; Dane, J.H., Topp, G.C., Eds.; Soil Science Society of America: Madison, WI, USA, 2002. [Google Scholar]
- Verwey, J.; Overbeek, J. Theory of the Stability of Lyophobic Colloids; Elsevier: Amsterdam, The Netherlands, 1948. [Google Scholar]
- IBM Corp. SPSS, Inc. IBM SPSS Statistics, 21st ed.; International Business Machines Corp: Boston, MA, USA, 2012. [Google Scholar]
- Cirtiu, M.; Raychoudhury, T.; Ghoshal, S.; Moores, A. Systematic comparison of the size, surface characteristics and colloidal stability of zero valent iron nanoparticles pre and post-grafted with common polymers. Colloids Surfaces A Physicochem. Eng. Asp. 2011, 390, 95–104. [Google Scholar] [CrossRef]
- Chena, S.; Bediab, J.; Lia, H.; Yao, L.; Naluswataa, F.; Belver, C. Nanoscale zero-valent iron mesoporous hydrated silica core-shell particles with enhanced dispersibility, transportability and degradation of chlorinated aliphatic hydrocarbons. Chem. Eng. J. 2018, 343, 619–628. [Google Scholar] [CrossRef]
- Torkzaban, S.; Bradford, S.; Walker, S. Resolving the coupled effects of hydrodynamics and DLVO forces on colloid attachment in porous media. Langmuir 2007, 23, 9652–9660. [Google Scholar] [CrossRef]
- Li, Y.; Wang, Y.; Pennell, K.; Briola, L. Investigation of the transport and deposition of fullerene (C60) nanoparticles in quartz sands under varying flow conditions. Environ. Sci. Technol. 2008, 42, 7174–7180. [Google Scholar] [CrossRef]
- Prabhakar, S.; Abdou, H.; Flury, M. Effect of the lower boundary condition and floatation on colloid mobilization in unsaturated sandy sediments. Vadose Zone J. 2008, 7, 930–940. [Google Scholar]
- Johnson, R.; Johnson, G.; Nurmi, J.; Tratnyek, P. Natural organic matter enhanced mobility of nano zerovalent iron. Environ. Sci. Technol. 2009, 43, 5455–5460. [Google Scholar] [CrossRef]
- Hosseini, S.; Tosco, T. Transport and retention of high concentrated nano-Fe/Cu particles through highly flow-rated packed sand column. Water Res. 2013, 47, 326–338. [Google Scholar] [CrossRef] [PubMed]
- Raychoudhury, T.; Tufenkji, N.; Ghoshal, S. Straining of polyelectrolyte-stabilized nanoscale zero valent iron particles during transport through granular porous media. Water Res. 2014, 50, 80–89. [Google Scholar] [CrossRef] [PubMed]
- Bradford, S.; Bettahar, M.; Simunek, J.; van Genuchten, M. Straining and attachment of colloids in physically heterogeneous porous media. Vadose Zone J. 2004, 3, 384–394. [Google Scholar] [CrossRef]
- Saberinasr, A.; Rezaei, M.; Nakhaei, M.; Hosseini, S. Transport of CMC-Stabilized nZVI in saturated sand column: The effect of particle concentration and soil grain. Water Air Soil Pollut. 2016, 227, 394. [Google Scholar] [CrossRef]
- Street, A.; Sustich, R.; Duncan, J.; Savage, N. Nanotechnology Application for Clean Water: Solutions for Improving Water Quality; Street, A., Sustich, R., Duncan, J., Savage, N., Eds.; Elsevier Science: Burlington, NJ, USA, 2014. [Google Scholar]
- Hahn, M.; O’Melia, C. Deposition and reentrainment of Brownian particles in porous media under unfavorable chemical conditions: Some aspects and applications. Environ. Sci. Technol. 2004, 38, 210–220. [Google Scholar] [CrossRef]
- Bhattacharjee, S.; Elimelech, M. Surface element integration: A novel technique for evaluation of DLVO interaction between a particle and a flat plate. J. Colloid Interface Sci. 1997, 193, 273–285. [Google Scholar] [CrossRef]
- Gregory, J. Approximate expressions for retarded van der Vaals interaction. J. Colloid Interface Sci. 1981, 51, 44–51. [Google Scholar] [CrossRef]
© 2019 by the authors. Licensee MDPI, Basel, Switzerland. This article is an open access article distributed under the terms and conditions of the Creative Commons Attribution (CC BY) license (http://creativecommons.org/licenses/by/4.0/).