Abstract
Capital flows are key variables supporting the sustainability of economic growth. Based on a dataset of 31 provinces in China over 1997–2014, this paper utilizes the system generalized method of moments (System GMM) to investigate the determinants of capital flows and analyses the impact of government size on capital flows. Preliminary results show that government size exerts a negative effect on capital inflows. Specifically, government spending on capital construction and administration crowds out capital inflows significantly, while government spending on science and technology crowds in capital inflows dramatically. In addition, high quality human capital, advanced financial development, and high-level trade openness are conducive to capital inflows. High tax and labor cost impede capital inflows. These results provide proof for China’s government to reduce the size of government spending appropriately and optimize its government expenditure structure for the purpose of crowding in capital inflows.
1. Introduction
The economic theory considers sustainable development as the need to maintain a permanent income, generated from non-declining capital stocks [1]. Researchers suggest that constant stocks of human capital, human-made capital, natural capital, and social capital are necessary and sufficient criteria to achieve sustainable development [1]. Capital flows are key variables supporting the sustainability of economic growth for both developed and developing countries [1,2]. Lucas [3] first investigates why capital does not flow from developed countries to developing countries, although under the standard neoclassical models with the same constant return production functions, capital is scarcer and commands a higher capital return in developing countries. Surging capital flows, especially uphill capital flows, from large emerging economies, such as China, to highly developed countries, such as the U.S, have renewed researchers’ interest in determinants of capital flows [4], which has triggered intense academic and policy debate in the past decade.
Considerable research effort has been focused on elucidating these patterns theoretically and empirically [2,5,6,7,8,9]. The extant literature indicates that human capital [3], institutional quality [6,7,10], development of financial markets [2], trade integration [11], government policies [12], property protection [13], and expropriation risk [14] are essential factors driving capital flows. However, not enough attention has been paid to the role of government size (measured as government spending as a share of GDP) in capital flows. The Keynesian view contends that government spending reduces capital inflows by crowding out private investment [15]. In contrast, the Real Business Cycle model maintains that the expansion of government spending raises capital inflows by crowding in private investment [16]. Moreover, the Ricardian view advocates that government spending is independent of private investment—in other words, capital flows are unaffected by government expenditure.
Due to the complex relationship between government size and capital flows, abundant empirical research have been conducted. Some empirical studies demonstrate that the impact of government size on capital flows is significantly negative [17,18,19,20], while others argue that the impact is positive [21,22] or insignificant [23].
Furceri and Sousa [24] point out that the extent of the effect of government size on capital flows depends on political and institutional variables, which is a topic that is rarely addressed. The government possesses its own interests when carrying out administration and regulation [25]. Government tends to expand its size of public spending in countries with a low quality of governance for the sake of rent-seeking [26]. It may also have an unproductive government expenditure structure under a weak and corrupt institution [27]. Furthermore, the effect of the category of government spending on private investment is contingent on the development of institutions [27]. Considering that previous studies have failed to reach a consensus on this issue, the differentiated effect of government size and composition of government spending on capital flows requires further investigation.
Owing to government budget constraints, understanding the channel through which components of government expenditure affect capital flows can assist authorities to determine how to restrict public spending and redirect government spending structure optimally. In fact, policymakers both in developing and developed countries should understand the cost of government outlay and place emphasis on using public financial funds more efficiently.
In addition, government spending can adjust macroeconomic stability through its multiplier effect on economic output. China is an economy in which fiscal policies play an important role in stabilizing macroeconomic, and the government tends to expand its expenditure to stimulate private investment and boost economic growth. After the Southeast Asia Financial Crisis in 1997, the government implemented pro-active fiscal policies, and issued accumulated RMB 660 billion national bonds to build infrastructure during 1998–2003. In response to the shock of the Financial Crisis in 2008, the government implemented an RMB Four Trillion Investment Plan to increase aggregate demand during 2009–2010. Nevertheless, whether government expenditure has a positive effect on private investment need to be discussed. Government spending is key variables that influence the sustainability of public finance via impact on fiscal balance and government debt. Taking advantage of fiscal resource productively and avoiding the inefficient financial deficit is strikingly important for China and other developing countries. China’s experiences in managing public spending and the related government expenditure effect investigation are worth studying for other developing countries.
Therefore, the purpose of this paper is to explore the relationship between government size and capital flows, and elucidate the influencing factors of capital flows in China from 1997 to 2014. The paper contributes to the extant literature in two main ways. Firstly, this study examines the effect of different types of government spending on capital flows by controlling the factor of institutional quality. Secondly, although researchers have conducted a series analysis to detect the factors underlying capital flows, which factor is more important in explaining these patterns of capital flows remains unknown [6]. The paper attempts to provide a relatively complete framework to identify the determinants of capital flows.
The subsequent sections are organized as follows. The second section reviews the literature on determinants of capital flows, and presents the relationship between capital flows and government size. The third section illustrates the methodology and data sources used in this paper. The fourth section presents and discusses the empirical results. The fifth section ends the study with some conclusions.
2. Literature Review and the Scope of this Paper
2.1. Literature Review
The pattern of international capital flows constitutes a long-standing issue. The existing literature has demonstrated that several factors affect regional capital flows, including capital return [3,6], initial capital abundance [28,29], quality of human capital [3,30,31], cost of labor force [32,33,34], population growth rate [35,36,37,38], resource abundance [39,40], infrastructure [41,42], tax policy [20,43,44], trade openness [11,45,46], financial development [47,48,49], TFP growth [28,50,51], and institutions [7,52,53,54].
Among them, the role of institutions in explaining capital flows has attracted copious attention. Acemoglu and Johnson [53] performed a pioneering work of identifying the positive role of institutions in investment and economic growth. The series of institutions can be unbundled into two groups according to its roles in economic activities: Contracting institutions (institutions providing a legal framework which regulates private contracts) and property protection institutions [53]. Frictions in contracting institutions which increase transaction costs can restrict the trade volume and frequency of risky assets in the financial market [55], thereby generating capital outflows even in capital-scarce economies. Enhanced property protection institutions that protect property rights against the expropriation of the government and other powerful elites function as a decrease on the marginal tax rate [56], thereby stimulating economic development and investment [53]. Djankov et al. [57] point out that higher ratios of private credit to the gross domestic product are accompanied by protection of creditors through legal systems and information sharing. Lee and Mansfield [58] provide empirical proof that intellectual property protection affects the volume and composition of foreign investment. Weak property protection, an inefficient legal system, and a high risk of expropriation discourage international financial flows [7].
Great efforts have been devoted to the factors that decisively affect capital flows across economies. However, research relating to the role of government size in the determination of capital flows has been limited. Economic theories have suggested several mechanisms by which government activities can affect capital flows. Generally, three different opinions exist on the relationship between government size and capital flows, including the Keynesian view, the Real Business Cycle model, and the Ricardian view [24,59,60]. Keynesian-type models assert that an increase in government spending results in a rise in interest rate if not followed by adaptive monetary policy, which contributes to a decline in private investment, and thus, crowds out capital inflows [24]. In contrast with the Keynesian view, the Real Business Cycle model claims that expansion in government spending promotes employment rate and leads to a rise in the capital return of the private sector [24], and thus, may crowd in capital inflows. The Ricardian view suggests that private investment is independent of government spending [59], which suggests that capital flows are unrelated to government spending. If government spending is financed by public bonds, an increase in government spending is expected to be repaid by levying a tax on future income [61]. Consequently, interest rates and private investment remain unchanged, as economic agents are aware of the tax in the future [59].
Numerous theoretical and empirical studies have been carried out to investigate the impact of government size on capital flows. However, no consensus has yet been reached on this issue. The empirical effect of government spending on capital flows can be grouped into negative [17,18,19,20], positive [21,22], and insignificant [23]. The controversial empirical results have been caused by a few factors, such as models implemented, study period, country specification, term length, components of government spending considered, etc. [59].
However, existing research ignore the role of institutional variables in determining the performance of the effect of government spending on investment [24], thereby causing the problem that institutional variables exert an influence on the impact of government spending on capital flows. Government budget decisions vary under different institutions. Firstly, the government possesses an incentive for rent-seeking under weak institutions, contributing to the fact that the size of government public investment is much bigger in countries with a low-quality of governance [26]. The extra public investment related to low quality institutions is unproductive and mostly transferred to government officials or their cronies [26]. Secondly, the quality of institutions shapes the behaviors of the officials toward the allocation of public spending between economic growth-enhancing and economic growth-retarding expenditure. Officials in low quality institutions tend to spend more public resources on objects, which are easier to steer rents and maintain them in secret [62]. For example, a corrupt government is found to reduce spending on education and increase spending on the military [63]. The number and cost of public capital projects are much higher in regions with a low quality of governance [64]. Governments with weak institutions may spend less on social investment, but that investment may be productive in regions with high institutional quality [65]. Thirdly, the efficiency of government expenditure is lower with inferior quality institutions. Keefer and Knack [26] demonstrate that the size of public expenditure may be inversely related to its productivity, due to institutions and the quality of government.
Therefore, in the forthcoming empirical analysis, our paper examines the effects of government spending on capital flows by controlling the factor of institutional quality, and provides a complete framework to discern which factors matter most in influencing capital flows.
2.2. The Situation of Capital Flows in China
Figure 1 presents the relationship between average capital return and regional capital inflows. Little research have estimated provincial capital flows in China. The capital flows across regions can be calculated on the flows of goods and services within regions in China [66]. Specifically, a province’s export of goods and services across regions in China means that residents from other regions will pay money to the province and generate capital inflows. A province’s import of goods and services implies that the province will pay for residents from other regions and generate capital outflows. The net capital inflows are calculated by capital inflows minus capital outflows. Therefore, a province’s net capital inflows can be measured by net export of goods and services across regions [66]. Although a province can trade both with domestic provinces and foreign countries, this paper only focuses on intra-national capital flows. The foreign net export of goods and services is subtracted from the total net export of goods and services. Consequently, net capital inflows of each province are measured by net export of goods and services across regions minus the net export of goods and services across countries outside of China [66].
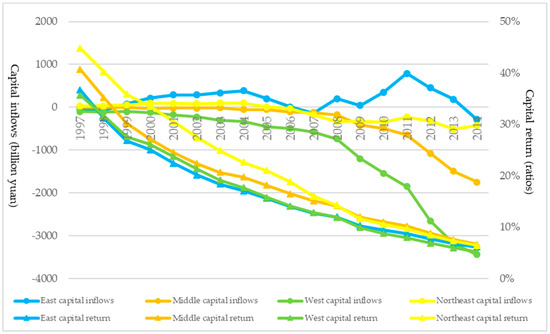
Figure 1.
The average capital return and regional capital flows in China. Data source: Authors’ own calculation.
We divide 31 provinces into four parts according to their economic development: Relatively high-income regions (the east), middle-income regions (the middle and the northeast), and relatively low-income regions (the west). Figure 1 shows that the volume of capital inflows is much larger in the developed eastern region. Capital departed rapidly out of the west, from −104.28 billion yuan in 1997 to −3440.80 billion yuan in 2014 with an annual increase rate of 22.83%. Moreover, the capital inflows gap between the east and other region has not shrunk, but enlarged during 1997–2014. These empirical patterns are at odds with theoretical benchmarks of neoclassical theories, in which capital should flow to regions where capital is scarce.
Average capital return is measured as the ratio of a province’s real GDP in 1997 price over its capital stock in 1997 price (the specific method is illustrated in the methodology part). Average capital return is declining for all of the regions. Strikingly, the average capital return in the eastern area was lowest during 1998–2007, but attracted the most capital inflows. After 2007, the average capital return of different regions began to converge, and although there is not a big capital return difference among the four regions, the gap of capital inflows was increasing. The eastern area still occupied the majority of capital inflows, while the other regions were subject to capital outflows.
Figure 2 shows the relationship between government size and regional capital inflows. Government size is measured as the ratio of a province’s total government spending as a percentage of its GDP [56,67,68]. Government size of all regions was climbing overall. Government size of the west ranks the first, and then the ranking of government size in the northeast, the middle, and the east. The figures seem to demonstrate that bigger government size tends to be accompanied by a smaller amount of capital inflows. Government expenditure of the developed east takes up no more than 20% of its GDP over the research period. Ratios of eastern government spending relative to GDP increased from 8.81% in 1997 to 17.23% in 2014. The middle and the northeast, which are middle-income regions, have larger ratios of government spending than the east. Ratios of the middle climbed from 8.04% in 1997 to 21.11% in 2014. Similarly, the percentage of the northeast government expenditure grew from 10.01% in 1997 to 20.03% in 2014. The underdeveloped west had the biggest proportion of government outlay. The proportion of western government spending relative to its GDP increased from 16.33% in 1997 to 39.35% in 2014. Notably, the percentage exceeded 20% in 2001 and surpassed 40% in 2012 (of course, it could be argued that the local government in capital-scarce regions will increase its public expenditure in order to stimulate economic growth. However, our paper proves that government size impedes capital inflows, even though the impact of government fiscal stimulus in underdeveloped areas is excluded).
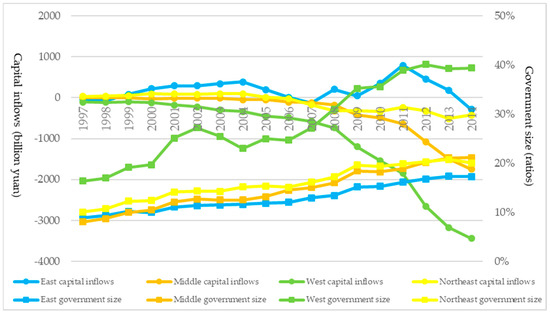
Figure 2.
Government size and regional capital flows in China. Data source: Authors’ own calculation.
As shown in Figure 2, the volume of capital flows from developed to underdeveloped regions is quite low (as argued by Lucas [3]), and their relationship with government size is negatively correlated. It is conceivable that the economic development of China in the future might have to rely more on the expansion of its internal market than previously. As a result, it is of great importance to determine the key factors in driving intra-national regional capital flows, as well as the relationship between government size and capital flows.
3. Methodology and Data
Considering the potential path-dependent effect in which capital flows correspond to the previous period’s capital flows [28], the following regression equation is employed in this analysis:
where denotes the capital inflows ratios (CI), which are measured by provincial capital inflows divided by its GDP, and the measurement of provincial capital inflows is calculated as total net export of goods and services minus net export of goods and services across foreign countries; is government size, which is measured by government expenditure as a percentage of GDP following a series of pioneering studies [56,67,68]; is a set of control variables (including per capita capital stock, average capital return, TFP growth, per capita income, human capital, property protection, market liberalization, financial development, trade openness, infrastructure, tax burden, labor cost, working population growth, and resource abundance); is the province-specific effect; is the time-specific effect; is the random error term; subscript i denotes the province; and subscript t denotes and the year.
Capital inflows may exhibit persistence over time, since the private investment behaviors correlate with the previous investment decisions [28]. Capital inflows are affected by their lagged levels, thereby showing a significant lag effect; therefore, the dynamic panel model estimated by generalized method of moments (GMM) is utilized. In addition, a dynamic panel model estimated by GMM can mitigate reverse causality concerns. The benefit of employing the dynamic panel estimator is that it can solve the endogeneity problems of all explanatory variables by utilizing the instrument variables based on the lagged terms of explanatory variables. For example, the relationship between government size, TFP growth, average capital return, per capita capital stock, and capital flows may be driven by reverse causation. Government spending constitutes the key instrument to reduce regional inequality [69]. In underdeveloped capital- scarce regions, the government may expand its budget on public investment, and thus, increase its government size [70]. Moreover, the increase in capital inflows may bring technology spillovers to a province, which in turn may stimulate the increase of productivity and capital return, and hence, promote both capital stock accumulation and income growth [71,72]. The dynamic panel estimator uses the previous realizations of these explanatory variables as instrument variables, which can solve the problem of reverse causation. In addition, the lagged terms of government size, TFP growth, average capital return, per capita stock, and per capita income are utilized to avoid potential reverse causation.
In terms of government spending, we examine the following variables: Total expenditure (GS)1 and its breakdown in expenditures for technology (GET)2, capital construction (GEC)3, administration (GEA)4, public security (GEP)5, and social security and employment (GES)6. For all of these variables, we construct identical measures: The composition of government expenditure as a percentage of GDP. Fiscal data for the government are obtained from the China Statistical Yearbook database.
X denotes control variables:
- (1)
- Per capita capital stock (PC) is calculated by capital stock divided by labor.
Capital stock is constructed by the perpetual inventory method:
where is the real value of capital stock for the province in the year; is the depreciation rate; and is the real value of gross capital formation for the province in the year.
The initial capital stock is constructed by growth rate approach. This approach assumes that the function of an investment is to replace depreciation of old capital and create new capital to maintain growth [73]. Thus, the initial capital stock of the ith region in 1978 is obtained by the following equation [73]:
where is the initial gross capital formation for the province; is the capital depreciation rate for the province; and denotes the average real GDP growth rate for the province during 1992–2002.
Gross capital formation is obtained from “gross capital formation”, which is the component of GDP measured in the expenditure approach.
The price index, which converts gross capital formation values into real terms is FAIPI (Fixed Asset Investment Price Index).
Data of capital formation and fixed assets investment price index are derived from the Statistical Yearbook of Chinese Investment in Fixed Assets.
Wu’s evaluation of the depreciation rate is used to calculate capital stock. Following Wu [73], “a simulation process is adopted to generate different rates of depreciation for each region. The simulation process begins by assuming a rate of depreciation for each region and then searches for an optimal rate (via repetitive computations) so that the estimated values of depreciation (using the optimal rate) match the actual values of depreciation” [73] (p. 10).
- (2)
- Average capital return (AC) is measured by real GDP in 1997 price divided by capital stock in 1997 price.
- (3)
- TFP growth rate (TG). TFP is obtained from a Stochastic Frontier Production:where the output is real GDP in 1997 price for the province in the year; input includes capital , which is capital stock in 1997 price; and labor force is total labor force of each province in the year.
- (4)
- Per capita income (PI) is calculated by real GDP in 1997 price divided by labor force.
- (5)
- Human capital (HC) is measured by weighted average schooling years:where is provincial human capital; , , , , , , and denotes different education degree, which is illiteracy, elementary, junior, senior, college, university, and postgraduate, respectively; each education degree , , , , , , and is assigned to values of 0, 5, 8, 11, 15, 16, and 19, respectively; and , , , , , , and denotes the proportion of the employed population of each education degree, respectively. Data are obtained from the China Population and Employment Statistics Yearbook.
- (6)
- As argued by Acemoglu and Johnson [53], institutions can be unbundled into functions of protecting private property against being expropriated and functions of providing the legal framework that enables private contracts. We gauge institutional quality from two aspects: Property protection and market liberalization.
Property protection (PP) is measured by “development index of market intermediary organization and legal system environment”, obtained from China’s most authoritative institutional quality evaluation report, which is Fan and Wang’s “Marketization Index of China’s Provinces”. The “development index of market intermediary organization and legal system environment” is a weighted composite index, including assessment of the development of intermediary organizations, rights protection of producers and consumers, and intellectual property protection. Market liberalization (ML) is measured by a development index of product market, which is also available in China Marketization Index reports. It is also a weighted composite index, incorporating the degree of the price determined by the market and the degree of local protection of commodity markets.
Because the index data are discontinuous, we use rank data issued by the report to measure provincial institutional quality. The province ranking the first will be assigned a score of 31, and the province ranking 31st will be assigned a score of 1.
- (7)
- Financial development (FD) is measured by “marketization of the financial industry” in Fan and Wang’s China Marketization Index report. This index is a weighted composite index, which reflects the situation of financial market competition and credit funds distribution between state-owned and non-state-owned organs. Similarly, the province ranking the first will be assigned a score of 31, and the province ranking 31st will be assigned a score of 1.
- (8)
- Trade openness (TO) is measured by the total value of imports and exports divided by GDP.
- (9)
- Infrastructure (IN) is measured by road area as a percentage of total land area.
- (10)
- Tax burden (TB). Tax burden is measured by the share of the government’s tax revenue relative to GDP. The tax revenue mainly includes value-added tax, business tax, corporate income tax, individual income tax, etc.
- (11)
- Working population growth (WP) is measured by year-end increase rate of population aged between 15 to 65.
- (12)
- Labor cost (LC) is denoted by the provincial wage of urban employees.
- (13)
- Resource abundance (RA) is defined by the ratio of “mining industry fixed asset investment” to “total fixed asset investment”.
All of the data are derived from the China Statistical Yearbook issued by the National Bureau of Statistics (NBS), unless otherwise stated. Detailed yearly observations of 31 provinces, autonomous regions and directed-controlled municipalities throughout the period 1997–2014 are gathered, which consists of twenty-two provinces, five autonomous regions and four directed-controlled municipalities. Considering the data availability of all the variables (data for variables of property protection, market liberalization, and financial development only cover 1997–2014), 1997–2014 is chosen as our study period. Table 1 presents averages and standard deviations of the variables.

Table 1.
Summary statistics of variables.
4. Determinants of Regional Capital Flows in China
The panel stationarity test is required prior to the econometric analysis since all variables in the regression equation should be stationary. A Fisher type panel unit root test is utilized, due to its advantage of unbalanced panel data over other test methods. The evidence shows that the majority of variables reject the null hypothesis of a unit root in the Fisher type test [74], except the variable of per capita capital stock. Considering that the panel consists of 31 provinces and spans from 1997 to 2014, the relatively short time length allows us to allay concerns about the stationarity property of the variable.
As previously mentioned, governments expand their investment in poverty areas [70], thereby causing reverse causality. The following methods are utilized to resolve endogeneity problems: (1) Employing the lagged term of capital flows as an independent variable; (2) adopting the lagged terms of government size as instrument variables; and (3) using the generalized method of moments. Moreover, considering the reverse causality in which the technology spillover effect of capital inflows exerts a positive effect on the increase of capital return, TFP growth rate, capital stock accumulation and income growth, the lagged term of these variables is included in the model.
The method of system generalized method of moments (System GMM) estimator is employed. Compared to Difference GMM, System GMM can significantly improve estimation efficiency and reduce the influence of endogeneity problems caused by omitted variables [75]. The estimation results are presented in Table 2. Columns (1)–(6) report the empirical results of the impact of government size and composition of government spending on capital inflows.
Table 2.
Government spending and capital flows.
4.1. Government Size and Capital Flows
Government size negatively impinges on capital inflows at the 1% significance level in column (1), which is consistent with the viewpoint of Alesina et al. [20]. Specifically, a 1% increase of ratios of government size as a percentage of GDP yields an approximately 0.676% decline in ratios of capital inflows relative to GDP. Government expenditure refers to the total amount of funds which government finance has raised, so as to meet the needs of economic construction and various social programs. Optimally, the government provides public goods and services with positive externalities for the private sector to improve production and investment environment, and thus, government expenditure should complement private investment and should not crowd out private capital. Otherwise, with the expansion of government size, the beneficial effect of promoting private production will shrink, while the negative impact on economic growth and saving rate, due to the need to increase taxation to finance public expenditure will dominate [56]. Furthermore, higher public expenditure leads to a higher national investment rate which is above the level chosen by rational agents, and thus, generates an ex ante crowding-out effect of private investment [76]. If the economy is operated at full employment level, expanding government size would increase consumption and would result in a decrease in savings, thereby inducing an increase in the interest rate and a decrease in private investment [24].
4.2. Component of Government Spending and Capital Flows
Government expenditure on technology has a significantly positive effect on capital inflows in column (2). In particular, an increase of 1% in the ratios of total science and technology expenditure to GDP would increase capital inflows by 10.29% of GDP. Government technical expenditure refers to the spending of the government on science and technology (S&T), including expense on the administration of S&T, basic research, applied research, research and development, conditions and services of S&T, popularization of science and technology, exchanges and cooperation of S&T, etc. Due to the positive externality of research and development (R&D) activities, the social benefits obtained from R&D investment is much larger than the private benefits. The private cannot get all the earnings from R&D investment, due to the externality. If the government provides the private sector with technological investment support and subsidies to compensate enterprises’ R&D cost, expansion in technological expenditure increases the return to private capital and crowds in private capital accumulation [76]. In other words, government expenditure on science and technology benefits capital inflows by increasing the productivity of private capital. Haskel and Wallis [77] have proven that a robust positive correlation exists between public financed R&D expenditure and market sector total factor productivity growth. Research and development performed by the public sector constitute a significant determinant of long-term productivity growth [78].
The impact of government expenditure on capital construction on capital inflows is significantly negative in column (3). A 1% increase in administrative expenditure-to-GDP ratios reduces capital inflows-to-GDP ratios increase by 1.235%. Government expenditure on capital construction refers to the non-gratuitous use and appropriation of funds for capital construction, loans on capital construction approved by the government for special purposes or policy purposes, and discount payment to the departments for capital construction. Consistent with Ifeakachukwu et al. [79] and Wang [80], we find that capital expenditure exerts a crowd-out impact on investment and reduces capital inflows. In the early stage of economic development, government capital construction expenditure tends to improve the investment environment and make up the insufficient supply of public social facilities. The government solves problems of market failure in public goods supply and provides the society with infrastructure through expansion in capital construction expenditure. Nevertheless, distortionary and inefficient allocation of government spending begins to emerge with the excessive expansion of capital construction, which intensely reduces the positive externality of public expenditure.
Some researchers have shown that the performance of infrastructure investment is extremely poor [81,82], and these poor level projects trigger problems of accumulating debt, non-performing loans, distortionary monetary expansion, and lost alternative investment opportunities. For example, 75% of transport projects suffered from cost-overrun problems [83], which were induced by poor technical design and quality issues in China’s infrastructure projects [84,85].
The over-sized government may lead to a greater diversion of resources into unproductive use [86]. Since China has invested excessively in capital construction, officials should now reconsider whether the budget is being used to build the right infrastructure [87]. In addition, the occurrence of China’s investment boom increased debt simultaneously [88]. The results of this build-up of debt and monetary expansion might contribute to volatile movements in interest rates and asset prices, and a lack of funds to finance productive investment [89]. Indeed, several of these negative effects are already emerging in China.
Government administrative expenditure has a significantly negative impact on capital inflows in column (4). Specifically, an increase of 1% in administrative expenditure-to-GDP ratios lowers capital inflows-to-GDP ratios increase by 2.084%. Government administrative expenditure comprises administrative expenses, outlay subsidies of parties and groups, expenditures for foreign affairs, judicial expenses on courts and procrastinates, and expenses and subsidies on case handling. Ideally, an optimal and well-organized public bureaucracy can benefit capital inflows and promote economic growth [10]. However, capital allocation is heavily influenced by government intervention in China [90]. Coordination and administration of public sector activity were costly with strong government administration. This means that an enterprise’s production efficiency is less important than the quality of government management. In addition, expansion of government administration expenditure also leads to problems of overstaffed institutions and power rent-seeking, which depresses capital inflows by reducing the efficiency and fairness of market competition. Therefore, governance efficiency problems present a major stumbling block for private enterprises [25].
Consistent with Laopodis [91] and Wang [80], our results demonstrate that government expenditure on public security has an insignificant effect on capital inflows in column (5). Government expenditure on public security refers to the spending of the government on maintaining social and public security, including spending on armed police forces, public security, state security, prosecution, courts, the overall justice system, prisons, labor education and rehabilitation, protection of state secrecy, anti-smuggling police, etc. In particular, defense spending affects economic activities through the following two mechanisms. The first is via the multiplier effect, which stimulates aggregate demand to spill over into related industries and raise total output [91]. The second channel of influence manifests itself as that private investment is directly sacrificed when there is a rise in defense expenditure. In addition, Gupta et al. [92] argue that defense spending is correlated with corruption and can be considered as an indicator of governance. Due to the secrecy and lower transparency of the military procurement process, both government officials and arms suppliers possess incentives to engage in corrupt malpractice. Higher defense expenditure tends to coincide with more corruption and lower quality of governance, which reduces the incentive for the private sector to invest. The comprehensive effect of government spending on public security depends on the interaction of these channels and their relative strength.
Government spending on social security and employment has an insignificant negative effect on capital inflows in column (6). Government expenditure on social security and employment refers to expenditure from the state budget for subsidies to the social security system, including subsidies to the social insurance fund, subsidies to promote employment, subsidies to laid-off workers of state-owned enterprises, supplements to national social security funds, etc. In general, social security and employment spending are financed by government debt. If there is no adjustment of the money supply, the ascending debt-financed government spending competing with private loan demand contributes to the rise in interest rates, and thus, crowds out private investment. Wang [80] examined the impact of government social welfare expenditure in Canada, and found an insignificantly negative impact on private investment in these countries.
4.3. Other Variables
Concerning the control variables, average capital return exerts a significantly positive effect on capital inflows, which conforms to neoclassical economic theory [3]. Consistent with Deng and Wang [29], lagged per capita capital stock has a significantly positive impact, which implies that initial capital accumulation exerts a positive influence on subsequent capital inflows.
Human capital has a significantly positive effect on capital inflows, which is in accordance with Lucas [3]. Human capital served as input and functioned as a potential source of increasing returns to scale. High quality of human capital can accelerate the speed and accuracy of information flows within the market, which lowers transaction costs and stimulates capital inflows.
A higher level of trade openness is advantageous for capital inflows, which is consistent with Antras and Caballero [11], who pointed out that promoting trade openness and deepening trade integration in less financially developed economies raised net capital inflows at the global level. The classical Heckscher-Ohlin-Mundell model predicts that trade and capital flows are substitutes. That is, the process of trade integration retards capital flows to capital-scarce economies. However, Antras and Caballero [11] found that “trade liberalization decouples the process of labor allocation from local demand conditions. In this context, a financially underdeveloped country is able to allocate a disproportionate number of workers in sectors in which financial frictions are less severe, thereby increasing the marginal product of capital” [11] (p. 734). Consequently, trade openness promotes capital inflows by increasing the capital return in financially underdeveloped regions. As China has a less developed capital market [93], promoting trade openness is conducive to capital inflows.
Financial market development has a significantly positive effect on capital inflows. Financial markets should improve the efficiency of capital allocation [47]. In China, financial frictions have contributed to the loss of total factor productivity by 8.3%, which is responsible for 30% capital misallocation [93]. With financial openness, less developed countries tend to experience net capital inflows [48].
Tax burden exerts a significantly negative impact on capital inflows. Tax reduction is commonly employed as a policy instrument for governments to encourage private investment [43]. A higher tax rate that withdraws the expected capital return from investors depresses capital inflows. Our empirical results, consistent with Alesina et al. [20], show that various types of taxes have a negative effect on profits and reduce business investment.
According to the neoclassical investment theory, investment flows would be influenced by labor cost [32]. Our results predict that labor cost has a significantly negative effect on capital inflows. Higher labor costs will reduce the profitability of firms, and thus, will pose an impediment to capital inflows.
4.4. Further Discussion on Robustness Check
One potential factor that may lead to the endogenous problem is the reverse causation between government size and capital inflows. In capital-scare regions, it is common for governments to choose public expenditure as an instrument to reduce regional economic disparities [70]. However, this then leads to the reverse causation problem in which the government sets its public spending level according to the region’s economic development: Capital-scarce regions are channeled more fiscal resources. Two methods are utilized to alleviate the endogenous problems: Firstly, we re-estimate the impact of government size on capital inflows in relatively capital-abundance regions. For instance, the government issued the China Western Development Strategy in 12 underdeveloped provincial administrative regions since 2000, which assigns increased financial priority, including financial transfer, public investment, and tax reduction to these capital-scarce regions. Thus, we reexamine the effect of government size on capital inflows with samples excluding capital-scarce regions that carried out Western Development Strategy, the results of which are presented in column (1) of Table 3. Secondly, we also use ratios of government revenue (GR) to GDP as another measurement of government size, and the results are shown in column (2) of Table 3. Our main results remain unchanged, and government size still exerts a significantly negative effect on capital inflows.
Table 3.
Robustness check.
5. Conclusions
In the literature, there are three different points of views regarding the impact of government size on capital flows—crowding in, crowding out, or insignificant. Nevertheless, no consensus is achieved on the relationship between government size and capital flows. Investigation to the impact of government size on capital flows is helpful for the authorities to restrict government expenditure efficiently.
This paper investigates the relationships between government size and regional capital flows with panel data of 31 provinces in China during 1997–2014, and attempts to explore the determinants of capital flows.
Preliminary results show that government size exerts a negative effect on capital inflows. In particular, by more closely examining the effect of each component of government spending, the results reveal that government expenditure on capital construction and administration has a sizeable, negative, and statistically significant effect on capital inflows. Government expenditure on science and technology is beneficial for capital inflows. On the other hand, government expenditure on public security and social security is found to have an insignificant effect on capital inflows. These results provide proof for China’s government to shrink its government size appropriately and optimize its government expenditure structure for the purpose of augmenting capital inflows. In addition, good quality human capital, advanced financial development, and high-level trade openness are conducive to capital inflows. High tax and labor cost retard capital inflows.
The above findings provide several policy implications regarding policy formulations for adjusting government spending structure and boosting capital inflows for China and other developing countries. Firstly, the government should continue to facilitate technical expenditure. The publicly-financed R&D can complement with private capital, and the diffusion of technological advances can spill over to the private sector’s productivity growth. Secondly, the government should set capital construction fiscal budget plan cautiously. Public capital formation may turn out to be less productive if devoted to inefficient and massive public projects, and crowds out capital inflows. Thirdly, the officials should cut down administrative government spending. Government’s excessive regulation on economic activities reduces economic efficiency and discourages capital inflows. The government should keep a minimum of administrative and bureaucratic input and divert administrative resources to the field which governmental comparative advantage is stronger. Fourthly, the government should continue to facilitate the deepening of China’s financial market reform. Since the central government dominates the other economic agents in the financial market, non-state enterprises are subject to relatively severe financial constraints. Considering the positive role of financial development in capital inflows, the government should alleviate the distortion in the financial market and establish a more efficient financial resource allocation mechanism.
Although the results obtained from the empirical study are subject to a certain limitation which available data only covers 1997–2014, and the specific econometric techniques may be regarded as preliminary and suggestive. Nevertheless, these results provide important proof for the government to manage government spending efficiently to stimulate capital inflows. As for possible further empirical research, one could examine the optimal size of various components of government spending for capital inflows. In addition, the mechanism through which government spending impact capital inflows could be investigated.
Author Contributions
It should be noted that the whole work was accomplished by the authors collaboratively. Both authors read and approved the final manuscript.
Funding
This research was supported by the Major Program of the National Social Science Foundation of China (Grant No.14 ZDA070) and by the Fundamental Research Funds for the Central Universities 2017.
Conflicts of Interest
The authors declare no conflict of interest.
References
- Spangenberg, J.H. Economic sustainability of the economy: Concepts and indicators. Int. J. Sustain. Dev. 2005, 8, 47–64. [Google Scholar] [CrossRef]
- Agbloyor, E.K.; Abor, J.Y.; Adjasi, C.K.D.; Yawson, A. Private capital flows and economic growth in Africa: The role of domestic financial markets. J. Int. Financ. Mark. Inst. Money 2014, 30, 137–152. [Google Scholar] [CrossRef]
- Lucas, R.E. Why doesn’t capital flow from rich to poor countries? Am. Econ. Rev. 1990, 80, 92–96. [Google Scholar]
- Kalemli-Ozcan, S.; Reshef, A.; Sørensen, B.E.; Yosha, O. Why does capital flow to rich states? Rev. Econ. Stat. 2010, 92, 769–783. [Google Scholar] [CrossRef]
- Caballero, R.J.; Farhi, E.; Gourinchas, P.-O. An equilibrium model of “global imbalances” and low interest rates. Am. Econ. Rev. 2008, 98, 358–393. [Google Scholar] [CrossRef]
- Alfaro, L.; Kalemli-Ozcan, S.; Volosovych, V. Why doesn’t capital flow from rich to poor countries? An empirical investigation. Rev. Econ. Stat. 2008, 90, 347–368. [Google Scholar] [CrossRef]
- Papaioannou, E. What drives international financial flows? Politics, institutions and other determinants. J. Dev. Econ. 2009, 88, 269–281. [Google Scholar] [CrossRef]
- Song, Z.; Storesletten, K.; Zilibotti, F. Growing like china. Am. Econ. Rev. 2011, 101, 196–233. [Google Scholar] [CrossRef]
- Aguiar, M.; Amador, M. Growth in the Shadow of Expropriation. Q. J. Econ. 2011, 126, 651–697. [Google Scholar] [CrossRef]
- Ali, A.M. Institutional differences as sources of growth differences. Atl. Econ. J. 2003, 31, 348–362. [Google Scholar] [CrossRef]
- Antras, P.; Caballero, R.J. Trade and capital flows: A financial frictions perspective. J. Political Econ. 2009, 117, 701–744. [Google Scholar] [CrossRef]
- Armey, R.K. The Freedom Revolution: The New Republican House Majority Leader Tells Why Big Government Failed, Why Freedom Works, and How We Will Rebuild America; Regnery Publishing: Washington, DC, USA, 1995. [Google Scholar]
- Asoni, A. Protection of property rights and growth as political equilibria. J. Econ. Surv. 2008, 22, 953–987. [Google Scholar] [CrossRef]
- Reinhart, C.M.; Rogoff, K.S. Serial default and the “paradox” of rich-to-poor capital flows. Am. Econ. Rev. 2004, 94, 53–58. [Google Scholar] [CrossRef]
- Majumder, A. Does Public Borrowing Crowd-out Private Investment? The Bangladesh Evidence; Policy Analysis Unit Working Paper Series 708; Bangladesh Bank: Dhaka, Bangladesh, 2007. [Google Scholar]
- O’Hara, A.P. International subprime crisis and recession: Emerging macroprudential, monetary, fiscal and global governance. Panoeconomicus 2011, 58, 1–17. [Google Scholar] [CrossRef]
- Asogwa, F.O.; Okeke, I.C. The Crowding out Effect of Budget Deficits on Private Investment in Nigeria. Eur. J. Bus. Manag. 2013, 5, 20. [Google Scholar]
- Afonso, A.; Furceri, D. Government size, composition, volatility and economic growth. Eur. J. Political Econ. 2010, 26, 517–532. [Google Scholar] [CrossRef]
- Linnemann, L. The effect of government spending on private consumption: A puzzle? J. Money Credit Bank. 2006, 38, 1715–1735. [Google Scholar] [CrossRef]
- Alesina, A.; Ardagna, S.; Perotti, R.; Schiantarelli, F. Fiscal policy, profits, and investment. Am. Econ. Rev. 2002, 92, 571–589. [Google Scholar] [CrossRef]
- Ramirez, M.D. The impact of public investment on private investment spending in Latin America: 1980–95. Atl. Econ. J. 2000, 28, 210–225. [Google Scholar] [CrossRef]
- Hatano, T. Crowding-in effect of public investment on private investment. Public Policy Rev. 2010, 6, 105–120. [Google Scholar]
- Mahmoudzadeh, M.; Sadeghi, S.; Sadeghi, S. Fiscal spending and crowding out effect: A comparison between developed and developing countries. Inst. Econ. 2017, 5, 31–40. [Google Scholar]
- Furceri, D.; Sousa, R.M. The impact of government spending on the private sector: Crowding-out versus crowding-in effects. Kyklos 2011, 64, 516–533. [Google Scholar] [CrossRef]
- Krueger, A.O. Government failures in development. J. Econ. Perspect. 1990, 4, 9–23. [Google Scholar] [CrossRef]
- Keefer, P.; Knack, S. Boondoggles, rent-seeking, and political checks and balances: Public investment under unaccountable governments. Rev. Econ. Stat. 2007, 89, 566–572. [Google Scholar] [CrossRef]
- Butkiewicz, J.L.; Yanikkaya, H. Institutions and the impact of government spending on growth. J. Appl. Econ. 2011, 14, 319–341. [Google Scholar] [CrossRef]
- Gourinchas, P.-O.; Jeanne, O. Capital flows to developing countries: The allocation puzzle. Rev. Econ. Stud. 2013, 80, 1484–1515. [Google Scholar] [CrossRef]
- Deng, L.; Wang, B. Regional capital flows and economic regimes: Evidence from China. Econ. Lett. 2016, 141, 80–83. [Google Scholar] [CrossRef]
- Benhabib, J.; Spiegel, M.M. The role of human capital in economic development evidence from aggregate cross-country data. J. Monet. Econ. 1994, 34, 143–173. [Google Scholar] [CrossRef]
- Noorbakhsh, F.; Paloni, A.; Youssef, A. Human capital and FDI inflows to developing countries: New empirical evidence. World Dev. 2001, 29, 1593–1610. [Google Scholar] [CrossRef]
- Cushman, D.O. The effects of real wages and labor productivity on foreign direct investment. South. Econ. J. 1987, 54, 174–185. [Google Scholar] [CrossRef]
- Bevan, A.A.; Estrin, S. The determinants of foreign direct investment into European transition economies. J. Comp. Econ. 2004, 32, 775–787. [Google Scholar] [CrossRef]
- Carstensen, K.; Toubal, F. Foreign direct investment in Central and Eastern European countries: A dynamic panel analysis. J. Comp. Econ. 2004, 32, 3–22. [Google Scholar] [CrossRef]
- Coale, A.J.; Hoover, E.M. Population Growth and Economic Development; Princeton University Press: Princeton, NJ, USA, 2015; Volume 2319. [Google Scholar]
- Sweezy, A. Population growth and investment opportunity. Q. J. Econ. 1940, 55, 64–79. [Google Scholar] [CrossRef]
- Simon, J.L. The Economics of Population Growth; Princeton University Press: Princeton, NJ, USA, 2019; Volume 5403. [Google Scholar]
- Brooks, R. Population aging and global capital flows in a parallel universe. IMF Staff Pap. 2003, 50, 200–221. [Google Scholar] [CrossRef][Green Version]
- Papyrakis, E.; Gerlagh, R. The resource curse hypothesis and its transmission channels. J. Comp. Econ. 2004, 32, 181–193. [Google Scholar] [CrossRef]
- Papyrakis, E.; Gerlagh, R. Resource windfalls, investment, and long-term income. Resour. Policy 2006, 31, 117–128. [Google Scholar] [CrossRef]
- Dailami, M.; Leipziger, D. Infrastructure project finance and capital flows: A new perspective. World Dev. 1998, 26, 1283–1298. [Google Scholar] [CrossRef]
- Martin, P.; Rogers, C.A. Industrial location and public infrastructure. J. Int. Econ. 1995, 39, 335–351. [Google Scholar] [CrossRef]
- Bond, E.W.; Samuelson, L. Tax holidays as signals. Am. Econ. Rev. 1986, 76, 820–826. [Google Scholar]
- Davies, R.B. The OECD model tax treaty: Tax competition and two-way capital flows. Int. Econ. Rev. 2003, 44, 725–753. [Google Scholar] [CrossRef]
- Razin, A.; Sadka, E.; Coury, T. Trade openness, investment instability and terms-of-trade volatility. J. Int. Econ. 2003, 61, 285–306. [Google Scholar] [CrossRef]
- Neumayer, E.; De Soysa, I. Trade openness, foreign direct investment and child labor. World Dev. 2005, 33, 43–63. [Google Scholar] [CrossRef]
- Wurgler, J. Financial markets and the allocation of capital. J. Financ. Econ. 2000, 58, 187–214. [Google Scholar] [CrossRef]
- Reinhardt, D.; Ricci, L.A.; Tressel, T. International capital flows and development: Financial openness matters. J. Int. Econ. 2013, 91, 235–251. [Google Scholar] [CrossRef]
- Bailliu, J.N. Private Capital Flows, Financial Development, and Economic Growth in Developing Countries; Bank of Canada: Ottawa, ON, Canada, 2000. [Google Scholar]
- Buera, F.J.; Shin, Y. Productivity Growth and Capital Flows: The Dynamics of Reforms; National Bureau of Economic Research: Cambridge, MA, USA, 2009. [Google Scholar]
- Kose, M.A.; Prasad, E.S.; Terrones, M.E. Does openness to international financial flows raise productivity growth? J. Int. Money Financ. 2009, 28, 554–580. [Google Scholar] [CrossRef]
- Acemoglu, D.; Johnson, S.; Robinson, J.A. The colonial origins of comparative development: An empirical investigation. Am. Econ. Rev. 2001, 91, 1369–1401. [Google Scholar] [CrossRef]
- Acemoglu, D.; Johnson, S. Unbundling institutions. J. Political Econ. 2005, 113, 949–995. [Google Scholar] [CrossRef]
- Claessens, S.; Laeven, L. Financial development, property rights, and growth. J. Financ. 2003, 58, 2401–2436. [Google Scholar] [CrossRef]
- Liu, H. Optimal consumption and investment with transaction costs and multiple risky assets. J. Financ. 2004, 59, 289–338. [Google Scholar] [CrossRef]
- Barro, R.J. Government spending in a simple model of endogeneous growth. J. Political Econ. 1990, 98, S103–S125. [Google Scholar] [CrossRef]
- Djankov, S.; McLiesh, C.; Shleifer, A. Private credit in 129 countries. J. Financ. Econ. 2007, 84, 299–329. [Google Scholar] [CrossRef]
- Lee, J.-Y.; Mansfield, E. Intellectual property protection and US foreign direct investment. Rev. Econ. Stat. 1996, 78, 181–186. [Google Scholar] [CrossRef]
- Şen, H.; Kaya, A. Crowding-out or crowding-in? Analyzing the effects of government spending on private investment in Turkey. Panoeconomicus 2014, 61, 631–651. [Google Scholar] [CrossRef]
- Agnello, L.; Furceri, D.; Sousa, R.M. How best to measure discretionary fiscal policy? Assessing its impact on private spending. Econ. Model. 2013, 34, 15–24. [Google Scholar] [CrossRef]
- Arestis, P. Fiscal policy is still an effective instrument of macroeconomic policy. Panoeconomicus 2011, 58, 143–156. [Google Scholar] [CrossRef]
- Mauro, P. Corruption and the composition of government expenditure. J. Public Econ. 1998, 69, 263–279. [Google Scholar] [CrossRef]
- Dizaji, S.F.; Farzanegan, M.R.; Naghavi, A. Political institutions and government spending behavior: Theory and evidence from Iran. Int. Tax Public Financ. 2016, 23, 522–549. [Google Scholar] [CrossRef]
- Tanzi, V.; Davoodi, H. Corruption, public investment, and growth. In The Welfare State, Public Investment, and Growth; Springer: New York, NY, USA, 1998; pp. 41–60. [Google Scholar]
- Delavallade, C. Corruption and distribution of public spending in developing countries. J. Econ. Financ. 2006, 30, 222–239. [Google Scholar] [CrossRef]
- Wang, X.; Fan, G. Analysis on the regional disparity in China and the influential factors. Econ. Res. J. 2004, 1, 33–44. [Google Scholar]
- Bergh, A.; Karlsson, M. Government size and growth: Accounting for economic freedom and globalization. Public Choice 2010, 142, 195–213. [Google Scholar] [CrossRef]
- Colombier, C. Growth effects of fiscal policies: An application of robust modified M-estimator. Appl. Econ. 2009, 41, 899–912. [Google Scholar] [CrossRef]
- Bank, W. World Development Report 1994: Infrastructure for Development: Executive Summary; World Bank: Washington, DC, USA, 1994. [Google Scholar]
- Zhang, X.; Fan, S. Public investment and regional inequality in rural China. Agric. Econ. 2004, 30, 89–100. [Google Scholar] [CrossRef]
- Görg, H.; Greenaway, D. Much ado about nothing? Do domestic firms really benefit from foreign direct investment? World Bank Res. Obs. 2004, 19, 171–197. [Google Scholar] [CrossRef]
- Aitken, B.J.; Harrison, A.E. Do domestic firms benefit from direct foreign investment? Evidence from Venezuela. Am. Econ. Rev. 1999, 89, 605–618. [Google Scholar] [CrossRef]
- Wu, Y. China’s Capital Stock Series by Region and Sector; University of Western Australia, Business School, Economics: Perth, Australia, 2009. [Google Scholar]
- Choi, I. Unit root tests for panel data. J. Int. Money Financ. 2001, 20, 249–272. [Google Scholar] [CrossRef]
- Blundell, R.; Bond, S. Initial conditions and moment restrictions in dynamic panel data models. J. Econom. 1998, 87, 115–143. [Google Scholar] [CrossRef]
- Aschauer, D.A. Does public capital crowd out private capital? J. Monet. Econ. 1989, 24, 171–188. [Google Scholar] [CrossRef]
- Haskel, J.; Wallis, G. Public support for innovation, intangible investment and productivity growth in the UK market sector. Econ. Lett. 2013, 119, 195–198. [Google Scholar] [CrossRef]
- Guellec, D.; Van Pottelsberghe de la Potterie, B. From R&D to productivity growth: Do the institutional settings and the source of funds of R&D matter? Oxf. Bull. Econ. Stat. 2004, 66, 353–378. [Google Scholar]
- Ifeakachukwu, N.P.; Adebiyi, O.O.; Adedeji, A.O. An analysis of the relationship between public spending components and private investments in Nigeria. J. Financ. Econ. 2013, 1, 14–27. [Google Scholar] [CrossRef][Green Version]
- Wang, B. Effects of government expenditure on private investment: Canadian empirical evidence. Empir. Econ. 2005, 30, 493–504. [Google Scholar] [CrossRef]
- Flyvbjerg, B. Survival of the unfittest: Why the worst infrastructure gets built—And what we can do about it. Oxf. Rev. Econ. Policy 2009, 25, 344–367. [Google Scholar] [CrossRef]
- Ansar, A.; Flyvbjerg, B.; Budzier, A.; Lunn, D. Should we build more large dams? The actual costs of hydropower megaproject development. Energy Policy 2014, 69, 43–56. [Google Scholar] [CrossRef]
- Ansar, A.; Flyvbjerg, B.; Budzier, A.; Lunn, D. Does infrastructure investment lead to economic growth or economic fragility? Evidence from China. Oxf. Rev. Econ. Policy 2016, 32, 360–390. [Google Scholar] [CrossRef]
- Ameratunga, S.; Hijar, M.; Norton, R. Road-traffic injuries: Confronting disparities to address a global-health problem. Lancet 2006, 367, 1533–1540. [Google Scholar] [CrossRef]
- Zou, P.X.; Zhang, G.; Wang, J. Understanding the key risks in construction projects in China. Int. J. Proj. Manag. 2007, 25, 601–614. [Google Scholar] [CrossRef]
- Brennan, G.; Buchanan, J.M. The Power to Tax: Analytic Foundations of a Fiscal Constitution; Cambridge University Press: Cambridge, UK, 1980. [Google Scholar]
- Bai, C.-E.; Hsieh, C.-T.; Qian, Y. The Return to Capital in China; National Bureau of Economic Research: Cambridge, MA, USA, 2006. [Google Scholar]
- Roxburgh, C.; Lund, S.; Daruvala, T.; Manyika, J.; Dobbs, R.; Forn, R.; Croxson, K. Debt and Deleveraging: Uneven Progress on the Path to Growth. 2012. Available online: https://www.mckinsey.com/featured-insights/employment-and-growth/uneven-progress-on-the-path-to-growth (accessed on 22 November 2019).
- Reinhart, C.M.; Rogoff, K.S. Growth in a Time of Debt. Am. Econ. Rev. 2010, 100, 573–578. [Google Scholar] [CrossRef]
- Wei, S.-J.; Boyreau-Debray, M.G. Can China Grow Faster? A Diagnosison the Fragmentation of the Domestic Capital Market; International Monetary Fund: Washington, DC, USA, 2004. [Google Scholar]
- Laopodis, N.T. Effects of government spending on private investment. Appl. Econ. 2001, 33, 1563–1577. [Google Scholar] [CrossRef]
- Gupta, S.; De Mello, L.; Sharan, R. Corruption and military spending. Eur. J. Political Econ. 2001, 17, 749–777. [Google Scholar] [CrossRef]
- Wu, G.L. Capital misallocation in China: Financial frictions or policy distortions? J. Dev. Econ. 2018, 130, 203–223. [Google Scholar] [CrossRef]


© 2019 by the authors. Licensee MDPI, Basel, Switzerland. This article is an open access article distributed under the terms and conditions of the Creative Commons Attribution (CC BY) license (http://creativecommons.org/licenses/by/4.0/).