Article

Environmental Implications of the National Power Roadmap with Policy Directives for Battery Electric Vehicles (BEVs)

1
College of Agriculture and Life Sciences, Seoul National University, Seoul 08826, Korea
2
NorthStar Initiative for Sustainable Enterprise, Institute on the Environment, University of Minnesota, 325 Learning and Environmental Sciences, 1954 Buford Ave, Saint Paul, MN 55108, USA
3
Department of Bioproducts and Biosystems Engineering, and Institute on the Environment, University of Minnesota, St. Paul, MN 55108, USA
4
Research Institute of Agriculture and Life Sciences, Seoul National University, Seoul 08826, Korea
5
Spatial Information Research Institute, Korea Land and Geospatial Informatix Corporation, Jeonju 54870, Korea
6
Graduate School of International Agricultural Technology, and Institute of Green Bio Science Technology, Seoul National University, Pyeongchang 25354, Korea
*
Author to whom correspondence should be addressed.
Sustainability 2019, 11(23), 6657; https://doi.org/10.3390/su11236657
Submission received: 31 October 2019 / Revised: 19 November 2019 / Accepted: 22 November 2019 / Published: 25 November 2019

Abstract

:
The environmental impact of battery electric vehicles (BEVs) largely depends on the environmental profile of the national electric power grid that enables their operation. The purpose of this study is to analyze the environmental performance of BEV usage in Korea considering the changes and trajectory of the national power roadmap. We examined the environmental performance using a weighted environmental index, considering eight impact categories. The results showed that the weighted environmental impact of Korea’s national power grid supply would increase overall by 66% from 2015 to 2029 using the plan laid out by the 7th Power Roadmap, and by only 33% from 2017 to 2031 using the 8th Power Roadmap plan. This change reflects the substantial amount of renewables in the more recent power mix plan. In 2016, BEV usage in Korea resulted in emissions reductions of about 37% compared with diesel passenger vehicles, and 41% compared with gasoline vehicles per kilometer driven (100 g CO2e/km versus 158 g and 170 g CO2e/km, respectively) related to transportation sector. By 2030, BEV usage in Korea is expected to achieve a greater emissions reduction of about 53% compared with diesel vehicles and 56% compared with gasoline vehicles. However, trade-offs are also expected because of increased particulate matter (PM) pollution, which we anticipate to increase by 84% compared with 2016 conditions. Despite these projected increases in PM emissions, increased BEV usage in Korea is expected to result in important global and local benefits through reductions of climate-changing greenhouse gas (GHG) emissions.

1. Introduction

Widespread concern about climate change has prompted policymakers to create eco-friendly transportation policies to increase the number of electric vehicles (EVs) to reduce greenhouse gas (GHG) generation in many countries [1,2]. In 2015, the number of EVs around the world reached 1.26 million cars, which was a 79% increase from 2014. Many countries have promoted EVs through active policies such as subsidies for purchasing EVs and increasing charging stations [3,4]. It is expected that sales of EVs will continue to soar between 2025 and 2030, constituting 54% of new light-duty car sales and accounting for 33% of the global market share by 2040 [5]. It is assumed that EVs will reduce global GHG emissions in the transportation sector, which contributed to more than 23% of global GHG emissions in 2013 [6,7]. Upadhyay and Wilson [8] argued that if EVs account for 33% of cars globally, it will have the effect of replacing about 8 million barrels of fuel per day in 2040. However, increased usage of battery electric vehicles (BEVs) will likely result in rapid increases in electricity demand for BEVs from 6 TWh in 2016 to 1800 TWh by 2040, based on expected usage of BEVs in 2040 [5].
BEVs are often assumed to be beneficial for the environment and human health because, unlike the internal combustion engine vehicle (ICEV) counterparts, BEVs have no tailpipe emissions [9]. Determining the environmental performance, however, requires a life cycle perspective to examine the full environmental and human health implications of producing, operating, and disposing of the vehicles [10,11,12]. The operation phase typically makes up about 67% of life cycle emissions per vehicle kilometer traveled (VKT), with GHGs from the vehicle’s body and battery manufacturing accounting for about 29% of the total, and emissions from maintenance and repair accounting for 4% of life cycle emissions [10]. The ability of BEVs to reduce GHG emissions [13,14], therefore, is entirely dependent on the power mix (i.e., the portion of power generated from different energy sources, including solar, wind, coal, and natural gas) [15,16]. Driving a BEV in Norway, for example, results in less emissions than driving a BEV in European Union (EU) countries, and substantially less emissions than driving a BEV in China (7 g CO2e/vehicle kilometer traveled (VKT), 84 g CO2e/VKT, and 171 g CO2e/VKT, respectively) [17].
While BEVs have been widely shown to beneficially lower GHG emissions compared with ICEVs, there are potential trade-offs that may result in increased impacts in other environmental impact categories [18]. It is known, for example, that across multiple vehicle fuel types, air quality-related human health damage from vehicles is generally comparable to or larger than climate change impacts [19,20]. Hawkins [21] estimated the environmental impacts of BEVs and ICEVs in various impact categories such as global warming potential (GWP), human toxicity potential (HTP), ecotoxicity potential (ETP), and metal depletion potential, considering the vehicle production, use phase, and end of life stages. Other recent studies have examined trade-offs across various environmental impact categories. However, they are limited in that the authors did not consider the environmental impacts of electricity generation [22,23], a fundamental factor for determining environmental performance of BEVs in different geolocation contexts. With the current strong Korean economy, the middle class is rapidly expanding and the population in the largest cities is soaring, which has led to increased car ownership. Transitioning to BEVs has been widely touted as a key strategy to reduce development-related emissions from transportation [24,25,26]. Considering the urgency to address climate change and the different policy incentives being entertained to increase BEV adoption, it is important to examine potential trade-offs of increased electricity usage from BEV adoption. In particular, it is necessary to anticipate and take the essential steps to avoid negative externalities to ecosystems and human health.
The goal of this study is to evaluate the environmental implications of BEV adoption in Korea, across eight environmental impact categories, considering the current power mix and future power mixes planned in the National Power Roadmap, BEV passenger vehicle market share, and associated fuel efficiency. We then examine these results in the context of Seoul, Korea’s capital city and considered one of the world’s megacities, with a population that is expected to reach 26.7 million by 2030. Finally, we discuss the implications of the national power roadmap plan, as well as trends in fuel efficiency. We focus on the environmental benefits and impacts of BEVs, highlighting the necessary next steps for mitigating adverse trade-offs associated with wider BEV adoption.

2. Materials and Methods

2.1. Environmental Impact Using Life Cycle Assessment

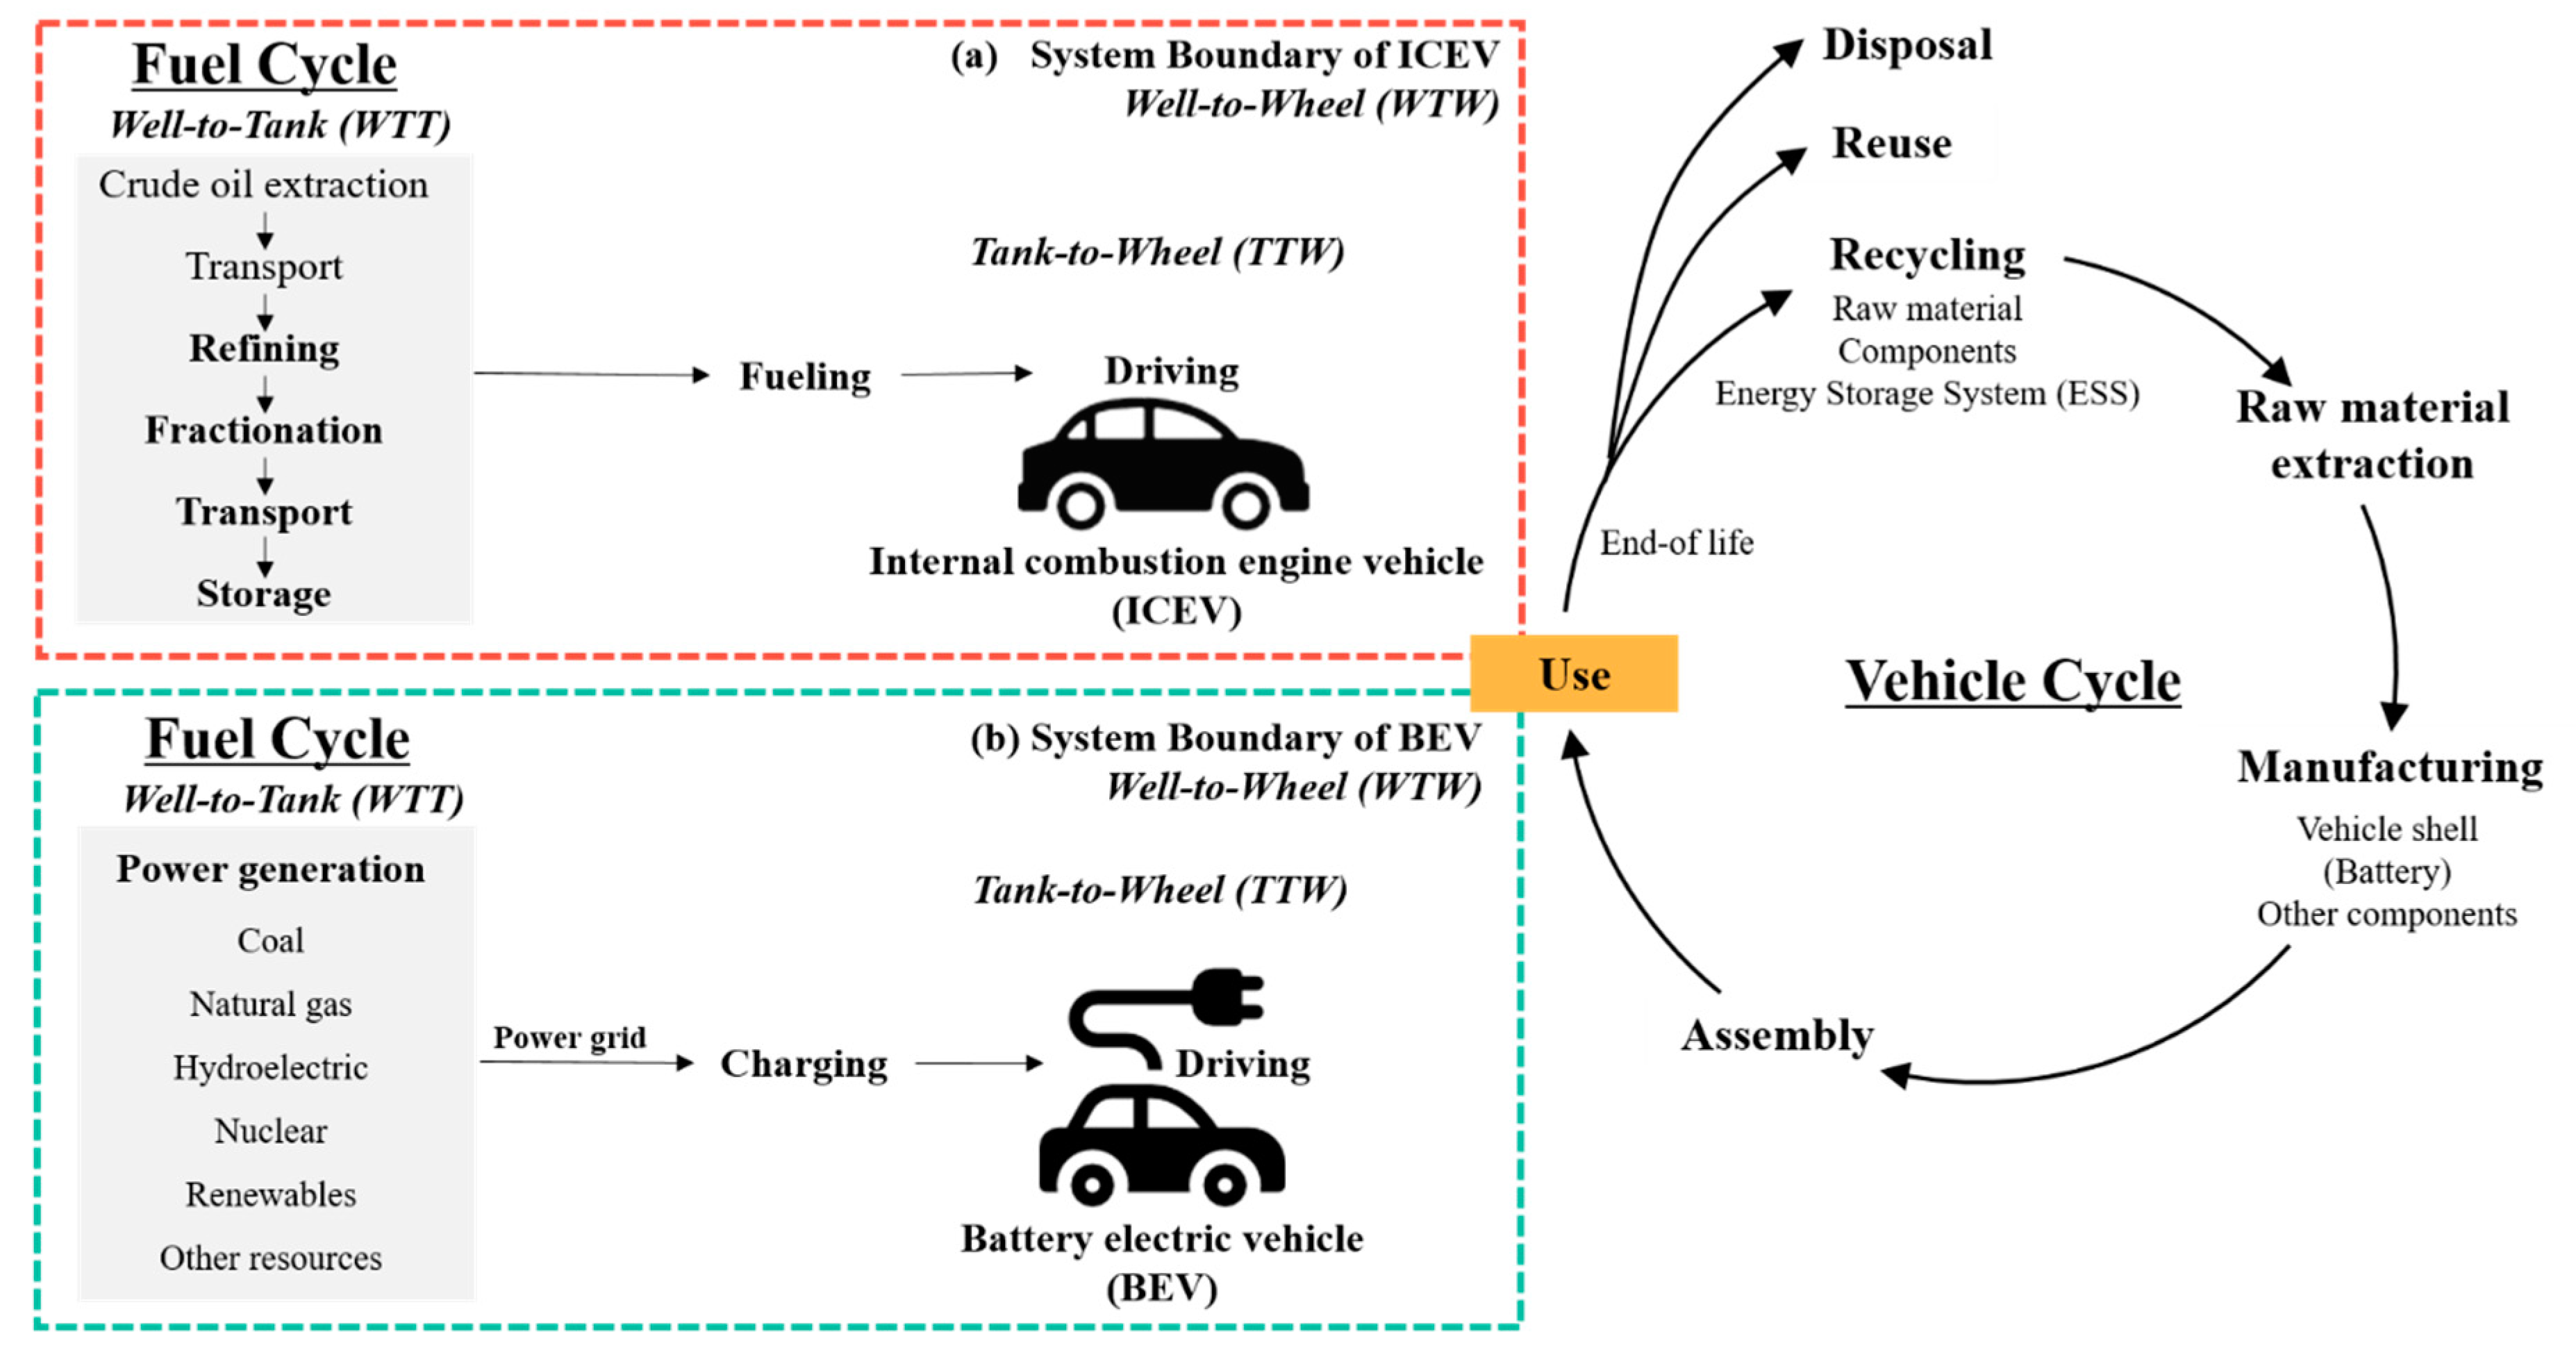
2.1.1. Goal and Scope Definition

Life cycle assessment (LCA) is commonly used to evaluate the potential environmental impact of products or services considering the whole life cycle from “cradle to grave” (i.e., from extraction of raw materials, processing, production, transportation, retail, use, and end of life). The full assessment of LCA can be used to compare the life cycle environmental impact of functionally equivalent products and services [27,28,29,30]. Thus, this study applies LCA to evaluate the relative environmental performance of ICEVs and BEVs considering the Korean national grid mix.
The functional unit of this study is one vehicle kilometer traveled (VKT), which focuses on the operation phase of the vehicle’s life cycle, and the associated system boundary from well-to-wheels (WTW). This WTW system boundary links the environmental impacts generated from well-to-tank (WTT), and tank-to-wheels (TTW), in order to more comprehensively compare BEV and ICEV emissions (see Figure 1) [31,32,33]. In the context of BEVs, the WTW boundary takes into account not only the emissions from electricity generation, but also emissions from extraction of the energy resources used for electric power generation, such as the emissions from extraction of natural gas, coal, oil, production of hydroelectric, nuclear, and solar photovoltaics (PVs) power sources [34]. The WTW system boundary for gasoline and diesel vehicles includes extraction and refining of crude oil, gasoline and diesel fractionation, and distribution, representing the WTT portion, and the final fuel combustion for vehicle operation, representing the TTW portion. The environmental impacts of constructing charging infrastructures for BEVs, however, are not included in the system boundary.

2.1.2. Energy Efficiency of ICEV and BEV

To estimate the amount of fuel and electricity required per VKT for ICEVs and BEVs, respectively, we use the reported fuel efficiency by car company without considering changes in performance over the life span of the vehicle. The Korea Energy Agency (KEA), on behalf of the Ministry of Trade, Industry, and Energy (MOTIE), reported that gasoline-powered and diesel passenger vehicles achieved on average 13.96 km/L and 19.14 km/L, respectively, in 2016 [35]. This fuel economy on average of ICEVs reporting by KEA was estimated by 44 vehicle models that sold both gasoline- and diesel-powered vehicles in common [35]. As no aggregate data source exists to describe the average fuel economy equivalent of BEVs in Korea, we instead estimate the weighted average driving distance per kWh considering the Korean market sales, corresponding BEV energy consumption, and vehicle range, resulting in a combined average of 5.9 km/kWh in 2016 and 5.8 km/kWh in 2017. These estimated BEV efficiencies are 10–27% higher than other studies at a comparative 5.3 km/kWh [36] and 4.6 km/kWh [37], respectively. Hyundai’s IONIQ EV dominates the Korean BEV market share, with 67.9% market share in 2016, followed by the KIA Soul EV with 13.5% market share in 2016. Table A1 in the Appendix A describes further details about the technical specifications and sales of BEVs released in Korea, as well as corresponding energy efficiency.

2.1.3. Life Cycle Inventory and Impact Assessment

We use national life cycle inventories (LCIs) of fossil fuels (gasoline and diesel) and electricity generation from the Korea Environment Industry & Technology Institute [38] of the Ministry of Environment [39]. The national LCIs of electricity generation by source include reservoir hydroelectric power, coal and oil thermal power (anthracite coal, bituminous coal, and heavy oil), liquefied natural gas (LNG) combined cycle power, nuclear power, and photovoltaic power for production of 1 kWh.
This study used the environmental impact categories recommended by the U.S. Environmental Protection Agency (U.S. EPA) to evaluate the environmental impact of 1 kWh electricity. The selected environmental categories are as follows: abiotic depletion potential (ADP), acidification potential (AP), eutrophication potential (EP), global warming potential (GWP), human toxicity potential (HTP), ozone depletion potential (ODP), photochemical oxidants creation potential (POCP), and particulate matter (PM).
To compare and aggregate the total environmental impact potential across these eight impact categories, we normalized the emission data using annual average emissions per capita for each impact category published by the Korean Ministry of Environment [39]. We then combined the data with weighting factors for each environmental impact category, which is based on a Covenant with the Netherlands Oil and Gas Exploration and Production Association (NOGEPA) suggested by Huppes’s studies [40,41]. See Table A2 of the Appendix A for details about the normalization or weighting factors used in this study.

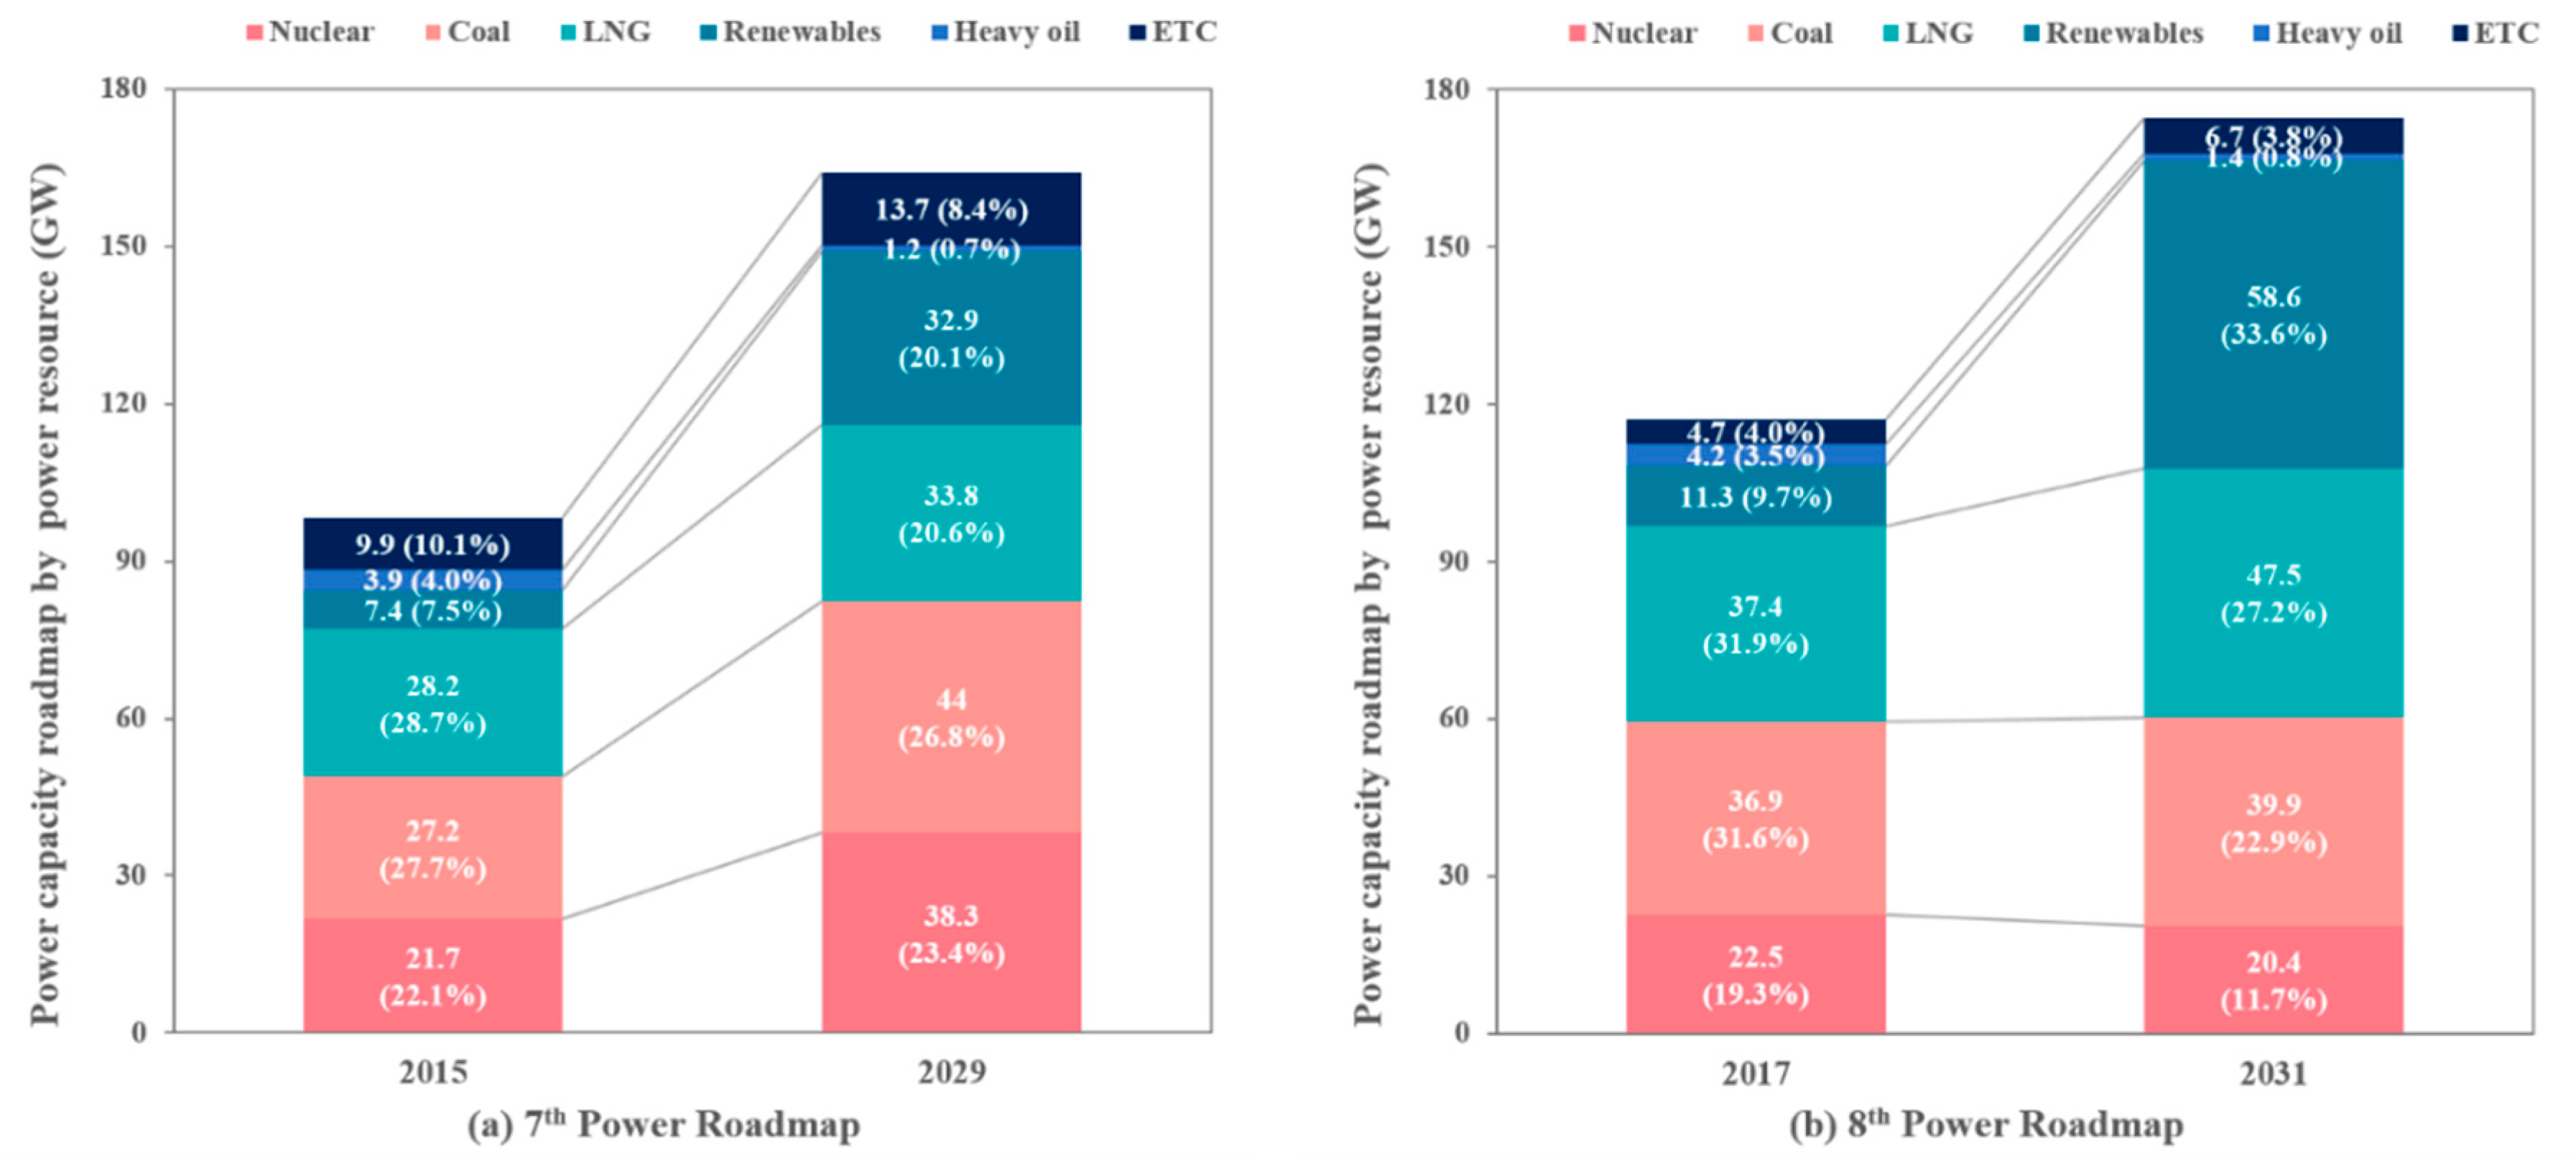
2.2. National Power Mix and Roadmap in Korea

In 2017, the Korean national power mix consisted of 0.8% hydroelectric (including general reservoir, micro-hydro, and pumping), 44.7% steam (0.8% from anthracite coal, 43.1% from bituminous coal, and 0.8% from heavy oil), 19.1% liquefied natural gas (LNG), 4.5% renewable energy (primarily from biogas, PV solar, and biomass-based energy), and 28.4% nuclear power [42]. Power consumption in Korea has substantially increased since 1999, with an annual increase of about 5% due to the increasing population and growth of the middle-class, resulting in almost double the annual gross production in 2017 compared to 1999 (from approximately 220.3 TWh in 1999 to approximately 523 TWh in 2017) (Figure 2).
About 4.5% of total electricity generation in Korea in 2016 was renewable energy (without hydro power), including generation from biogas (37.1%), PV solar (26.5%), biomass-based energy (9.5%), wind (9.2%), and other energy (17.7%) sources [43]. However, when comparing the renewable energy ratio to primary energy, the Korean renewable energy ratio was significantly lower than those of other developed countries in 2016: 1.7% in Korea; 17.3% in Italy; 12.7% in Germany; 9.6% in France; 8.2% in England; 7.1% in United States; and 6.5% in Australia [43].
In Korea, the national power roadmap is revisited every two years and planned out for the next 15 years. While the focus of the plans has always been on creating low cost electricity supplies, the latest plan covering 2017–2031, known as the 8th national power roadmap [44], considers not only low cost generation, but also environment and energy security considerations. The 8th power roadmap expects the power capacity to increase from 117 GW in 2017 to 174.5 GW in 2031, with the proportion of coal power expected to decrease from 31.6% to 22.9%, LNG power to decrease from 31.9% to 27.2%, and heavy oil power to decrease from 3.5% to 0.8%, while renewable power is planned to increase from 9.7% to 33.6% of the total electric power generation capacity. Nuclear power will also decrease from 19.3% to 11.7% of the total power mix due to the Korean government’s anti-nuclear policies (Figure 3). With the power capacity plan, the proportion of power is expected to decrease from 45.4% to 36.1% for coal power and from 30.3% to 23.9% for nuclear power. However, the proportion is expected to increase from 16.9% to 18.8% of LNG power and 6.2% to 20.0% of renewable power in total from 2017 to 2031. These changes of power capacity plan are expected to reduce not only GHG emissions by 2.37 million tons, which is a 26.4% reduction in the power generation sector in 2030 compared to baseline-as-usual (BAU), but also 13 thousand tons of fine particulate matter (PM2.5, particle size under 2.5 μm) [42].

2.3. Environmental Benefits of BEVs Commuting in Megacities

To characterize the implications of increased BEV adoption, we evaluated the environmental impacts of commuting in a megacity considering the commuting distance, traffic volume, and different penetration scenarios based on the national plans and market growth rates to replace ICEVs with BEVs. Megacities are defined as large metropolitan areas with a population of more than 10 million people [45,46,47]. These cities usually have massive commuting traffic volumes that cause substantial GHG emissions and air quality issues [45,46,47], thus representing an excellent test-bed to examine the national power policy directives on the environmental performance of BEVs.
Korea’s capital, Seoul, is one of the top 15 largest megacities in the world, with a metropolitan area consisting of 76 counties across Seoul city, Incheon, and Gyeonggi. In 2016, the Seoul metropolitan region housed almost 25 million people (49.5% of gross population) across 11,745 per square kilometer (11.8% of total land area), with a population density of 2160 per square kilometer, representing one of the highest in the world.
In 2016, the Seoul metropolitan region contained almost 46% of the entire national fleet of passenger vehicles, at approximately 7.95 million vehicles (2.6 million vehicles in Seoul, 1.2 million vehicles in Incheon, and 4.2 million vehicles in Gyeonggi). Among these Seoul metropolitan passenger vehicles, 88% are ICEVs (58% gasoline-powered, 30% diesel-powered vehicles) in addition to 10% liquefied petroleum gas (LPG) powered vehicles and 1.8% hybrid vehicles and BEVs.
To estimate the total vehicle kilometers traveled (VKT), we first developed an origin–destination (O–D) real road distance matrix between each of the 76 counties within the Seoul metropolitan region based on road map layers using ArcGISTM. The resulting county-level distance matrix was combined with a similar O–D matrix describing commuting traffic volume data between counties. These data were provided by the Korea Transport Database from the Korea Transport Institute, and based on household vehicle operation surveys, which are conducted every five years by the Korean government. Among the actual household operation data, we used the passenger vehicle type O–D matrix for commuting. We combined these O–D matrices to derive the total commuting distance (TD, in vehicle kilometers traveled) for passenger vehicles in the Seoul metro region from county i to county j ( t d i j ) [48], as described in Equation (1):
T D = i j t d i j = i j ( x i j × d i j ) ,
where x i j is the number of passenger vehicles traveling between an origin-destination county pair and d i j is the shortest path of real road distance from county i to county j .
The total environmental impact corresponding to impact category k ( T E I k ) from commuting was further estimated by combining the total VKT distance (TD) with the emission factors per VKT (EF) for each impact category k, as detailed in Equation (2):
T E I k = k ( T D × E F k ) .
The emission factors represent the weighted average emissions per vehicle kilometer traveled based on the distribution of gasoline, diesel, and BEV vehicles on the road, as well as their respective average fuel economy. The states within the Seoul metropolitan region (Seoul, Incheon, and Gyeonggi) have developed passenger BEV market penetration targets for 2022 and 2025. From 2016 to 2022, Seoul city expects to increase BEVs on the road to 48.5 thousand units, which is expected to increase by an additional 76% by 2025. Incheon and Gyeonggi states are similarly planning for BEVs to increase to 13 and 30 thousand units by 2022, and 25 and 53 thousand units by 2025, respectively. We further considered a scenario for 2030 that assumes all ICEVs will be replaced with BEVs to represent the top end environmental impact reduction or electricity generation potential given the current power mix plans. Details about state-specific BEV penetration plans are available in Appendix A.3 (Table A3) in the Appendix A.
We compare the state-specific BEV penetration plans that replace ICEVs through three scenarios intended to provide insight into the best BEV penetration strategies that achieve the greatest environmental benefits. The three scenarios are as follows: (1) BEVs can randomly replace either gasoline or diesel powered ICEVs in all counties across three states around Seoul (RR-BEV), representing a neutral penetration strategy in which no particular type of commuter is targeted for BEV adoption. This scenario considers the current market share by ICEV type, but ignores commuting distances; (2) BEVs can preferentially replace ICEVs in counties that have comparatively long commuting distances (PR-ICEV), representing a penetration strategy that targets commuters with long commutes, through, for example, increased marketing and/or incentives. This scenario considers current market share by ICEV types and relative commuting distances; and (3) BEVs can preferentially replace diesel-powered ICEVs in counties that have comparatively long commuting distances (PR-DSEL), representing a penetration strategy that targets commuters with diesel-powered long commutes, which considers the current market share by diesel vehicle and relative commuting distances.

3. Results

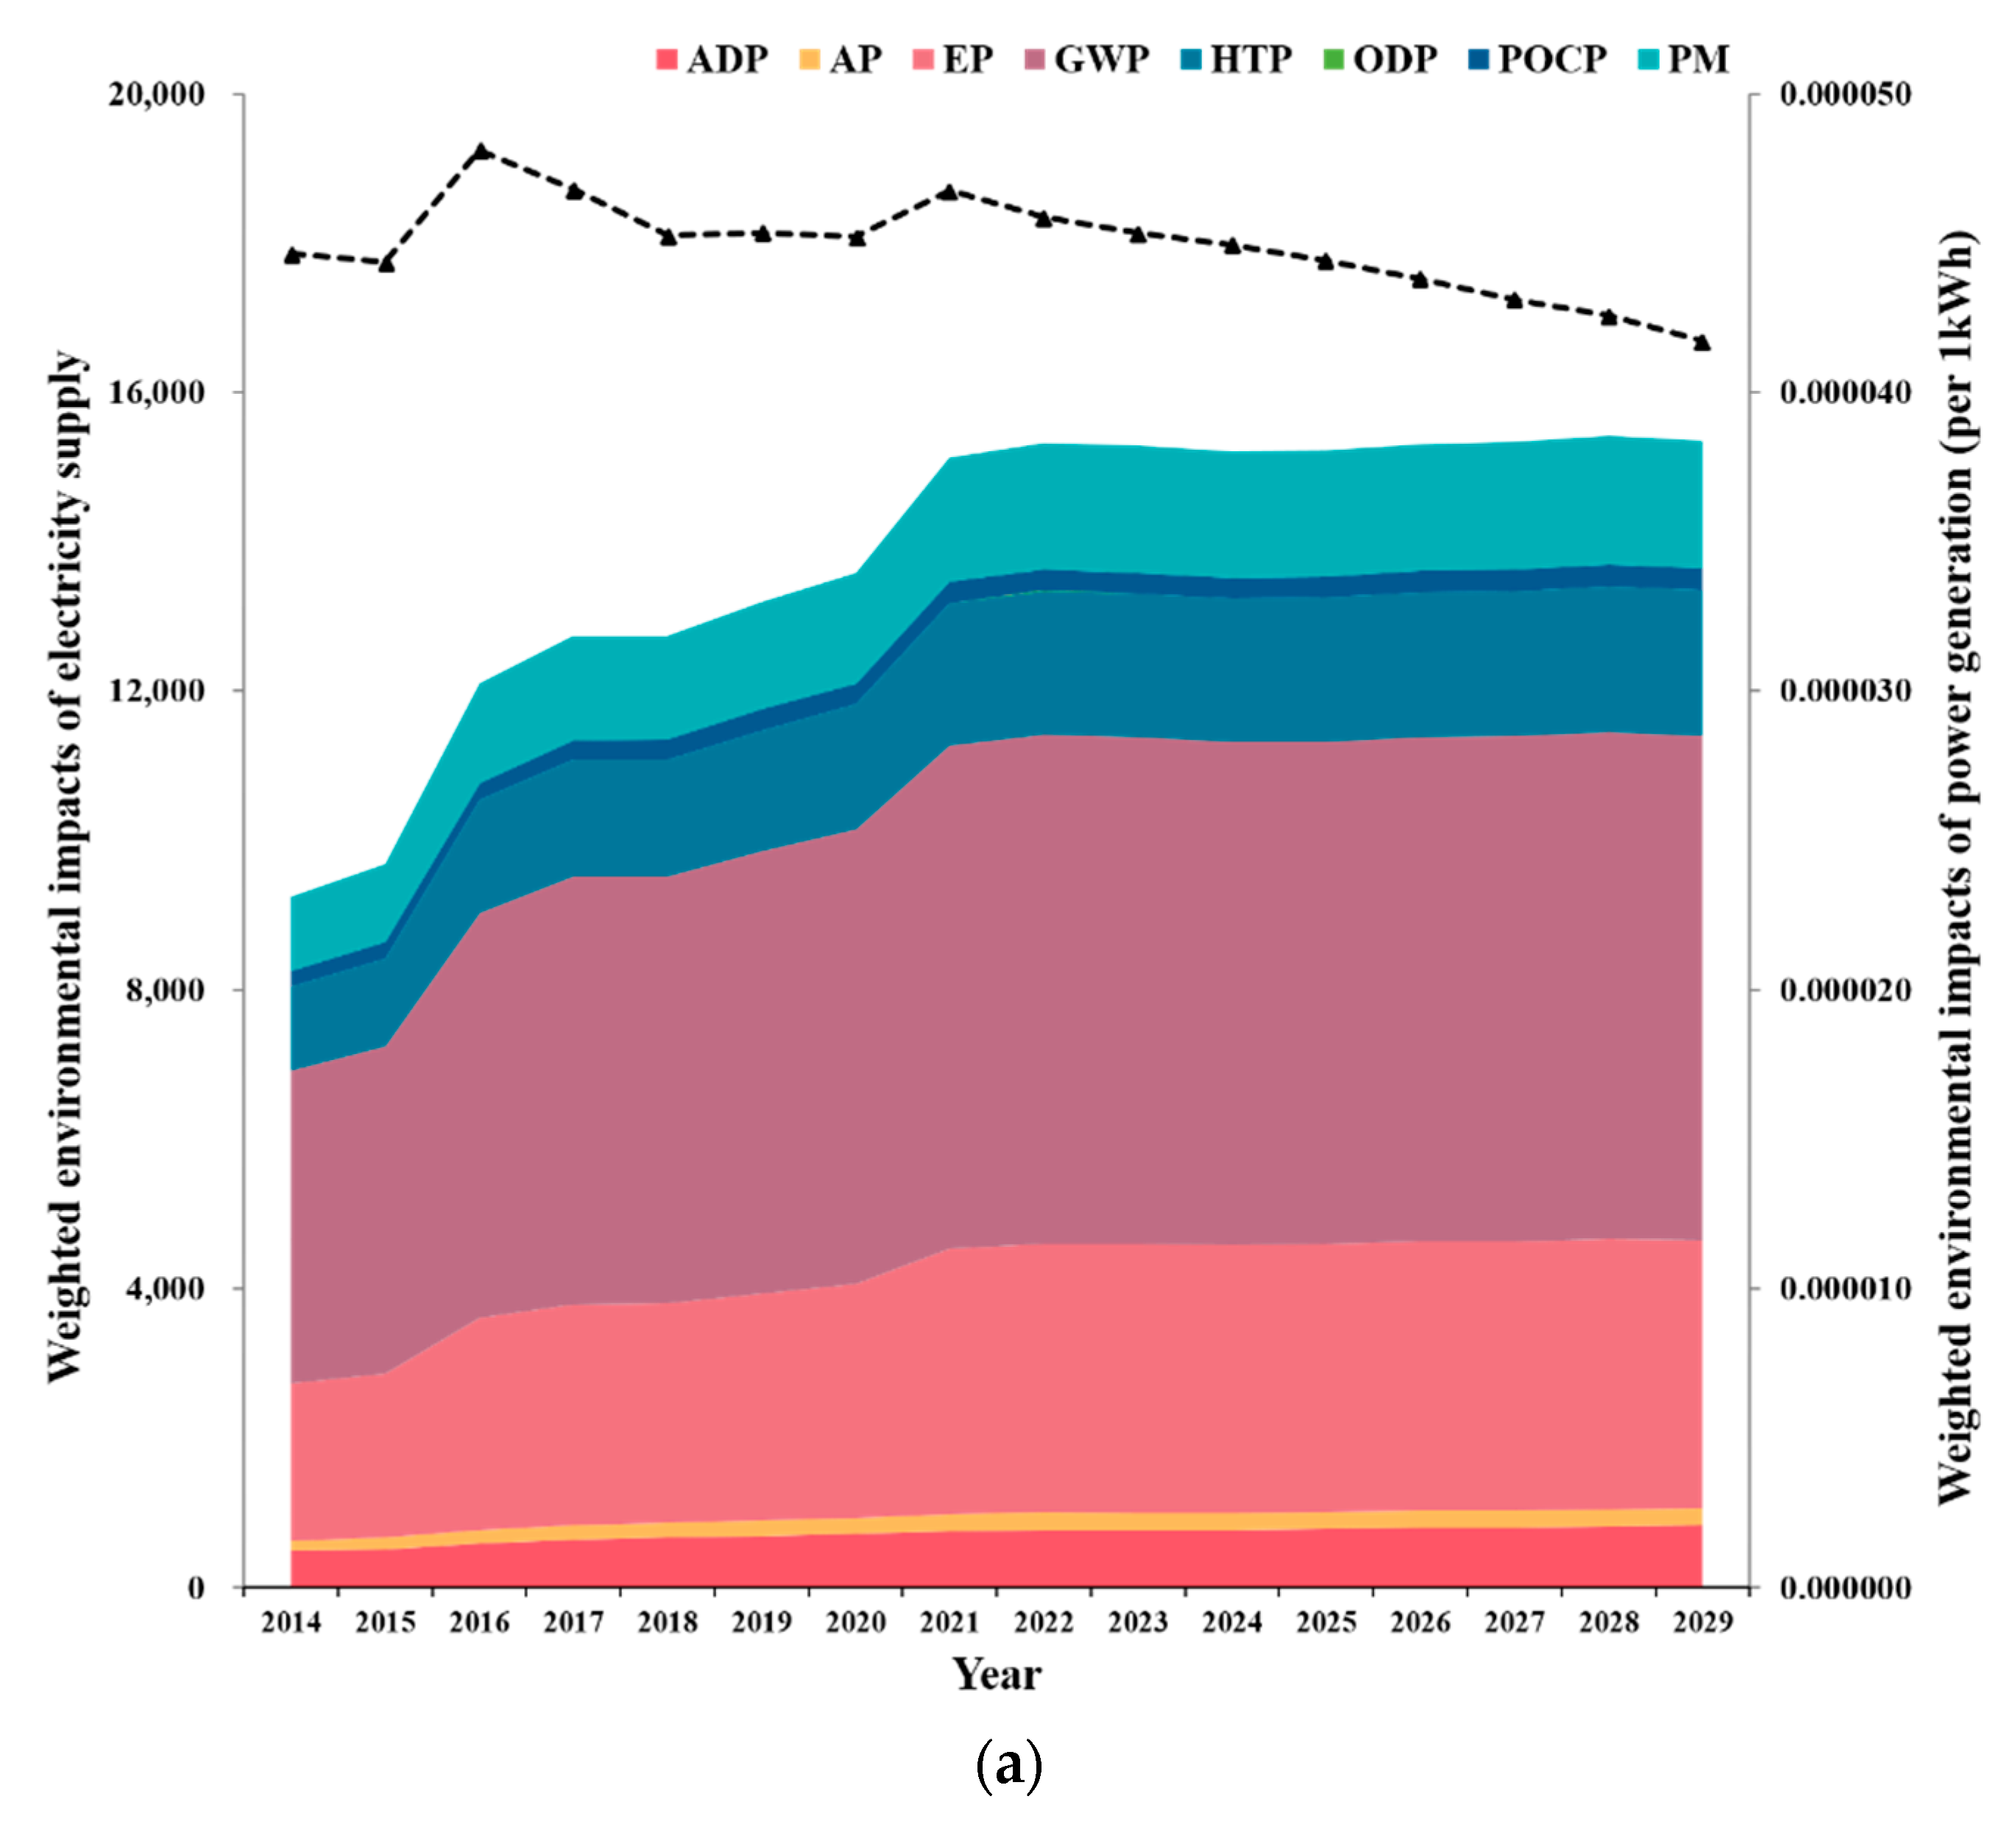
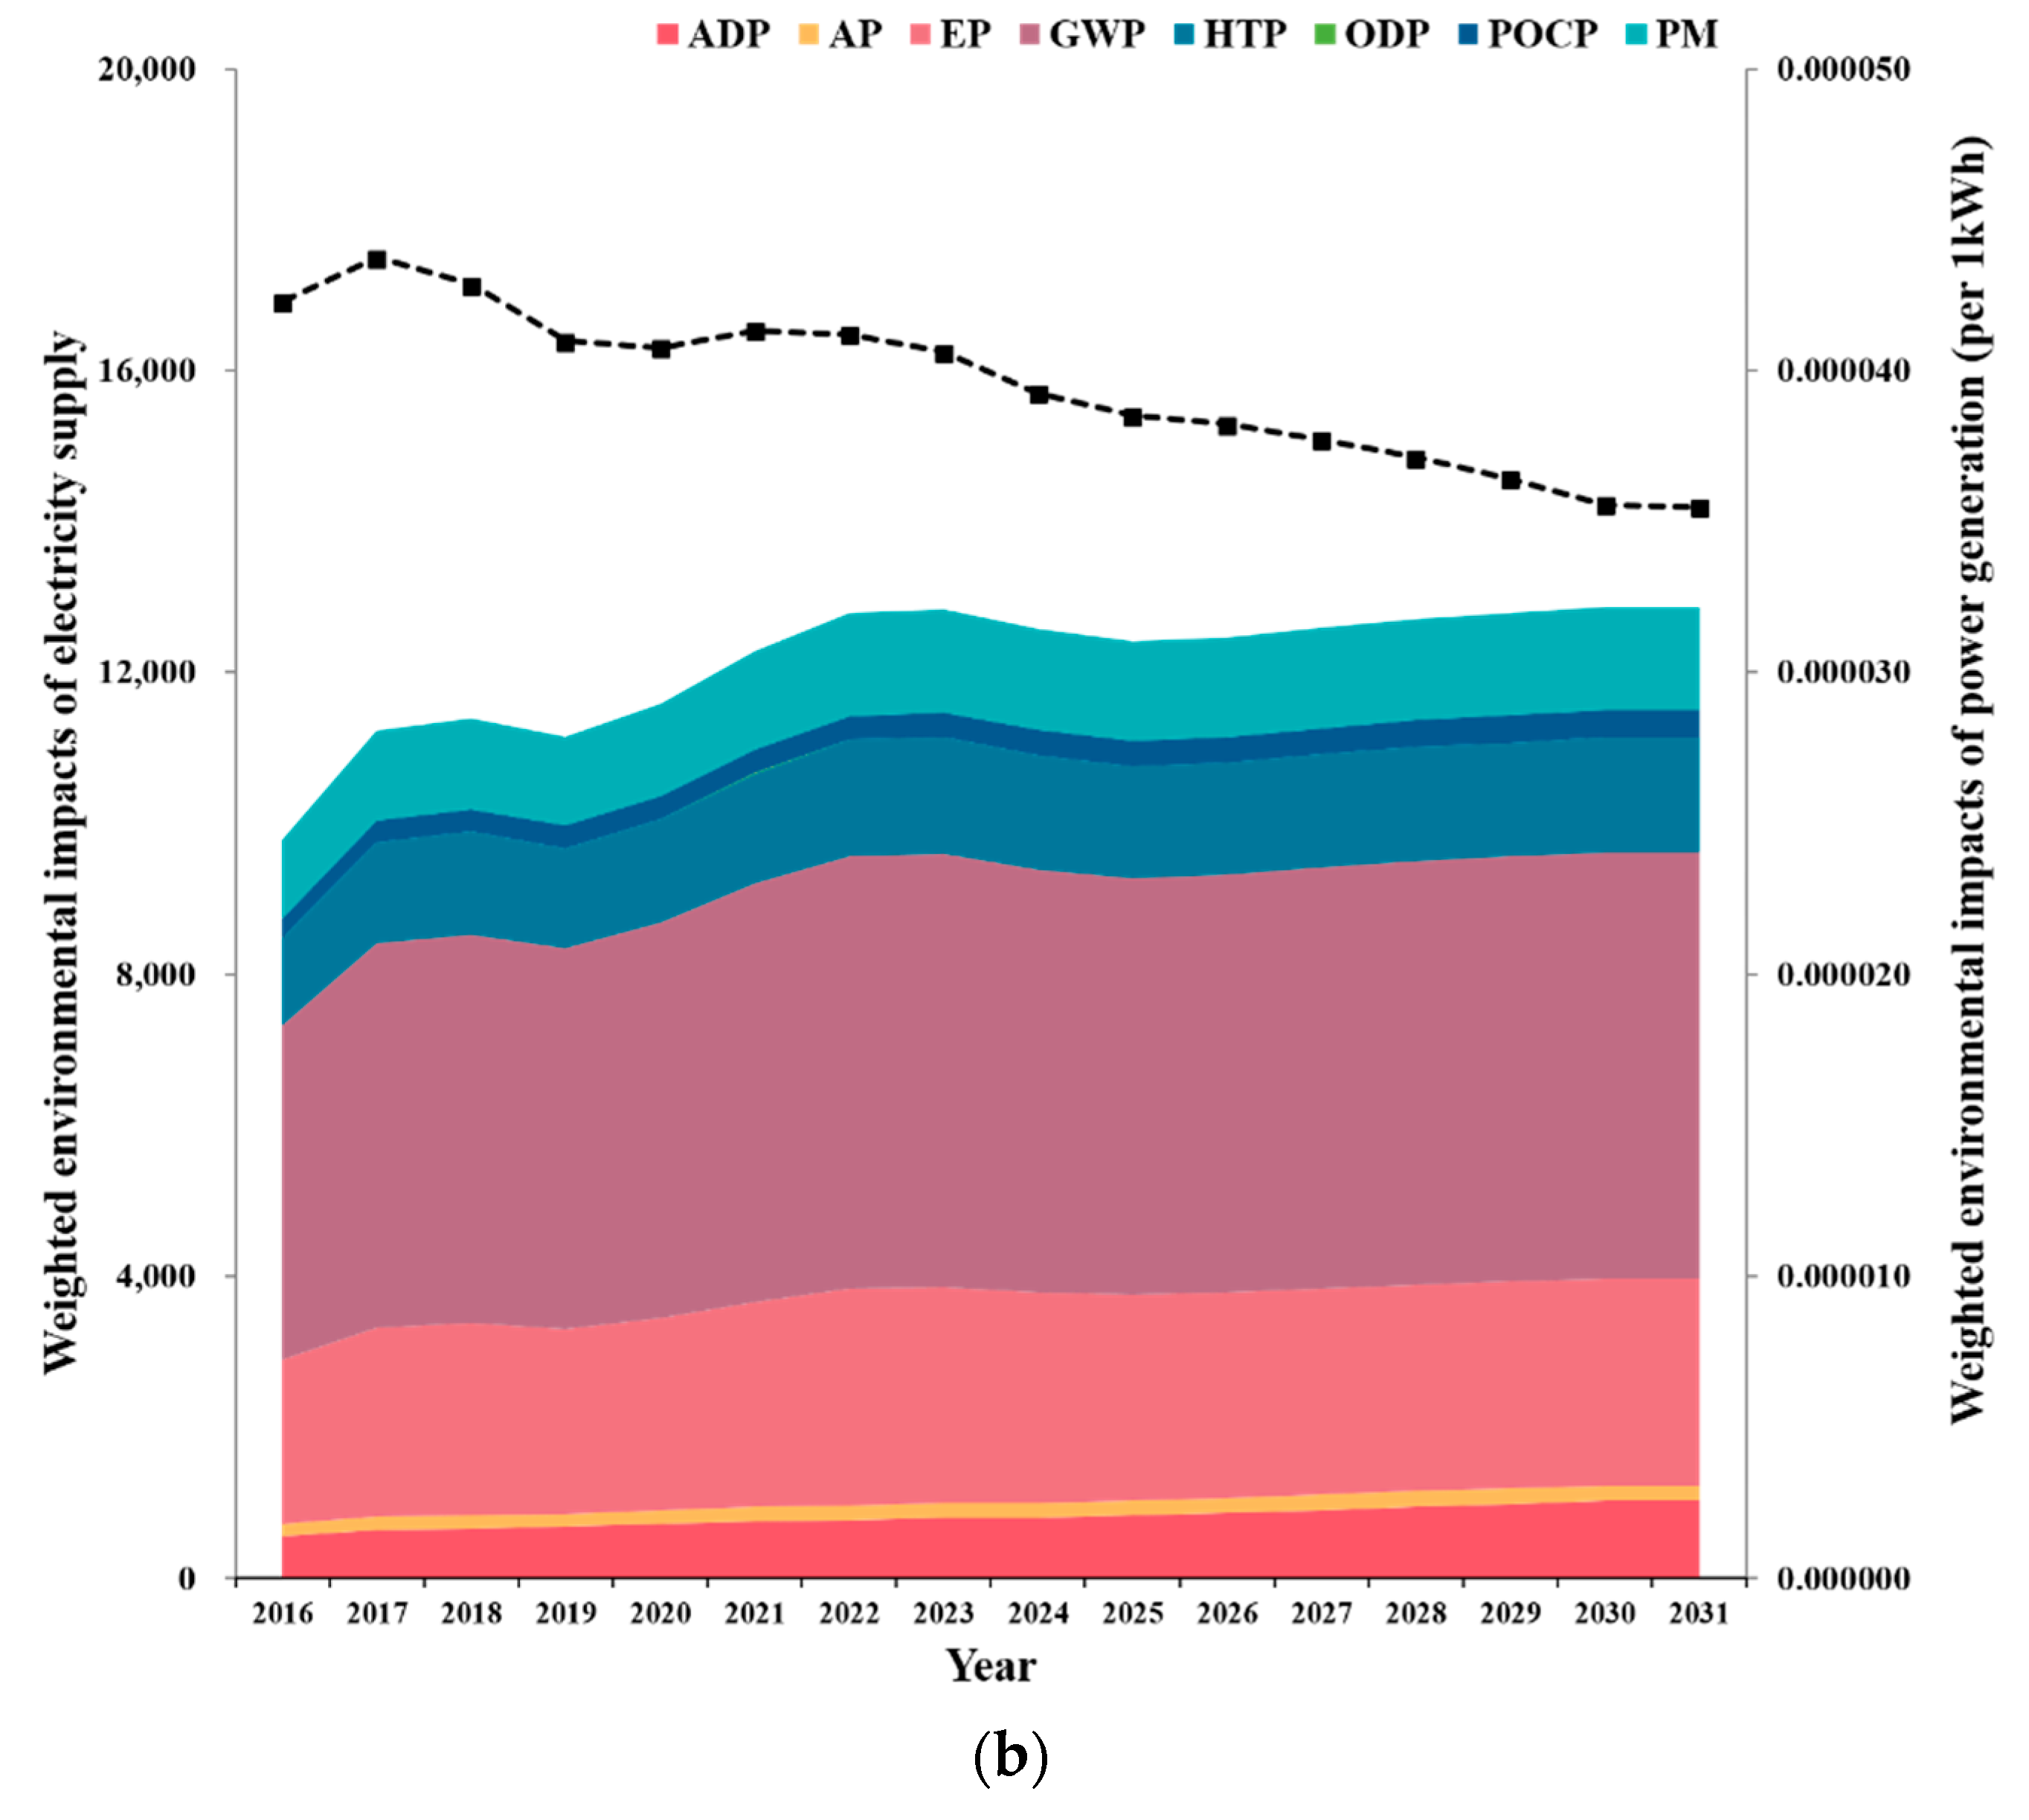
3.1. Environmental Impact of the Korean National Power Roadmap

The environmental impact of electricity generation (1 kWh) by resource is shown in (Figure 4). The LCA result after normalizing and weighting for each environmental impact category revealed that coal-based steam power generation is a dominant source contributing the most to the overall environmental impact for 1 kWh electricity in Korea. The environmental impact of bituminous coal power is the highest among the steam power generation sources. The relative value of the environmental impact for each power source is identified as anthracite coal 33.63, heavy oil 32.20, LNG 17.75, solar PV 9.22, nuclear 3.47, and hydroelectric power 2.79 compared to bituminous coal power on a scale of 100.
The contribution of each impact category varied slightly depending on the electricity generation by source (Figure 5). The global warming potential (GWP) was one of the most influential impact categories in fossil fuel electricity generation including steam power and combined cycle power. The GWP impact contributed 76.6% of the total weighted environmental impact for anthracite coal power; 50.5% for LNG power; and 22.9% for bituminous coal power. For bituminous coal power, the total environmental impacts included HTP 32.0%, GWP 22.7%, EP 22.2%, and PM 21.7%. The dominant impact categories of nuclear power were PM (56.3%) and HTP (38.6%), and the principal impact category of solar PV power was the abiotic depletion potential (ADP) at about 42.7%.
The environmental impact of generating one kWh of electricity and the subsequent total environmental impact of annual electricity production progressively decreases from the 7th [49] to the 8th power roadmap [44], where impacts decrease overall from the baseline years to their respective 2029 and 2031 time horizons, as illustrated in Figure 6. These changes are expected to occur not because of advanced electricity generation technology, but rather in the fuel mix. The total weighted environmental impact generated by each energy source is further detailed in Appendix A.4 (Table A4) in the Appendix A, revealing hydropower as the lowest contributor to environmental impact and bituminous coal as the highest contributor, based on the eight impact categories and selected weights in this study. We expect the 7th power roadmap to reduce total weighted environmental impacts by 6.6% per kWh based on the proposed changes in power mix from 2014 to 2029 [49], with some impact categories having substantial reductions, particularly POCP by 23.8%, GWP by 8.3%, AP by 7.4%, and PM by 1.9% per kWh. The more recent 8th power roadmap, on the other hand, is expected to reduce 16.1% of the total weighted environmental impacts per kWh based on changes in power mixes from 2017 to 2031. In the 8th power roadmap, most impact categories reduce the total weighted impacts by 16–42%, thus achieving greater reduction potential than the 7th power roadmap across the impact categories. Comparing the two roadmaps’ respective time spans for generating 1 kWh of electricity, the 8th portfolio results in 12.3% lower impacts, on average, than those of the 7 power mix, with a minimum difference of 5.6% lower in 2018 and a maximum difference of 15.4% lower in 2025.
While the total weighted environmental impact per kWh of electricity generated is slated to decrease over the 15-year period and further decrease from the 7th to 8th power roadmap plans, the projected increases in the quantity of power required to meet demand results in overall increases in gross environmental impacts. For the 7th power roadmap, gross total weighted environmental impacts overall increase by 58.6% from 2014 to 2029 over 15 years (covering an expected increase in power demand of 76%). For the 8th power roadmap, on the other hand, gross environmental impacts are expected to increase by just 14.7% from 2017 to 2031 considering the changes in the power mix toward a greater share of renewables, covering projected increases in demand of 65%.
Of the environmental impact categories, GWP, HTP, EP, and PM account for about 89% of the total weighted environmental impact, on average, across the timespan. The most influential impact category in the weighted index is GWP, which constitutes 45% of the gross total weighted impacts in 2017 and 44% in 2031. With the changes in the electricity power mix from 2017 to 2031, the proportion of HTP and PM impacts slightly decreases by 12% and 10.5%, respectively. These slight reductions in the proportion of impacts are filled by increasing the impact proportions from GWP and PM. These slight decreases are the result of the reduction in coal power generation in the 8th power roadmap, whose proportion of the fuel mix will decline by 9% by 2031, in accordance with the environmental and human health safety intention of the policy. However, the actual amount of coal power capacity will increase by about 8% from 36,920 MW in 2016 to 39,921 MW in 2031. Thus, the total environmental impact of coal electricity production is still increasing.

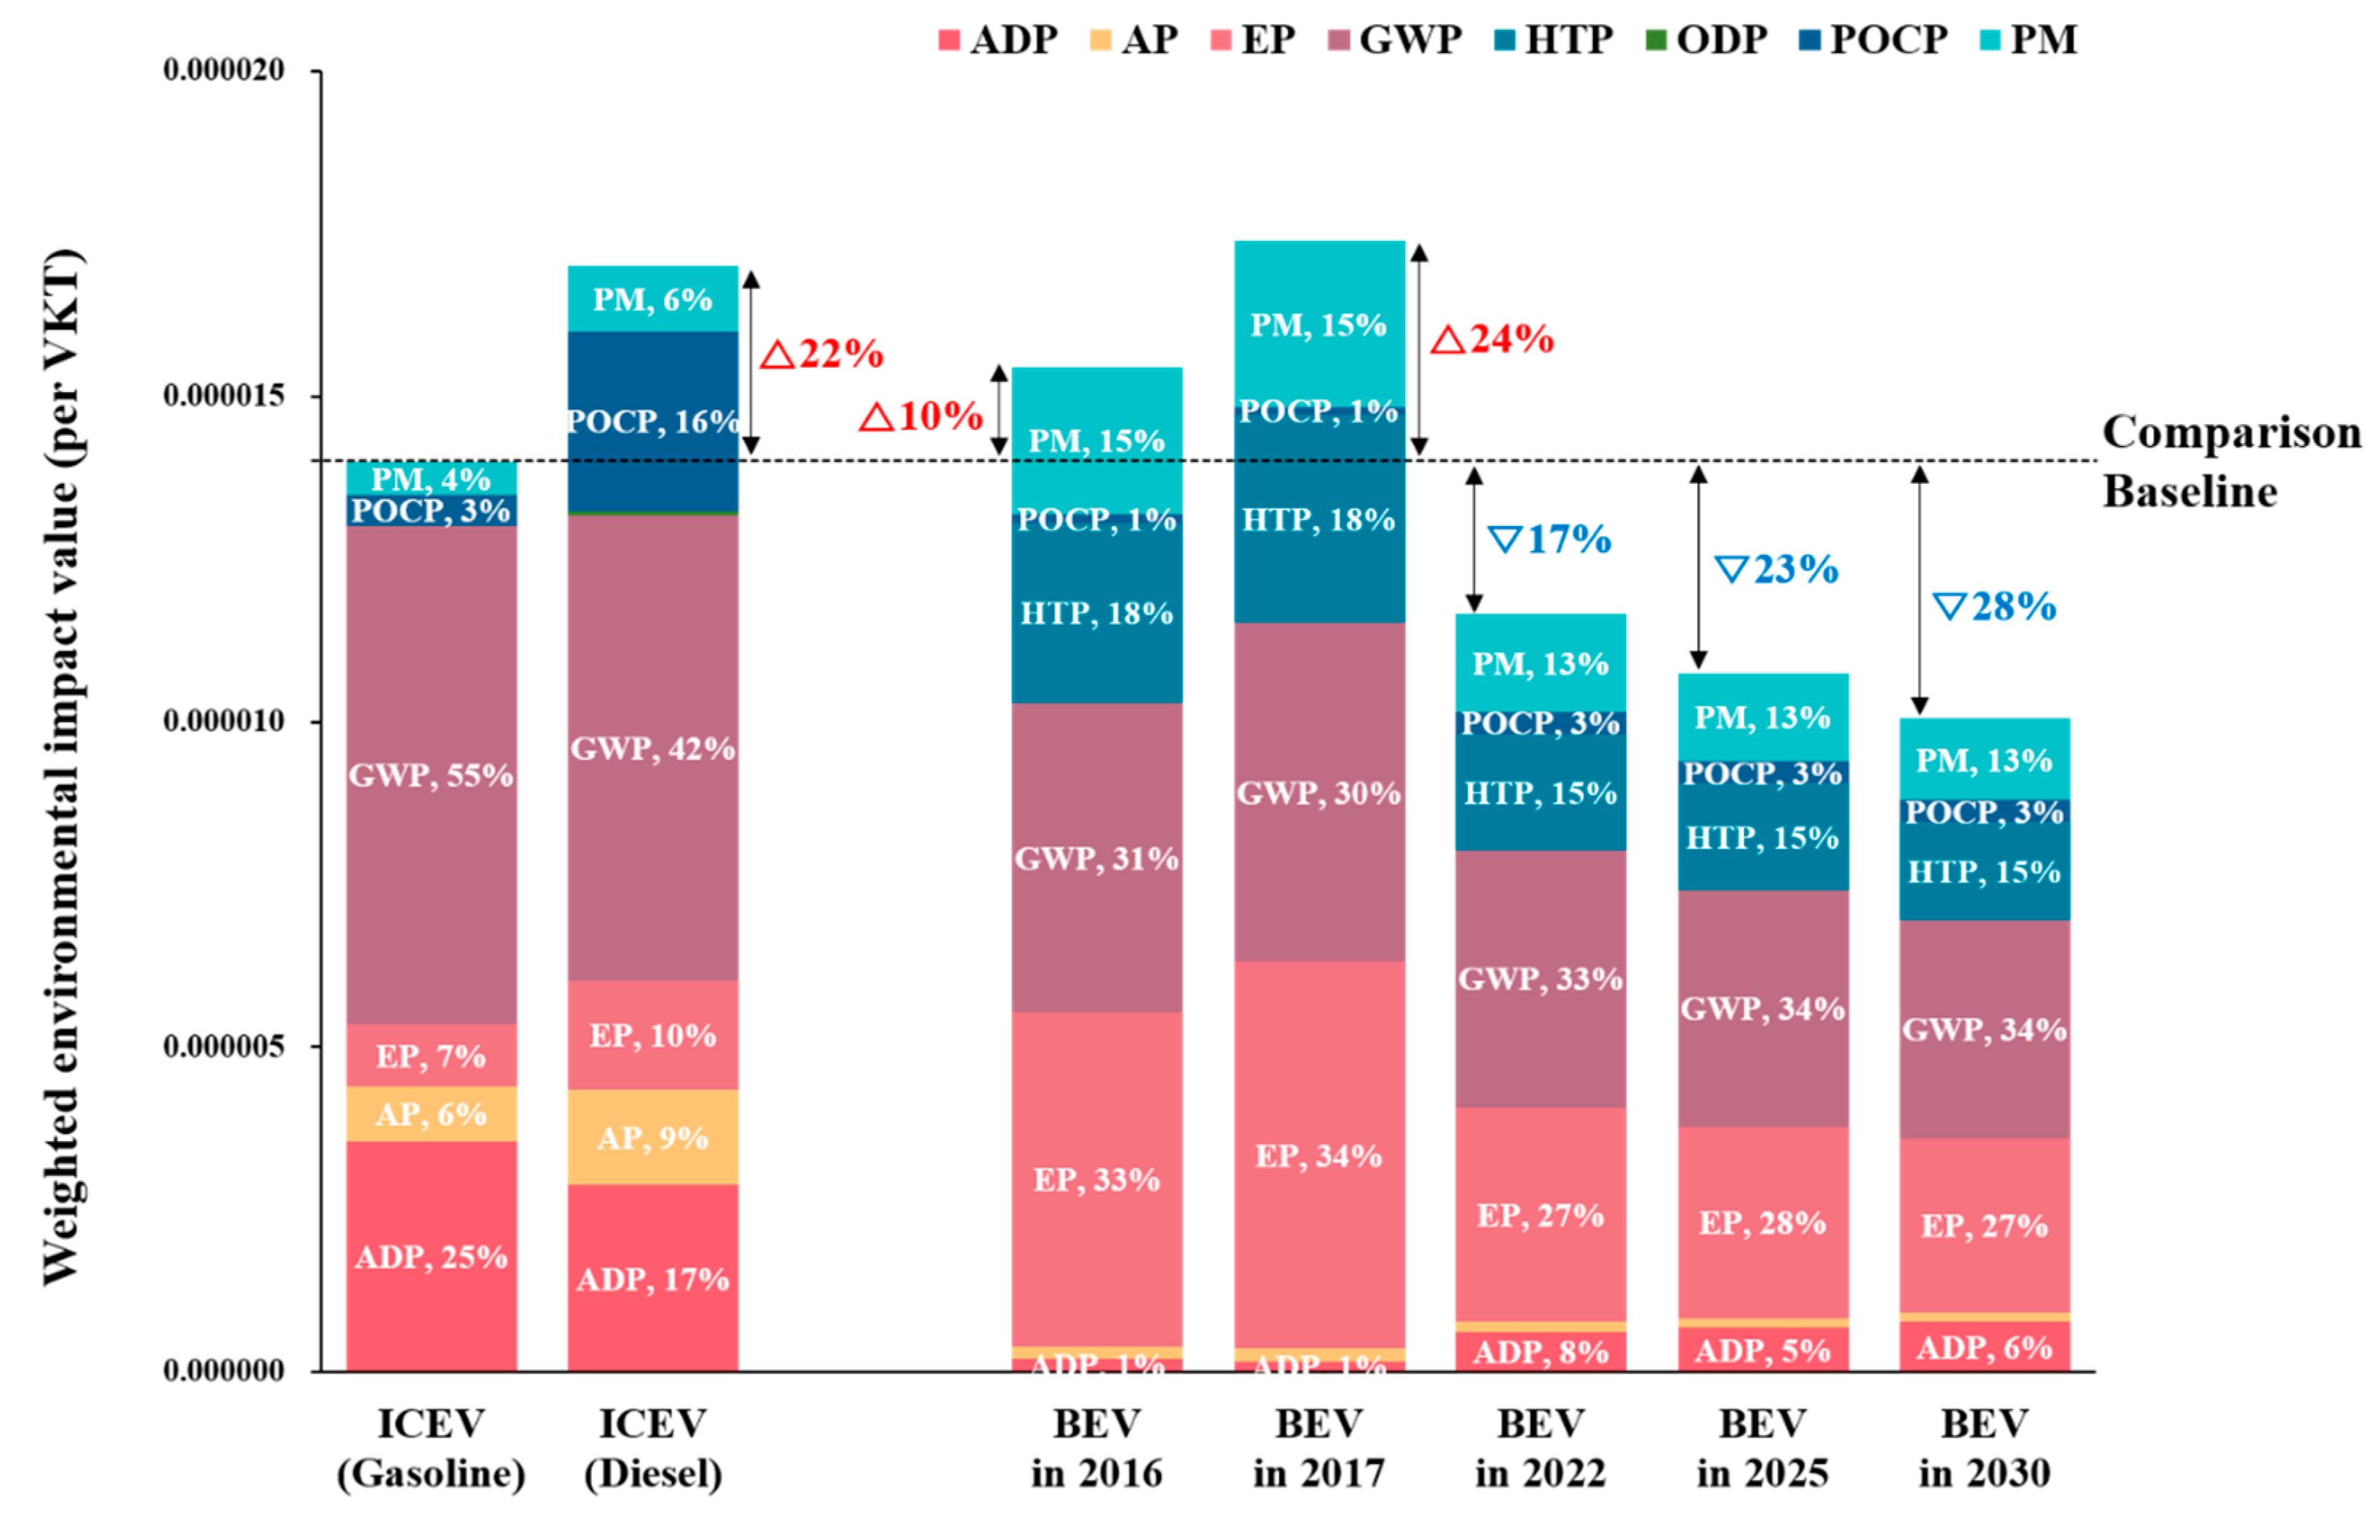
3.2. Environmental Performance of BEVs Compared to ICEVs

Figure 7 shows a comparison of the environmental impact of driving a passenger vehicle one kilometer using ICEVs (gasoline and diesel) versus BEVs (in 2016, 2017, and 2030) considering the available data from vehicle manufacturers on vehicle efficiency and market share. The results show that the total weighted environmental impact of BEVs used in Korea in 2016 was lower than diesel vehicles (by approximately 9%), but, interestingly, it was higher than gasoline vehicles (by about 11%). Across individual impact categories, gasoline-powered vehicles also had less impact than diesel vehicles, with the exception of the ADP, GWP, and ODP impact categories, with the total weighted impact being 22% lower compared with diesel vehicles.
With regard to GWP, our results indicate that gasoline vehicles emit around 170g CO2e per vehicle kilometer traveled (VKT), whereas diesel vehicles generate 158g CO2e per VKT, or about 7% less emissions. BEVs, on the other hand, generate about 100g CO2e per VKT (about 41% less emissions than gasoline ICEVs) using the 2016 electricity power mix and weighted average BEV efficiencies based on the relative market share for each type of vehicle. However, given the electricity power mix and the BEV market share in 2017 (2017 BEVs), GWP emissions per VKT were 15% higher than that in 2016, with about 115 g of CO2e per VKT. This increase is the result of the increased proportion of fossil fuels in the power portfolio, which is further compounded by reductions in the average Korean fuel efficiency of BEVs from 5.91 km/kwh to 5.78 km/kWh in 2017 owing to the changes in market distribution (see Section 2 of SI). Despite these initial increases in BEV impacts, by 2030, it is expected that the GWP of BEVs will decrease to 74 g CO2e per VKT based on the 8th national power roadmap’s increased proportion of renewables on the grid. These reductions in BEV emissions will result in substantial emissions savings of about 96 g CO2e/VKT compared with gasoline ICEVs and savings of 84g CO2e/VKT compared with diesel ICEVs. Thus, over a vehicle’s life span about 150,000 km [21], BEVs can reduce 14.4 tons and 12.6 tons of CO2e compared with gasoline and diesel ICEVs, respectively. See Appendix A.5 (Table A5) and Appendix A.6 (Table A6) in the Appendix A for further details on the comparative environmental impacts by category, vehicle type, and year.
If BEVs can replace one million units of ICEVs by 2030, a key target for the Korean government’s BEV penetration plan, the GWP impact will decrease by approximately 14 million and 13 million tons of GHGs from replacing gasoline and diesel ICEVs, respectively. These reductions correspond with about 6.0–6.4% of the total national GHG reduction targets relative to BAU, which account for about 51–54% of the reduction targets in the transportation sector in Korea [50].
Regarding particulate matter (PM) emissions, the 2016 BEVs fleet-wide are estimated to generate 338% more PM than gasoline vehicles (54.3 mg particulates/VKT compared with 12.4 mg particulates/VKT, respectively) and 123% more PM than diesel vehicles (at 24.3 mg particulates/km). With the improved power roadmap, the 2030 BEVs will generate PM of about 30.2 mg/km. This is still higher than that of gasoline and diesel vehicles (at 144% and 24% more, respectively), owing to the dependency on bituminous coal power in Korea, which accounts for more than 46% of total electricity generation. These findings suggest that BEVs in Korea have about 338% (in 2016) and 144% (in 2030) higher PM emissions than gasoline vehicles, as well as about 123% (in 2016) and 24% (in 2030) higher PM emissions than diesel vehicles, even though BEVs generate no emission of environmental substances during their operation. The impact on human health from increased PM emissions depend on the location and proximity of the power plants to population centers and the consequential exposure to such emissions, which remains an area for future study.

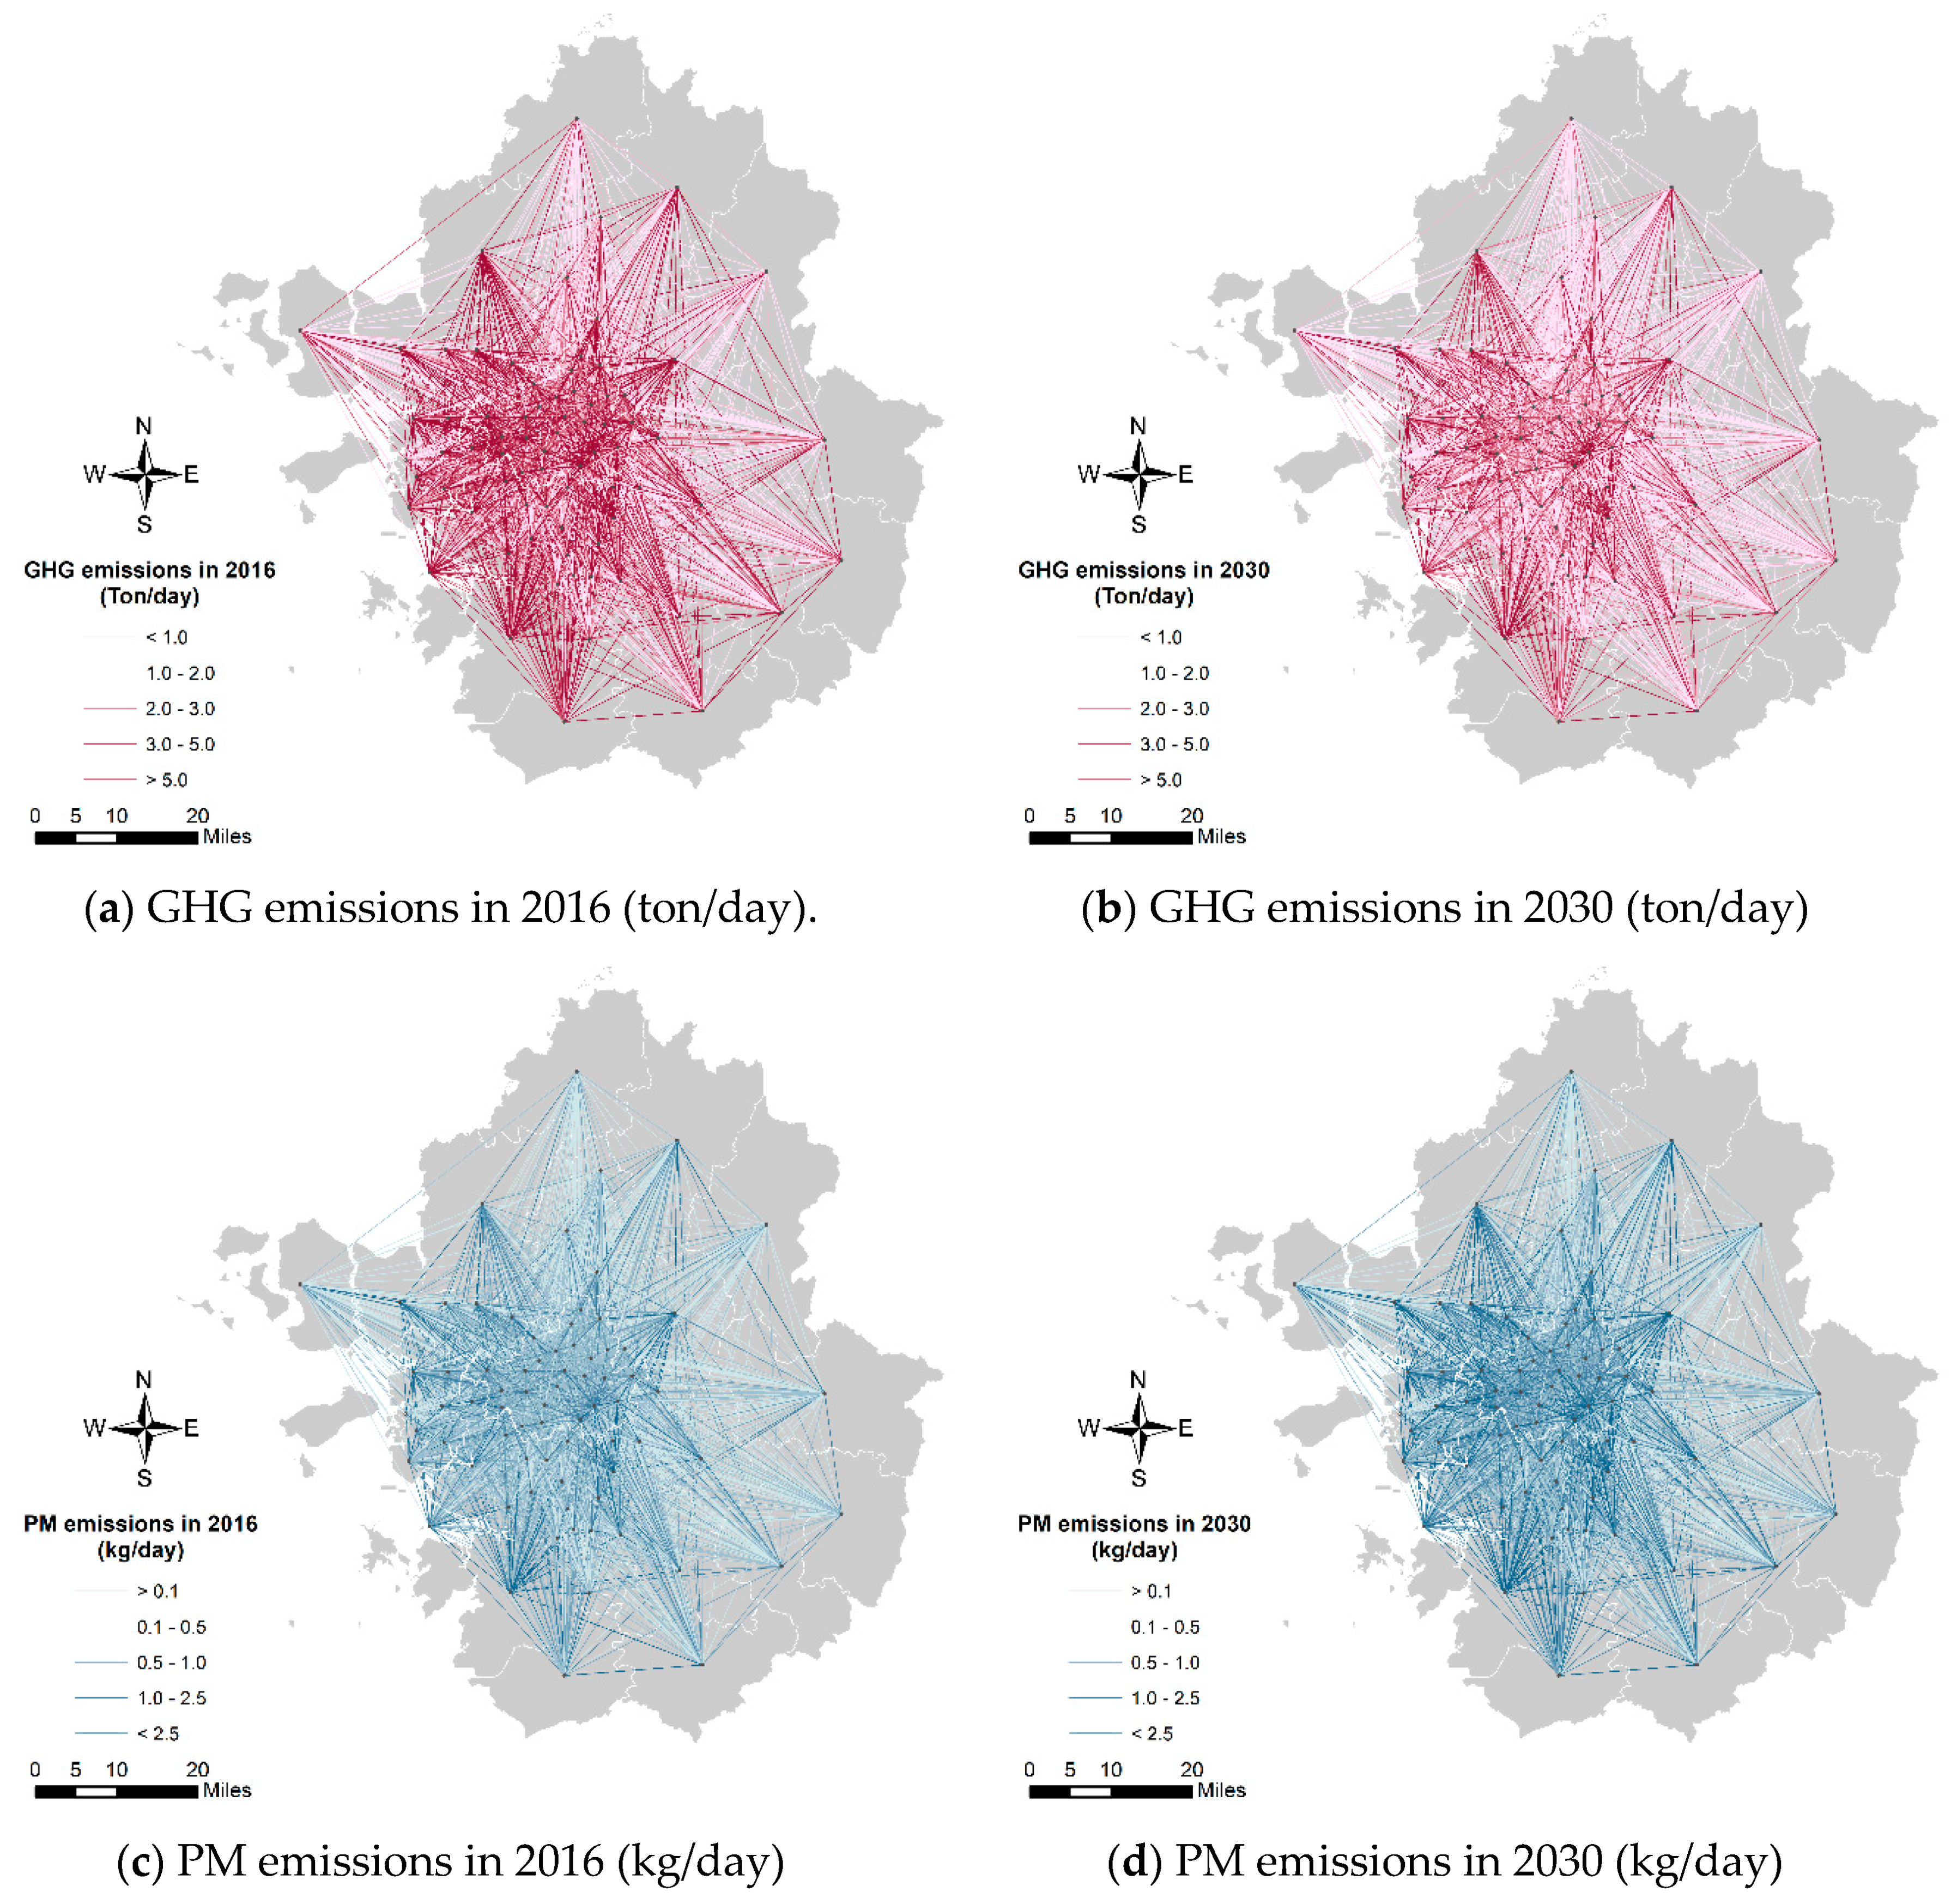
3.3. Environmental Implications of Using BEVs for Commuting in Seoul Megacity

Out of the total driving-age population in the Seoul metropolitan region, approximately 68% commute using passenger vehicles (54% to work and 13% to school), which, in 2016, generated approximately 30.6 thousand tons of CO2e per day and 3.2 tons of PM dust per day. Considering that, on average, people work and go to school approximately 250 days per year [48], the total GHG emissions and PM dust in 2016 was approximately 8.2 million tons CO2e and 808 tons of PM dust emitted. In Seoul, GHG emissions from commuting was 30% of the total emissions related to transportation by passenger cars in 2016 that 27.3 million tons CO2e per year [51].
In examining the three scenarios for replacing ICEVs with BEVs, we first examined the RR-BEV scenario (i.e., the assessment assumption that BEVs randomly replace ICEVs across the 76 counties across variable commuting distances and types of ICEVs), gross annual GHG emissions will be reduced by about 47 thousand tons CO2e by 2022 and almost 92 thousand tons CO2e by 2025, compared with those in 2016. For the PR-ICEV scenario (i.e., we assume BEVs replace ICEVs in counties with long commuting distances), we find that GHGs are reduced annually by 181 thousand tons CO2e by 2022, and 371 thousand tons CO2e by 2025. For the final PR-DSEL scenario (i.e., we assume BEVs replace diesel-ICEVs in counties with long commuting distances), we find that GHGs are reduced annually by about 96 and 168 thousand tons CO2e by 2022 and 2025, respectively. Reductions in the GWP impact are maximized in the PR-ICEV scenario, resulting in a 3.8–4.0 times lower impact than the RR-BEV scenario in 2022 and 2025. However, the PR-DSEL scenario results in the least total weighted environmental impact owing to the higher overall impacts from diesel compared with gasoline ICEVs. In both cases, these results suggest that policies targeting BEV penetration in counties that have particularly high commuting distances should be prioritized in order to maximize the long-term impact reduction potential of BEVs. If BEVs can replace all ICEVs within the Seoul metropolitan region by 2030, the GHG emissions from commuting would be reduced by an estimated maximum of 55% compared with 2016 (Figure 8a,b), given the current expected electricity fuel mixes, market shares, and fuel economies.
Contrary to the positive GHG reducing effects of BEVs, increasing the penetration of BEVs into the market result in increasing levels of PM dust. Across the three scenarios, by 2022, BEVs commuting in Seoul annually generate about 11 additional tons of PM dust from a RR-BEV scenario compared with 2016, 27 additional tons from the PR-ICEV scenario, and 13 additional tons from the PR-DSEL scenario. By 2025, the scenarios generate an additional 15 tons of PM annually, 30 tons of PM, and 14 tons of PM dust compared with 2016 levels. From a PM minimization perspective, replacing ICEVs with BEVs following the PR-DSEL scenario results in the smallest increase in PM emissions compared with the other replacement scenarios. If BEVs are able to replace all ICEVs within Seoul by 2030, we expect PM emissions from passenger vehicle commuting to increase by a maximum of 84% compared with vehicle PM emissions in 2016 (see Figure 8c,d). For further details on the GHG and PM emissions by scenario, see Appendix A.7 (Table A7) in the Appendix A.

4. Discussion

Our study reveals that BEV use in Korea in 2016 resulted in a greater environmental impact than ICEVs across several impact categories including EP, HTP, ODP, and PM. However, there was an overall lower impact compared with ICEVs for the ADP, AP, GWP, and POCP impact categories. These findings highlight the trade-offs that must be considered when advocating for increased BEV adoption and when considering alternative fuel mixes in future power roadmap plans. By substituting 1% of coal power with LNG or renewable energy, the weighted environmental impact of BEV performance declines by 1.6% or 1.8%, respectively. In addition to the grid power mix, vehicle fuel efficiency is also an important influence on the resulting environmental impact of BEVs, considering that the weighted environmental impact is reduced by about 1% when the fuel efficiency of BEVs increase by 1%, while holding the power mix constant. Therefore, it is necessary to establish appropriate policies that advance not only a greater share of renewable energy in the national grid mix, but also policies that incentivize technological advancement and adoption of high efficiency BEVs. These results also suggest that future roadmaps should consider multiple impact categories to understand the benefits and trade-offs of proposed future changes to the power mix, offering a more comprehensive view of what constitutes environmentally and socially preferable options.
This study focused on the operation phase for analyzing and comparing the environmental impacts of ICEVs and BEVs on the national power grid, considering vehicle efficiency and market share. Thus, the results of this study exclude the environmental impacts of vehicle manufacturing and disposal phases associated with the vehicle life cycle. Moreover, the battery life of BEVs is known to be a limiting factor in the environmental performance of BEVs, as it is shorter than that of the vehicle’s life span, requiring replacement before the capacity decreases to 70–80% of the battery’s original level over the BEV’s life cycle [52,53]. While we did not explicitly consider the impact of battery life for the BEV operation phase, other studies have shown that BEV manufacturing and recycling phases can contribute to 10–23% of the total GHG impact. Also, we employed the energy efficiencies by fuel type reported by vehicle manufacturers, however, practical energy efficiencies can be affected by driving pattern, road condition, and traffic situation.
With regard to renewable energy, this study uses solar PV power representing renewable energy because solar PV power is a major renewable source (over 52% of gross renewables without biowastes), and a readily available source for renewable energy in Korea. The Korean government gradually plans to increase solar PV power by 33,680 MW (up to 57% of renewables) and increase the wind power by 17,674 MW (up to 30% of renewables) in 2031, whereas the proportion of waste power will drastically decrease to less than 10% of renewables [44]. Nevertheless, Korea still has higher construction costs for wind power sources than other countries (3 times higher than the United States) [54], as well as lower capacity for wind power generation reaching only 1120 TWh per year compared to those of other countries (143,000 TWh per year in Russia; 99,000 TWh per year in Canada; 88,000 TWh per year in the United States; and 43,600 TWh per year in China) [55]. Some published studies using LCA of renewable electricity generation have reported that although GHG emissions vary greatly depending on the size of the power turbines of wind, biomass, and municipal solid waste [56,57,58,59,60], the GWP of renewable power could range from 289.3 to 629.44 g CO2e for 1 kWh.
Through our evaluation of different BEV penetration scenarios in Seoul megacity, we reveal that substantial additional benefits can be gained through policy incentives that prioritize BEV adoption in counties characterized by particularly long-distance commutes. The sizable reductions in GHG emissions from BEV adoption considering the future power mix may also provide a direct economic benefit for cities, as these reductions may qualify for carbon credits. Since the price of carbon credits traded in Korea is currently about 26.6 USD per ton (as of April 5, 2019) [61], Seoul can secure about USD $1.3–2.5M (with the RR-BEV scenario); $4.8–9.9M (with the PR-ICEV scenario); and $2.6–4.5M (with the PR-DSEL) in credits by 2022 and 2025, respectively. Despite the negative implications of PM with the current projected power mixes, by increasing BEV adoption, the source of PM emissions will transition from non-point pollutant sources from end-of-pipe emissions using ICEVs to more controllable point pollutant sources from power plants that produce electricity for driving BEVs. Power plants, for example, are developing enhanced technologies to reduce and/or more effectively collect PM emissions during electricity production. In addition, it may be expected to reduce more PM in the future through continuous technology development incentives and regulatory requirements to offset the currently expected emissions and potential impacts to human health. Future studies should examine the local air quality impacts on human health, in terms of impacts to disability-adjusted life year (DALYs) or mortality rates, from potentially increased exposure to these projected increases in PM emissions, in order to inform policy makers on the urgency to address such emissions trade-offs from increased BEV adoption and electricity usage.

5. Conclusions

Although many people believe that BEVs are inherently better for the environment compared to ICEVs, the environmental performance of BEVs mostly depends on the share of renewable sources for the national power mix. This study shows the environmental performance changes of BEVs reflecting the current and future projected power mix in Korea. We examine multiple impact categories for reviewing comprehensive environmental impacts of BEVs and test various market penetration scenarios to provide a more holistic interpretation of the relative benefits of BEVs compared with ICEVs across a 15-year operating time span. The study results show the implications of ICEVs replacement to BEVs for megacity commuting by 2030 in the Seoul metropolitan areas of Korea.
The propagation of BEVs by 2030 can reduce by about 55% of GHGs for commuting traffic considering the 2030 national power mix with the expected BEV efficiency. Global warming potential (GWP) impacts make up the majority of aggregate impacts in national power roadmap, contributing to over 40% of the total weighted environmental impacts. The increase of BEVs in Korea can drive important global and local benefits through reductions of climate-changing GHGs. Although the BEV propagation in Korea potentially increases PM emissions, we may control PMs from the power plants which are point source emitters converted from non-point ICEV sources.
This study provides that the national power roadmap can be coupled with the potential benefits of BEVs, which means the energy portfolio of electricity designed by stakeholders such as government, policymakers, and corporations can make BEVs greener for sustainable environment.

Author Contributions

Conceptualization, S.K., R.E.O.P. and K.S.; methodology, S.K., J.L., J.J.; software, S.K. and J.J.; validation, R.E.O.P., T.M.S. and K.S.; formal analysis, S.K.; writing—original draft preparation, S.K.; writing—review and editing, S.K. and R.E.O.P.; visualization, S.K., J.J., J.L.; supervision, K.S.

Funding

This research was supported by the National Research Foundation of Korea (NRF) grant funded by the Korea government (Ministry of Science and ICT) (No. NRF-2017R1E1A1A01078227).

Conflicts of Interest

The authors declare no conflict of interest.

Appendix A

Appendix A.1. Technical Specifications and Sales of BEVs in Korea

Table A1. Technical specifications and sales of battery electric vehicles (BEVs) released in Korea.
Battery Electric VehiclesBattery2 Capacity (kWh)Vehicle Range (km)Energy Efficiency (km/kWh)Sales (Unit) (Market Share, %)
ManufacturerModel Temperate ConditionFreezing ConditionTypical DrivingCity DrivingHighway DrivingIn 2016In 2017
KIARay EV16.49169.35.05.44.69 (0.1)38 (0.3)
Renault SamsungSM3 Z.E.2213583.54.44.84.0623 (9.8)2014 (15.7)
ChevroletBolt EV60.03832665.56.05.198 (1.5)563 (4.4)
BMWi3 94Ah18.813275.55.96.45.3369 (5.8)191 (1.5)
KIASoul EV27148123.75.26.04.5860 (13.5)2051 (16.0)
NissanLEAF21.313285.55.25.74.788 (1.4)47 (0.4)
HyundaiIONIQ electric281911556.36.95.84323 (67.9)7932 (61.8)
Average21.7136.796.55.365.894.86--
Total sales------637012,836
Combined average energy efficiency (km/kWh)5.95.8
Vehicle range was suggested by each manufacture with temperature conditions between 20 and 30 °C and freezing conditions at 7-degrees below zero. The vehicle ranges in temperatures between 20 and 30 °C are longer than below zero because battery performance depends on the ambient temperature. Energy efficiency is provided for three types of driving: city driving, highway driving, and combined driving (typical driving). The energy efficiency of EVs is higher in city driving than in highway driving because of the vehicle’s regenerative braking system for recharging the energy. The combined average energy efficiency was estimated that total energy efficiency of sold BEVs (that times the typical driving energy efficiency and sales of each vehicle) divides by total sales in 2016 and 2017.

Appendix A.2. Normalization and Weighting Factors by Environmental Impact Factor

To compare and aggregate the total environmental impact potential across these eight impact categories, we normalized the emission data using annual average emissions per capita for each impact category published by the Korean Ministry of Environment. These data were combined with weighting factors for each environmental impact category, which is based on a Covenant with the Netherlands Oil and Gas Exploration and Production Association (NOGEPA).
Table A2. Normalization and weighting factors by environmental impact category. ADP, abiotic depletion potential; AP, acidification potential; EP, eutrophication potential; GWP, global warming potential; HTP, human toxicity potential; ODP, ozone depletion potential; POCP, photochemical oxidants creation potential; PM, particulate matter.
Impact CategoryUnitNormalization FactorWeighting Factor
ADPkg yr−124.90.06
APkg SO2e39.80.05
EPkg PO43−e13.10.1
GWPkg CO2e55300.25
HTPkg 1,4DCBe14800.08
ODPkg CFC11e0.04070.04
POCPkg ethylene-e10.30.06
PMkg PMe1.20.05

Appendix A.3. The BEVs Penetration Plans by State in Seoul Megacity

The states within the Seoul metropolitan region (Seoul, Incheon, and Gyeonggi) have developed passenger BEV market penetration targets for 2022 and 2025. From 2016 to 2022, Seoul expects to increase BEVs on the road to 48.5 thousand units and they are expected to increase by an additional 76% by 2025. Incheon and Gyeonggi states are also planning for BEVs to increase to 13 and 30 thousand units by 2022, and 25 and 53 thousand units by 2025, respectively.
Table A3. The BEVs penetration plan by state in Megacity in 2022 and 2025.
YearSeoul (Units)Incheon (Units)Gyeonggi (Units)Total (Units)
202248,46514,00030,00092,465
202585,46524,68852,903163,056

Appendix A.4. Environmental Impact of the National Power Mix by Energy Source

Table A4. Life cycle environmental impacts of electric power by energy sources for 1 kWh in Korea.
Impact CategoryUnitHydro PowerSteam PowerCombined PowerNuclear PowerRenewable Power
ReservoirAnthracite CoalBituminous CoalHeavy OilLNGSolar PV 20 Years
ADPkg yr−11.06 × 10 5 2.59 × 10 3 8.98 × 10 5 6.07 × 10 3 2.92 × 10 3 2.53 × 10 5 2.90 × 10 3
APkg SO2e5.15 × 10 6 1.23 × 10 3 1.60 × 10 3 1.89 × 10 3 5.75 × 10 4 1.80 × 10 5 3.71 × 10 5
EPkg PO43−e8.73 × 10 7 2.19 × 10 4 8.59 × 10 3 1.77 × 10 4 4.93 × 10 5 5.21 × 10 6 9.39 × 10 5
GWPkg CO2e3.61 × 10 3 1.321.168.05 × 10 1 4.58 × 10 1 6.25 × 10 3 5.36 × 10 2
HTPkg 1,4DCBe1.25 × 10 3 4.68 × 10 3 6.36 × 10 1 8.77 × 10 3 1.13 × 10 3 2.66 × 10 2 3.24 × 10 2
ODPkg CFC11e3.16 × 10 10 3.21 × 10 9 9.08 × 10 10 6.06 × 10 9 5.75 × 10 10 1.45 × 10 10 9.60 × 10 9
POCPkg ethylene-e1.34 × 10 6 1.55 × 10 4 2.20 × 10 5 6.80 × 10 4 1.02 × 10 3 4.20 × 10 6 1.12 × 10 4
PMkg PMe7.78 × 10 5 5.62 × 10 5 6.40 × 10 4 8.98 × 10 5 3.76 × 10 6 5.70 × 10 5 4.74 × 10 5
Weighted environmental impact4.13 × 10 6 (2.8)4.97 × 10 5 (33.6)1.48 × 10 4 (100.0)4.76 × 10 5 (32.2)2.63 × 10 5 (17.8)5.13 × 10 6 (3.5)1.36 × 10 5 (9.2)
The impact categories are abiotic depletion potential (ADP); acidification potential (AP); eutrophication potential (EP); global warming potential (GWP); human toxicity potential (HTP); ozone depletion potential (ODP); photochemical oxidants creation potential (POCP); and particulate matter (PM).

Appendix A.5. Environmental Impact of the ICEVs

Table A5 presents the relative environmental impacts across production (WTT) and combustion stages (TTW) for one liter of gasoline versus one liter of diesel. For gasoline, the production (WTT) stage accounts for 63–100% of total impacts for PM, HTP, ODP and ADP, whereas the combustion stage (TTW) dominated the environmental impacts of GWP, AP, POCP, and EP, contributing over 97% for each. The diesel production stage similarly dominates the ADP and ODP impacts, approximately 100% of the total impact, but for PM, HTP, GWP, AP, POCP, and EP, the combustion stage is the dominate contributing force, accounting for over 87% of the total impact across each category.
After weighting, the total environmental impact of diesel was about 68.9% higher than that of gasoline, and the impact of the combustion stage was larger than that of the production stage. In particular, the total environmental impact of gasoline was 28.96% production and 71.04% combustion stages. In addition, the total environmental impact of diesel was 18.61% in the production stage and 81.39% in the combustion stage.
Table A5. Environmental impacts of internal combustion engine vehicle (ICEV) powered per liter of gasoline and diesel. The production phase represents the well-to-tank (WTT) stage and the combustion phase represents the tank-to-wheel stage.
Impact CategoryUnitGasolineDiesel
Production (%)Combustion (%)Total (%)Production (%)Combustion (%)Total (%)
ADP1/yr2.06 × 10 2 (100.0)0 (0.0)2.06 × 10 2 (100.0)2.28 × 10 2 (100.0)0 (0.0)2.28 × 10 2 (100.0)
APkg SO2-eq1.44 × 10 4 (1.5)9.28 × 10 3 (98.5)9.42 × 10 3 (100.0)1.21 × 10 4 (0.5)2.24 × 10 2 (99.5)2.25 × 10 2 (100.0)
EPkg PO43−-eq1.07 × 10 5 (0.6)1.72 × 10 3 (99.4)1.73 × 10 3 (100.0)8.28 × 10 6 (0.2)4.18 × 10 3 (99.8)4.19 × 10 3 (100.0)
GWPkg CO2-eq6.45 × 10 2 (2.7)2.30 (97.3)2.37 (100.0)5.91 × 10 2 (2.0)2.97 (98.0)3.03 (100.0)
HTPkg 1,4DCB eq3.03 × 10 4 (85.1)5.33 × 10 5 (15.0)3.57 × 10 4 (100.0)1.87 × 10 4 (0.7)2.54 × 10 2 (99.3)2.56 × 10 2 (100.0)
ODPkg CFC 11-eq1.66 × 10 10 (100.0)0 (0.00)1.66 × 10 10 (100.0)9.08 × 10 11 (100.0)0 (0.0)9.08 × 10 11 (100.0)
POCPkg ethylene eq1.33 × 10 5 (1.2)1.11 × 10 3 (98.8)1.12 × 10 4 (100.0)9.66 × 10 6 (0.1)9.04 × 10 3 (99.9)9.05 × 10 3 (100.0)
PMkg PM7.48 × 10 5 (63.1)4.38 × 10 5 (36.9)1.19 × 10 4 (100.0)6.25 × 10 5 (13.4)4.03 × 10 4 (86.6)4.66 × 10 4 (100.0)
Weighted environmental impact5.59 × 10 5 (29.0%)1.37 × 10 4 (71.0%)1.93 × 10 4 (100.0%)6.06 × 10 5 (18.6%)2.65 × 10 4 (81.4%)3.26 × 10 4 (100.0%)
The impact categories are abiotic depletion potential (ADP); acidification potential (AP); eutrophication potential (EP); global warming potential (GWP); human toxicity potential (HTP); ozone depletion potential (ODP); photochemical oxidants creation potential (POCP); and particulate matter (PM) < 10 microns.

Appendix A.6. Environmental Performance of BEVs Compared with ICEVs

Table A6. Environmental impacts by distance (1 km) of gasoline vehicle, diesel vehicle, and BEV according to the national power mix in 2016, 2017, and 2030.
Impact CategoryUnitGasoline VehicleDiesel VehicleElectric Vehicle
In 2016In 2017In 2022In 2025In 2030
ADPkg yr−11.47 × 10 3 1.19 × 10 3 8.59 × 10 5 7.06 × 10 5 2.62 × 10 4 2.84 × 10 4 3.22 × 10 4
APkg SO2e6.75 × 10 4 1.17 × 10 3 1.46 × 10 4 1.60 × 10 4 1.28 × 10 4 1.20 × 10 4 1.17 × 10 4
EPkg PO43e1.24 × 10 4 2.19 × 10 4 6.73 × 10 4 7.78 × 10 4 4.30 × 10 4 3.86 × 10 4 3.50 × 10 4
GWPkg CO2e1.70 × 10 1 1.58 × 10 1 1.00 × 10 1 1.15 × 10 1 8.73 × 10 2 8.03 × 10 2 7.44 × 10 2
HTPkg 1,4DCBe2.56 × 10 5 1.34 × 10 3 5.15 × 10 2 5.91 × 10 2 3.33 × 10 2 3.02 × 10 2 2.78 × 10 2
ODPkg CFC11e1.19 × 10 11 4.74 × 10 12 1.22 × 10 10 1.28 × 10 10 3.80 × 10 10 4.74 × 10 10 6.37 × 10 10
POCPkg ethylene8.02 × 10 5 4.73 × 10 4 2.16 × 10 5 1.81 × 10 5 5.91 × 10 5 5.90 × 10 5 5.69 × 10 5
PMkg PMe1.24 × 10 5 2.43 × 10 5 5.43 × 10 5 6.17 × 10 5 3.59 × 10 5 3.27 × 10 5 3.02 × 10 5
Weighted environmental impact1.40 × 10 5 (1.00)1.70 × 10 5 (1.22)1.55 × 10 5 (1.10)1.74 × 10 5 (1.24)1.17 × 10 5 (0.83)1.07 × 10 5 (0.77)1.01 × 10 5 (0.72)

Appendix A.7. Environmental Implications of BEVs for Commuting in a Megacity

We estimate that the environmental benefits following the three implemented replacement scenarios considering BEV penetration plans by state. The replacement scenarios are as follows: (1) random replacement of BEVs to all counties (RR-BEV); (2) priority replacement ICEV to BEV to counties that have a long commuting distance (PR-ICEV); and (3) priority replacement diesel powered ICEV to BEV to counties that have a long commuting distance (PR-DSEL).
The states within the Seoul metropolitan region (Seoul, Incheon, and Gyeonggi) have made BEV penetration plans focused on passenger vehicles in 2022, 2025, and 2030. Seoul plans for a BEV supply of 48,465 units by 2022 and 85,465 units by 2025. In addition, Incheon and Gyeonggi states have a BEV penetration plan of 13,000 and 30,000 units by 2022, respectively. In addition, we assumed that all ICEV will be replaced by BEVs by 2030.
Table A7. Environmental implications of BEVs for commuting in a megacity. RR, random replacement; PR, priority replacement.
YearScenario 1 (RR-BEV)Scenario 2 (PR-ICEV)Scenario 3 (PR-DSEL)
GHG emissions (ton/year)
20168,176,878
20228,129,4237,995,5878,080,435
20258,084,6097,805,4578,009,246
20303,665,737
PM emissions (ton/year)
2016808.0
2022818.5834.7821.2
2025823.4837.6822.1
20301488.0

References

  1. Miotti, M.; Supran, G.J.; Kim, E.J.; Trancik, J.E. Personal vehicles evaluated against climate change mitigation targets. Environ. Sci. Technol. 2016, 50, 10795–10804. [Google Scholar] [CrossRef] [PubMed]
  2. Lucas, A.; Silva, C.A.; Neto, R.C. Life cycle analysis of energy supply infrastructure for conventional and electric vehicles. Energy Policy 2012, 41, 537–547. [Google Scholar] [CrossRef]
  3. Green, E.H.; Skerlos, S.J.; Winebrake, J.J. Increasing electric vehicle policy efficiency and effectiveness by reducing mainstream market bias. Energy Policy 2014, 65, 562–566. [Google Scholar] [CrossRef]
  4. Zhang, X.; Bai, X.; Shang, J. Is subsidized electric vehicles adoption sustainable: Consumers’ perceptions and motivation toward incentive policies, environmental benefits, and risks. J. Clean. Prod. 2018, 192, 71–79. [Google Scholar] [CrossRef]
  5. Bloomberg. Electric Vehicle Outlook 2017; Bloomberg New Energy: New York, NY, USA, 2017. [Google Scholar]
  6. IEA; Ministerial, C.E.; Initiative, E.V. Global EV outlook 2017; Electric Vehicles Initiative: Paris, France, 2016. [Google Scholar]
  7. Seok, J. Legal and System Improvement and Support System of Leading Countries for Establishment of Charging Infrastructure for Electric Vehicle; Korea Energy Economics Institute: Ulsan, Korea, 2016. [Google Scholar]
  8. Upadhyay, A.; Wilson, I. Electric Vehicles Could Displace 8 Million Barrels of Oil Per Day by 2040; Bloomberg: New York, NY, USA, 2017. [Google Scholar]
  9. Sioshansi, R.; Denholm, P. Emissions impacts and benefits of plug-in hybrid electric vehicles and vehicle-to-grid services. Environ. Sci. Technol. 2009, 43, 1199–1204. [Google Scholar] [CrossRef] [PubMed]
  10. Onat, N.C.; Kucukvar, M.; Tatari, O. Conventional, hybrid, plug-in hybrid or electric vehicles? State-based comparative carbon and energy footprint analysis in the United States. Appl. Energy 2015, 150, 36–49. [Google Scholar] [CrossRef]
  11. Van Mierlo, J.; Messagie, M.; Rangaraju, S. Comparative environmental assessment of alternative fueled vehicles using a life cycle assessment. J. Transp. Res. Procedia 2017, 25, 3435–3445. [Google Scholar] [CrossRef]
  12. Barkenbus, J. Electric Vehicles: Climate Saviors, or Not? Issues Sci. Technol. 2017, 33, 55. [Google Scholar]
  13. Ou, X.; Yan, X.; Zhang, X. Using coal for transportation in China: Life cycle GHG of coal-based fuel and electric vehicle, and policy implications. Int. J. Greenh. Gas Control 2010, 4, 878–887. [Google Scholar] [CrossRef]
  14. Ma, Y.; Ke, R.-Y.; Han, R.; Tang, B.-J. The analysis of the battery electric vehicle’s potentiality of environmental effect: A case study of Beijing from 2016 to 2020. J. Clean. Prod. 2017, 145, 395–406. [Google Scholar] [CrossRef]
  15. Ellingsen, L.A.W.; Majeau-Bettez, G.; Singh, B.; Srivastava, A.K.; Valøen, L.O.; Strømman, A.H. Life cycle assessment of a lithium-ion battery vehicle pack. J. Ind. Ecol. 2014, 18, 113–124. [Google Scholar] [CrossRef]
  16. Noori, M.; Gardner, S.; Tatari, O. Electric vehicle cost, emissions, and water footprint in the United States: development of a regional optimization model. Energy 2015, 89, 610–625. [Google Scholar] [CrossRef]
  17. Tropschuh, P.F.; Biendl, M. Audi: Raw Materials, Road, Recycling—How Life Cycle Analysis Influences Product Development. In Sustainable Value Chain Management; CSR, Sustainability, Ethics & Governance; Springer: Berlin, Germany, 2015; pp. 167–183. [Google Scholar] [CrossRef]
  18. Casals, L.C.; Martinez-Laserna, E.; García, B.A.; Nieto, N. Sustainability analysis of the electric vehicle use in Europe for CO2 emissions reduction. J. Clean. Prod. 2016, 127, 425–437. [Google Scholar] [CrossRef]
  19. Tessum, C.W.; Marshall, J.D.; Hill, J.D. A spatially and temporally explicit life cycle inventory of air pollutants from gasoline and ethanol in the United States. Environ. Sci. Technol. 2012, 46, 11408–11417. [Google Scholar] [CrossRef]
  20. Tessum, C.W.; Hill, J.D.; Marshall, J.D. Life cycle air quality impacts of conventional and alternative light-duty transportation in the United States. Proc. Natl. Acad. Sci. USA 2014, 111, 18490–18495. [Google Scholar] [CrossRef]
  21. Hawkins, T.R.; Singh, B.; Majeau-Bettez, G.; Strømman, A.H. Comparative environmental life cycle assessment of conventional and electric vehicles. J. Ind. Ecol. 2013, 17, 53–64. [Google Scholar] [CrossRef]
  22. Spielmann, M.; Althaus, H.-J. Can a prolonged use of a passenger car reduce environmental burdens? Life Cycle analysis of Swiss passenger cars. J. Clean. Prod. 2007, 15, 1122–1134. [Google Scholar] [CrossRef]
  23. Dewulf, J.; Van der Vorst, G.; Denturck, K.; Van Langenhove, H.; Ghyoot, W.; Tytgat, J.; Vandeputte, K. Recycling rechargeable lithium ion batteries: Critical analysis of natural resource savings. Resour. Conserv. Recycl. 2010, 54, 229–234. [Google Scholar] [CrossRef]
  24. Kim, S.-K. Changing lifestyles and consumption patterns of the South Korean middle class and new generations. In Consumption in Asia; Routledge: London, UK, 2002; pp. 77–97. [Google Scholar]
  25. Sonnenschein, J.; Mundaca, L. Decarbonization under green growth strategies? The case of South Korea. J. Clean. Prod. 2016, 123, 180–193. [Google Scholar] [CrossRef]
  26. Oliver, J.D.; Lee, S.-H. Hybrid car purchase intentions: a cross-cultural analysis. J. Consum. Mark. 2010, 27, 96–103. [Google Scholar] [CrossRef]
  27. Curran, M.A. Environmental life-cycle assessment. Int. J. Life Cycle Assess. 1996, 1, 179. [Google Scholar] [CrossRef]
  28. Guinée, J.B. Handbook on life cycle assessment operational guide to the ISO standards. Int. J. Life Cycle Assess. 2002, 7, 311. [Google Scholar] [CrossRef]
  29. Labuschagne, C.; Brent, A.C. Sustainable project life cycle management: the need to integrate life cycles in the manufacturing sector. Int. J. Proj. Manag. 2005, 23, 159–168. [Google Scholar] [CrossRef]
  30. Hertwich, E.G. Life cycle approaches to sustainable consumption: a critical review. Environ. Sci. Technol. 2005, 39, 4673–4684. [Google Scholar] [CrossRef]
  31. Campanari, S.; Manzolini, G.; De la Iglesia, F.G. Energy analysis of electric vehicles using batteries or fuel cells through well-to-wheel driving cycle simulations. J. Power Sources 2009, 186, 464–477. [Google Scholar] [CrossRef]
  32. Orecchini, F.; D’Orazio, A.; Valitutti, V.; Fiori, C. Renewability of Energy Resources, Energy Vectors, and Energy Technologies for Mobility. In Handbook of Sustainable Engineering; Springer: Berlin, Germany, 2013. [Google Scholar] [CrossRef]
  33. Demirdöven, N.; Deutch, J. Hybrid cars now, fuel cell cars later. Science 2004, 305, 974–976. [Google Scholar] [CrossRef]
  34. To, W.; Lee, P. Diffusion of ISO 14001 environmental management system: global, regional and country-level analyses. J. Clean. Prod. 2014, 66, 489–498. [Google Scholar] [CrossRef]
  35. KEA. 2016 Vehicle Fuel Economy and CO2 Emissions: Data and Analyses; Korea Energy Agency: Seoul, Korea, 2016. [Google Scholar]
  36. Girardi, P.; Gargiulo, A.; Brambilla, P.C. A comparative LCA of an electric vehicle and an internal combustion engine vehicle using the appropriate power mix: the Italian case study. Int. J. Life Cycle Assess. 2015, 20, 1127–1142. [Google Scholar] [CrossRef]
  37. Anair, D.; Mahmassani, A. State of CHARGE; Union of Concerned Scientists (UCS): Cambridge, MA, USA, 2012. [Google Scholar]
  38. KEITI. Available online: http://www.keiti.re.kr/ (accessed on 24 November 2019).
  39. ME. Available online: http://www.me.go.kr/ (accessed on 24 November 2019).
  40. Huppes, G.; van Oers, L.; Pretato, U.; Pennington, D.W. Weighting environmental effects: analytic survey with operational evaluation methods and a meta-method. Int. J. Life Cycle Assess. 2012, 17, 876–891. [Google Scholar] [CrossRef]
  41. Huppes, G.; Davidson, M.; Kuyper, J.; Van Oers, L.; de Haes, H.U.; Warringa, G. Eco-efficient environmental policy in oil and gas production in The Netherlands. Ecol. Econ. 2007, 61, 43–51. [Google Scholar] [CrossRef]
  42. KEPCO. Available online: http://home.kepco.co.kr/kepco/ (accessed on 24 November 2019).
  43. KNREC. New & Renewable Energy Supply Statistics 2016; Korean Energy Associate: Seoul, Korea, 2017. [Google Scholar]
  44. Ministry of Trade, Industry and Energy. The 8th Basic Plan for Long-term Electricity Supply and Demand (2017–2031); Ministry of Trade, Industry and Energy: Sejong, Korea, 2017.
  45. Parrish, D.D.; Zhu, T. Clean air for megacities. Science 2009, 326, 674–675. [Google Scholar] [CrossRef] [PubMed]
  46. Mage, D.; Ozolins, G.; Peterson, P.; Webster, A.; Orthofer, R.; Vandeweerd, V.; Gwynne, M. Urban air pollution in megacities of the world. Atmos. Environ. 1996, 30, 681–686. [Google Scholar] [CrossRef]
  47. Tiwari, S.; Chate, D.; Srivastava, M.; Safai, P.; Srivastava, A.; Bisht, D.; Padmanabhamurty, B. Statistical evaluation of PM 10 and distribution of PM 1, PM 2.5, and PM 10 in ambient air due to extreme fireworks episodes (Deepawali festivals) in megacity Delhi. Nat. Hazards 2012, 61, 521–531. [Google Scholar] [CrossRef]
  48. Lee, J.; Taegon, K.; Suh, K. Analysis of Environmental Implications for Eco-friendly Car Technologies and Transportation Policies Considering Commuting Characteristics of Regions. J. Korea Plan. Assoc. 2013, 48, 53–66. [Google Scholar] [CrossRef]
  49. Ministry of Trade, Industry and Energy. The 7th Basic Plan for Long-term Electricity Supply and Demand (2015–2029); Ministry of Trade, Industry and Energy: Sejong, Korea, 2015.
  50. ME. The Roadmap of GHG Reduction toward 2030. Available online: http://2030ghg.or.kr/ (accessed on 15 September 2019).
  51. KOTEMS. Available online: https://www.kotems.or.kr/ (accessed on 24 November 2019).
  52. Tang, Y.; Zhang, Q.; Li, Y.; Wang, G.; Li, Y. Recycling mechanisms and policy suggestions for spent electric vehicles’ power battery-A case of Beijing. J. Clean. Prod. 2018, 186, 388–406. [Google Scholar] [CrossRef]
  53. Saxena, S.; Le Floch, C.; MacDonald, J.; Moura, S. Quantifying EV battery end-of-life through analysis of travel needs with vehicle powertrain models. J. Power Sources 2015, 282, 265–276. [Google Scholar] [CrossRef] [Green Version]
  54. WWEA. Half-Year Report 2011; World Wind Energy Association: Bonn, Germany, 2011; pp. 1–7. [Google Scholar]
  55. Lu, X.; McElroy, M.B.; Kiviluoma, J. Global potential for wind-generated electricity. Proc. Natl. Acad. Sci. USA 2009, 106, 10933–10938. [Google Scholar] [CrossRef] [Green Version]
  56. Raadal, H.L.; Gagnon, L.; Modahl, I.S.; Hanssen, O.J. Life cycle greenhouse gas (GHG) emissions from the generation of wind and hydro power. Renew. Sustain. Energy Rev. 2011, 15, 3417–3422. [Google Scholar] [CrossRef]
  57. Boyle, G. Renewable Energy; Oxford University Press: Oxford, UK, 2004; p. 456. [Google Scholar]
  58. Tsai, W.-T.; Kuo, K.-C. An analysis of power generation from municipal solid waste (MSW) incineration plants in Taiwan. Energy 2010, 35, 4824–4830. [Google Scholar] [CrossRef]
  59. Faria, R.; Marques, P.; Moura, P.; Freire, F.; Delgado, J.; de Almeida, A. Impact of the electricity mix and use profile in the life-cycle assessment of electric vehicles. Renew. Sustain. Energy Rev. 2013, 24, 271–287. [Google Scholar] [CrossRef]
  60. Bhat, I.; Prakash, R. LCA of renewable energy for electricity generation systems—A review. Renew. Sustain. Energy Rev. 2009, 13, 1067–1073. [Google Scholar] [CrossRef]
  61. KE. Available online: http://www.krx.co.kr/ (accessed on 24 November 2019).
Figure 1. System boundary of (a) internal combustion engine vehicle (ICEV) and (b) battery electric vehicle (BEV) to estimate the full lifecycle environmental impact potential from well-to-wheel (WTW). WTW includes emissions from the fuel production stage (well-to-tank, WTT) and driving/operations stage (tank-to-wheel, TTW).
Sustainability 11 06657 g001
Figure 2. Electricity generation trend by energy resource from 1999 to 2016 in Korea. The gray-colored area of the graph shows annual gross electricity generation (TWh). The lines show the proportion of electricity generation by resource (nuclear, coal, LNG, renewable, and other resources). In the case of Korean power mix, nuclear and coal steam power cover over 90% of the total electricity generation.
Sustainability 11 06657 g002
Figure 3. The 7th and 8th national power roadmap in Korea (a) the 7th power roadmap; (b) the 8th power roadmap. The total electric power of each portfolio is given at the top of each bar and the colored bars show the share of electric power by resource planned in the next 15 years.
Sustainability 11 06657 g003
Figure 4. The weighted life cycle environmental impact from combined fuel mix for generating 1 kWh of electricity generation in Korea. Each bar of electricity generation represents the environmental impact after normalizing it with emissions per capita per year and weighting [40]. The number on the right side signifies the total environmental value and the relative portion of bituminous coal power, set as 100.
Sustainability 11 06657 g004
Figure 5. The contributive proportion of the environmental impact by electricity generation type. The deterministic impact category for each electricity generation type is the largest area with the name and proportion.
Sustainability 11 06657 g005
Figure 6. Comparison of the gross weighted environmental impacts of electricity generation (stacked lines) and impacts per kWh generated (black dotted line) according to (a) the 7th power portfolio and (b) the 8th power portfolio. ADP, abiotic depletion potential; AP, acidification potential; EP, eutrophication potential; GWP, global warming potential; HTP, human toxicity potential; ODP, ozone depletion potential; POCP, photochemical oxidants creation potential; PM, particulate matter.
Sustainability 11 06657 g006aSustainability 11 06657 g006b
Figure 7. Comparison of weighted environmental impact values of ICEVs and BEVs per vehicle kilometer traveled (VKT). ICEVs consist of gasoline and diesel vehicles. Impacts from BEV operation are based on the national power mix for 2016, 2017, 2022, 2025, and 2030 power mixes. The change in impacts (Δ) are relative to the gasoline ICEV baseline, as illustrated by the black dotted line, where red indicates increased weighted impacts and blue indicates decreased weighted impacts.
Sustainability 11 06657 g007
Figure 8. Environmental impacts of greenhouse gas (GHG) emissions and PM dust per day from commuting in Seoul megacity. The impacts are based on commuting data considering the passenger vehicle type, commuting volume, and commuting distance between each county in 2016 in Seoul. The environmental impact in 2030 is estimated based on a maximum scenario where all ICEVs will be replaced with BEVs. The results of the environmental impact from commuting with BEVs in Seoul indicate that GWP would decline by 55%, but PM would increase by 84% compared with 2016.
Sustainability 11 06657 g008

