3.1. Data Source
The research data was used to dynamically analyze LUCC and landscape pattern from 1995 to 2015. Three years’ satellite image data (1995, 2005, and 2015) was selected, coming from Landsat5 and Landsat8. We used the Landsat5 image as the data source of 1995 and 2005, while Landsat8 image as 2015 image data, as it just launched in 2013. Both the spatial resolution of Landsat5 and Landsat8 are 30 × 30 m. As a new satellite, the Landsat8 had been greatly improved in the aspects of image resolution, number of wave band, and scanning mode compared with other previous satellites. In addition, the time of images acquired in different years should be relatively close, and in order to minimize the weather’s negative influence on analysis, the images were selected with low cloud cover. As a result, the acquisition time of the image was 19 January 2015, 23 November 2005, 30 December 1995, respectively.
3.2. Analysis Method for LUCC
The Environment for Visualizing Image (ENVI) is complete remote sensing (RS) image processing platform, which is developed by Interactive Data Language (IDL). It is powerful in remote sensing (RS) image display, processing, and analysis, including image enhancement, correction, classification, and analysis of multiple features [
21]. It is an effective approach to research LUCC.
Image data were processed by ENVI, and land cover involved six classes in this study: water, forestland, grassland, urban land, farmland, and bare land (including unused land). Thus, we obtained the green land information from classification results, including farmland, forestland, and grassland, as well as the changes in urban land and bare land, which enabled us to analyze the changes in the landscape pattern afterward.
The classification of land cover leveraged a collection of various technologies and approaches. The green land information extraction should choose suitable bands. In this study, six original bands were used except band 6 (thermal infrared band). Band 1, band 2, and band 3 are visible light ones, and band 1 has the greatest penetration of water. Band 4 is the near-infrared band, which reflects the high-reflection area of plants and reflects a large amount of plant information. Besides, band 5 is the short-wave infrared band (SWIR), which is sensitive to plant and soil moisture content. Band 7, the middle infrared band, has the longest wavelength in those six bands [
22]. Due to the characteristics of each band of Landsat 4-5 thematic mapper (TM) image, there is redundant information between each band. In order to reduce the interference between the bands, we should select several bands with a large amount of information and less correlation to integrate and analyze afterward. We first analyzed the correlation of six original bands, as
Table 1 shows below.
Band 1 contains much more information than band 2 and band 3, but a reflection of surface features except water is generally lower than band 4. In addition, band 1 is greatly disturbed by the atmosphere [
23]. According to the correlation between bands and the amount of information contained, TM bands 2, 3, 4 were selected for combination. When extracting information, we used six original bands’ data. Moreover, it may also include various kinds of “derivative” band data, like the principal components, NDVI (normalized difference vegetation index), and other ratio indices [
24]. The principal component transform, also known as K–L transform, is a multidimensional orthogonal linear transformation based on the statistical characteristics. It can be compressed correlated multi-band to fewer fully independent bands data, to make image interpretation easier [
25]. Normalized difference vegetation index (NDVI) is a simple graphical indicator, which is calculated from the visible (VIS) and near-infrared (NIR) light reflected by vegetation [
26,
27]. The formula is:
Figure 2a–c below are the results of principal component transformation by using principal components tool in ENVI, together with NDVI results (
Figure 2d), which we could compare directly.
The first principal component (PC1) contains the maximum variance percentage, the second principal component (PC2) contains the second large variance, and so on. The last band’s principal component, due to the less variance, most of which is caused by the original spectrum noise, it appears as noise [
28,
29,
30]. From the four figures above, it is obvious that they showed different characteristics of different objects. For example, water was very clear in PC1 and NDVI results.
According to the correlation coefficient of each band, the optimal band combination was selected. In this study, we selected the first principal component band (PC1) and NDVI, as well as TM bands 2, 3, 4 for correlation analysis of each band. After the analysis and comparison of the correlation of images, we found the combination of band 3, PCI, and NDVI had a better visual interpretation result for classification reference, as shown in
Table 2.
In this study, we started with a preliminary interpretation in the research area by using the supervised classification, and then used a combination of supervised classification result (maximum likelihood classification) and decision tree classification. In supervised classification, a region of interest (ROI) was selected as samples, which was acquired on the basis of prior knowledge experience and higher resolution images. According to the rules of knowledge and successive comparison, decision tree classification extracted various types of surface objects from the image. [
31,
32].
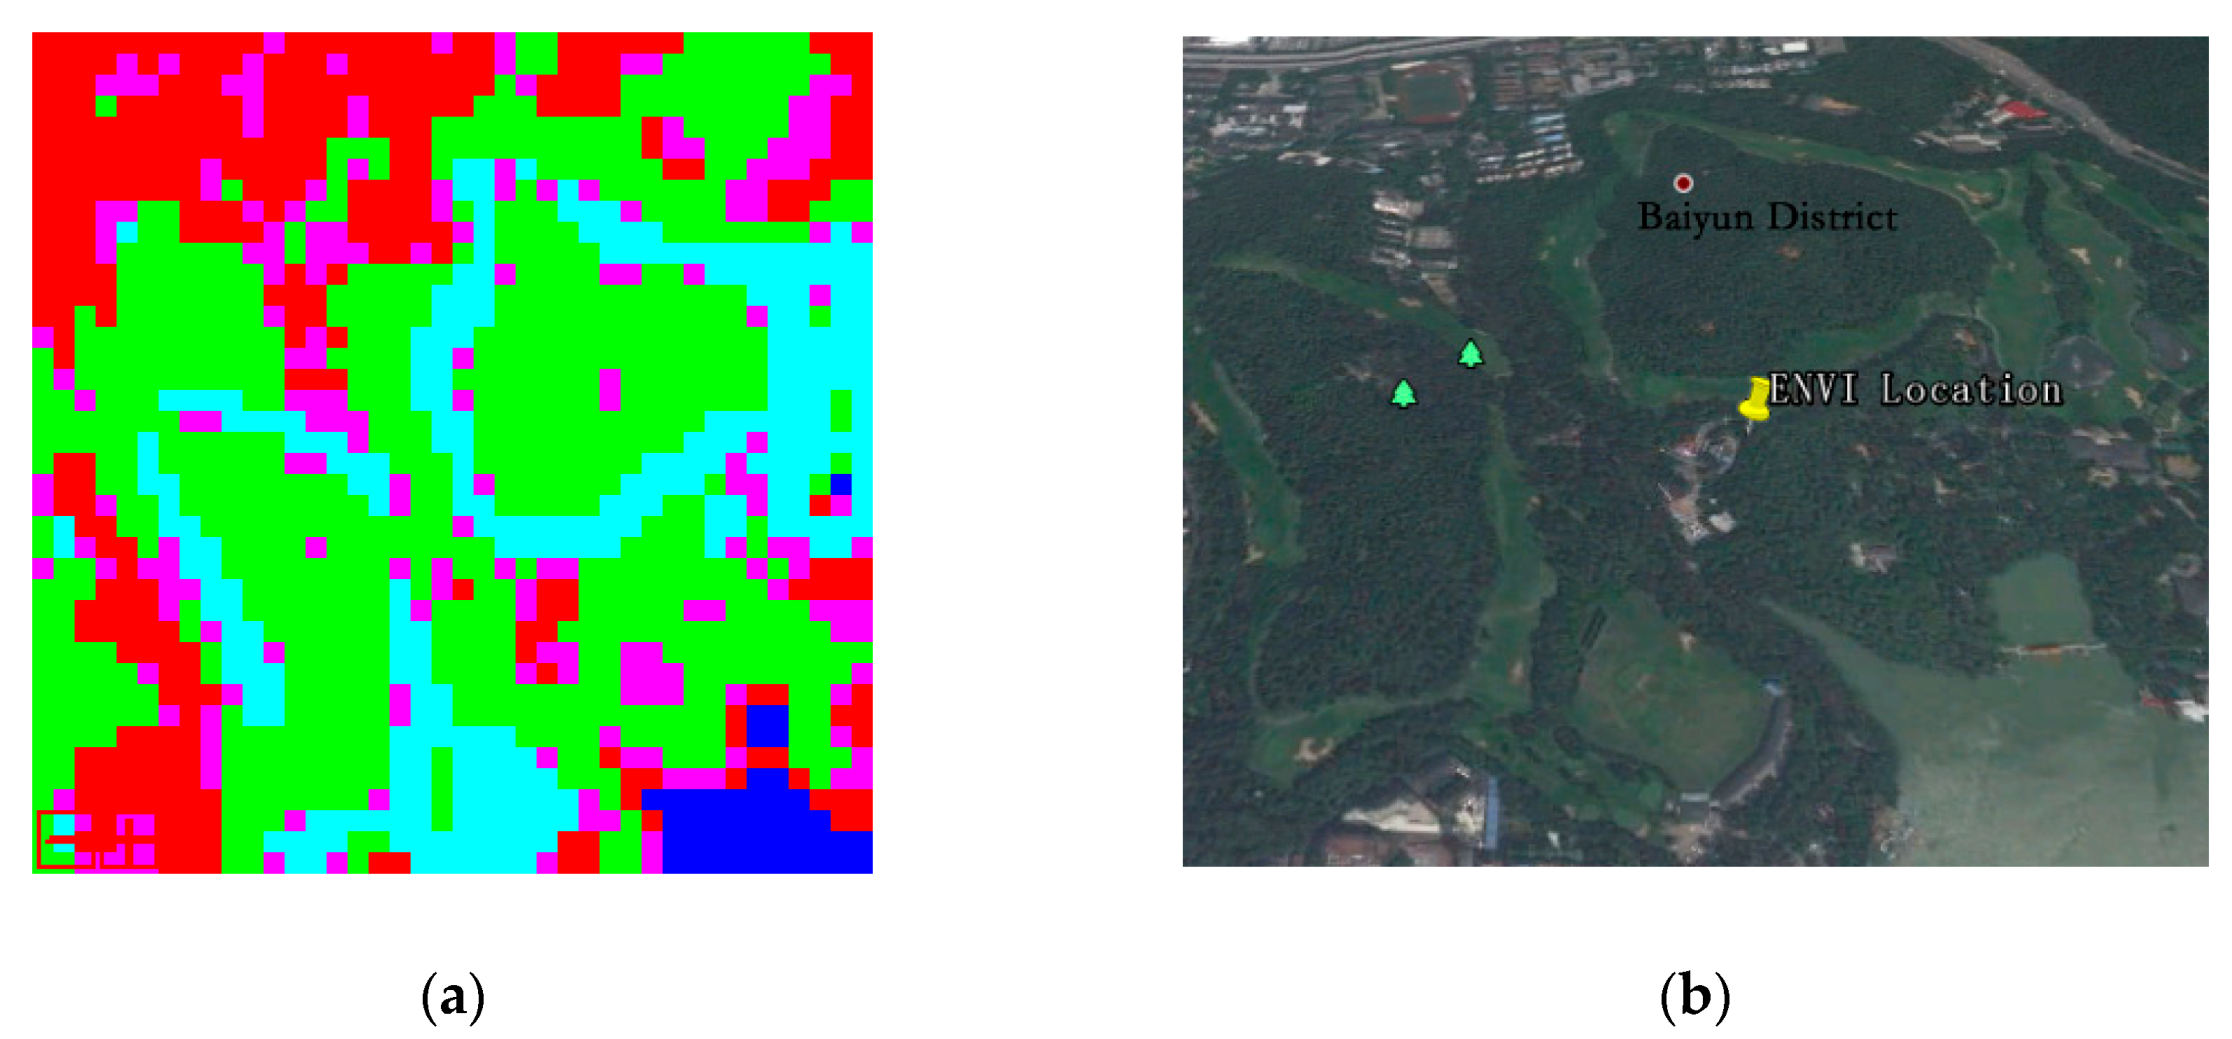
TM image has some limitations, such as the same type of objects have different spectrums, and different types of objects may have a similar spectrum. Therefore, as a consequence, there might be certain omission errors. The step of visual interpretation, combined with a large number of field research, for correcting is necessary, which could minimize the errors. Thus, the image classification result could reflect the objects’ information on the ground as far as possible. After classification, accuracy evaluation is indispensable. In this study, we firstly selected some parts of classification results and compared them with the Google Earth image (
Figure 3 and
Figure 4), following the inspection standards.
Then, the image classification accuracy was also evaluated using the Kappa coefficient index [
33]. It is an important and also widely used index to measure the accuracy of image classification. The classification results were assessed by using a randomly scattered diagram and generating the confusion matrix in ENVI [
34] (
Table 3,
Table 4 and
Table 5).
According to the accuracy assessment, the overall accuracy and kappa coefficient were both above 0.9; as a result, the classification results were approximately acceptable.
3.3. Landscape Pattern Analysis
Fragmentation statistics (FRAGSTATS) is a computer software program designed to compute a wide variety of landscape metrics for categorical map patterns. FRAGSTATS 4.2 is the most authoritative software to calculate landscape metrics. It can help users to quantify the structure of landscapes. The landscape subject to analysis is user-defined and can represent any spatial phenomenon [
35]. Based on the features of the study area, we emphasized on the quantity, shape features, aggregation, and diversity to analyze the spatial pattern of the green landscape [
36]. This paper conducted patch level, class level, and landscape-level research on spatial scale, which is ranging from microscope to macroscope. Through landscape pattern metrics calculation and analysis, the changes in landscape pattern from 1995 to 2005 and from 2005 to 2015 were studied, respectively.
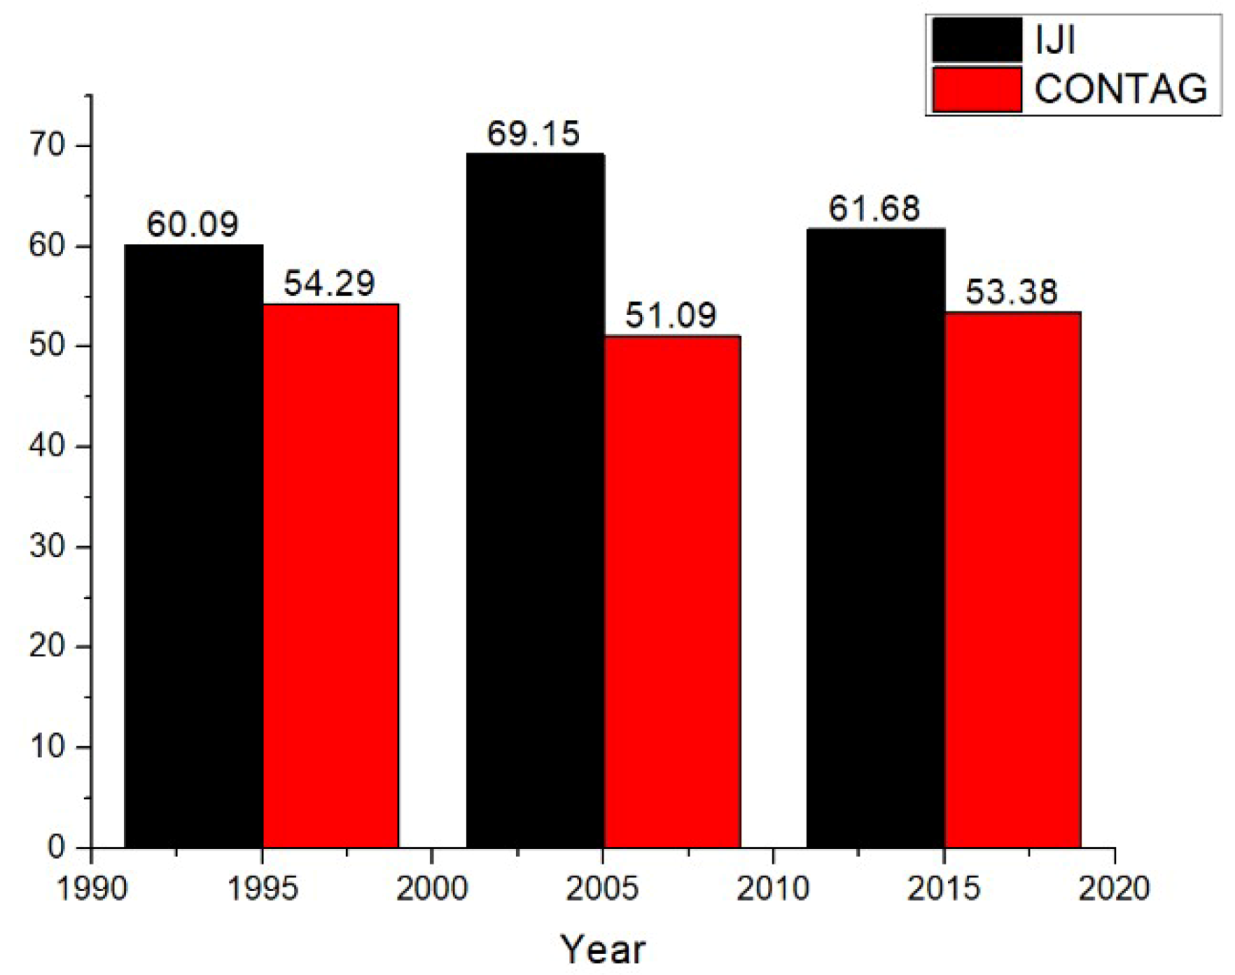
According to different ecological significance, the indices were classified into area-edge, shape, core area, aggregation, and diversity. Eleven indices were selected to analyze, including number of patches (NP), patch density (PD), mean patch size (MPS), fractal dimension index (FRAC), Euclidean nearest neighbor (ENN), largest patch index (LPI), Shannon’s evenness index (SHEI), Shannon’s diversity index (SHDI), aggregation index (AI), contagion index (CONTAG), and interspersion juxtaposition index (IJI).


