Article

Job Accessibility from a Multiple Commuting Circles Perspective Using Baidu Location Data: A Case Study of Wuhan, China

1
School of Resource and Environmental Sciences, Wuhan University, Wuhan 430079, China
2
Key Laboratory of Geographic Information System, Ministry of Education, Wuhan University, Wuhan 430079, China
3
Wuhan Geomatics Institute, Wuhan 430022, China
*
Author to whom correspondence should be addressed.
Sustainability 2019, 11(23), 6696; https://doi.org/10.3390/su11236696
Submission received: 12 October 2019 / Revised: 5 November 2019 / Accepted: 21 November 2019 / Published: 26 November 2019

Abstract

:
Jobs–housing imbalance is a hot topic in urban study and has obtained many results. However, little research has overcome the limits of administrative boundaries in job accessibility measurement and considered differences in job accessibility within multiple commuting circles. Using Baidu location data, this research proposes a new method to measure job accessibility within multiple commuting circles at the grids’ level. Taking the Wuhan metropolitan area as a case study, the results are as follows: (1) Housing and service jobs are concentrated in the central urban areas along the Yangtze River, whereas industrial jobs are scattered throughout suburbs with double centers. The potential competition for job opportunities is fiercer in the city center than in the suburbs. (2) Job accessibility with different levels shows significant circle-like distribution. People with long- or short-distance potential commutes demand to live close to the groups with the same demand. Residents with long-distance commutes demand to live outside of where those with short-distance commutes demand to reside, regardless of whether their commuting demand is for service or industrial jobs. (3) There are three optimization patterns for transit services to increase job accessibility in various areas. These patterns involve areas with inadequate job opportunities, poor transit services to service jobs, and poor transit services to industrial jobs. Developing current transit facilities or new transit alternatives as well as adding extra jobs near housing could improve jobs–housing imbalance in these areas. Findings from this study could guide the allocation of jobs and housing as well as the development of transport to reduce residents’ commuting burdens and promote transportation equity. The method used in this study can be applied to evaluate jobs–housing imbalance from the perspective of the supply in other metropolises.

1. Introduction

Residential and employment spaces are two basic factors that constitute urban development. However, the imbalance between these two elements has become increasingly serious in both developed and developing countries. Since the 1980s, rapid urbanization has taken a toll on cities in developed countries. Jobs–housing imbalance and insufficient supporting facilities increased car use in the U.S., contributing to traffic congestion and air pollution [1,2]. At the same time, jobs–housing imbalance emerged in Europe because newly constructed towns failed to become self-sufficient and thus turned into commuter towns instead [3,4]. The same problem exists in developing countries such as China. With the transformation from planned to market economy, cities in China have gone through drastic institutional reform and sharp spatial reconstruction [5,6]. Population, jobs, housing, and other elements slowly transfer to suburban areas. However, rapid urban transformation contributes to the mismatch between residential and employment spaces along with excess commuting [7,8,9,10]. Resulting urban maladies such as low function mixedness in employment centers and oversized communities emerged and further caused severe traffic congestion [11,12,13]. The disadvantages that exist in urban development exacerbate the jobs–housing imbalance and increase long-distance commutes. The spatial mismatch between the workplace and home also negatively affects people’s health and emotional status, including fatigue, reduced leisure time for healthy activities, and high mental pressure [14,15,16,17]. Therefore, alleviating the spatial mismatch between work and home is necessary.
In the past forty years, cities in China have gone through rapid spatial reconstruction of industry and housing. In the 1980s, the commoditization and marketization of urban land resulted in functional zoning based on land price. Consequently, different types of industries were built separately from each other. Commerce and public services tended to concentrate in central urban areas. By contrast, the manufacturing industry, which generated pollution, was established in the urban fringes [18,19]. In the 1990s, with the transformation from planned to market economy, private real estate dominated by real estate developers became a major housing provider instead of the danwei (quarters provided by companies or institutes), which integrated jobs and housing and transformed areas into communities for living [9,20,21]. A large amount of commercial housing concentrated in the suburbs, and affordable housing for low-income populations was established by the government, increasing the imbalance between jobs and housing [22,23]. The policies related to urban expansion also promoted further imbalance between jobs and housing. In the periphery of some cities, the construction of economic and high-tech development zones, industrial parks, and satellite towns also relocated jobs and housing from inner cities to the suburbs, thus further increasing the jobs–housing mismatch and residents’ commuting time. In the context of such quick spatial reconstruction, many scholars have conducted related research on various aspects of the relationship between the home and the workplace. However, the jobs–housing imbalance remains an emergent issue for urban development because of the gap between theories and development targets. A more specific guide is still needed.
Jobs–housing balance refers to a nearly equal number of jobs and houses in a certain area [1]. The degree of jobs–housing balance is revealed in the jobs–housing structure, which in turn influences commuting [24]. The jobs–housing structure refers to the spatial relationship between jobs and housing, which can reveal the mismatch between job demand and supply, or jobs–housing imbalance. The jobs–housing spatial structure has been investigated using jobs–housing indices, commuting origin–destination pairs, and job accessibility. Jobs–housing indices were used for measuring the quantitative balance and self-sufficiency of the jobs–housing structure, including jobs–housing ratio [1,25], independence index [26,27], and spatial mismatch index [28,29]. However, this kind of measurement neither evaluates the commuting features of residents in an area nor considers potential origins (housing) and destinations (jobs) in commuting. Commuting is part of residents’ travel behavior, and the distribution of potential origins and destinations influences commuting [30,31,32]. Some studies focus on existing commuting origin–destination pairs to evaluate the characteristics of people’s distribution and commuting, neglecting probable commuting activities [13]. Job accessibility based on the gravity model evaluates the disparity between potential job opportunities for population groups in different regions [33,34,35]. Although it considers potential demand and supply as well as their connection, which improves the shortage of jobs–housing index measurements, it is still influenced by the scale of administrative or functional units in the area of study. The latter determines the accuracy of the evaluation of the job–housing relationship. For certain administrative or functional units with large areas, generally located in the periphery of a city, using a single indicator to generalize their internal jobs–housing spatial structure will weaken internal differences and only generate macroscopic advice for planning. In the fringes of districts, evaluating jobs–housing structure without considering the cases of the adjacent areas also has its deficiencies. In addition, two places that are spatially similar may have very different characteristics because they are in different administrative or functional units. Although the geographical units in the research can be further subdivided into smaller spaces, traditional job accessibility measurement is an ineffective method of measuring the relationship between potential housing and jobs because of the large number of origin–destination pairs. A more effective measurement for job accessibility analysis is required to break through the limitations of traditional research methods. Considering that big data are widespread and have penetrated into our normal life with the rapid development of information technology, a comprehensive and high-resolution data source instead of traditional questionnaire- or survey-collecting is available in this research [36,37,38,39]. In addition, with the development of transportation systems, people can go further than before with the same time cost. This study maintains the view that jobs–housing balance should be based on a certain commuting range. However, scholars have held different opinions on this point, and no consensus exists about the most appropriate distance between jobs and housing [40,41,42]. Different commuting modes and time costs corresponding to different commuting distances should be discussed.
Wuhan is in the heartland of China. It is not only a transportation hub, but also a regional center for employment, economy, science, culture, and education. As such, it plays an important role in China. However, as the city expands and its employment population increases, jobs–housing imbalance has emerged in some areas of Wuhan along with urban development [43]. Existing literature has paid extra attention to Beijing, Shanghai, Guangzhou, and other metropolitan areas. However, relatively little attention has been paid to the situation in Wuhan [44,45,46]. Therefore, studies about Wuhan are highly needed.
This research attempts to fill the research gap by evaluating the job accessibility in the Wuhan metropolitan area (WMA) from a high spatial resolution perspective by using Baidu users’ location data and studying how to optimize them. First, jobs are divided into three cases—all jobs, service jobs, and industrial jobs—to discuss and measure the spatial distribution of different types of jobs and housing via kernel density estimation with multiple search radii. The multiple search radii can represent various commuting costs via different commuting modes from housing to jobs. Second, Z-scores are calculated for the kernel density of housing and jobs, which can be used to describe the high–low levels of potential demand for jobs in housing grids and surrounding job opportunities. Then, the differences between the Z-scores of housing and jobs in housing grids are calculated to measure the high–low levels between housing and surrounding job opportunities in multiple commuting circles, in order to identify the places to which most residents in housing grids commute. Third, the transport services nearby housing grids are evaluated by measuring the densities of bus stations, metro stations, and urban roads to identify the areas where most residents need to take long-distance commutes but are equipped with a poor transport service. From the results of the transport service evaluation, a distribution optimization scheme is proposed for job accessibility in the WMA. The research intends to address three primary questions, as follows: (1) What are the characteristics of job accessibility in the WMA? (2) Do the supply and demand for jobs match each other according to different areas? Across how much space do the supply and demand for jobs match for housing grids? (3) Does the existing transport service supply correspond to the job accessibility? We will illustrate these questions and individually examine these hypotheses below.

2. Data and Methodology
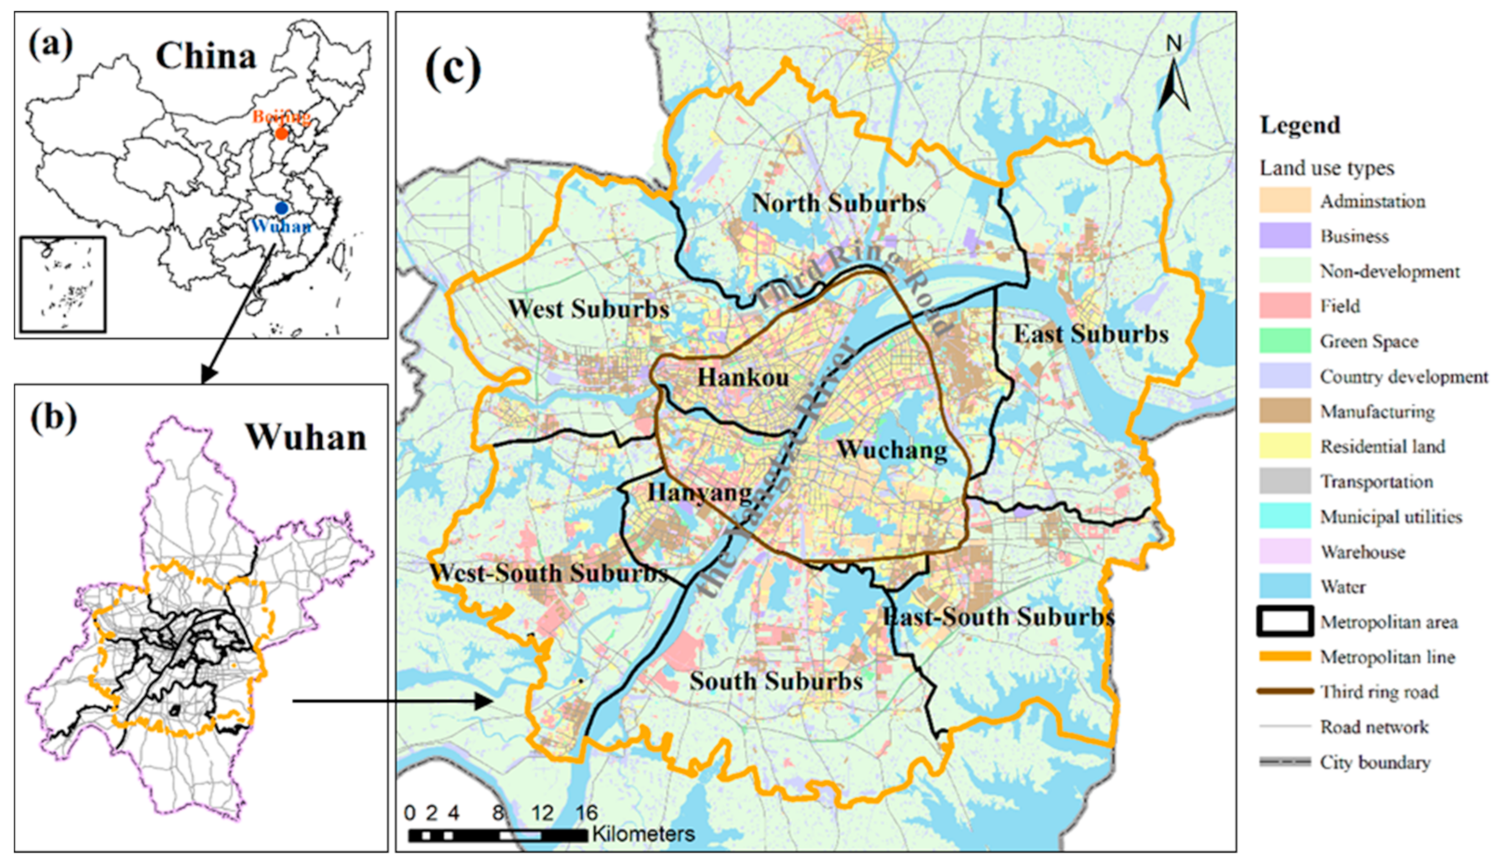
2.1. Study Area

Wuhan, known as “the River City” and “the City of Hundreds of Lakes,” is in the midland of China, in the eastern part of the Hubei Province where the Yangtze and Han rivers meet. Covering a lot of water, Wuhan consists of sixteen administrative districts: seven central urban districts, four inner-ring functional districts and five new outer-ring urban districts. The central urban areas of Wuhan can also be separated into three geographical parts by the Yangtze and Han rivers, namely Han Kou, Wu Chang, and Han Yang. Han Kou serves as a finance, commerce, and foreign exchange center in Wuhan. Wu Chang is famous for its educational institutions and high-tech industry. Han Yang, used for industrial development, slightly falls behind the other two regions. Several bridges and tunnels across the river connect these three areas. Given that the geographical context breeds diverse employment centers in Wuhan, this study focuses on the WMA, which is critical to Wuhan’s development, to investigate the correlation between the jobs–housing spatial relationship and commuting features in various employment centers. The WMA covers 3269.04 km2, containing 92.4% of the entire employed population and 91.7% of the entire resident population of Wuhan (Figure 1). It also includes most of the commuting activity of urban residents.

2.2. Data

2.2.1. Baidu Users’ Locations

The research used Baidu users’ location data to identify the distribution of residential population and employment population as well as residents’ commuting behavior in Wuhan. The distribution of residential population and employment population can represent the housing units and jobs, respectively, and residents’ commuting behavior is shown in origin–destination (OD) data. The Baidu users’ location data were extracted from Baidu users’ monthly location data, which were provided by Baidu Eye, in June 2018. Baidu Eye is a business platform under the Baidu Company. Every time Baidu users utilize Baidu apps on their phones, the surrounding base station will connect with their phone and record their location information. Then, the users’ residential location and employment places are identified according to the time proportions of where an individual is staying. Specifically, from 9 PM to 8 AM, in a month covering more than 10 working days, the places where users stay the longest are at their homes; similarly, from 9 AM to 5 PM, users between 16 and 64 years old stay the longest at their workplaces. The data were processed anonymously, without any users’ private information. The records were aggregated from all base stations’ records and redistributed to grid cells of 250 × 250 m resolution, enabling detailed analysis without depending on administrative boundaries. In particular, the OD data were extracted from people who either work or live in Wuhan and were utilized to analyze commuting behavior. However, Baidu location data have their limitations. It should be taken into consideration that such data do not cover all the residents nor their commuting activities in the entire WMA, leaving out people who do not use Baidu apps. Besides, Baidu location data are acquired by passive positioning, which means that the location data are recorded only when people use Baidu apps. In addition, the data have geolocation deviations and influences from cases where one person has several smartphones, so we should examine whether the data can properly represent and depict the features of the whole population. Given these limitations, to examine the quality of data, the research summarized the residential population of each subdistrict and calculated the correlation between the summarized results and the amount of community residential population from the demographic census, excluding grids with zero values. Their Spearman correlation coefficient was 0.723 with a significance level of 0.01, which indicates that the Baidu residential population has a significant and relatively strong correlation with the census population. At the same time, the sum of the Baidu population is more than the demographic population, which means that the Baidu population contains not only permanent residents, but also a mobile population in the WMA. Hence, the location data can properly show the jobs–housing imbalance within the population.

2.2.2. Land Use

Land use data were provided by the Wuhan Geomatics Institute, including for town and country lands and urban built-up areas. Such information was used to identify the types of jobs in different areas. The town and country lands consist of development and non-development lands. The urban built-up areas comprise residential land, manufacturing land, transportation, public services and administration, green space (excluding water), commercial and business facilities, municipal utilities, and logistics and warehouse facilities. Land use data covered the entire realm of the WMA.

2.3. Methodology

2.3.1. Kernel Density Estimation

The kernel density estimation (KDE) method is a spatial smoothing or spatial interpolation technique to convert discrete points or polyline features into a new framework, such as a continuous raster surface [47,48]. The essence of an object in a place and its surroundings have a mutual effect rather than being independent. As the distance increases, that mutual effect slowly decays. Thus, an object and its surroundings should be taken together to capture the real relationship between two neighborhood features.
Search radius and output cell size play important roles in kernel density analysis, both of which significantly influence the kernel density results [49,50]. This study calculated the density of housing at a search radius of 70 km and job density at several search radii of 1, 2, 3, 4, 6, 8, and 12 km. The KDE results of different bandwidths showed quite similar spatial distribution characteristics but with a stronger smoothing effect as the bandwidth was enlarged. The search radius for housing density was set on the basis of the longest spatial straight-line distance of commuting according to the OD data. Housing kernel density was utilized to evaluate the competition for job opportunities between residents in different housing grids, and job kernel density was used to estimate the distribution of jobs within certain distances of housing grids. The series of search radii for job density was set according to normal commuting time circles of different public commuting modes, including walking, biking, and bus (Table 1). Based on the data in the research report on urban commuting in China in 2018 released by Aurora Big Data, the average commuting time of residents in Wuhan is 43 min. Therefore, the largest commuting time circle for each commuting mode was set as 45 min. For fairness, this study excluded commuting by private car because not all residents in the WMA own cars. The study also calculated the density of transport service facilities at a search radius of 1 km [51]. In addition, according to the Urban Residential Area Planning and Design Standards, the average walking distance of a neighborhood block, which is the smallest unit in residential area scale classification, is less than 300 m. Therefore, this study chose an output cell size of 250 × 250 m to assess the density of housing, jobs, and transport service supply at the same grid scale. The conditions of the area within 300 m were also considered, since the study utilized the centroid of a grid as the starting point.

2.3.2. The Jobs–Housing Spatial Structure and Transport Service Supply

The research used an innovative way to measure job accessibility at the grids’ level. Job accessibility refers to the spatial relationship between housing units in housing grids and job opportunities distributed within their different commuting circles’ areas. Given that the job and housing location data were unavailable, the research used residential population and employed population data as proxies for the housing units and jobs, respectively. A housing unit refers to a unit of residential space that can be occupied for living. One residential person can represent a unit of housing. First, the residential density and employment density in each grid were calculated by dividing the number of housing units and jobs by the number of square meters in each grid, respectively. The kernel density was calculated per square meter by KDE measurements. Second, the Z-score was calculated for the kernel density of housing and jobs, which can be used to describe the potential demand for jobs by residents in a housing grid and its surrounding job opportunities. The Z-scores were calculated as follows:
Zscore = x i Aver x STD x
where x i is the value for kernel density, A v e r x is the arithmetic mean of all kernel density values, and S T D x is the standard deviation of all kernel density values.
For each housing grid, the Z-scores of housing density were subtracted from employment density within its different commuting circles’ areas, and the circle with the largest positive gap was chosen as the place that can provide the most job opportunities for the residents in this grid. The housing grids where the circle with the largest difference is negative were assigned null values. In addition, since the different industries together constitute the urban function system and correspond to diverse population groups, this research also separately measured the spatial distribution of jobs with different types, including industrial and service jobs, to evaluate the mismatch between jobs and housing at each level of the urban system. Types of jobs were identified based on land use data. Excluding the town lands and country lands, which belong to agricultural land, manufacturing land belonging to urban built-up areas was classified into industry land. The rest was divided into service land. Then, for those housing grids where most of the residents need more than 15 min to commute by bus, this research measured the transport services around them to evaluate whether all of these residents could have access to a public transit system to meet their distant commuting demand within 15 min of walking (about 1 km). The transport services were evaluated from three aspects: The densities of bus stations, metro stations, and roads within 1 km of the housing grids, all of which have significant impacts on the transport accessibility for nearby residents. Due to their different capacities, this research evaluated bus and metro systems separately. The variation in the density of bus/metro stations could reveal disparities between the development of transit facilities in various areas. The points of interest of bus and metro stations were collected from the website of Amap, which is a Chinese company offering map services to users. The road network can be seen as fundamental to traveling. The density of roads directly determines the level of transportation accessibility [52]. Data for the road network were collected from the OpenStreetMap (www.openstreetmap.org), a network platform providing free geographic data. Each aspect of transport service was divided into high-level and low-level (Table 2).

2.3.3. Job Accessibility

This study compared the job accessibility calculated by traditional methods with the method proposed in this research. Traditional job accessibility is calculated based on the relative gravity model [35,53], and it calculates job accessibility as follows:
JS i = j N J j exp b d i j
where JS i refers to job opportunities for residents in subdistrict i , N J j is the number of jobs in subdistrict j , and d i j is the distance between the centroids of subdistricts i and j ; b is the impedance factor, which is calculated based on average commuting distance according to the OD data. The average commuting distance in the WMA is 7.46 km, and thus b is 0.13405 (=1/7.46).
JD j = k N P k exp b d j k
where JD j refers to the demand for job opportunities of residents in subdistrict j , N P k is the number of population in subdistrict k , and d j k is the distance between the centroids of subdistricts j and k .
JA i = j N J j exp b d i j JD j = j N J j exp b d i j k N P k exp b d j k
where JA i refers to job accessibility for residents in subdistrict i . Other notations have been explained previously.

3. Results

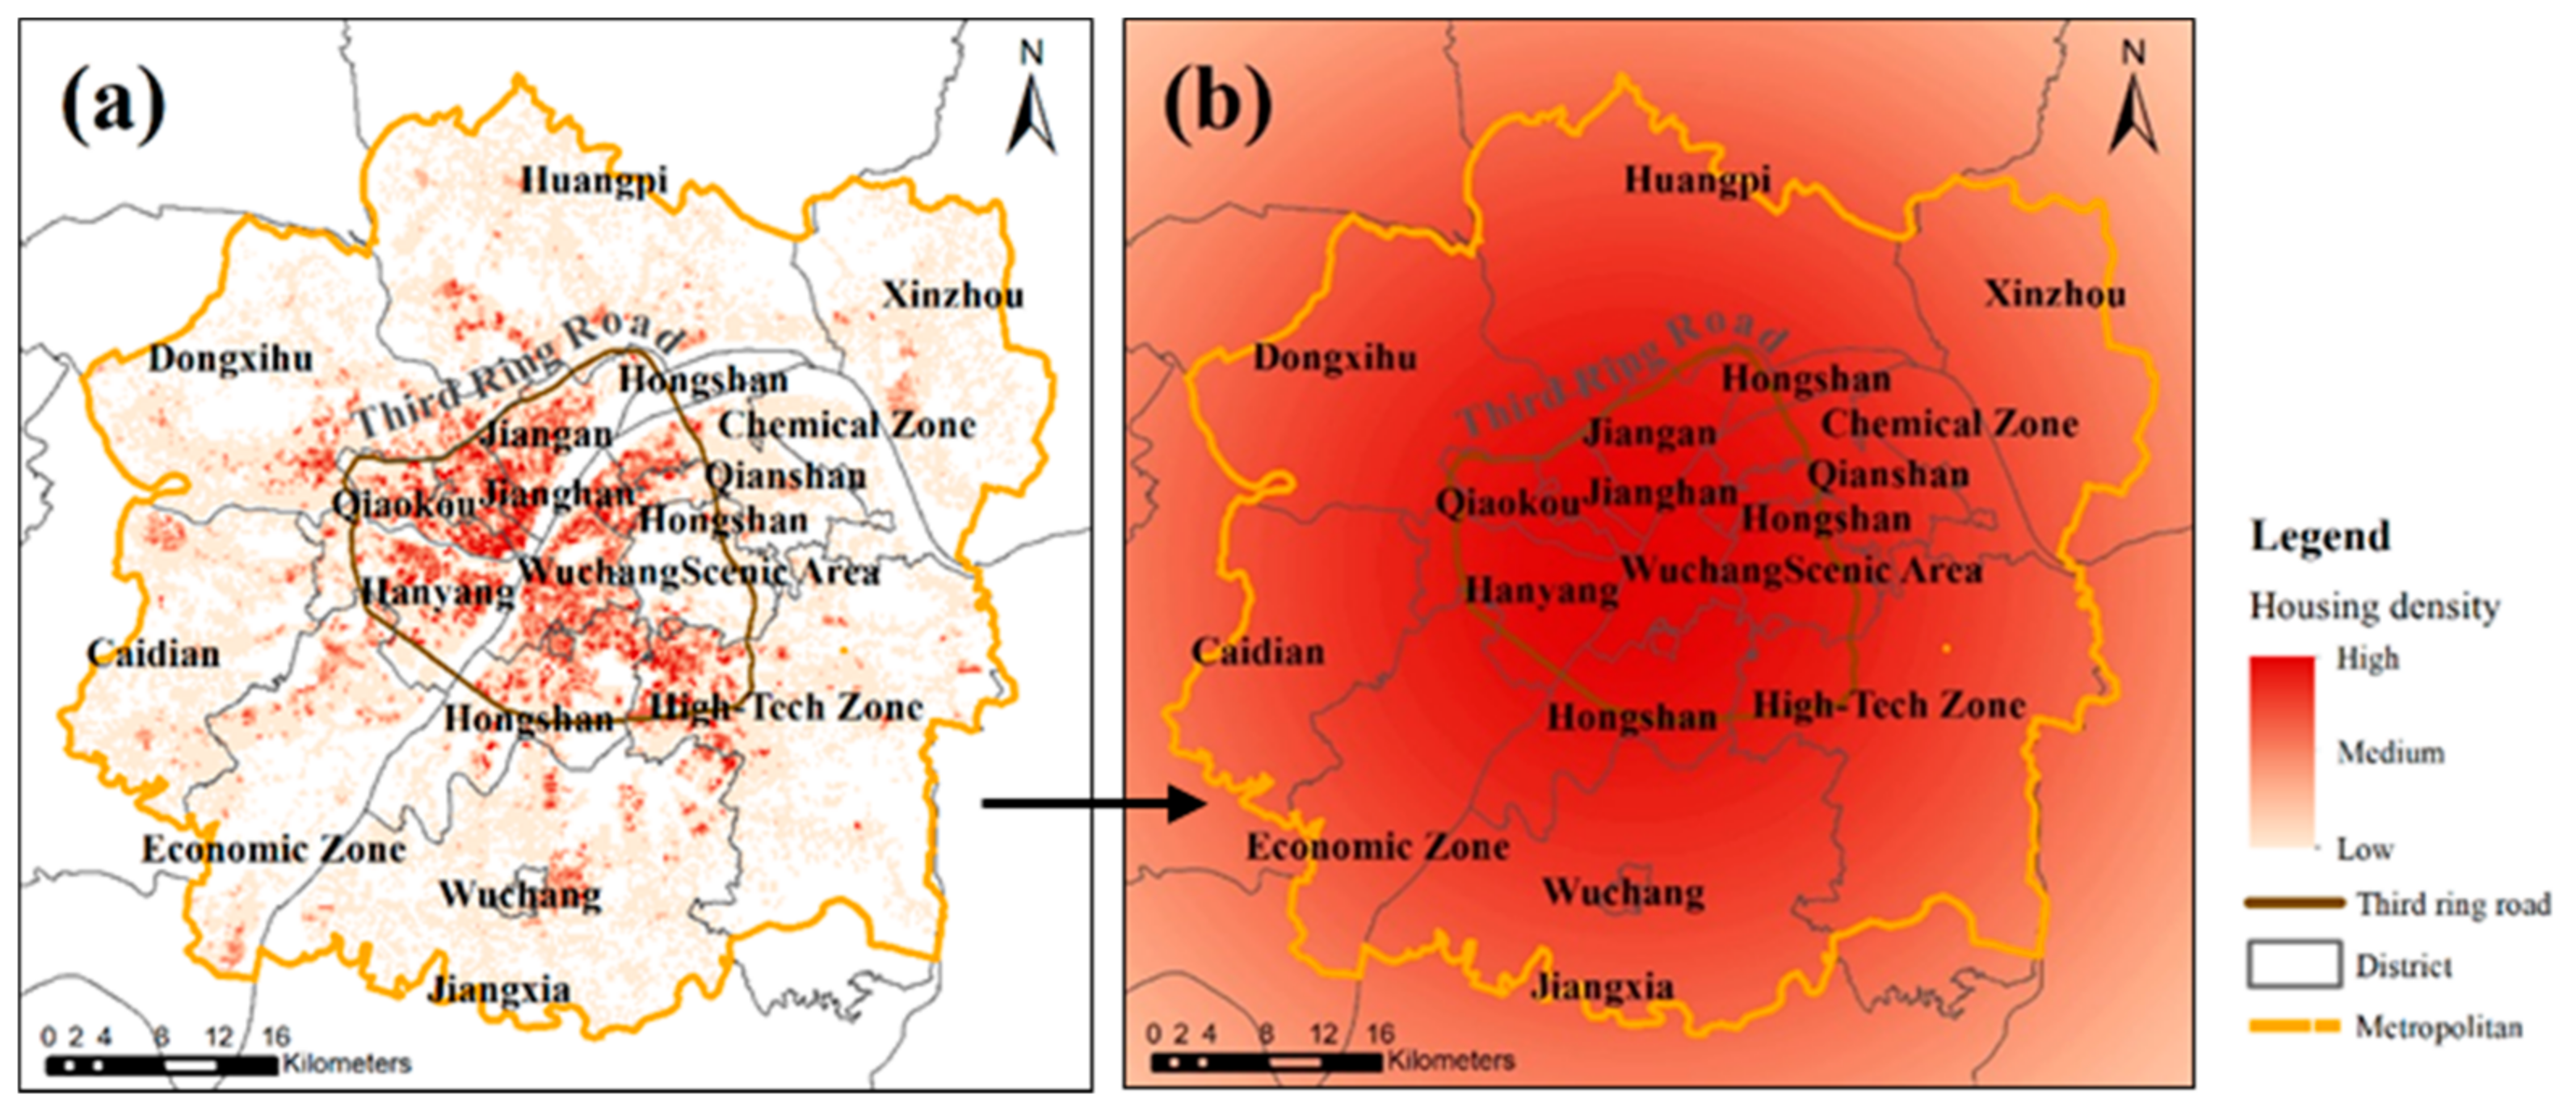
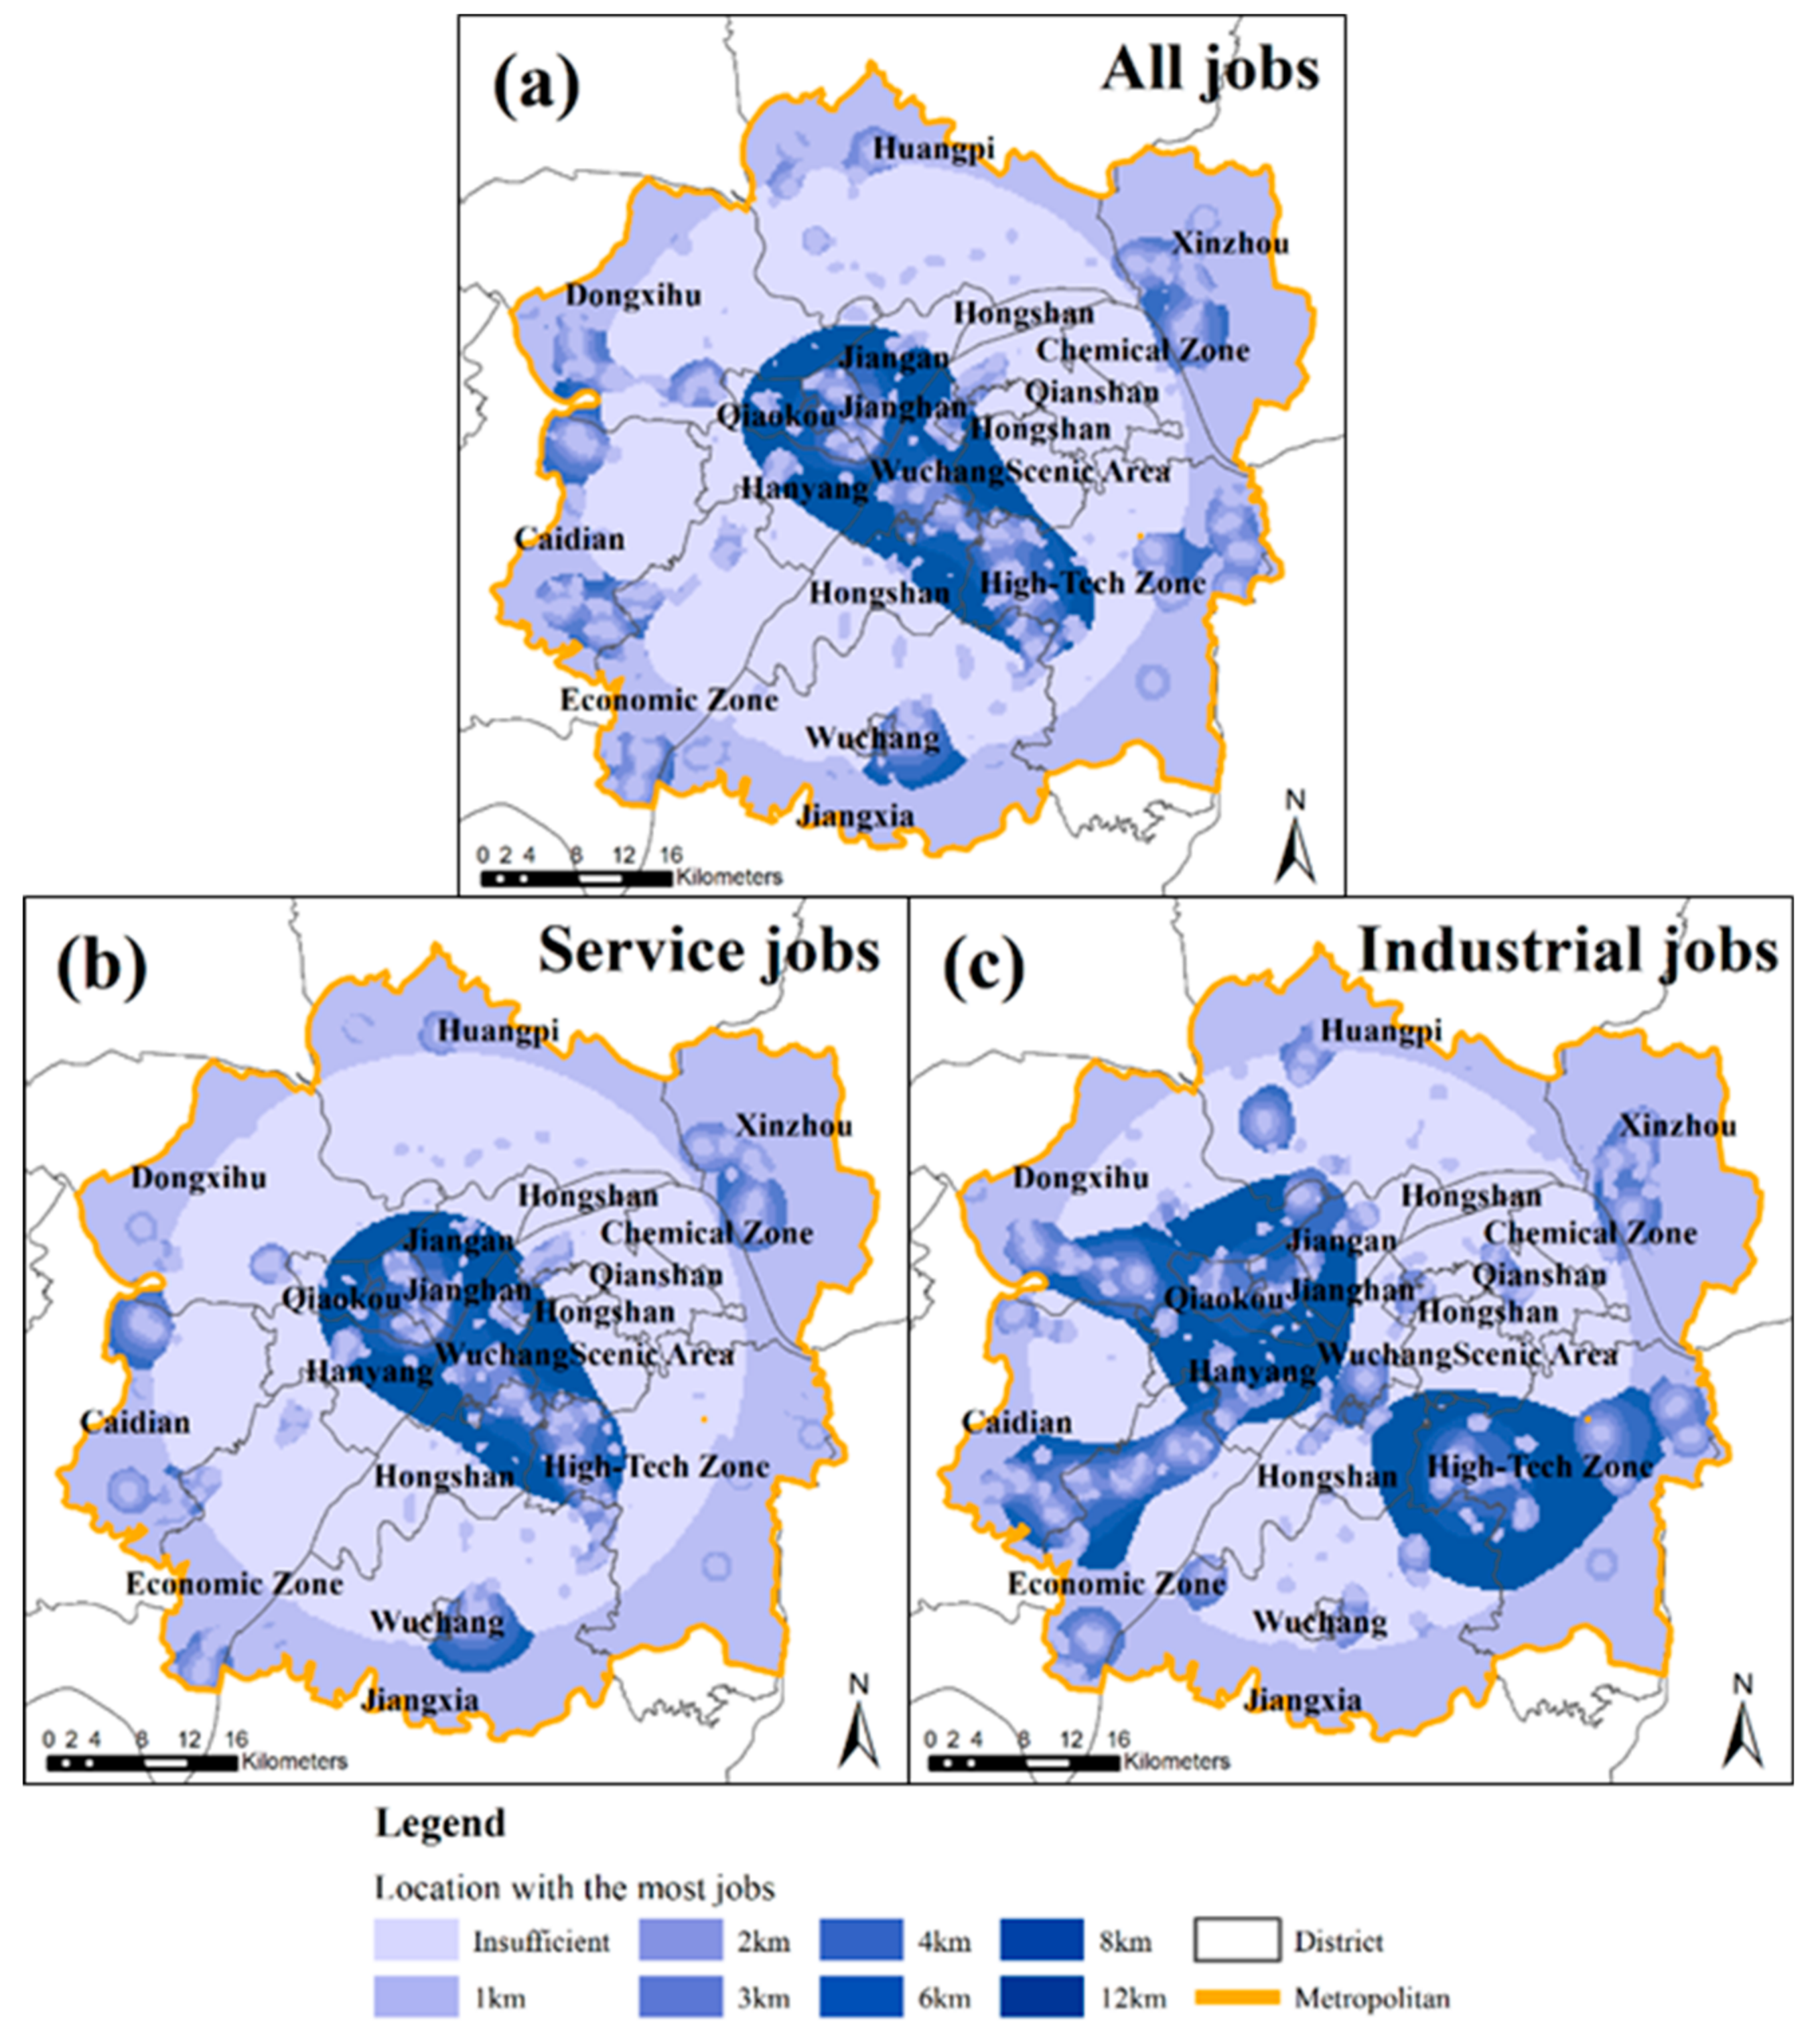
3.1. Spatial Distribution of Housing and Job Opportunities

This study calculated the housing density in each housing grid and then used KDE to measure the competition for job opportunities between residents in different housing grids within 70 km. The housing kernel density can reveal the probabilities of people’s selections of houses. A high housing kernel density in a housing grid increases the likelihood of people choosing to live there, which in turn results in fierce competition for the surrounding job opportunities in the area. The study also calculated the job density for all jobs, service jobs, and industrial jobs, and then assigned these values to each housing grid for evaluating job distribution around the housing grids.
Figure 2a shows that housing units in the WMA are concentrated in the city center. The housing density slowly decreases from the central urban areas to the urban fringes along the main roads. Within the third ring road, the housing density is remarkably higher than in those areas outside it. Inside the third ring road, housing is concentrated along both sides of the Yangtze River and stretches to the east and west of the WMA. In the area outside the third ring road, housing is scattered in the central towns of suburbs as well as distributed along the main roads. As for the housing kernel density for measuring competition for job opportunities (Figure 2b), a significant ring distribution takes the city’s central area as its core. The housing kernel density inside the third ring road is relatively high; then, it decreases in circles with a decreasing radius growing gradient.
Figure 3a shows that jobs distribution in the WMA has similar features to those of housing distribution, but has a large proportion of moderate-density areas and a lesser proportion of relatively high-density areas. The disparity between job distributions in different places is less than that of the housing distributions. As for the kernel densities of jobs (Figure 3b–d)—which show the job opportunities in different places—as the search radius enlarges, the smoothing effect and ring distribution of the kernel densities of jobs become significant. The areas with relatively high kernel densities of jobs slowly tend to concentrate in the center of the area; those high-value areas in the suburbs slowly disappear. The areas with a high kernel density of jobs in the periphery of the city center are generalized to the central urban area as the search radius increases. More jobs are distributed along the east–west axis than along the north–south axis of the WMA.
As Figure 4 shows, service jobs are concentrated in the central urban areas and along the Yangtze River, whereas industrial jobs are relatively scattered throughout suburbs. Service jobs have a stronger central aggregation than that of industrial jobs. They tend to concentrate inside the third ring road. The areas outside the third road have scattered service jobs alongside the main roads. By contrast, industrial jobs have significant agglomeration in some areas of the suburbs, especially in the Dongxihu District, Economic Development Zone, and East Lake High-Tech Development Zone. All three of these areas mainly develop industry. As the search radius enlarges, the change trend of service job opportunities is similar to that of all jobs, in which the double centers located in Hankou and Wuchang merge into a single center located in the city center. In contrast to service jobs, industrial job opportunities tend to aggregate in two separated centers as the search radius increases. One center is at the intersection of the Jinghan and Hanyang Districts, and the other is distributed near the periphery of the third ring road in the East Lake High-Tech Development Zone.

3.2. Job Accessibility for Housing Grids

The research calculated the difference between the Z-scores of the housing density and the densities of job opportunities within different commuting circles to evaluate the mismatch of high–low levels between housing and surrounding job opportunities in multiple commuting circles. Then we chose the commuting circles with the largest positive difference as the places that can provide the most job opportunities for residents in housing grids. The results are shown below.
Overall, the spatial relationship between the potential job demand of residents in housing grids and their surrounding job opportunities in different areas is significantly based on zoning. As Figure 5 shows, most of the housing grids that have most of their surrounding job opportunities distributed within 1 km (about 15 minutes’ walk) are located in the fringes of the WMA. These types of areas are also scattered alongside the main roads. Most of the housing grids that have most of their surrounding job opportunities distributed within 2, 3, and 4 km (about 30 minutes’ walk, 45 minutes’ walk, and 30 minutes’ bike, respectively) are dispersed in the urban fringes or concentrated along the east–west axis of the WMA, which is perpendicular to the Yangtze River in the central urban area. The housing grids that have most of their surrounding job opportunities located within 6 and 8 km (about 45 minutes’ bike and 30 minutes’ bus) take a relatively low proportion of all the housing grids. They tend to be concentrated in the city center and the east–west axis of the WMA, showing a dumbbell shape. The housing grids with surrounding job opportunities that cannot satisfy their employment demand even within 12 km (about 45 minutes’ bus) take the largest proportion of all housing grids and are distributed between the central urban areas and the urban fringes. The external rim of this type of area approximates the circumference of a circle.
There are several differences between the distribution of industrial and service job opportunities in different commuting circles. Except for the null value circle in the inner-ring suburbs of the WMA and the housing grids that have most of their surrounding job opportunities within 1 km in the outer-ring suburbs of the WMA, the housing grids with the same distribution type of surrounding industrial job opportunities are more scattered than those grids with service job opportunities. The housing grids that have most of their surrounding industrial job opportunities within 1, 2, 3, and 4 km show a dispersed distribution in the WMA. Conversely, those grids that have most of their surrounding service job opportunities distributed in the same areas are concentrated in the east–west axis of the WMA and the Chengguan towns (the local economic centers in the suburbs) of the Caidian District, Jiangxia District, and Xinzhou District. The housing grids that have most of their surrounding industrial job opportunities within 6, 8, and 12 km form a wing-shaped distribution on both sides of the Yangtze River and stretch to the southwestern areas of the WMA in the Economic Development Zone. However, the housing grids that have most of their surrounding service job opportunities in the same areas are concentrated along the east–west axis of the WMA.

3.3. Comparison Between New and Traditional Job Accessibility Measurements

This study calculated the job accessibility for people residing in different subdistricts by using a traditional gravity model to compare with the results calculated by the method proposed in this research.
As Figure 6 shows, the distribution for job accessibility at the subdistricts’ level calculated by the gravity model is similar to that of the results of commuting circles with the most job opportunities for housing grids. Overall, the different levels of job accessibility in different subdistricts are significantly based on zoning. The subdistricts with high job accessibility are distributed in the southwestern periphery of the city or the east–west axis of the WMA, which is perpendicular to the Yangtze River in the central urban area, while the subdistricts with low job accessibility tend to disperse in the suburbs. However, what is different is that the job accessibility of subdistricts calculated by the gravity model cannot show the areas with inadequate potential job opportunities. From the perspective of job accessibility, inner-ring suburbs seem to serve as a transitional zone between the inner city and outer-ring suburbs. Furthermore, the traditional job accessibility measurement at the subdistricts’ level is a little macroscopic, lacking a more microscopic and detailed spatial analysis. Thus, we find that the innovative measurement for job accessibility proposed in the research can get similar but more microscopic detail than traditional measurement. The method used in this research improves on the inadequacy of the gravity model in job accessibility measurement. It also realizes the measurement of job accessibility by different transit modes. It can be argued that this approach has its advantages.

3.4. Disparity Between Transport Service Supply and Commuting Demand

Then, the research identified the areas where most residents need to take long-distance commuting but are equipped with a poor transport service. Combining the conditions of bus stations, metro stations, and urban road densities, we summarized eight different patterns for transport service around the housing grids where long-distance commuting takes the majority of potential commuting demand of residents.
As Figure 7 shows, in the central urban area, the transport service is better equipped than in the suburbs. In the west, northeast, and south outskirts of the WMA, the transport service is poor because of the lack of enough traffic facilities. In the east outskirt of the WMA, transport service facilities are more perfect than other outskirts because of the opening of subway Line 2. The housing grids where residents have potential long-distance commuting demand in Hankou have higher levels of traffic services than in the east of the Yangtze River. For industrial and service jobs, the cases are similar to that of all jobs. The transport service for people in the Chengguan towns of the Caidian District, Xinzhou District, and Jiangxia District connecting these areas to distant service jobs falls behind other areas. The transport service supply for people in the Caidian District, Jiangxia District, and East Lake High-Tech Development Zone connecting these areas to distant industrial jobs is also lagging compared with other places. These areas need further transport development or extra nearby job opportunities.

4. Discussion

4.1. The Characteristics of Job Accessibility and Transit Service Optimization

The results show that housing and service jobs are aggregated in the city center along the Yangtze River, whereas industrial jobs are dispersed throughout suburbs with double centers on both sides of the Yangtze River. Furthermore, job accessibility in the WMA is similar to the cases of several other Chinese cities [19,54]. The housing densities in the city’s central areas are higher than those of other places, suggesting that the competition for job opportunities in central areas is fiercer than in other places. As the search radius increases, the influence scale of job opportunities widens, and thus their accessible space enlarges, resulting in different zonings of gaps between housing and surrounding job opportunities. Residents with long- or short-distance commuting demand prefer to live close to groups with the same demand. People with long-distance demand live outside of the housing of those with short-distance demand, whether their commuting demand is to reach service or industrial jobs. This reveals the fact that job accessibility of various areas has certain spatial regularity but large disparity. For the housing grids where most of the residents need to commute more than 15 min by bus, the research evaluated the transport service supply around them to provide guidance for improving transit services for these residents. According to the results, job accessibility and transport service in various areas need three patterns of optimization. The first pattern concerns the areas with inadequate nearby potential job opportunities. In the inner-ring suburbs of the WMA, the job distribution around houses in some areas cannot allow most people who live around these areas to commute even within 45 min by bus. These areas could be considered as lacking nearby job opportunities. For these areas, more jobs near houses must be provided or new transit alternatives must be offered to reduce the commuting burden of the residents. The second pattern concerns the areas with poor transit services to reach service jobs. Most of them are distributed in the suburbs and parts of central urban areas in the Hankou town. Most people who live in these areas need to travel large distances by bus to reach service jobs. Thus, these areas should further develop transit facilities connected to the city center to satisfy the commuting demand of residents or increase service job opportunities close to housing. The third pattern concerns the areas with poor transit services to reach industrial jobs. Most of these areas are in the southeast and the southwest parts of the WMA outside the third ring road, which are in the Caidian District, Economic Development Zone, Jiangxia District, and East Lake High-Tech Development Zone. These areas should improve transport services that connect them to industrial centers for people who do not live near their industrial jobs.

4.2. Comparison between New and Traditional Methods

The method of using KDE with multiple search radii employed in this study has three merits. On one hand, KDE is an effective and efficient method for measuring the job opportunities within a certain accessible area of housing grids by different commuting modes. It can also reveal the disparity of distribution of job opportunities in the entire area. A high job density in a grid means abundant surrounding job opportunities for this grid. On the other hand, using KDE can consider competition for job opportunities between residents in different housing grids. The search radius determines to what extent the job opportunities around a housing grid will be competed for by residents in other housing grids. A high kernel density of housing in a grid suggests a fierce job competition around this grid. Thus, the KDE method can fill the gaps of previous studies, in which the spatial relationship between residential and employment spaces is neglected. In addition, the KDE method provides a high spatial resolution perspective of job accessibility without limiting the discussion on jobs–housing imbalance in administrative units or other large geographical units [13,35].
Z-score calculation is a statistics method which can reveal where an individual distributes among all objects in a statistical sense by calculating its significance level. It has been extensively used in urban planning and geographical studies, such as spatial correlation analysis [55], hot spot analysis [56], and supply–demand gaps in transit service [57,58]. It is an effective statistical method for distinguishing the difference between high and low values of a variable because there is no specific measurement standard for what belongs to high or low values. It can also show the high–high and low–low value correspondence of two variables and be used to identify the clustering patterns of two or more variables. The usage of Z-score calculation for measuring job accessibility in this research has two advantages. One such advantage is measuring the optional available housing units for the employment population. Although the job–housing ratio has been widely used to evaluate jobs–housing balance, and 0.8 to 1.2 is an appropriate scale for evaluating the most balanced jobs–housing relationship [1], it is a little short of persuasion because it only describes the numerical relationship between jobs and housing. In some studies, researchers use OD data to calculate the proportion of people who work and live in the same region and describe the spatial relationship between jobs and housing to some extent [13]. However, this measurement only considers the jobs and housing units that subscribe to existing commuting activities. It does not evaluate optional housing units that are not occupied by employment population at that time, as well as potential residents’ commuting behavior. Once the optional housing units are considered, the scale of 0.8 to 1.2 is no longer appropriate. The other advantage is that it allows the comparison of job accessibility across the entire study area. Z-score calculation makes a meaningful distinction between high and low values of residential and employment densities in the area. It allows us not only to compare two variables in the same magnitude, namely, the relationship between the potential demand for job opportunities in housing grids and their surrounding job opportunities, but also to describe their order across the entire sample. Therefore, the Z-score calculation used in this research is significant in the measurement of job accessibility and can be applied to case studies of other metropolises.
Wuhan is in the heartland of China. It is extremely important for connecting the east and west of China. Taking Wuhan as a case study has two significant points. First, the number of previous studies on jobs–housing imbalance in Wuhan is less than in other cities located in the east of China [43]. Given Wuhan’s important status in our nation, further studies must be conducted on this topic in Wuhan. Second, Wuhan is slowly becoming an employment center in central China. Owing to the development of high-tech industry and success in the competition of talent attraction, Wuhan imports many laborers from other provinces. The city’s abundant resources and privileged position have also been attracting external population scrambling for jobs in Wuhan. However, as the city expands and the employment population increases, jobs–housing imbalance in some areas of Wuhan has become severe [43]. Thus, evaluating jobs–housing imbalance, or rather, job accessibility in Wuhan is important.

4.3. Limitations

This research has certain limitations: (1) The research does not consider the socioeconomic attributes of residents in the WMA. For more comprehensive analysis, future research should evaluate the relationship between job opportunities and commuting demand for different groups of people by the method used in this research. (2) The origin–destination data used in the research are only available for one city, lacking data from multiple cities. The next step of the research calls for data collection from open resources to take the place of the OD data for job accessibility analysis of multiple cities and comparing them with the case of Wuhan.

5. Conclusions

Our findings show the grids’ level’s job accessibility within multiple commuting circles by various transport modes. The origins are available residential housing. The findings also show whether the transport service meets the potential commuting demand of residents. We find that housing and service jobs are aggregated in the city center along the Yangtze River, whereas industrial jobs are scattered throughout suburbs with double centers on both sides of the Yangtze River. In the city’s central areas, the competition among residents for surrounding job opportunities is fiercer than in other places. The empirical findings of the research also reveal that the different levels of job accessibility in different areas present a remarkable circle-like distribution. The housing grids dominated by individuals with potential long- or short-distance commuting demand agglomerate with those that have the same demand. People with long-distance demand reside outside of those that have short-distance demand, whether their commuting demand is for service or industrial jobs. In addition, there are three patterns of areas where transit services need to be optimized to increase job accessibility. The patterns consist of areas with inadequate job opportunities, poor transit services to service jobs, and poor transit services to industrial jobs. The areas of the first pattern should add jobs near houses or provide new transit alternatives to decrease potential individuals with long-distance commuting demand. The areas of the second pattern should improve their transport service connected to service jobs or increase job opportunities close to housing. The areas of the third pattern should develop transport facilities connected to industrial centers to satisfy the commuting demands to distant industrial jobs.
The findings of this study can help guide the allocation of residential and employment spaces as well as the development of transport service facilities to relieve the commuting pressure of residents. The method used in this study can be applied to evaluate job and housing supply in other metropolises. The next step of the research should compare the job accessibility in the WMA with that in other metropolises based on the method in this research.

Author Contributions

Conceptualization, M.C.; Methodology, M.C.; Validation, Y.L. (Yanfang Liu); Formal Analysis, M.C.; Investigation, M.C.; Resources, M.L.; Data Curation, M.L.; Writing—Original Draft Preparation, M.C.; Writing—Review & Editing, L.X., and Y.L. (Yanfang Liu); Visualization, M.C.; Supervision, Y.L. (Yanfang Liu); Project Administration, Y.L. (Yaolin Liu); Funding Acquisition, Y.L. (Yaolin Liu).

Funding

This study was supported by the Wuhan Geomatics Institute and National Key Research and Development Program project “Unified Expression, Aggregation, and Visualization Mining of Geographic Big Data” (Grant No: 2017YFB0503601).

Conflicts of Interest

The authors declare no conflicts of interest.

References

  1. Cervero, R. Job-housing balance and regional mobility. J. Am. Plan. Assoc. 1989, 55, 136–150. [Google Scholar] [CrossRef]
  2. Giuliano, G. Is job-housing balance a transportation issue? Transp. Res. Rec. 1991, 13, 305–312. [Google Scholar]
  3. Evans, H. New Towns: The British Experience; Charles Knight & Co. Ltd.: London, UK, 1972. [Google Scholar]
  4. Cervero, R. Sustainable New Towns: Stockholm’s Rail-served Satellites. Cities 1995, 12, 41–51. [Google Scholar] [CrossRef]
  5. Ma, L.J.C. Urban transformation in China, 1949-2000: A review and research agenda. Environ. Plan. A 2002, 34, 1545–1569. [Google Scholar] [CrossRef]
  6. Ma, L.J.C.; Wu, F. Restructuring the Chinese City: Changing Society, Economy and Space; Routledge: London, UK, 2005. [Google Scholar]
  7. Yang, J. Transportation implications of land development in a transitional economy: Evidence from housing relocation in Beijing. Transp. Res. Rec. 2006, 1954, 7–14. [Google Scholar] [CrossRef]
  8. Liu, W.; Yan, X.; Fang, Y.; Cao, X. Related Characteristics and Mechanisms for Excess Commuting in Guangzhou. Acta Geogr. Sin. 2008, 63, 1085–1096. [Google Scholar]
  9. Wang, D.; Chai, Y. The jobs–housing relationship and commuting in Beijing, China: The legacy of Danwei. J. Transp. Geogr. 2009, 17, 30–38. [Google Scholar] [CrossRef]
  10. Zhou, J.; Zhang, C.; Chen, X.; Huang, W.; Yu, P. Has the legacy of Danwei persisted in transformations? The job-housing balance and commuting efficiency in Xi’an. J. Transp. Geogr. 2014, 40, 64–76. [Google Scholar]
  11. Li, Q.; Lu, X. The characteristics of resident’s working-trip in inner-suburb of Beijing. Urban Probl. 2007, 7, 55–59. [Google Scholar]
  12. Meng, B.; Yu, H.; Zheng, L. The analysis of commuting behavior in the huge residential districts: A case study of Wangjing and Tiantongyuan in Beijing. Geogr. Res. 2012, 31, 2069–2079. [Google Scholar]
  13. Tian, J.; Wang, D.; Xie, D.; Zhu, W. Identifying the commuting features and patterns of typical em-ployment areas in Shanghai using cellphone signaling data: A case study in Zhangjiang, Jinqiao and Lujiazui. Geogr. Res. 2017, 36, 134–148. [Google Scholar]
  14. Palmer, A. Health of People Who Travel to Work: The Effect of Time Travel and Mode of Transport on Health; Centre for Health Services Studies University of Kent: Kent, UK, 2005. [Google Scholar]
  15. Hansson, E.; Mattisson, K.; Björk, J.; Östergren, P.; Jakobsson, K. Relationship between commuting and health outcomes in a cross-sectional. BMC Public Health 2011, 11, 834–847. [Google Scholar] [CrossRef]
  16. Oliveira, R.; Moura, K.; Viana, J.; Tigre, R.; Sampaio, B. Commute duration and health: Empirical evidence from Brazil. Transp. Res. Part A Policy Pract. 2015, 80, 62–75. [Google Scholar] [CrossRef]
  17. Fu, T.; Zhang, Y.; Chai, Y. Implications of commuting pattern for suburban residents’ health in large Chinese cities: Evidences from Tiantongyuan in Beijing. Prog. Geogr. 2018, 37, 547–555. [Google Scholar]
  18. Zhou, Y.; Ma, L.J. Economic restructuring and suburbanization in China. Urban Geogr. 2000, 21, 205–236. [Google Scholar] [CrossRef]
  19. Lu, W.; Chen, W. Manufacturing industry enterprises location choice and the urban spatial restructuring in Nanjing. ACTA Geogr. Sin.-Chin. Ed. 2009, 64, 142–152. [Google Scholar]
  20. Wu, F. Changes in the structure of public housing provision in urban China. Urban Stud. 1996, 33, 1601–1627. [Google Scholar] [CrossRef]
  21. Chai, Y.; Liu, Z.; Shen, J. Changes of the Danwei system and its effects. Arid Land Geogr. 2008, 31, 155–163. [Google Scholar]
  22. Wang, F. Modeling commuting patterns in Chicago in a GIS environment: A job accessibility perspective. Prof. Geogr. 2000, 52, 120–133. [Google Scholar] [CrossRef]
  23. Ma, Q.; Zhang, W. Characteristics and factors analyses of suburbanization in Beijing. Geogr. Res. 2006, 25, 121–130. [Google Scholar]
  24. Giuliano, G.; Kenneth, A.S. Is the journey to work explained by urban spatial structure? Urban Stud. 1993, 30, 1485–1500. [Google Scholar] [CrossRef]
  25. Cervero, R. Job-housing Balance as Public Policy. Urban Land 1991, 50, 153–169. [Google Scholar]
  26. Thomas, R. London’s New Towns: A Study of Self-Contained and Balanced Communities; PEP: London, UK, 1969. [Google Scholar]
  27. Cervero, R. Job-housing balance revisited: Trends and impacts in the San Francisco Bay Area. J. Am. Plan. Assoc. 1996, 62, 492–511. [Google Scholar] [CrossRef]
  28. Martin, R.W. Spatial mismatch and the structure of American metropolitan areas, 1970–2000. J. Reg. Sci. 2004, 44, 467–488. [Google Scholar] [CrossRef]
  29. Sun, T.; Liu, X. Job-housing Spatial Mismatch of Permanent Immigrants and Local Registered Residents in Chinese Metropolises: An Empirical Study Based on Beijing, Shanghai and Guangzhou. Popul. Econ. 2016, 5, 23–34. [Google Scholar]
  30. Hansen, W.G. How accessibility shapes land use. J. Am. Plan. Assoc. 1959, 25, 73–76. [Google Scholar] [CrossRef]
  31. Handy, S.L.; Niemeier, D.A. Measuring accessibility: An exploration of issues and alternatives. Environ. Plan. A 1997, 29, 1175–1194. [Google Scholar] [CrossRef]
  32. Tilahun, N.; Fan, Y. Transit and job accessibility: An empirical study of access to competitive clusters and regional growth strategies for enhancing transit accessibility. Transp. Policy 2014, 33, 17–25. [Google Scholar] [CrossRef]
  33. Levinson, D.M. Accessibility and the journey to work. J. Transp. Geogr. 1998, 6, 11–21. [Google Scholar] [CrossRef]
  34. Gibb, K.; Osland, L.; Pryce, G. Describing inequalities in access to employment and the associated geography of wellbeing. Urban Stud. 2014, 51, 596–613. [Google Scholar] [CrossRef]
  35. Hu, L.; Fan, Y.; Sun, T. Spatial or socioeconomic inequality? Job accessibility changes for low- and high-education population in Beijing, China. Cities 2017, 66, 23–33. [Google Scholar] [CrossRef]
  36. Ahas, R.; Aasa, A.; Silm, S.; Tiru, M. Daily rhythms of suburban commuters’ movements in the Tallinn metropolitan area: Case study with mobile positioning data. Transp. Res. Part C Emerg. Technol. 2010, 18, 45–54. [Google Scholar] [CrossRef]
  37. Yuan, Y.; Raubal, M.; Liu, Y. Correlating mobile phone usage and travel behavior: A case study of Harbin, China. Comput. Environ. Urban Syst. 2012, 36, 118–130. [Google Scholar] [CrossRef]
  38. Niu, X.; Ding, L. Analyzing job-housing spatial relationship in Shanghai using mobile phone data: Some conclusions and discussions. Shanghai Urban Plan. Rev. 2015, 121, 39–43. [Google Scholar]
  39. Liu, X.; Long, Y. Automated identification and characterization of parcels with OpenStreetMap and points of interest. Environ. Plan. B Plan. Des. 2016, 43, 341–360. [Google Scholar] [CrossRef]
  40. Levingston, B.L. Using Jobs Housing Balance Indicators for Air Pollution Control; Institute of Transportation Studies, University of California: Berkeley, CA, USA, 1989. [Google Scholar]
  41. Deakin, E. Land use and transportation planning in response to congestion problems: A review and critique. Transp. Res. Rec. 1989, 1237, 77–86. [Google Scholar]
  42. Zhong, R. The Job-housing Balance and Urban Commuting. Urban Stud. 1997, 34, 1215–1235. [Google Scholar]
  43. Hu, J.; Zhu, L.; Lou, J. Characteristics and Evaluation of Job-housing Space of Wuhan. Hum. Geogr. 2014, 129, 76–82. [Google Scholar]
  44. Zhou, S.; Yan, X. Characteristics of Job-housing and Organization in Guangzhou. Sci. Geogr. Sin. 2005, 25, 664–670. [Google Scholar]
  45. Liu, B.; Shen, F. A Study on the Spatial Characteristics of Job-housing Structure in Beijing. Hum. Geogr. 2011, 26, 40–47. [Google Scholar]
  46. Sun, T.; Wang, L.; Li, G. Distributions of Population and Employment and Evolution of Spatial Structures in the Beijing Metropolitan Area. Sci. Geogr. Sin. 2012, 67, 829–840. [Google Scholar]
  47. Fotheringham, A.S.; Brunsdon, C.; Charlton, M. Quantitative Geography: Perspectives on Spatial Data Analysis; Sage: London, UK, 2000. [Google Scholar]
  48. Xun, S. Selection of bandwidth type and adjustment side in kernel density estimation over inhomogeneous backgrounds. Int. J. Geogr. Inf. Sci. 2010, 24, 643–660. [Google Scholar]
  49. Brunsdon, C. Estimating probability surfaces for geographical point data: An adaptive kernel algorithm. Comput. Geosci. 1995, 21, 877–894. [Google Scholar] [CrossRef]
  50. Anderson, T.K. Kernel density estimation and K-means clustering to profile road accident hotspots. Accid. Anal. Prev. 2009, 41, 359–364. [Google Scholar] [CrossRef]
  51. Yin, C.; Liu, Y.; Wei, X. Road Centrality and Urban Landscape Patterns in Wuhan City, China. J. Urban Plan. 2018, 144, 511–522. [Google Scholar] [CrossRef]
  52. Zhao, P. The impact of the built environment on individual workers’ commuting behavior in Beijing. Int. J. Sustain. Transp. 2013, 7, 389–415. [Google Scholar] [CrossRef]
  53. Shen, Q. Location characteristics of inner-city neighborhood and employment accessibility of low-wage workers. Environ. Plan. B 1998, 25, 345–365. [Google Scholar] [CrossRef]
  54. Wang, E.; Song, J.; Xu, T. From ‘spatial bond’ to ‘spatial mismatch’: An assessment of changing jobs–housing relationship in Beijing. Habitat Int. 2011, 35, 398–409. [Google Scholar] [CrossRef]
  55. Anselin, L. Local Indicators of Spatial Association—LISA. Geogr. Anal. 1995, 27, 93–115. [Google Scholar] [CrossRef]
  56. Getis, A.; Ord, J.K. The Analysis of Spatial Association by Use of Distance Statistics. Geogr. Anal. 1992, 24, 127–145. [Google Scholar] [CrossRef]
  57. Jiao, J.; Dillivan, M. Transit Deserts: The Gap between Demand and Supply. J. Public Transp. 2013, 16, 23–39. [Google Scholar] [CrossRef] [Green Version]
  58. Jiao, J. Identifying Transit Deserts in Major Texas Cities Where the Supplies Missed the Demands. J. Transp. Land Use 2017, 10, 529–540. [Google Scholar] [CrossRef]
Figure 1. Location of the study area ((ac) respectively refer to the maps of China, Wuhan, and Wuhan Metropolitan Areas).
Sustainability 11 06696 g001
Figure 2. Housing density and competition for surrounding job opportunities ((a) is the spatial distribution of the density of residents, (b) is the spatial distribution of the kernel density of residents with the search radius as +∞).
Sustainability 11 06696 g002
Figure 3. Job opportunities in different commuting circles of housing grids (only shows 1, 4, and 12 km). (a) is the spatial distribution of the density of jobs; (bd) refer to the spatial distributions of the kernel densities of all job opportunities with the search radii respectively as 1 km, 4 km, and 12 km.
Sustainability 11 06696 g003
Figure 4. Job opportunities for different types of jobs (only shows 1, 4, and 12 km). (a1a3) are the spatial distributions of the kernel densities of service jobs with the search radii respectively as 1 km, 4 km, and 12 km. (b1b3) are the spatial distributions of the kernel densities of industrial jobs with the search radii respectively as 1 km, 4 km, and 12 km.
Sustainability 11 06696 g004
Figure 5. Commuting circles with the most job opportunities for residents in housing grids. (ac) respectively refer to the spatial distributions of job accessibilities for housing grids to all jobs, service jobs, and industrial jobs. Job accessibility was measured by the method proposed in this research.
Sustainability 11 06696 g005
Figure 6. Job accessibility at the subdistricts’ level by gravity model (excluding null value areas). (ac) respectively refer to the spatial distributions of job accessibilities for housing grids to all jobs, service jobs, and industrial jobs. Job accessibility is calculated by traditional measurement.
Sustainability 11 06696 g006
Figure 7. Patterns of transport service around housing grids. (ac) respectively refer to the spatial distributions of the levels of transit service supply for housing grids to all jobs, service jobs, and industrial jobs.
Sustainability 11 06696 g007
Table 1. Search radius for job density.
No.Search Radius (km)Commuting Mode 1Commuting Time (min)Commuting Mode 2Commuting Time (min)
S01000walk≤15bike≤7.5
S12000walk≤30bike≤15
S23000walk≤45bike≤22.5
S34000bike≤30bus≤15
S46000bike≤45bus≤22.5
S58000bike≤60bus≤30
S612,000bus≤45\\
Table 2. Patterns of transport service supply.
Transport Service SupplyCode of Value’s Level
HighLow
Density of bus stationsHBLB
Density of metro stationsHMLM
Density of urban roadsHRLR

