Abstract
To build a sustainable social system in the future, the promotion of animal welfare, as well as human welfare, is essential. In this study, we address the issues related to animal euthanasia that are commonly encountered in animal shelters. Many animals entering an animal shelter are euthanized in shelters due to the lack of physical facilities, and new strategies are needed to reduce such euthanasia. For this purpose, we show that it is possible to reduce euthanasia numbers by utilizing the space resources of the animal shelters efficiently and by sharing these space resources appropriately among shelters. To achieve this, we propose mathematical optimization models that determine operational schedules of given shelters with the objective of minimizing euthanasia rates. To demonstrate the superiority of our approaches, we conducted a case study at the animal shelters in the Seoul capital area. Through the case study, we show that operating schedules obtained from our model can reduce euthanasia significantly, 30% on average, due to the efficient utilization of facility space in the shelters. We demonstrate that our approaches can have a high impact on improving animal welfare in shelters if they are properly combined with strategies encouraging adoptions.
1. Introduction
Building a sustainable social system for the future of humanity is one of the big challenges the world faces today. To accomplish this, we are striving to achieve specific goals such as responding to climate change, building a green energy system, ensuring healthy living, and reducing social inequality [1]. In a sustainable society, animal welfare, as well as human well-being, can become sustainability measures because we can judge how mature the society is from its attitude toward animals that are weaker than humans [2].
As Korea has joined the ranks of advanced economies since the beginning of the 21st century, the number of companion animals has increased dramatically to the extent that today it becomes one-fifth of the population. Accordingly, the number of stray animals, such as cats and dogs, is rapidly increasing every year. In 2017, the number of rescued stray animals exceeded 100,000, an increase of 14.3% compared with the previous year [3]. When an animal is rescued, it is first sent to a nearby animal shelter (municipal shelter or privately-owned shelter), and the shelter notifies the public, via the Internet or other means, of the fact that the animals that have been admitted are protected in the shelter for a fixed period of time (currently ten days). If the original owner does not appear during this period, ownership of the animal is passed to the municipality. Such animals are then protected in shelters, and in this case, adoption by the general public is most desirable not only for animals but for society as a whole. However, animals in shelters can be euthanized when they are no longer accepted at the shelter because of a lack of budget or a lack of physical facility [4,5], and natural deaths often occur during the protection period due to poor shelter conditions and resulting infections [6,7]. In 2017, among rescued animals entering shelters in Korea, approximately 14.5% were returned to the owners, approximately 27.1% died from natural causes, and approximately 30.2% were adopted by the public. Unfortunately, about 20.2% of rescued animals were euthanized [3]. As Figure 1 shows, the proportion of animals euthanized tends to decrease every year due to increasing public interest in animal welfare, such as the reduction of the negative perception towards stray animals. However, the rate of euthanasia in Korean shelters is still very high compared to other developed countries, indicating the poor level of animal welfare in Korea.
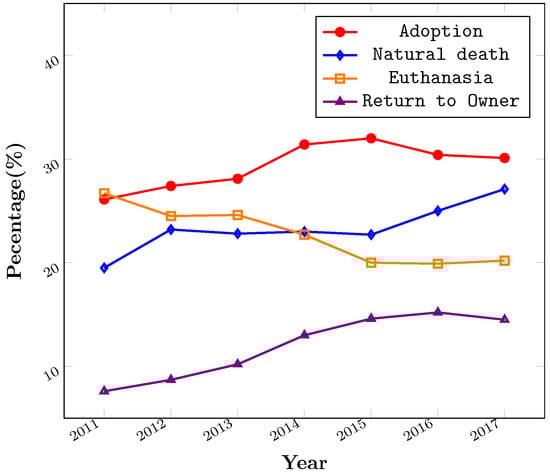
Figure 1.
Fates of animals entering shelters in Korea.
The primary cause of high euthanasia rates in Korean shelters is that the number of animal shelters is not increasing enough for the growing number of rescued animals under circumstances where the adoption rate is decreasing, as shown in Figure 1. Because the infrastructure for the animal shelter cannot be expanded in a short period of time, this study deals with ways to reduce the number of unnecessary euthanasia procedures by efficiently utilizing the existing space resources of the given shelters. We note that, because each shelter is operated independently in the form of direct management or private consignment within one municipality, there are difficulties in resolving problems through information sharing and cooperation among shelters. Therefore, this study aims to study methods of optimizing the operation of animal shelters, including animal transfer between the shelters. It will be shown that scientific decision-making through effective resolution of optimization problems associated with animal shelter operations can greatly contribute to the increase in the number of animals protected and the decrease in the euthanasia numbers in the shelters.
There have been few studies that deal with quantitative analysis on the management of animal shelters or approaches to reduce euthanasia rates. The authors of [8] conducted a pilot study to determine whether there is a higher risk of euthanasia related to the source of acquisition for pets surrendered to an animal shelter. They showed that animals acquired from shelters had lower rates of euthanasia than most other sources, which indicates that shelter-sourced animals can be considered a preferred source for pet acquisition to help in reducing the number of adoptable pets euthanized. In [9], the authors studied a shelter management model called Capacity for Care (C4C), which calculates the optimal daily population in the shelter based on meeting the shelter’s goals of anticipated adoptions and improved animal housing. The results of the study showed that implementing C4C was associated with lower daily populations, increased probability of adoption, and decreased the probability of euthanasia in the shelter. In [10], the authors investigated the determinants of adoption or euthanasia of cats and dogs from a large municipal animal shelter. They constructed logistic regression models predicting the conditional probability of adoption from variables such as age, sex, coat color, and reasons for relinquishment. Using these models, the authors quantified the preferences of adopters, using this information to devise strategies to increase adoption rates and decrease euthanasia rates. The authors of [11] studied a free adoption strategy to reduce crowding and euthanasia at cat shelters. They showed that using free adoptions can increase adoptions significantly with no evidence for adverse outcomes associated with free adoptions via an Australian case study. Therefore, free adoption promotions during times of overcrowding can help animal shelters.
We note that, because each shelter is operated independently in the form of direct management or private consignment within one municipality, there are difficulties in resolving problems through information sharing and cooperation among shelters. Therefore, this study aims to study methods of optimizing the operation of animal shelters, including animal transfer between the shelters. It will be shown that scientific decision-making through effective resolution of optimization problems associated with animal shelter operations can greatly contribute to the increase in the number of animals protected and the decrease in the euthanasia numbers in the shelters.
This paper is organized as follows. Section 2 describes the optimization problem associated with animal shelter operations considered in this study. The descriptions of data used in our case study in the Seoul capital area is given in Section 3. The results of our case study are presented in Section 4, and our conclusions are given in Section 5.
2. Problem Description and Optimization Models
In this section, we first describe the operation of animal shelters related to euthanasia and then define the optimization problem to minimize unnecessary euthanasia.
According to the survey on animal welfare conducted by the Korean government in 2016, the average protection period of rescued animals in shelters nationwide is 23.4 days. Because the current animal protection law in Korea requires that rescued animals be protected for ten days, animals are euthanized or adopted on average within 13.4 days after the end of the notification period. The main reason for the euthanasia at the shelter is the saturation of the facilities in the shelter. With an average adoption rate of approximately 30%, it is physically impossible to house the nearly 100,000 animals a year at the 293 shelters throughout Korea. Moreover, because the budget for the protection of shelter animals is at a minimum cost level in line with the legal protection period, a certain level of euthanasia is inevitable for each shelter to operate the facility within the limited budget. However, the unavoidable euthanization of animals that do not have health problems should be minimized to promote animal welfare. Based on the appeals by veterinarians and shelter staff in charge of euthanasia, it is also important to reduce excessive mental stress from animal euthanasia experiences [12,13]. To this end, in the long run, the number of stray animals should be reduced through policy measures, such as inducing changes in the perception of companion animals and enacting laws to curb excessive reproduction. It is also essential that the number of shelters and animal shelter budgets be increased. However, such policies are long-term measures. In this study, therefore, we investigate ways to reduce the number of euthanasia through the effective short-term operation of animal shelters.
Currently, in Korea, each local government unit has approximately 10 to 50 shelters which operate independently of each other. Therefore, some shelters may have a lack of capacity due to the large number of rescued animals that are admitted during a certain period of time, while other shelters may have sufficient capacity due to the relatively small number of admitted animals. In other words, an imbalance in capacity between the shelters can occur, which can lead to unnecessary euthanasia. If shelters can share the information about the number of additional animals they can accommodate, the transfer of animals from overcrowded shelters to relatively less-crowded shelters may enable the effective use of available resources for rescued animals and also reduce the number of unnecessary euthanasia. In this study, we aim to minimize such unnecessary euthanasia by solving the optimization problem that determines the euthanasia schedule at each shelter and the animal transfer plan among the shelters. Prior to presenting our optimization models, let us first define the notations that will be used throughout the paper.
| Sets and indices | |
| N | the set of animal shelters, |
| the set of time periods (day), | |
| Parameters | |
| the number of animals entering shelter i at time t, | |
| the number of natural death occurring at shelter i at time t, | |
| the number of animals adopted from shelter i at time t, | |
| the capacity of shelter i, | |
| , | the minimum and maximum number of animals that can be transported via a vehicle |
| between shelters at one time, | |
| , , | weight of each term used in the objective function, |
| ratio of allowable excess to the capacity of the shelter, | |
| Decision variables | |
| the number of animals euthanized at shelter i at time t, | |
| the number of animals at shelter i at the end of time t, | |
| the number of animals in excess at shelter i at time t, | |
| the number of animals moved from shelter i to shelter j at time t, | |
| binary decision to move animals from shelter i to shelter j at time t. |
With the notation defined, we present the optimization model that aims to minimize unnecessary euthanasia by utilizing the transfer of animals between shelters and by allowing an acceptable level of excess capacity at the shelters.
Constraints (2) ensure that the number of animals being protected at each shelter is preserved on a daily basis. To be specific, the number of animals at the end of the day must equal the number of animals in the previous day plus the number of animals entering the shelter including rescued animals and those transferred from other shelters minus the number of animals leaving the shelter including those adopted, deceased from natural causes, euthanized, and transferred to other shelters. These constraints have essentially the same meaning as the well-known inventory balance equation used in inventory management systems. Constraints (3) impose an upper bound on the number of animals at each shelter at the end of the day, which equals the capacity of the shelter plus the number of animals in excess of the capacity of the shelter. In Constraints (4), the maximum number of animals housed in excess of the capacity is determined by a specific ratio () to the capacity of the shelter. Constraints (5) and (6) state that if the transfer of animals from shelter i to shelter j occurs (), the number of animals to be transferred must be at least and not more than . Constraints (7) set the number of animals in the shelter at the beginning of the planning horizon equals the capacity of the shelter. This reflects the fact that shelters are often overcrowded in Korea because the number of animals rescued per year is greater than the number of animals that all shelters can accommodate per year. Constraints (8) ensure that the number of animals protected in the shelter at the end of the planning horizon cannot exceed the capacity of the shelter. Constraints (9) and (10) are the nonnegativity and binary restrictions of the decision variables. Finally, the objective (1) is to minimize total costs, which are defined by the weighted sum of the number of animals euthanized, the number of animals transferred between shelters, and the number of animals housed in excess of the capacity of the shelter over a planning horizon.
The model () solves the problem of minimizing unnecessary euthanasia by including the number of euthanasia in the objective function. We now present the second optimization model () which solves the problem of making a plan for operating the shelter while restricting the total number of euthanasia below a certain value. Therefore, this model can be more useful when we try to reduce the number of euthanasia to a specific target value. The second optimization model is formulated as follows:
In the objective function (11), the term corresponding to the number of euthanasia is dropped from the objective function (1) of the first model, and it is moved to the Constraint (12). Therefore the objective is to minimize the weighted sum of the number of animals transferred between shelters and the number of animals in excess of the capacity of the shelter over a planning horizon. Constraint (12) enforces that the total number of euthanasia occurred over a planning horizon is not greater than a certain percentage (p) of the total number of rescued animals over a planning horizon. Note that the Constraints (2)–(10) of the () are all remain the same in the model ().
3. Data
Our case study is conducted at 32 animal shelters in the Seoul capital area. Figure 2 shows the location of each shelter and its capacity (), which is defined as the maximum number of animals (dogs and cats) that can be housed simultaneously in the shelter. These data were obtained through a request for disclosure of information to the Korean Ministry of Agriculture, Food, and Rural Affairs [14]. Note that small animal shelters with a capacity of less than 15, most of which are run by animal hospitals, are not considered in our case study.
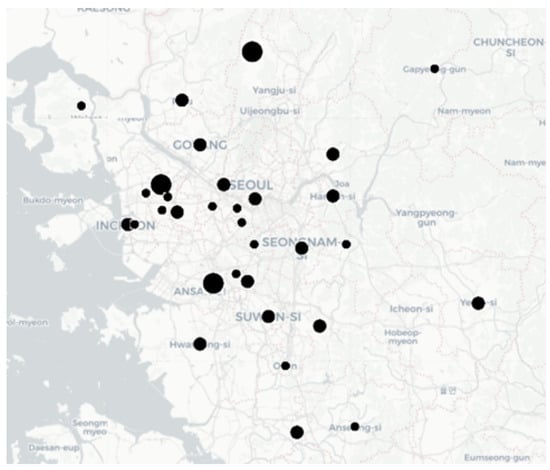
Figure 2.
A graphical illustrationof the location of animal shelters in the Seoul capital area. Small-sized circles represent shelters with a capacity of 50 or less, medium-sized circles represent shelters with a capacity of 50 to 200, and large-sized circles represent shelters with a capacity of 200 or more.
To simulate the real-world practice of an animal shelter, it is assumed that the number of daily occurrences of each event that occurs for shelter animals follows the Poisson distribution. Here, each event corresponds to one of the following: (i) arrival at the shelter, (ii) leaving the shelter (adoption + return to owner), (iii) euthanasia, and (iv) natural death. Specifically, the number of daily occurrences of a type t event at shelter i is modeled as a Poisson process with an arrival rate . This daily arrival rate (an average daily occurrence) is set as the total number of type t events occurring at shelter i during 2017 divided by 365. Figure 3 depicts the box plot of the number of daily occurrences for 32 shelters by event type. Using these Poisson processes, we generated ten random instances with a planning horizon of ten days, i.e., . Here, the number of animals euthanized is not generated since it is determined by the optimization models. Note that we conducted numerical simulations on these ten instances to prevent the bias of generated data and obtain reliable results. As stated previously, because shelters in Korea often suffer from a lack of space, it is assumed that, at the beginning of the planning period, each shelter is fully occupied by shelter animals.
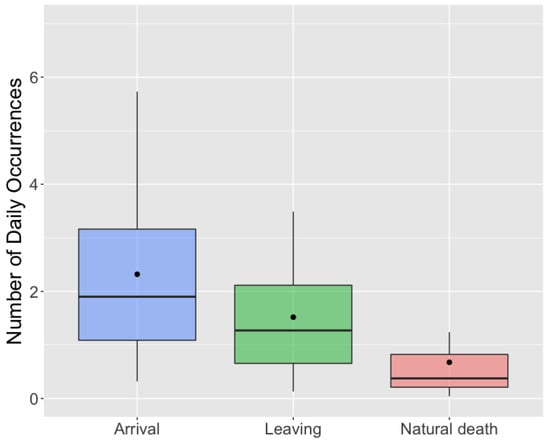
Figure 3.
Box plot of the number of daily occurrences by event type. Black circles represent the average number of daily occurrences over 32 animal shelters.
The weights , , and represent the relative importance of each term used in the objective functions. They work in such a way that larger values lead to fewer occurrences of the corresponding term, and smaller values lead to more occurrences. The default values for these weights were estimated based on the cost of actually performing each action. The weight represents the relative importance of euthanasia, and the cost consists of euthanasia costs, including labor costs and drug costs, animal carcass disposal costs, and social loss costs caused by euthanasia. The weight represents the relative importance of animal transfer, and the corresponding cost is estimated from the operating costs of the vehicles used for animal transportation. Finally, the weight represents the relative importance of housing animals in excess of shelter capacity, and the cost is estimated from the additional cost needed for housing one more animal, including feed cost. This cost is not that significant since most of the shelters are flexible in accommodating a few more animals in the short term. Considering relative size of these cost components, the default values were determined as , , and . In our case study presented in Section 4, we aim to solve the models for different values of , , and to see the effects of the change of these parameters.
The minimum and the maximum number of animals that can be transported at one time is set as and . The maximum value was determined based on the capacity of animal rescue vehicles used in Korea, while the minimum value was set to half of the maximum value because transfer between shelters will occur too frequently if a small number of animals are allowed to be transported at once. Finally, the value was set to 0.1 considering the physical restrictions of shelter facilities, which indicates that animals can be housed in the shelter in excess of 10% of shelter capacity.
4. Results and Discussion
In this section, we present the results of our case study on the Seoul capital area. All of the tests were performed on a 2.9 GHz Intel Core i7 processor with 8 GB RAM. We solved all of the instances using Xpress 8.5 [15] with the default parameter settings.
4.1. Impacts of Efficient Utilization of Space Resources
We first examined the case where animal transfers between shelters and capacity increases were not allowed. The results are obtained by solving the model () with a very large value of and . All of the ten instances were solved within a few seconds. We refer to this as the default case because we will see the effects of animal transfer and excess capacity by comparing the results obtained with this case. The results of the default case are shown in Table 1, which shows the optimal objective value (Obj), the number of animals entering shelters (#Arrival), the number of animals euthanized (#Euthanasia) over a planning horizon of ten days, and the ratio between these two numbers (Ratio). From the table, we can observe that when there are no animal transfers between shelters and no excess accommodation, an average of approximately 1000 animals enter the shelters for ten days, and an average of approximately 300 animals are euthanized during the same period. Each row of the table presents the results for one of ten instances. The ratio in the last column is reported to show how many euthanasia procedures were performed during the planning period compared to the number of animals entering the shelter during the same period. It should be noted that it does not mean that a given percentage of animals among those entering the shelter is euthanized.

Table 1.
Results obtained when animal transfer and capacity increase are not allowed (default case).
We next examine the case where animal transfers and capacity increases are both allowed. The results are obtained by solving the model () with default parameters of , , and . It can be expected to reduce unnecessary euthanasia that would have occurred if these two strategies were not implemented. Table 2 shows the results for ten instances and the average results. The table shows the computational performance of the model () by reporting the computation time for solving the model in seconds (Time) and the gap obtained at termination (Gap). All instances were solved within 180 s. The gap is a measure of how close the solution obtained is to the optimal solution. For example, the gap of 1.15 obtained for the third instance means that the difference between the optimal solution and the solution obtained after 180 s is less than 1.15% of the obtained solution. Note that in the Table 180* means that the instance was not solved to optimality within 180 s. However, we can see that all instances were solved to optimality or very close to optimality within 180 seconds.
Table 2.
Results obtained when animal transfer and capacity increases are allowed.
Table 2 reports the percentage reduction of euthanasia compared to the default case (Reduction), the occurrences of animal transfers between shelters (Occurrence) and the number of transferred animals (#Animal) under the heading of Transfer, and the number of animals housed in excess of the shelter capacity (#Excess) under the heading of Overcrowding. We can first see that the overall objective values are reduced 11.8% on average compared to the default case because the animal transfer and overcrowding costs are less than the cost for euthanasia. We next observe that the number of euthanasia that occurred during ten days is reduced significantly compared to the default case. The average reduction of euthanasia achieved when animal transfers and capacity increases are allowed amounted to 22.7%. The transfers between shelters did not occur frequently, with an average of 5.2 occurrences over ten days, and the total number of transferred animals averaged 34.8%. It is also observed that the number of animals housed in excess of the shelter capacity is an average of 87.8 over ten days, which is very small compared to the sum of the capacities of all shelters (3701) considered in the Seoul capital area. A notable finding from these results is the fact that the number of euthanasia was reduced considerably by approximately 22.7% with an implementation of a very small number of transfers between shelters and a small increase of shelter capacity. This demonstrates the highly significant impact of the introduction of transfer and capacity increases in reducing euthanasia.
4.2. Sensitivity Analysis
We further analyze the sensitivity of the results with respect to parameters , , and . Since the values of these parameters are not easy to estimate and can easily be changed according to the decision maker, it is necessary to investigate the change of the results according to the change of parameter values.
We proceed with an analysis of the impact of the value, representing the cost of euthanasia, on our results. Table 3 reports the results, where each row refers to the average value over ten instances. It is observed that the number of euthanasia decreases with the increase of the value as expected. Note that after the average number of euthanasia reaches 231.8, the number of euthanasia no longer decreases. This indicates that euthanasia for an average of 231.8 animals is inevitable due to the capacity limit of shelters. We can also see that the increase of shelter capacity is the first option considered to reduce euthanasia numbers, and after such an increase of capacity is no longer possible, animal transfer between shelters seems to be implemented.
Table 3.
Results obtained for different values.
We next conducted a sensitivity analysis of values representing the cost of transporting animals from one shelter to another. As can be seen in Table 4, the animal transfers decreases, and the number of euthanasia increases with the increase of the value. It seems that the animal transfers no longer occur as exceeds the value, and in this case, the increase of shelter capacity is only implemented to reduce euthanasia. We can observe that the impact of the increase of shelter capacity only amounts to 11.2% of the euthanasia reduction. Table 5 shows the results of the sensitivity analysis of , representing the cost of increasing the unit capacity of the shelter. The number of animals housed in excess decreases as value increases. However, the number of euthanasia is less affected by the change of the value since the animal transfer rate increases when decreases and therefore mitigates the impact of on the increase of euthanasia. Note that when is sufficiently large, no animals are housed in excess and, in this case, we can see the impact of animal transfers only. The impact of the animal transfers only amounts to approximately 12% of the euthanasia reduction.
Table 4.
Results obtained for different values.
Table 5.
Results obtained for different values.
4.3. Results with an Explicit Limit on Euthanasia
In this subsection, we examine the results obtained by solving the model (), which restricts the total number of euthanasia below a certain level. From the model (), we produce a shelter operation plan under a specific goal of euthanasia reduction. Table 6 shows the results obtained from the second instance among ten instances for different p values representing the maximum ratio of the number of animals euthanized to the total number of incoming animals over a planning period. Note that the p values are tested up to because we noticed that the ratio of the number of euthanasia to the number of incoming animals was 0.30 on average in the default case, as shown in Table 1. Note also that when p is less than 0.22, the models were infeasible, i.e., it was not possible to reduce the number of euthanasia below 22% of the total number of animals entering the shelter during the same period. From the table, we can see that the model () can produce the solutions for desired p values between 0.22 and 0.29, and the animal transfers and the increase of shelter capacity are used appropriately to satisfy the maximum limit of euthanasia. Also, it is observed that as the p value decreases, the marginal cost of reducing euthanasia increases. For example, the cost of reducing the use of euthanasia by 1% is 11 when , but approximately 260 when . In other words, the impacts of animal transfer and capacity increase can be significant when they have not yet been implemented at the shelters.
Table 6.
Results obtained from optimization model () for different p values.
4.4. Discussion
The results of our case study in the Seoul capital area presented in this section demonstrate that the euthanasia rate can be significantly reduced with the help of animal transfer between shelters and the increase of shelter capacity. In our optimization model, we assume that the initial number of animals in the shelter equals the capacity of the shelter, and the number of animals at the end of the planning period cannot exceed the shelter capacity. Therefore, the total number of animals protected in shelters over the planning period increases with the reduction of euthanasia, but at the end of the planning period, they do not exceed the shelter capacity. This may be because the shelter animals are redistributed from overcrowded shelters to less crowded shelters. Note that for the reduction of euthanasia to be meaningful, it should be accompanied by strategies encouraging adoptions such as waiving adoption fees or increasing media promotion [11,16,17]. Without the increase of adoptions, the euthanasia of healthy animals is inevitable under the limited capacity of shelters.
In order for the optimization model proposed in this study to be applied in real-world practice, cooperation such as information sharing among shelters is essential. In Korea, however, each shelter is still operating independently, requiring the introduction of a new platform to enable such cooperation. Such platforms should be centrally operated by local governments because they require central decision-making to control the operation of shelters, and since most large shelters are run by municipalities, it will not be difficult to involve them on the platform. However, in order to involve small privately owned shelters on the platform, incentives such as subsidies will be needed. In Korea, a platform is already being used to share information about the animals being protected at each shelter in real time. The platform allows the general public to get information about the adoption of shelter animals and identify how many animals are being euthanized and how many are being protected on a daily basis. In addition, this information is easily accessible because it can be viewed through a mobile application. Therefore, the improvement of this system is expected to enable the sharing of various information among the shelters to introduce the optimization system proposed in this study. Moreover, with the introduction of information systems to enable information sharing between shelters, recent advances in sensor monitoring systems can help animal shelters collect real-time information about shelter animals [18].
One of the limitations of this study is that many qualitative factors related to animal welfare were not considered. For example, negative effects, such as stress that animals will experience due to transfer between shelters, are difficult to quantify accurately, making them difficult to incorporate into the optimization model. It is also very difficult to quantify negative effects due to mental stress from animal euthanasia experiences by veterinarians and shelter staff in charge of euthanasia. Therefore, future research will need to address effective ways to reflect these qualitative factors in quantitative optimization models.
Our case study dealt with 10 day instances with deterministic data. However when our optimization models are applied in real-world practice, it may not be possible to obtain the exact data on the number of animals entering and leaving shelters. In reality, such optimization models are solved repeatedly every day by shifting the planning horizon, which is called a rolling horizon approach [19,20,21]. Therefore, it is acceptable to use predicted values for input data. Because the input data are reset every day, inaccurate future data does not significantly affect the solution.
5. Conclusions
In this study, scientific decision-making techniques were used to reduce euthanasia rates in animal shelters. In particular, we developed the mathematical optimization models to determine the operation of the animal shelter with the objective of minimizing euthanasia. In the proposed models, we used animal transfer between shelters combined with an increase of shelter capacity as a way to reduce euthanasia. The validity of the proposed models was demonstrated by the case study in the Seoul capital area, Korea. Our findings indicate that animal transfers and the increase of shelter capacities can contribute to a significant reduction in the use of euthanasia. Therefore, if our approach is combined with the policies encouraging adoptions, it is expected to contribute greatly to improving animal welfare in shelters.
As a final remark, we mention that, to the best of our knowledge, this study is the first in the literature that applies scientific decision-making and optimization techniques to the operation of animal shelters as a way of improving animal welfare. We hope that our study will motivate further research on the application of optimization in the field of animal welfare.
Author Contributions
Conceptualization, J.H.K. and J.H.; methodology, J.H.K. and J.H.; software, J.H.K.; validation, J.H.K. and J.H.; formal analysis, J.H.K. and J.H.; Writing—original draft preparation, J.H.K.; Writing—review and editing, J.H.; supervision, J.H.
Funding
This work was supported by the National Research Foundation of Korea (NRF) grant funded by the Korea government (MSIT) (No. 2017R1C1B2006144).
Conflicts of Interest
The authors declare no conflict of interest.
References
- Gaffney, O. Sustainable development goals: Improving human and planetary wellbeing. Glob. Chang. 2014, 82, 20–23. [Google Scholar]
- Santeramo, F.G.; Lamonaca, E.; Tappi, M.; Di Gioia, L. Considerations on the environmental and social sustainability of animal-based policies. Sustainability 2019, 11, 2316. [Google Scholar] [CrossRef]
- Korean Ministry of Agriculture, Food and Rural Affairs. Survey on Animal Protection and Welfare; Korean Ministry of Agriculture, Food and Rural Affairs: Sejong City, Korea, 2017.
- Maubach, B. Benchmarking Best Practices in Decreasing Animal Shelter Euthanasia Rates across the West Coast. Ph.D. Thesis, The University of Arizona, Tucson, AZ, USA, 2014. [Google Scholar]
- Večerek, V.; Kubesová, K.; Voslářová, E.; Bedáňová, I. Rates of death and euthanasia for cats in no-kill shelters in the Czech Republic. Acta Vet. Brno 2017, 86, 109–115. [Google Scholar] [CrossRef]
- Alberthsen, C.; Rand, J.; Bennett, P.; Paterson, M.; Lawrie, M.; Morton, J. Cat admissions to RSPCA shelters in Queensland, Australia: description of cats and risk factors for euthanasia after entry. Aust. Vet. J. 2013, 91, 35–42. [Google Scholar] [CrossRef] [PubMed]
- Turner, P.; Berry, J.; MacDonald, S. Animal shelters and animal welfare: Raising the bar. Can. Vet. J. 2012, 53, 893. [Google Scholar] [PubMed]
- Arbe Montoya, A.; Rand, J.; Greer, R.; Alberthsen, C.; Vankan, D. Relationship between sources of pet acquisition and euthanasia of cats and dogs in an animal shelter: A pilot study. Aust. Vet. J. 2017, 95, 194–200. [Google Scholar] [CrossRef] [PubMed]
- Karsten, C.; Wagner, D.; Kass, P.H.; Hurley, K. An observational study of the relationship between Capacity for Care as an animal shelter management model and cat health, adoption and death in three animal shelters. Vet. J. 2017, 227, 15–22. [Google Scholar] [CrossRef] [PubMed]
- Lepper, M.; Kass, P.H.; Hart, L.A. Prediction of adoption versus euthanasia among dogs and cats in a California animal shelter. J. Appl. Anim. Welf. Sci. 2002, 5, 29–42. [Google Scholar] [CrossRef] [PubMed]
- Crawford, H.; Fontaine, J.; Calver, M. Using free adoptions to reduce crowding and euthanasia at cat shelters: An Australian case study. Animals 2017, 7, 92. [Google Scholar] [CrossRef] [PubMed]
- Reeve, C.L.; Rogelberg, S.G.; Spitzmüller, C.; DiGiacomo, N. The caring-killing paradox: Euthanasia-related strain among animal-shelter workers 1. J. Appl. Soc. Psychol. 2005, 35, 119–143. [Google Scholar] [CrossRef]
- Bennett, P.; Rohlf, V. Perpetration-induced traumatic stress in persons who euthanize nonhuman animals in surgeries, animal shelters, and laboratories. Soc. Anim. 2005, 13, 201–220. [Google Scholar] [CrossRef] [PubMed]
- Korea Information Disclosure. Available online: https://www.open.go.kr (accessed on 26 November 2019).
- FICO Xpress Optimization. Available online: https://www.fico.com/fico-xpress-optimization/docs/latest/overview.html (accessed on 26 November 2019).
- Protopopova, A.; Gilmour, A.J.; Weiss, R.H.; Shen, J.Y.; Wynne, C.D.L. The effects of social training and other factors on adoption success of shelter dogs. Appl. Anim. Behav. Sci. 2012, 142, 61–68. [Google Scholar] [CrossRef]
- Balcom, S.; Arluke, A. Animal adoption as negotiated order: A comparison of open versus traditional shelter approaches. Anthrozoös 2001, 14, 135–150. [Google Scholar] [CrossRef]
- Huang, C.H.; Shen, P.Y.; Huang, Y.C. IoT-based physiological and environmental monitoring system in animal shelter. In Proceedings of the 2015 Seventh International Conference on Ubiquitous and Future Networks, Sapporo, Japan, 7–10 July 2015; pp. 317–322. [Google Scholar]
- Xu, J.; Wang, L. A feedback control method for addressing the production scheduling problem by considering energy consumption and makespan. Sustainability 2017, 9, 1185. [Google Scholar] [CrossRef]
- Yuan, P.; Han, W.; Su, X.; Liu, J.; Song, J. A dynamic scheduling method for carrier aircraft support operation under uncertain conditions based on rolling horizon strategy. Appl. Sci. 2018, 8, 1546. [Google Scholar] [CrossRef]
- Erichsen, G.; Zimmermann, T.; Kather, A. Effect of different interval lengths in a rolling horizon MILP unit commitment with non-linear control model for a small energy system. Energies 2019, 12, 1003. [Google Scholar] [CrossRef]


© 2019 by the authors. Licensee MDPI, Basel, Switzerland. This article is an open access article distributed under the terms and conditions of the Creative Commons Attribution (CC BY) license (http://creativecommons.org/licenses/by/4.0/).