Multi-Objective Optimization of Aircraft Taxiing on the Airport Surface with Consideration to Taxiing Conflicts and the Airport Environment


Abstract
:1. Introduction
- (1)
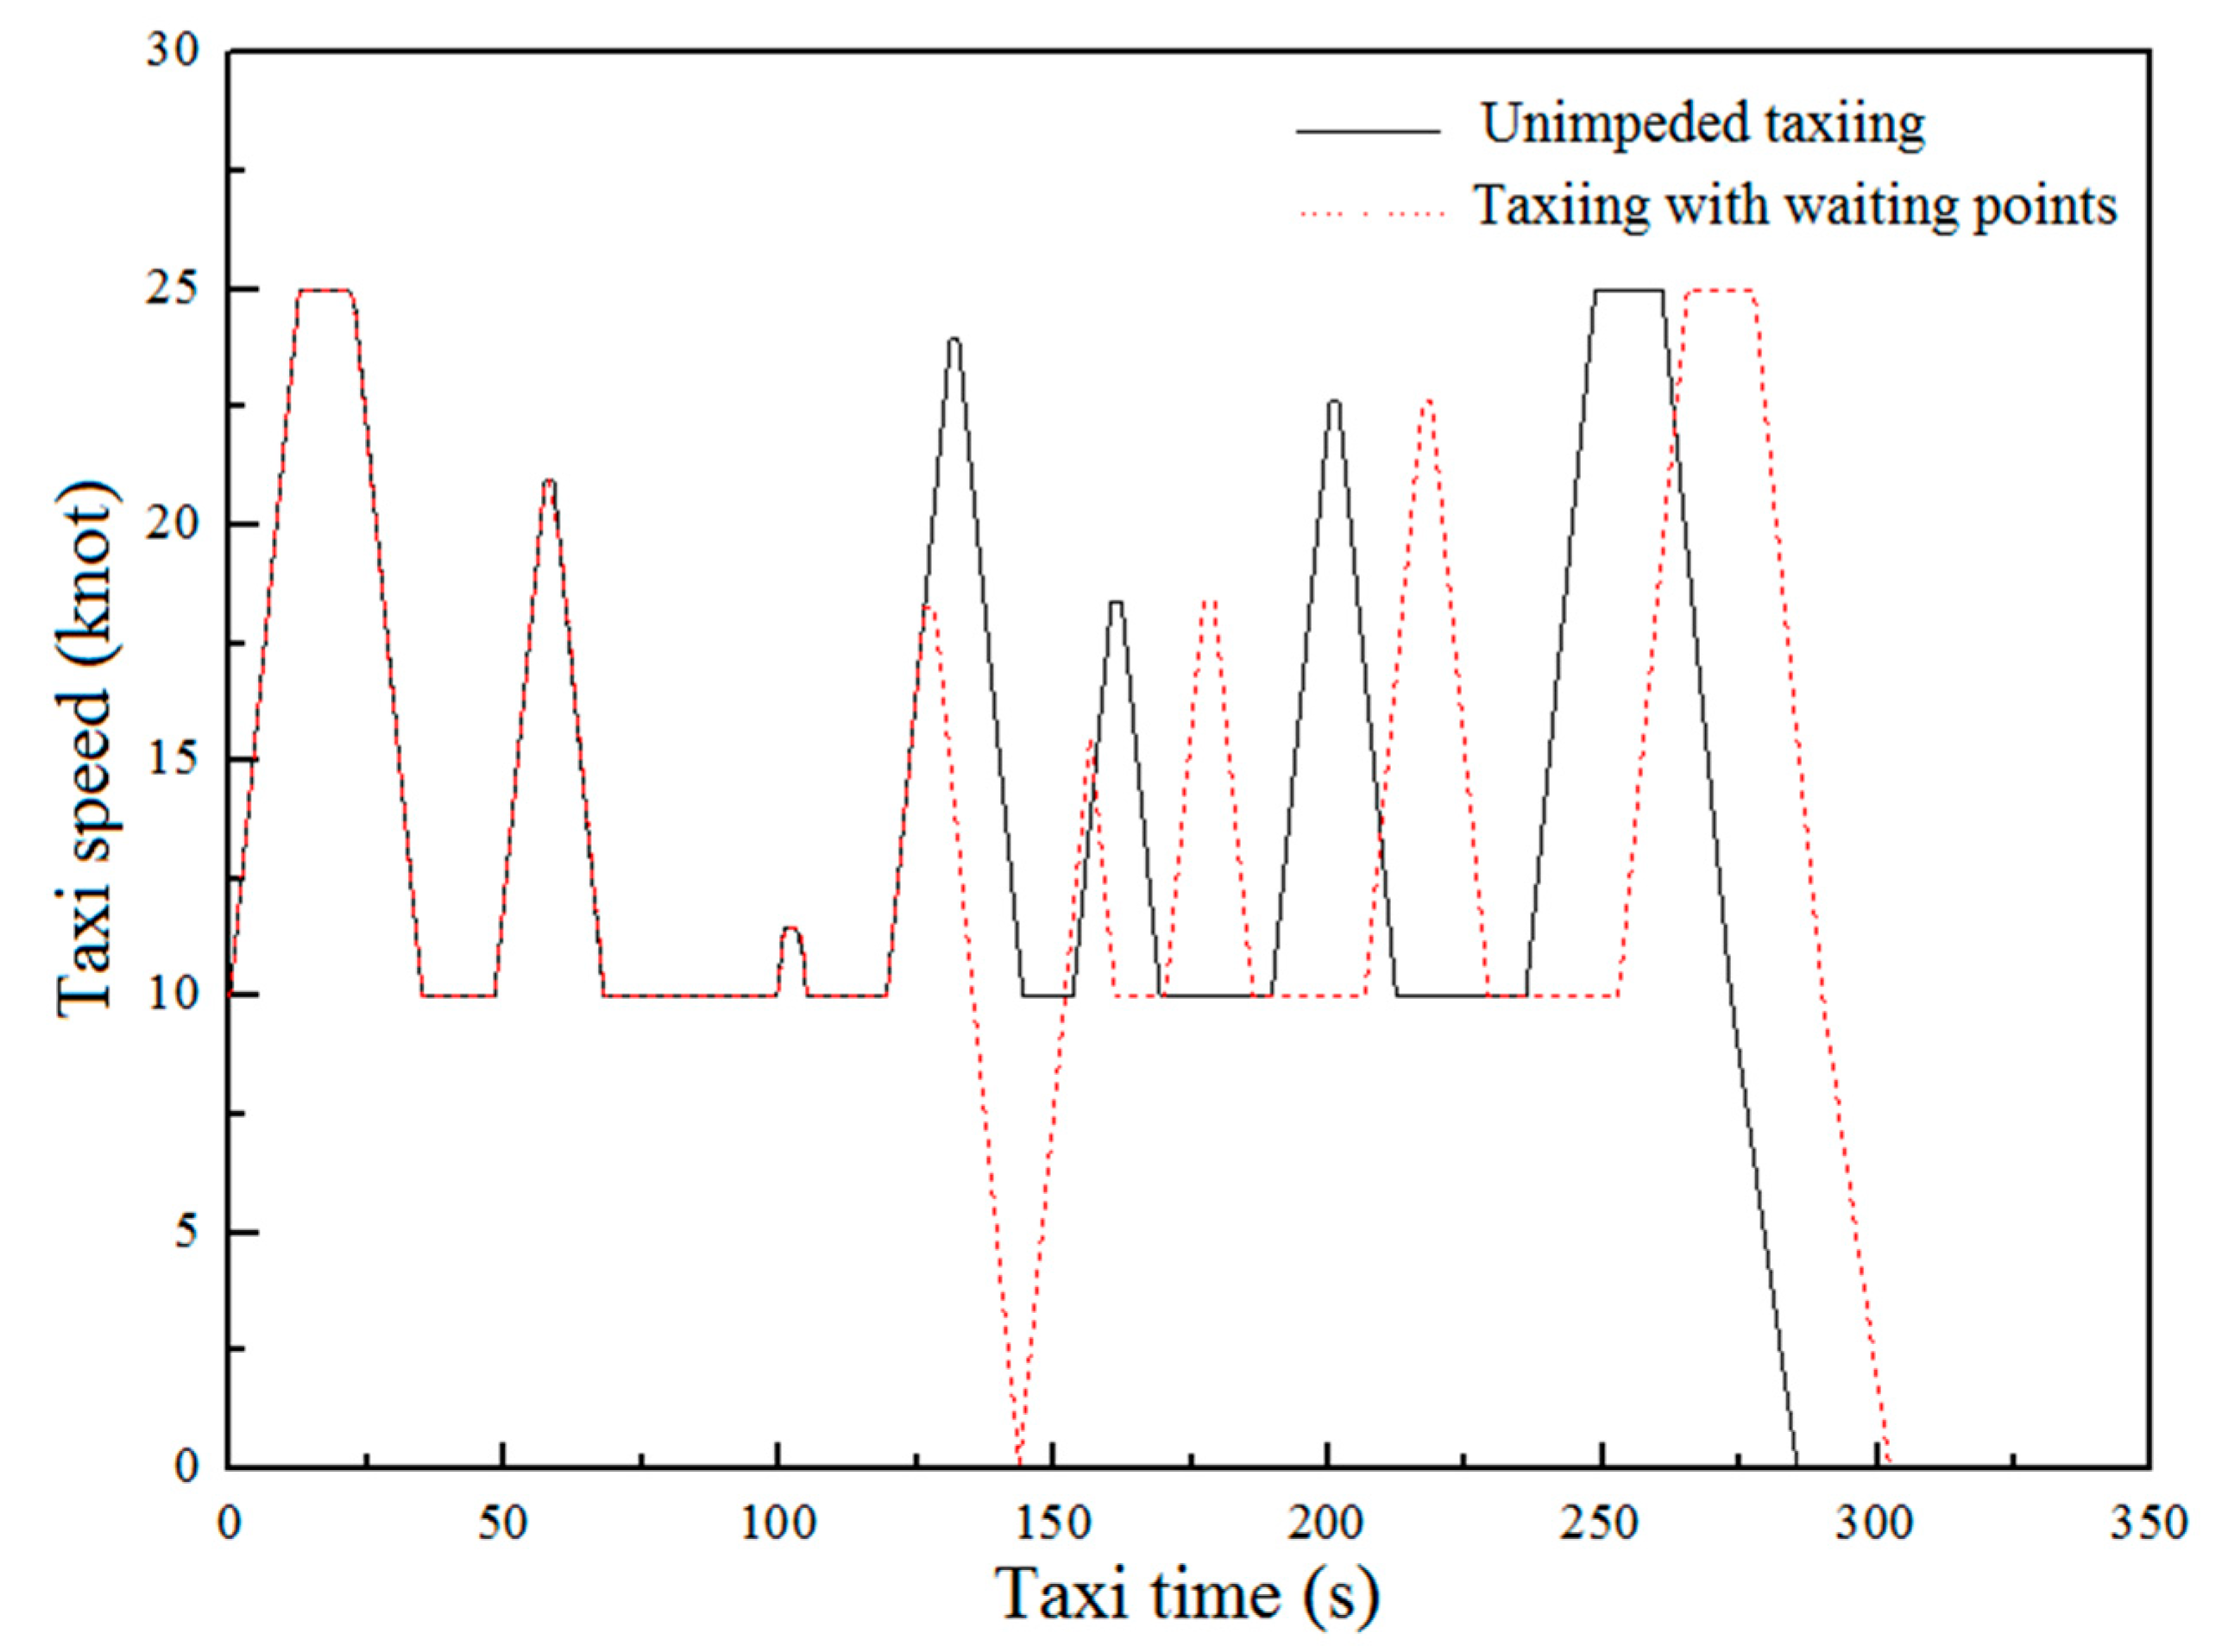
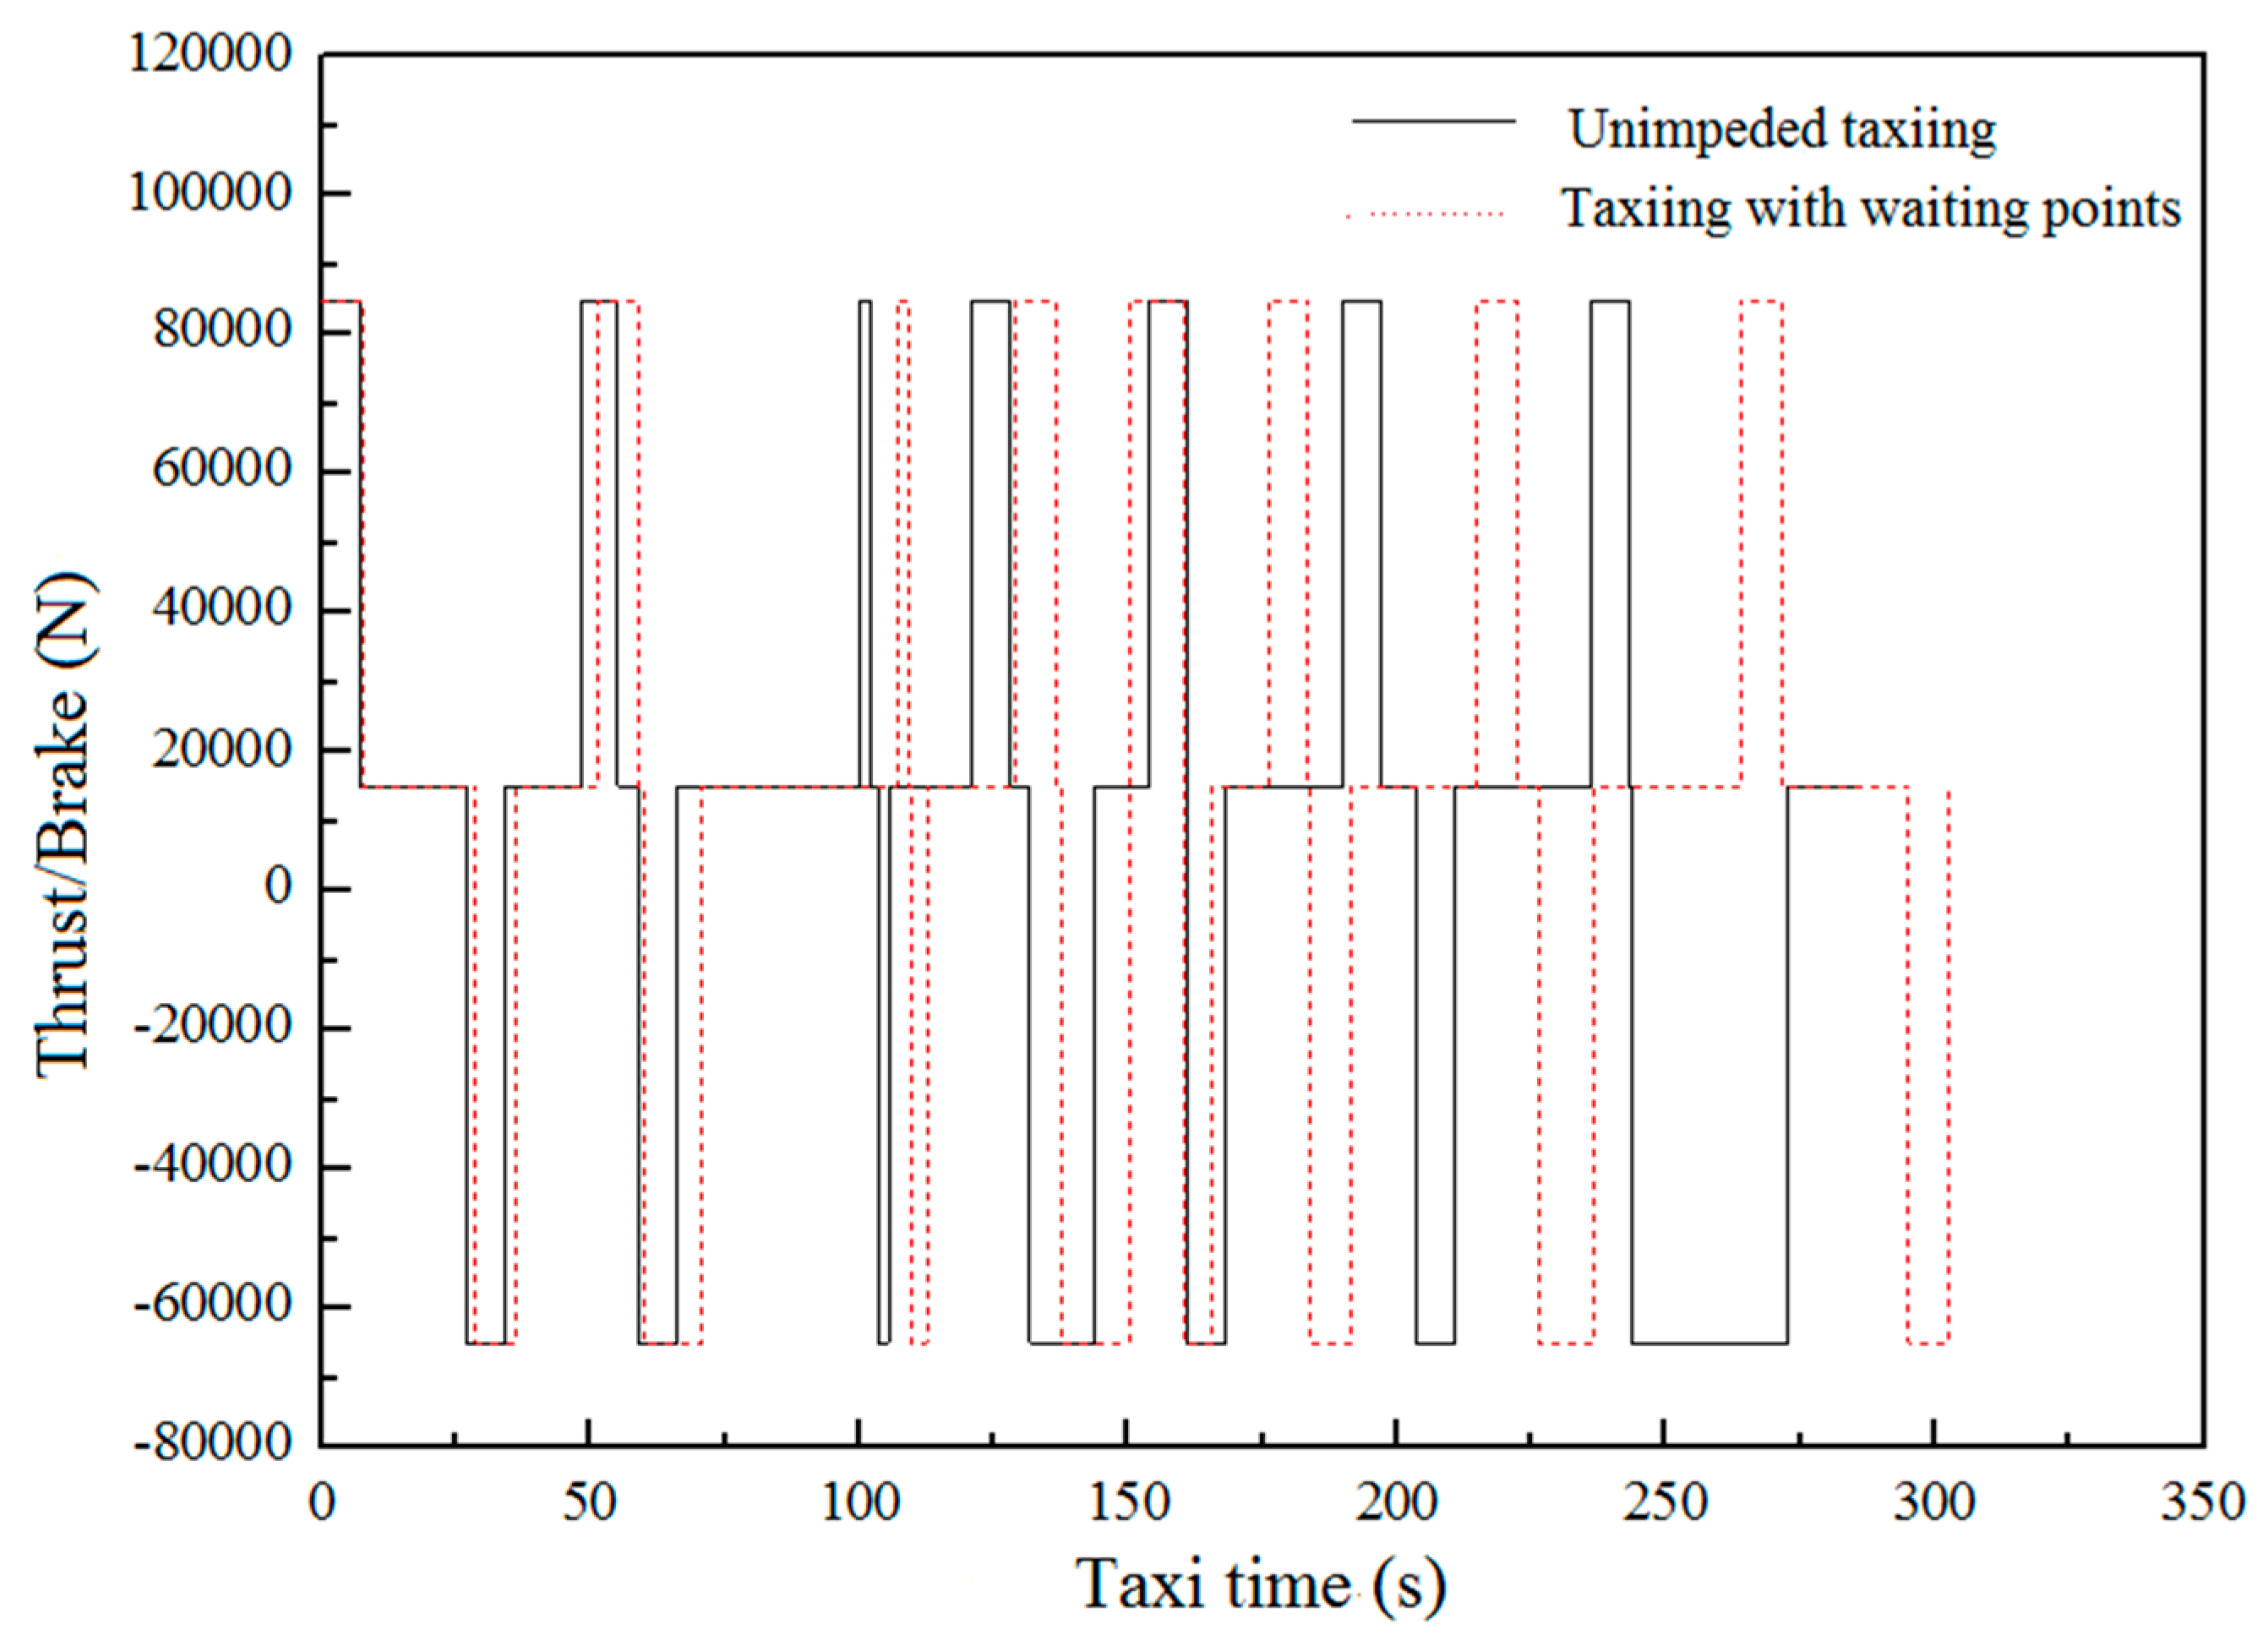
- Previous calculations of aircraft taxiway have excluded the waiting points on the taxiway from the multi-objective optimization of taxiing time and fuel emissions in order to avoid taxiing conflicts. Thus, this study improved the taxiing speed curve by including waiting points and by establishing a multi-objective optimization for aircraft taxiing. Accordingly, the calculation results are close to practical operating conditions.
- (2)
- Previous studies have rarely considered the taxiing multi-objective optimization problem under different airport environments. However, changes in air pressure and the environment at different airports affect the fuel combustion of aircraft engines. Hence, the fuel flows of different aircraft engines were modified in the present study. Moreover, a multi-objective optimization model of aircraft taxiing under different airport environments was constructed.
- (3)
- In this study, a multi-objective optimization for the taxiing time and fuel consumption of different aircraft modes was realized by acquiring their parameters and fuel consumption indexes. Through a multi-objective optimization of different aircraft models, the optimal values of the Pareto fronts were intuitively determined via a comparison of the calculation results, which provided references for the operational control of airport surfaces.
2. Literature Review
2.1. Guiding Control Method of Aircraft Taxiing on the Airport Surface
2.2. Multi-Objective Optimization Method of Taxiing Time, Fuel Consumption, and Pollutant Emission
3. Multi-Objective Optimization Model of an Aircraft Taxiway
3.1. Objective Functions
3.2. Constraints
- (1)
- The taxiing speed constraint: The maximum and minimum taxiing speeds ( and ) and the taxiing speed at the turning section () were restricted to 25, 10, and 10 knots, respectively; this restriction was applied to ensure the safe and high-efficient surface taxiing of aircraft on airport surfaces, without considering the constraints of taxiway type over taxiing speeds [14];
- (2)
- Taxiing acceleration constraint: The acceleration () was restricted to <0.1 g to ensure the comfort of passengers during the accelerated taxiing of the aircraft [38].
3.3. Modification of Fuel Consumption Coefficient
4. Taxiing Time and Fuel Consumption Models Based on the Optimized Speed Curve
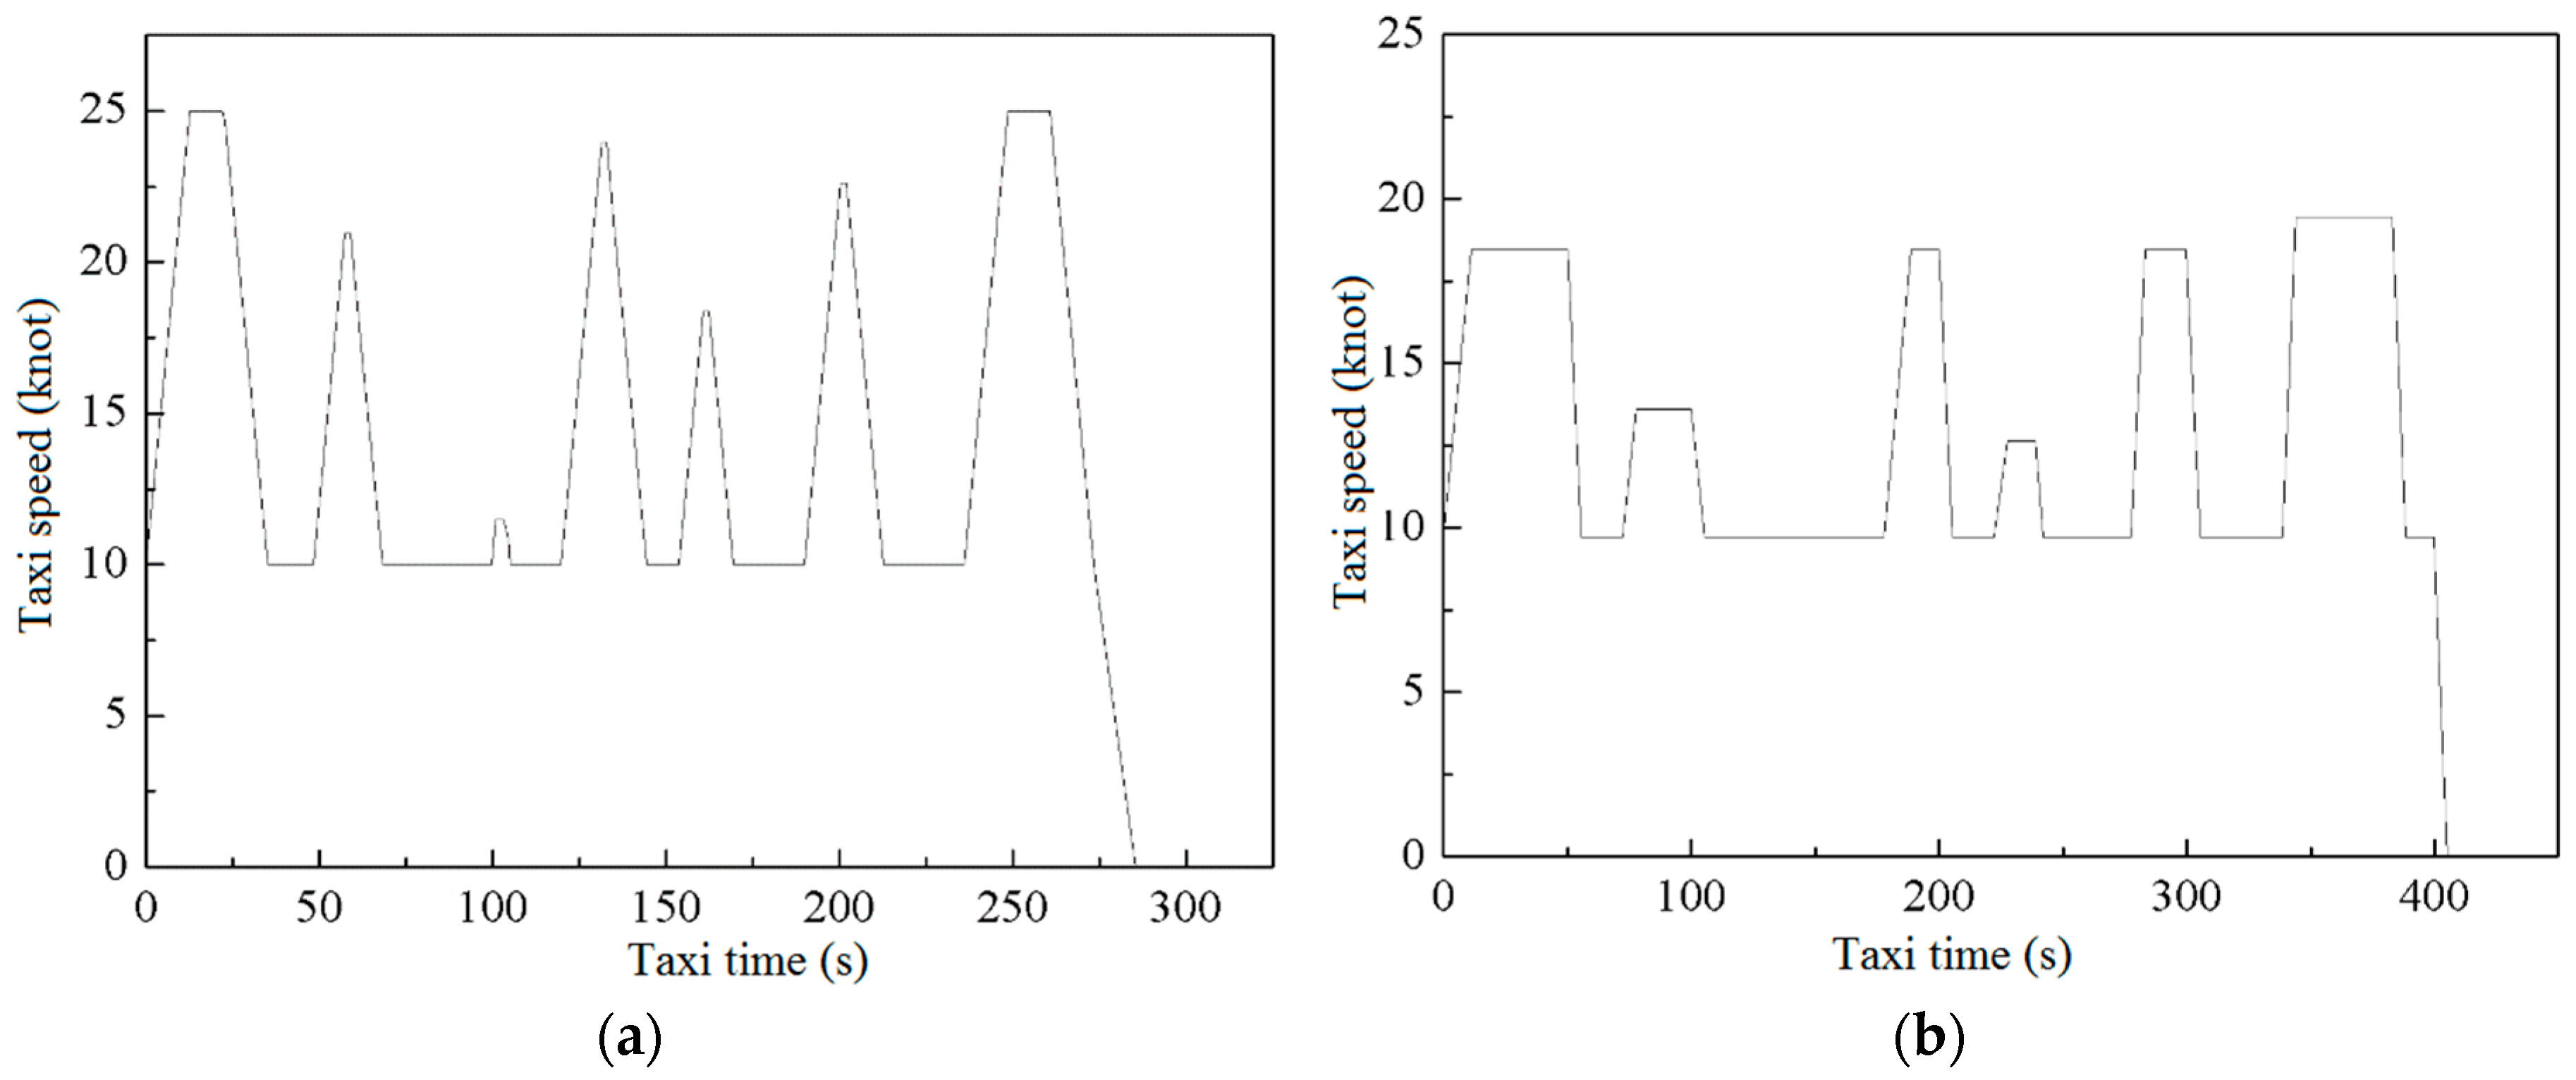
4.1. Optimized Speed Curve
4.2. Taxiing Time, Fuel Consumption, and Pollutant Emission Model
5. Design of the Solving Algorithm
5.1. Initialization of Population
5.2. Non-Dominant Ranking
5.3. Congestion Distance
5.4. Selection, Crossing, and Variation
| Algorithm 1: cyclical function of subjects |
| 1. The population size (pop) and the number of genetic iterations (GEN) are defined. The population at initialization moment t = 0 is P(0), and its dimension is (4,pop). Each column reflects one decision scheme; the first row to the fourth row are a1, d1, d2, and d4, respectively. 2. Non-dominant ranking of initialized populations. 3. Let t = 0; 4. While t < GEN An offspring population Q(t) is generated by selection, crossing, and variation in the parent population P(t) through the binary bidding method; The integrated population: R(t)←P(t) + Q(t); Non-dominant ranking of R(t) is implemented to generate the ranked population F and N individuals are selected; P (t + 1) is set as an empty set; Let I = 0 While len (P (t + 1)) + len(F[i]) < = N when the new parent population is full (the number of the new parent population reaches N) Degree of congestion is estimated; P (t + 1)←P (t + 1) + F [i] selects from low to high in the ranked population F, and the selected individuals are added into the new parent population; i←i + 1 End while i←I + 1; P (t + 1)←P (t + 1) + F [1:(N-len (P (t + 1))], the congestion distance is added into the population from large to small when the new parent population crosses the border; t←t + 1 End while |
| Algorithm 2: non-dominant ranking |
| 1. Two variables are set and initialized: the number of dominant np = 0; the dominated individual set (sp) is set as an empty set. 2. Determine the highest level of the non-dominant solution set. For p = 1:N For q = 1:N If the individual p dominates the individual q Then the individual q is added into sp Else if the individual p is dominated by the individual q Then np←np + 1 End if End for If np of the individual is 0 Then the Pareto level is p.rank = 1 End if End for 3. Leveling of other individuals. i = 0 While F[i] For q = 1:len(sp) If the number of dominants of the individual (np) is 0 Then this individual is a non-dominant individual If i = 0 Then the Pareto level is added with 2 Else the Pareto level is added with 1 End if End for i←i + 1 End while |
| Algorithm 3: estimation of degree of congestion |
| 1. Initialize the congestion distance in the population set P: P[p].distance = 0. 2. The first objective function is selected: g = 1. 3. While g < G Individuals in the population are ranked from low to high according to the objective function g; The distance between the first and the last individuals in P is set as infinite. While p > 1 && p < len (p-1) Finding the crowding distance of the p-th individual p←p + 1 End while g←g + 1 End while |
| Algorithm 4: calculation of the objective function of individuals |
| The taxi segment ld is defined. For ld = 1:N If a segment is straight, it is optimized Then a1, d1, d2 and d4 are acquired according to encoding; t1, t2, t3, t4 and v1, v2, v3, v4 are calculated. If t1, t2, t3 or t4 have negatives or imaginary values Then The objective functions for this individual are set infinite Else All objective functions are calculated according to the formula Else All objective functions are calculated according to the formula for turns End if End for |
6. Case Study
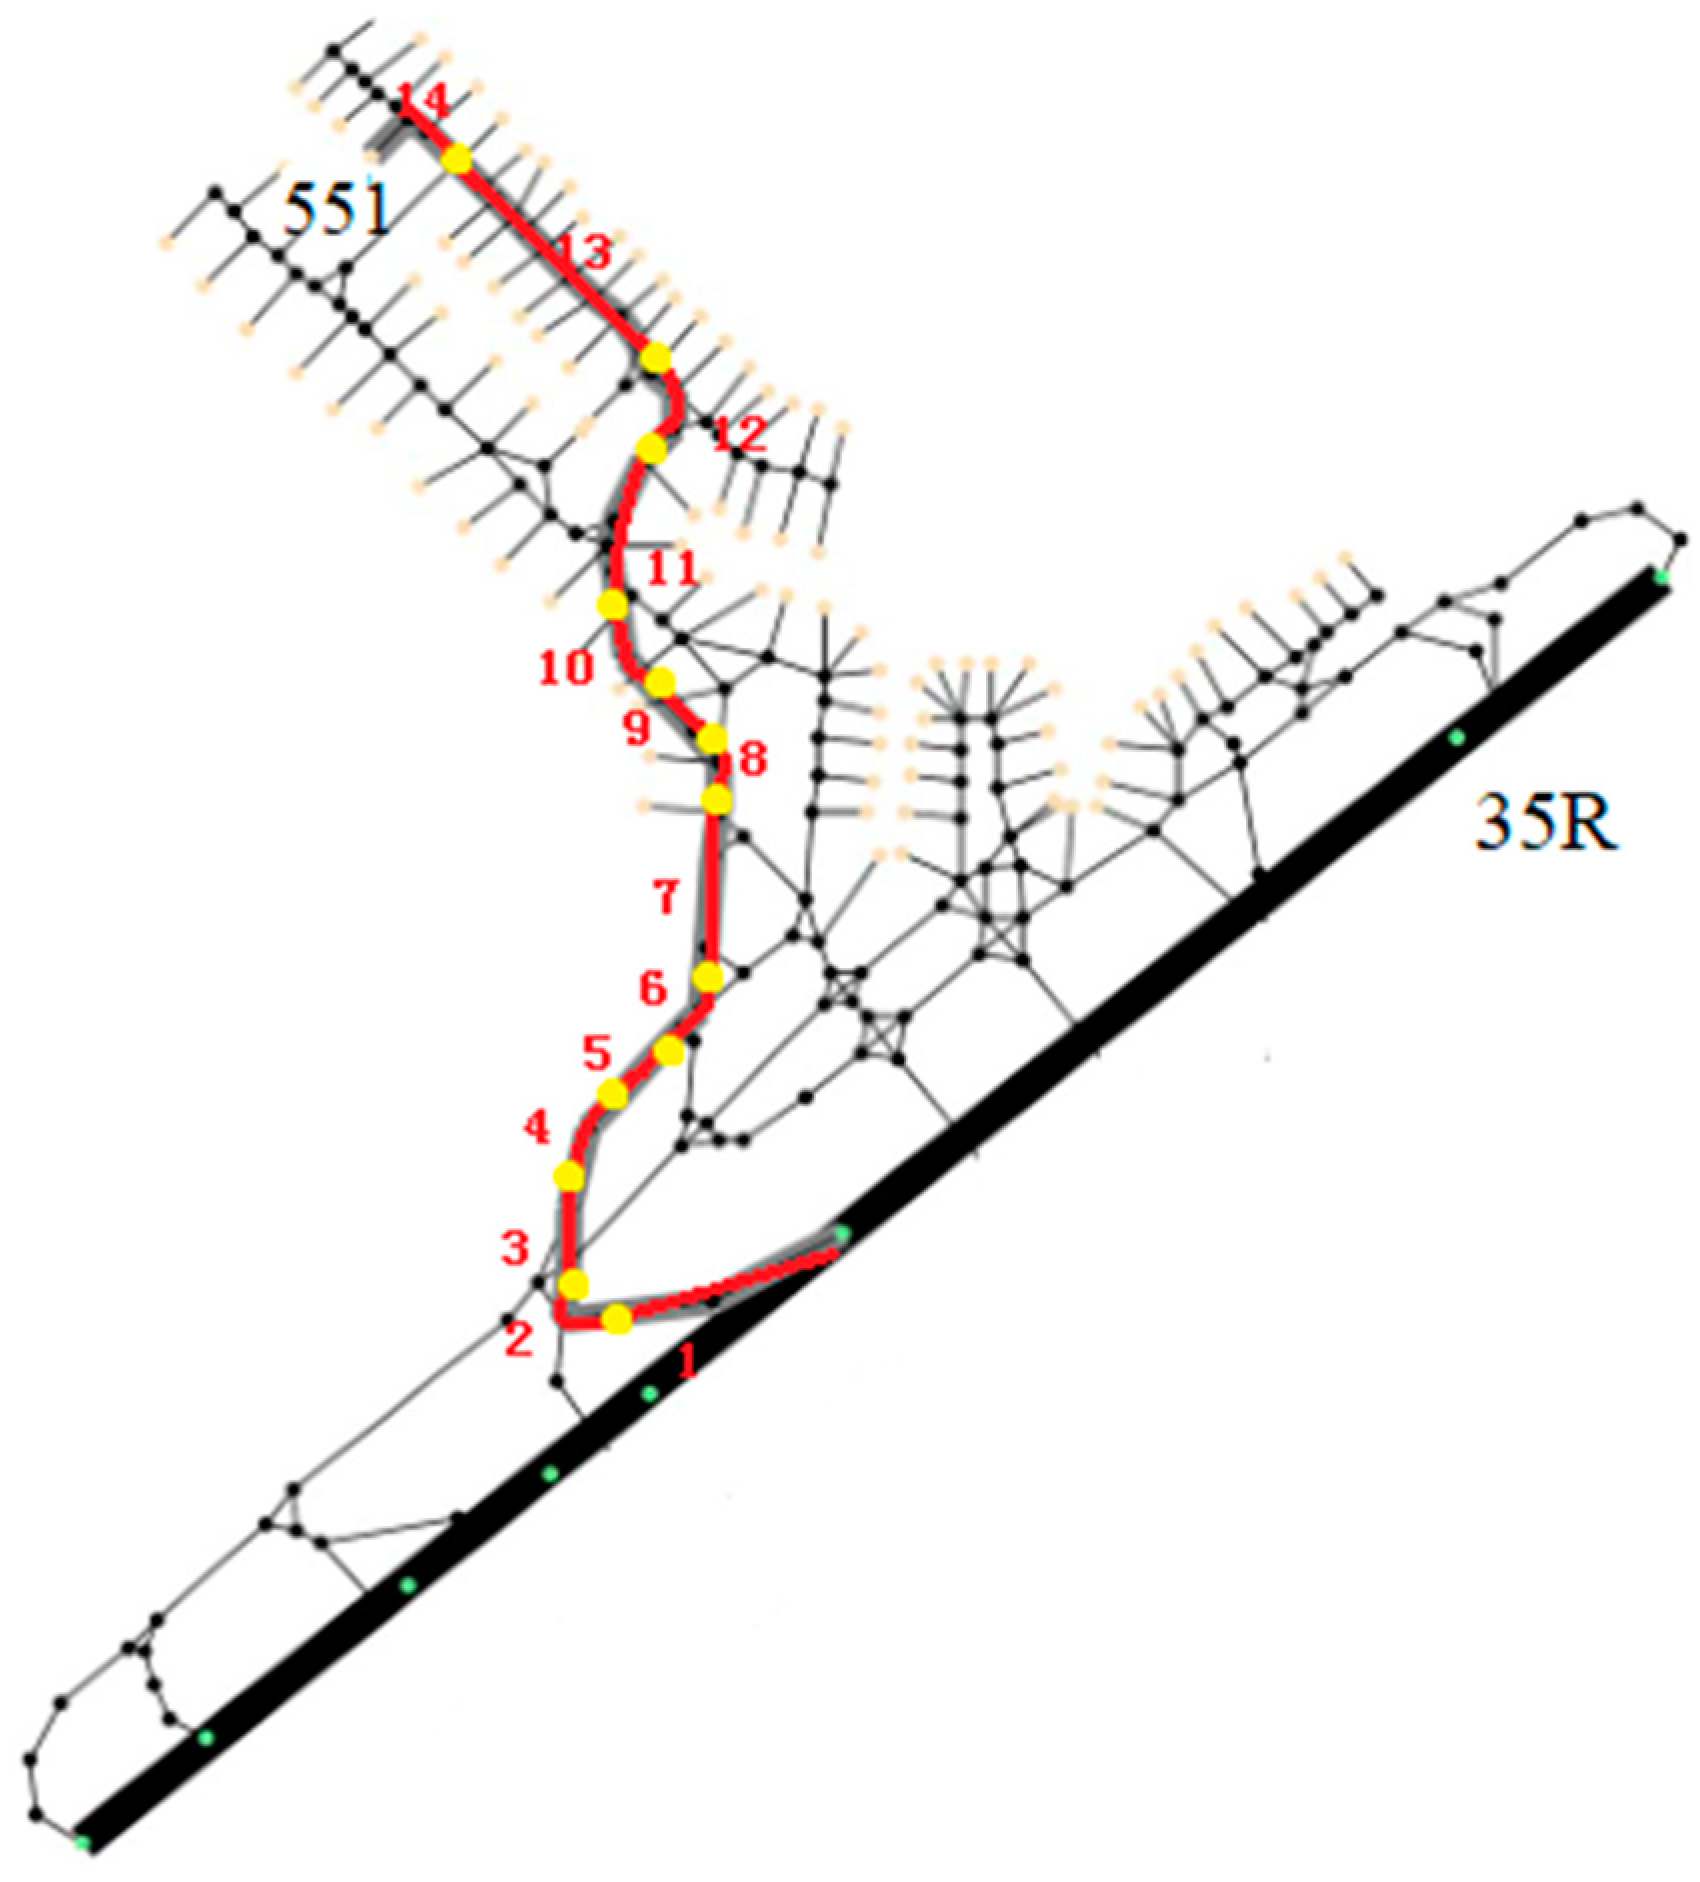
6.1. Data Source
6.1.1. Taxiway Data of the Aircraft
6.1.2. Relevant Data of Aircraft
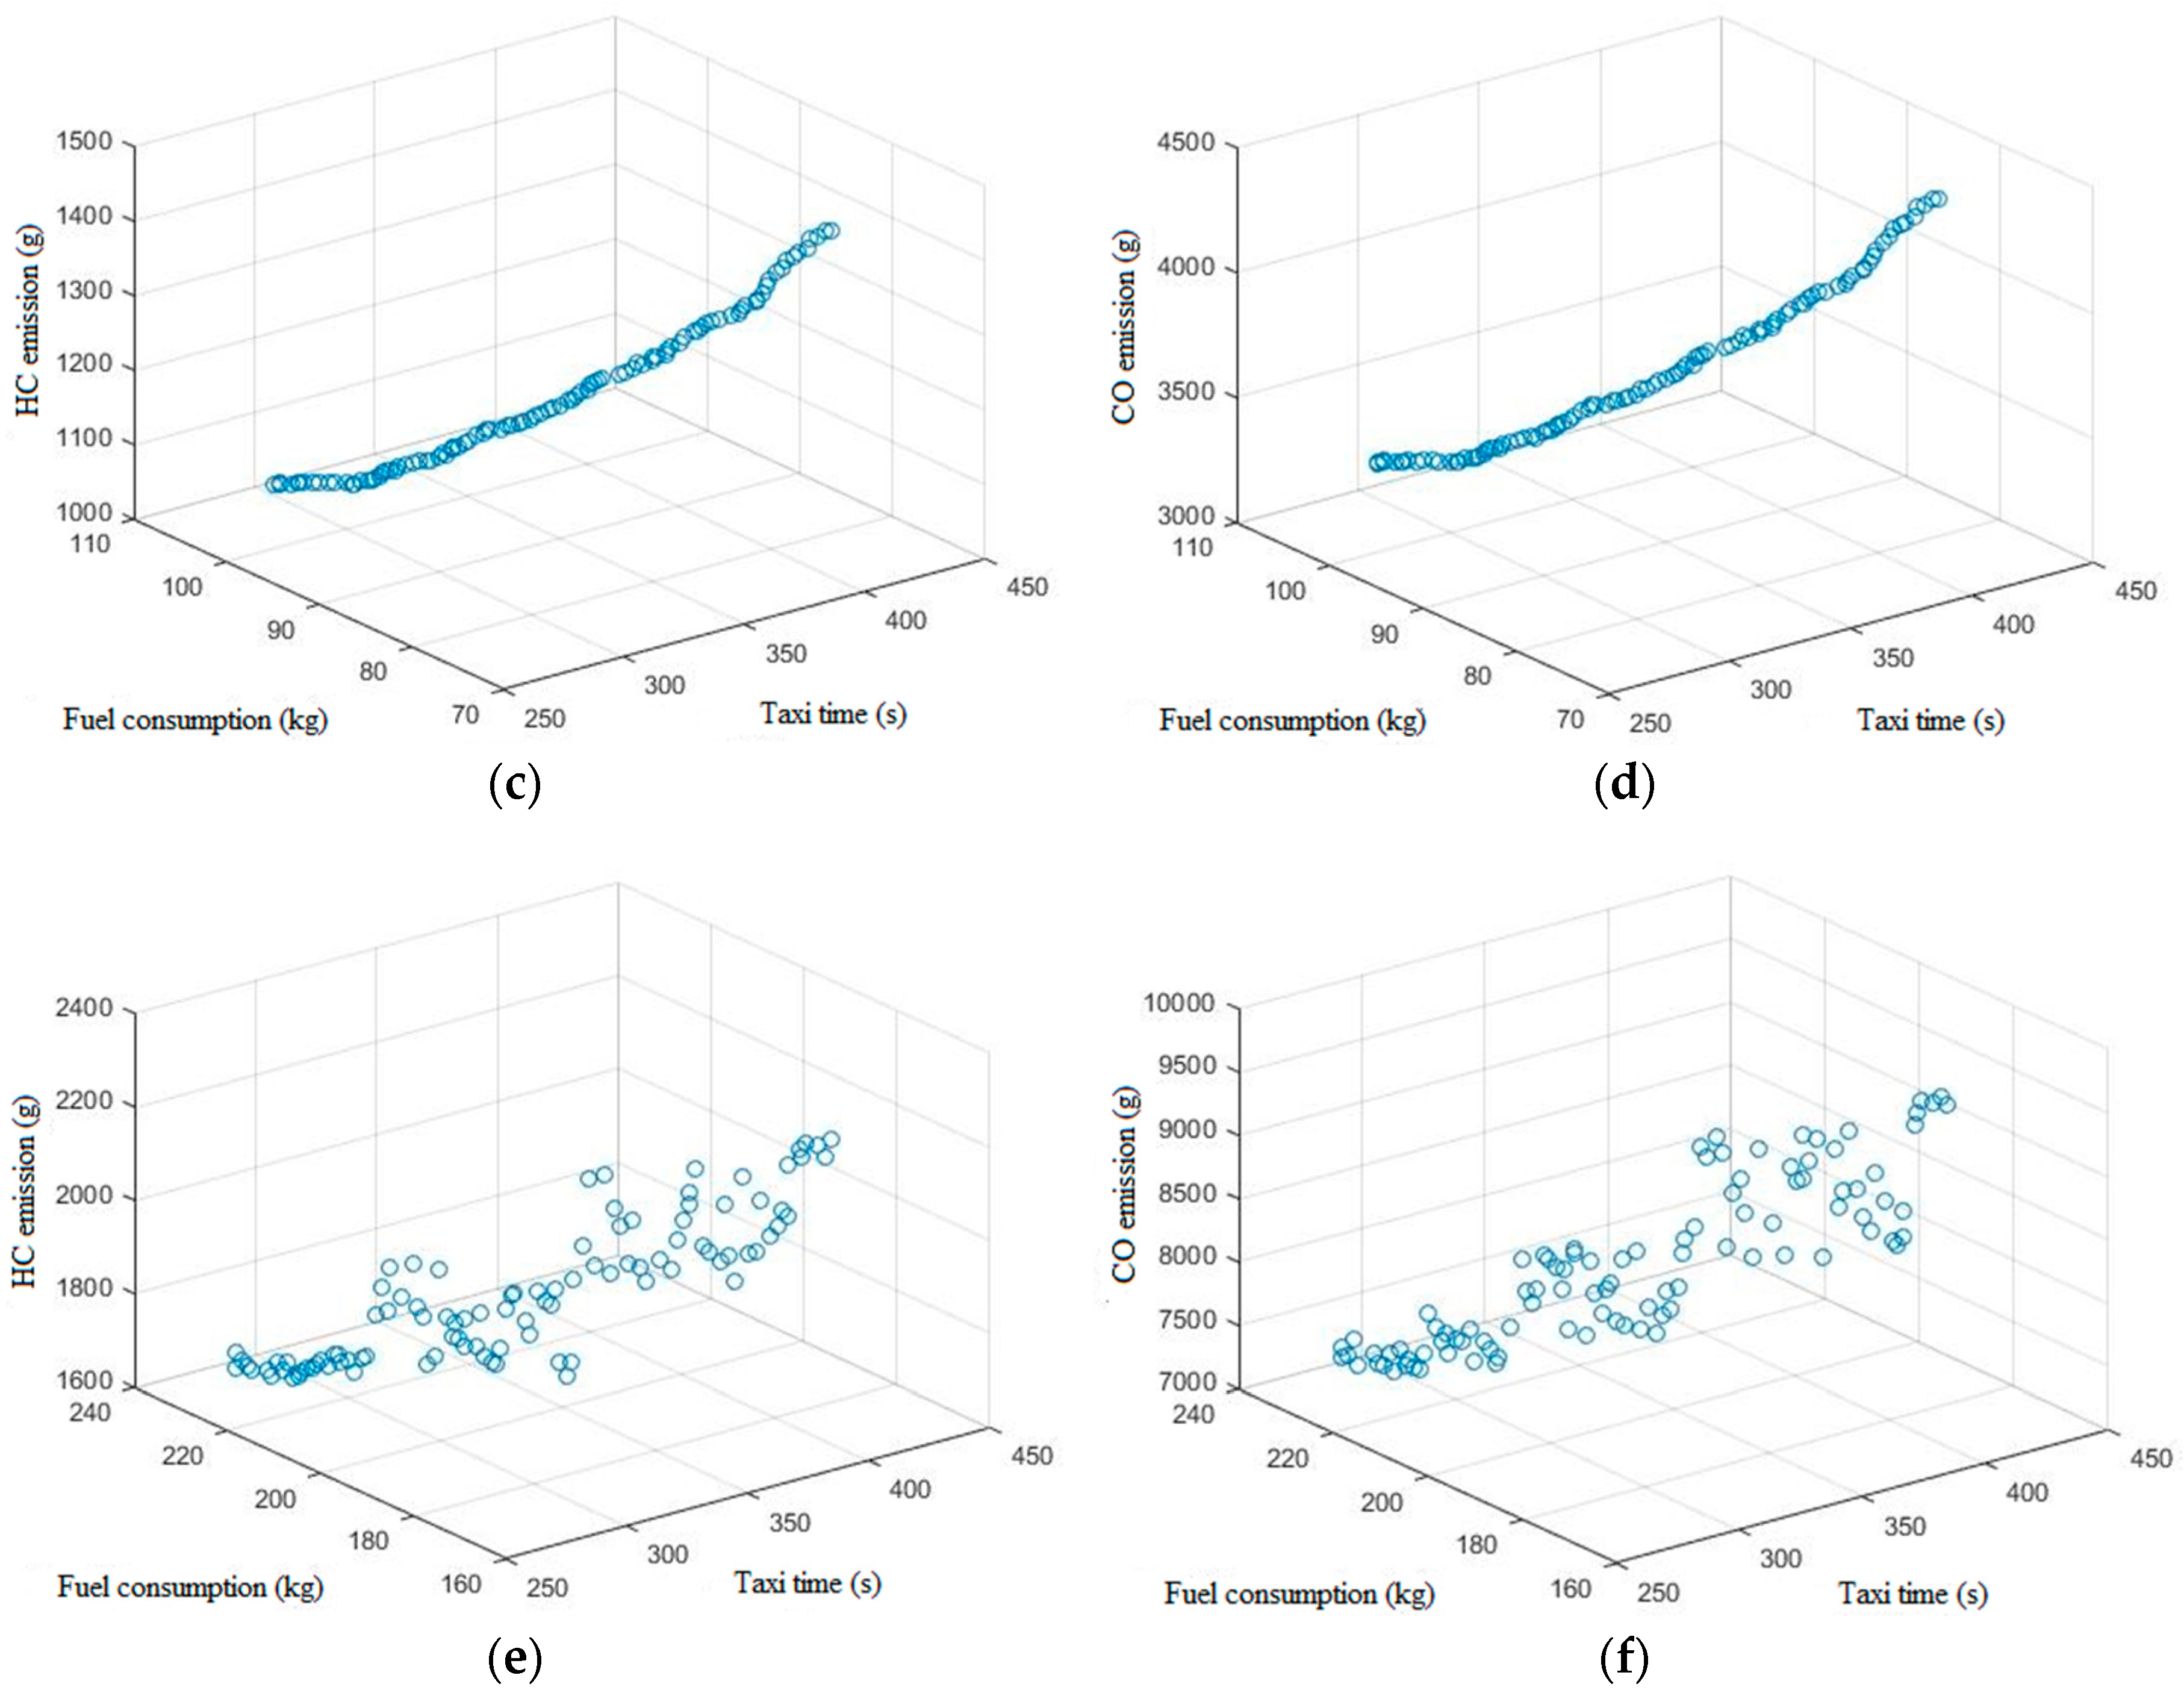
6.2. Pareto Analysis among Different Optimization Objectives
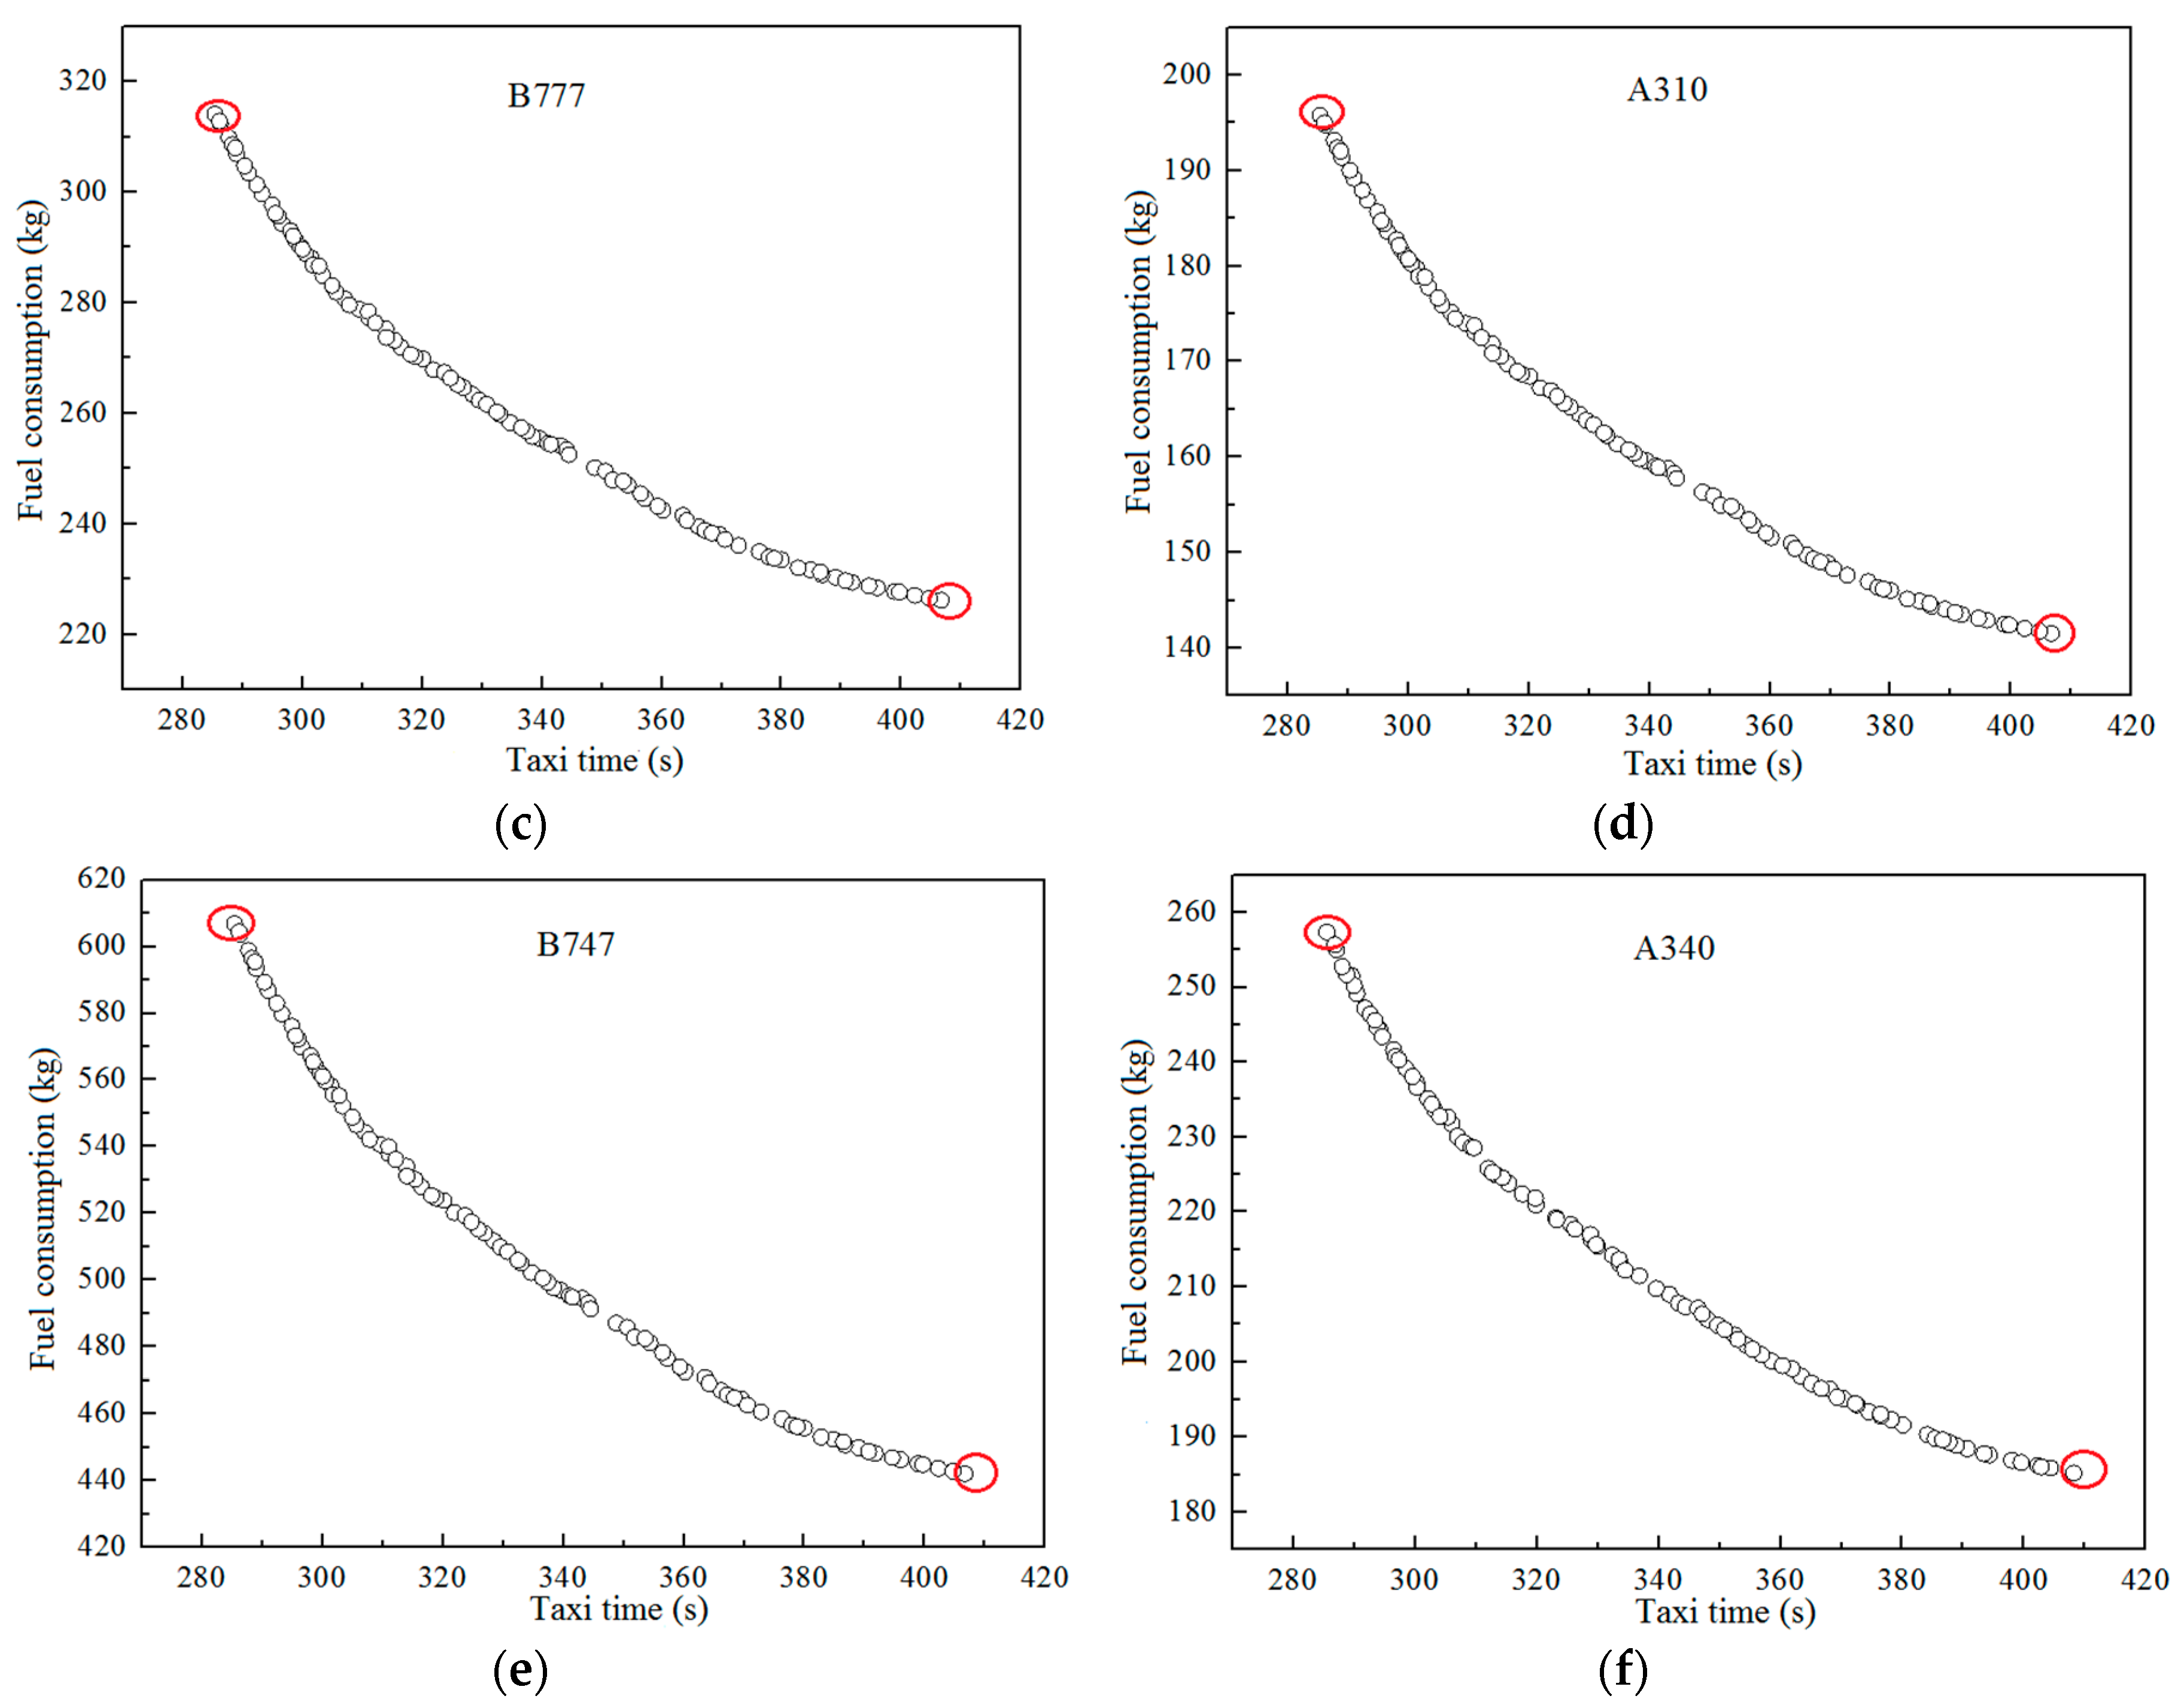
6.3. Analysis of the Taxiway Optimization Results for Different Aircraft Types
6.4. Comparison of the Optimization Results with and without Taxiing Waiting Points
6.5. Comparison of Optimization Results in Airports with Different Altitudes
7. Conclusions and Prospects
Annotations
| Variables | Meanings |
| Type of aircraft (i = 1, 2, 3, 4, which are types A, B, C, and D of the aircraft, respectively) | |
| Taxiing state (j = 1, 2, 3, 4, which represents acceleration, uniform speed, idling, and turning) | |
| Speed curve of aircraft i | |
| Set of speed curves of aircraft i | |
| Taxiway marked with l | |
| Taxiing time (s) | |
| Fuel consumption (kg) | |
| HC emissions (g) | |
| CO emissions (g) | |
| Aircraft i weight categories (light, medium-weight, and heavy aircraft) | |
| Maximum taxiing speed (knot) | |
| Minimum taxiing speed (knot) | |
| Taxiing speed at turning (knot) | |
| Taxiing acceleration (m/s−2) | |
| Fuel flow of the aircraft in taxiing state j (kg/s) | |
| Fuel flow on seal level of aircraft in taxiing state j (kg/s) | |
| Ratio between the environmental pressure on the airport surface and the sea-level pressure under international standard atmospheric (ISA) conditions | |
| Ratio between the environmental temperature on the airport’s surface and at sea-level Temperature of the international standard atmosphere | |
| Environmental temperature of the airport’s surface () | |
| Environmental pressure of the airport’s surface (hPa) | |
| Emission index of pollutant k of the aircraft at the taxiing state j | |
| Emission indexof sea-level pollutant type of the aircraft under taxiing state j under ISA conditions | |
| Taxiing speed of aircraft on the airport’s surface (knot) | |
| Taxiing time under taxiing state j (s) | |
| Taxiing section s | |
| Taxiing time in taxiing section s (s) | |
| Thrust level (%) | |
| Fuel consumption for taxiing in section s (kg) | |
| Pollutant emission indices from taxiing in section s (g) |
Author Contributions
Funding
Conflicts of Interest
Appendix A

| Aircraft Models | Fuel Consumption and Pollutant Emissions | Turning | Idling | Uniform Speed | Acceleration |
|---|---|---|---|---|---|
| 35A | FUEL (kg/s) | 0.024 | 0.0184 | 0.0203 | 0.0277 |
| HC (g/kg fuel) | 20.04 | 22.0983 | 21.4122 | 20.0871 | |
| CO (g/kg fuel) | 58.6 | 63.3243 | 61.7496 | 55.4504 | |
| NOX (g/kg fuel) | 2.82 | 2.4183 | 2.5522 | 3.0878 | |
| A320 | FUEL (kg/s) | 0.1011 | 0.0763 | 0.0846 | 0.1176 |
| HC (g/kg fuel) | 1.4000 | 1.5304 | 1.4870 | 1.4030 | |
| CO (g/kg fuel) | 17.6 | 19.5696 | 18.913 | 16.287 | |
| NOX (g/kg fuel) | 4 | 3.4783 | 3.6522 | 4.3478 | |
| A333 | FUEL (kg/s) | 0.228 | 0.1633 | 0.1849 | 0.2711 |
| HC (g/kg fuel) | 9.37 | 10.5739 | 10.1726 | 9.3976 | |
| CO (g/kg fuel) | 42.67 | 48.0257 | 46.2404 | 39.0996 | |
| NOX (g/kg fuel) | 4.53 | 3.8283 | 4.0622 | 4.9978 |
| Type | Model | Engine Type | Number of Engines |
|---|---|---|---|
| Narrow aircraft | B738 | CFM56-7B26 | 2 |
| A320 | CFM56-5A1 | 2 | |
| Wide aircraft | B777 | Trent892 | 2 |
| A320 | CF6-80C2A2 | 2 | |
| Ultra-wide aircraft | B747 | RB211-524D4 | 4 |
| A340 | CFM56-5C4 | 4 |
| Model | Fuel Flows (kg/s) | |||
|---|---|---|---|---|
| Turning | Idling | Uniform Speed | Acceleration | |
| B738 | 0.113 | 0.0837 | 0.0934 | 0.1326 |
| A320 | 0.1011 | 0.0763 | 0.0846 | 0.1176 |
| B777 | 0.3 | 0.2087 | 0.239 | 0.361 |
| A320 | 0.189 | 0.138 | 0.155 | 0.233 |
| B747 | 0.3 | 0.2426 | 0.2617 | 0.3383 |
| A340 | 0.124 | 0.0898 | 0.1012 | 0.1468 |
References
- EUROCONTROL. Challenges of Growth 2013—Task 4: European Air Traffic in 2035. 2013. Available online: http://www.eurocontrol.int/sites/default/files/article/content/documents/official-documents/reports/201306-challenges-of-growth-2013-task-4.pdf (accessed on 2 November 2019).
- European Commission. Roadmap to a Single European Transport Area: Towards a Competitive and Resource Efficient Transport System. White Paper. 2011. Available online: http://ec.europa.eu/transport/themes/ strategies/2011_white_paper_en.htm (accessed on 2 November 2019).
- Atkin, J.A.D.; Burke, E.K.; Ravizza, S. The airport ground movement problem: Past & current research and future directions. In Proceedings of the International Conference on Research in Air Transportation, Budapest, Hungary, 1–4 June 2010; pp. 131–138. [Google Scholar]
- Bennell, J.A.; Mesgarpour, M.; Potts, C.N. Airport runway scheduling. Ann. Oper. Res. 2013, 204, 249–270. [Google Scholar] [CrossRef]
- Sölveling, G.; Clarke, J.-P. Scheduling of airport runway operations using stochastic branch and bound methods. Transp. Res. C Emerg. Tech. 2014, 45, 119–137. [Google Scholar] [CrossRef]
- Dell’Orco, M.; Marinelli, M.; Altieri, M.G. Solving the gate assignment problem through the fuzzy bee colony optimization. Transp. Res. C Emerg. Tech. 2017, 80, 424–438. [Google Scholar] [CrossRef]
- Chen, J.; Weiszer, M. Toward a more realistic, cost-effective and greener ground movement through active routing: A multi objective shortest path approach. Part I: Optimal speed profile generation. IEEE Trans. Intell. Transp. Syst. 2016, 17, 1196–1209. [Google Scholar] [CrossRef]
- Honeywell. Electric Green Taxiing System. 2013. Available online: www.greentaxiing.com/resources/EGTS_Positioning_paper.pdf (accessed on 2 November 2019).
- Adler, N.; Martini, G.; Volta, N. Measuring the environmental efficiency of the global aviation fleet. Transp. Res. B Meth. 2013, 53, 82–100. [Google Scholar] [CrossRef]
- Joint Planning and Development Office. Concept of Operations for the Next Generation Air Transportation System; Version 3.2; Joint Planning and Development Office: Washington, DC, USA, 2010. Available online: http://jpe.jpdo.gov/ee/docs/conops/NextGen_ConOps;_v3_2.pdf (accessed on 2 November 2019).
- SESAR. European ATM Master Plan; SESAR: Brussels, Belgium, 2012; Available online: https://www.atmmasterplan.eu/download/29 (accessed on 2 November 2019).
- European Commission. Flightpath 2050, Europe’s Vision for Aviation. Report of the High Level Group on Aviation Research, Directorate-General for Research and Innovation, Directorate General for Mobility and Transport; European Commission: Luxemburg, 2011; Available online: https://www.acare4europe.org/sites/acare4europe.org/files/ document/ flightpath2050_final.pdf (accessed on 2 November 2019).
- Hao, L.; Ryerson, M.S.; Kang, L.; Hansen, M. Estimating fuel burn impacts of taxi-out delay with implications for gate-hold benefits. Transp. Res. C Emerg. Tech. 2017, 80, 454–466. [Google Scholar] [CrossRef]
- International Civil Aviation Organization. Advanced Surface Movement Guidance and Control Systems (A-SMGCS) Manual; ICAO: Montreal, QC, Canada, 2004; Available online: http://www.icao.int/Meetings/anconf12/Document%20Archive/9830_cons_en[1].pdf (accessed on 2 November 2019).
- Clare, G.L.; Richard, A.G. Optimisation of taxiway routing and runway scheduling. IEEE Trans. Intell. Transp. Syst. 2011, 12, 1000–1013. [Google Scholar] [CrossRef]
- Chen, J.; Stewart, P. Planning aircraft taxiing trajectories via a multiobjective immune optimisation. In Proceedings of the Seventh International Conference on Natural Computation, Shanghai, China, 26–28 July 2011; pp. 2235–2240. [Google Scholar]
- Lesire, C. An iterative algorithm for planning of airport ground movement. In Proceedings of the 19th European Conference on Artificial Intelligence, Lisbon, Portugal, 16–20 August 2010; pp. 413–418. [Google Scholar]
- Atkin, J.A.D.; Burke, E.K.; Ravizza, S. A more realistic approach for airport ground movement optimisation with stand holding. In Proceedings of the 5th Multidisciplinary International Scheduling Conference, Phoenix, AZ, USA, 9–12 August 2011; pp. 1–15. [Google Scholar]
- Ravizza, S.; Atkin, J.A.D.; Burke, E.K. A more realistic approach for airport ground movement optimisation with stand holding. J. Sched. 2014, 17, 507–520. [Google Scholar] [CrossRef]
- Bakowski, D.L.; Hooey, B.L.; Foyle, D.C.; Wolter, C.A.; Cheng, L.W.S. NextGen surface trajectory-based operations: Contingency-hold clearances. In Proceedings of the IEEE/AIAA Digital Avionics Systems Conference, East Syracuse, NY, USA, 5–10 October 2013; pp. 1B6-1–1B6-11. [Google Scholar]
- Cheng, V.H.L.; Sweriduk, G.D. Trajectory design for aircraft taxi automation to benefit trajectory-based operations. In Proceedings of the 2009 7th Asian Control Conference, Hong Kong, China, 27–29 August 2009; pp. 99–104. [Google Scholar]
- Haus, S.; Sendobry, A.; Urvoy, C.; Klingauf, U. Control theoretic concept for intuitive guidance of pilots during taxiing. In Proceedings of the IEEE/AIAA 30th Digital Avionics Systems Conference, Seattle, WA, USA, 16–20 October 2011; pp. 6B3-6–6B3-14. [Google Scholar]
- Turgut, E.T.; Cavcar, M.; Usanmaz, O.; Yay, O.D.; Dogeroglu, T.; Armutlu, K. Investigating actual landing and takeoff operations for time-in-mode, fuel and emissions parameters on domestic routes in Turkey. Transp. Res. D Transp. Environ. 2017, 53, 249–262. [Google Scholar] [CrossRef]
- Khoo, H.L.; Teoh, L.E. A bi-objective dynamic programming approach for airline green fleet planning. Transp. Res. D Transp. Environ. 2014, 33, 166–185. [Google Scholar] [CrossRef]
- Zhou, W.; Wang, T.; Yu, Y.; Chen, D.; Zhu, B. Scenario analysis of CO2 emissions from China’s civil aviation industry through 2030. Appl. Energy 2016, 175, 100–108. [Google Scholar] [CrossRef]
- Smeltink, J.; Soomer, M. An optimisation model for airport taxi scheduling. In Proceedings of the INFORMS Annual Meeting, Denver, CO, USA, 24–27 October 2004. [Google Scholar]
- Herrero, J.G.; Berlanga, A. Methods for operations planning in airport decision support systems. Appl. Intell. 2005, 22, 183–206. [Google Scholar] [CrossRef]
- Balakrishnan, H.; Jung, Y.C. A framework for coordinated surface operations planning at Dallas-Fort Worth International Airport. In Proceedings of the AIAA Guidance, Navigation, and Control Conference, Hilton Head, SC, USA, 20–23 August 2007. [Google Scholar]
- Roling, P.C.; Visser, H.G. Optimal airport surface traffic planning using mixed-integer linear programming. Int. J. Aerospace Eng. 2008, 1, 1–11. [Google Scholar] [CrossRef]
- Koeners, G.J.M.; Stout, E.P.; Rademaker, R.M. Improving taxi traffic flow by real-time runway sequence optimization using dynamic taxi route planning. In Proceedings of the 2011 IEEE/AIAA 30th Digital Avionics Systems Conference, Seattle, WA, USA, 16–20 October 2011. [Google Scholar]
- Ravizza, S.; Chen, J. The trade-off between taxi time and fuel consumption in airport ground movement. In Proceedings of the Advanced Systems for Public Transport, Santiago, Chile, 23–27 July 2012. [Google Scholar]
- Lee, H.; Balakrishnan, H. Optimization of airport taxiway operations at Detroit Metropolitan Airport (DTW). In Proceedings of the 10th AIAA Aviation Technology, Integration, and Operations (ATIO) Conference, Fort Worth, TX, USA, 13–15 September 2010. [Google Scholar]
- Weiszer, M.; Chen, J. A heuristic approach to greener airport ground movement. In Proceedings of the IEEE Congress on Evolutionary Computation, Beijing, China, 6–11 July 2014. [Google Scholar]
- Chen, J.; Weiszer, M.; Stewart, P. Optimal speed profile generation for airport ground movement with consideration of emissions. In Proceedings of the 2015 IEEE 18th International Conference on Intelligent Transportation Systems—(ITSC 2015), Las Palmas, Spain, 15–18 September 2015. [Google Scholar]
- Brownlee, A.E.I.; Weiszer, M.; Chen, J.; Ravizza, S.; Woodward, J.R.; Burke, E.K. A fuzzy approach to addressing uncertainty in Airport Ground Movement optimization. Transp. Res. C Emerg. 2018, 92, 150–175. [Google Scholar] [CrossRef]
- Booth, D.; Flynn, B.; Sultana, J. Airport Collaborative Decision Making (A-CDM) Implementation Manual. Version 5.0. 31 March 2017. Available online: https://www.eurocontrol.int/publication/airport-collaborative- decision-making-cdm-implementation-manual (accessed on 2 November 2019).
- International Civil Aviation Organization. Aircraft Engine Emissions; Annex-16-Vol-2-3rd-Edition; International Civil Aviation Organization: Montreal, QC, Canada, 2008; Available online: www.icao.int/environmental-protection/technology-stand ards_FR.aspx (accessed on 2 November 2019).
- Bakowski, D.L.; Foyle, D.C.; Hooey, B.L.; Kunkle, C.L.; Jordan, K.P. NextGen flight deck Surface Trajectory-Based Operations (STBO): Speed-based taxi clearances. In Proceedings of the Twelfth International Symposium on Aviation Psychology, Dayton, OH, USA, 2–5 May 2011; pp. 44–49. [Google Scholar]
- DuBois, D.; Paynter, G. Fuel flow method 2 for Estimating Aircraft Emissions; SAE Technical Paper 2006-01-1987. J. Aerospace 2006, 115, 1–14. [Google Scholar]
- Nikoleris, T.; Gupta, G.; Kistler, M. Detailed estimation of fuel consumption and emissions during aircraft taxi operations at Dallas/Fort Worth International Airport. Transp. Res. D Transp. Environ. 2011, 16, 302–308. [Google Scholar] [CrossRef]
- Alirezaei, M.; Niaki, S.T.A.; Niaki, A.A. A bi-objective hybrid optimization algorithm to reduce noise and data dimension in diabetes diagnosis using support vector machines. Expert Syst. Appl. 2019, 127, 47–57. [Google Scholar] [CrossRef]


| A-SMGCS | Variables | Optimization |
|---|---|---|
| 1st generation | assigned routes and time slots | conventional taxiing |
| 2nd generation | speed profiles, time slots, assigned routes | high-precision taxiing |
| 3rd generation | potential routs, speed profiles, 4D trajectory generation, assigned routes, and speed profiles | cost-effective and environmentally friendly taxiing |
| Number of Sections | Type of Sections | |||
|---|---|---|---|---|
| 1 | Straight | 10 | 10 | 429 |
| 2 | Turn | 10 | 10 | 82 |
| 3 | Straight | 10 | 10 | 199 |
| 4 | Turn | 10 | 10 | 197 |
| 5 | Straight | 10 | 10 | 38 |
| 6 | Turn | 10 | 10 | 90 |
| 7 | Straight | 10 | 10 | 270 |
| 8 | Turn | 10 | 10 | 57 |
| 9 | Straight | 10 | 10 | 146 |
| 10 | Turn | 10 | 10 | 127 |
| 11 | Straight | 10 | 10 | 237 |
| 12 | Turn | 10 | 10 | 147 |
| 13 | Straight | 10 | 10 | 464 |
| 14 | Straight stopping | 10 | 0 | 76 |
| Weight Type | Light | Medium-Weighted | Heavy |
|---|---|---|---|
| Representative aircraft | Learjet35A | A320 | A333 |
| Maximum take-off weight | 8300 kg | 78,000 kg | 230,000 kg |
| Engine type | TFE731–2–2B | CMF56–5–A1 | CF6–80E1A2 |
| Number of engines | 2 | 2 | 2 |
| Fuel flow under a 7% thrust level (kg/s) | 0.024 | 0.101 | 0.228 |
| Fuel flow under a 30% thrust level (kg/s) | 0.067 | 0.291 | 0.724 |
| EI of HC under a 7% thrust level (g/kg) | 20.04 | 1.4 | 9.37 |
| EI of HC under a 30% thrust level (g/kg) | 4.26 | 0.4 | 0.14 |
| EI of CO under a 7% thrust level (g/kg) | 58.6 | 17.6 | 42.67 |
| EI of CO under a 30% thrust level (g/kg) | 22.38 | 2.5 | 1.61 |
| EI of NOx under a 7% thrust level (g/kg) | 2.82 | 4 | 4.53 |
| EI of NOx under a 30% thrust level (g/kg) | 5.9 | 8 | 9.91 |
| Taxiing Time | Fuel Consumption | EI of HC | EI of CO | |
|---|---|---|---|---|
| Taxiing time | 1 | −0.8768 | 0.994 | 0.9893 |
| Fuel consumption | 1 | −0.9146 | −0.8216 | |
| EI of HC | 1 | 0.9786 | ||
| EI of CO | 1 |
| Taxiing Time | Fuel Consumption | EI of HC | EI of CO | |
|---|---|---|---|---|
| Taxiing time | 1 | −0.8753 | 0.9951 | 0.9826 |
| Fuel consumption | 1 | −0.9014 | −0.9368 | |
| EI of HC | 1 | 0.9875 | ||
| EI of CO | 1 |
| Taxiing Time | Fuel Consumption | EI of HC | EI of CO | |
|---|---|---|---|---|
| Taxiing time | 1 | −0.819 | 0.8542 | 0.8974 |
| Fuel consumption | 1 | −0.9316 | −0.9417 | |
| EI of HC | 1 | 0.9907 | ||
| EI of CO | 1 |
| Taxiing Time (s) | Fuel Consumption (kg) | |||||
|---|---|---|---|---|---|---|
| B738 | A320 | B777 | A310 | B747 | A340 | |
| 285 | 116.70 | 103.93 | 314.05 | 195.77 | 606.75 | 257.34 |
| 407 | 84.44 | 75.04 | 226.21 | 141.51 | 442.12 | 185.22 |
| Section Number | Section Type | |||
|---|---|---|---|---|
| 1 | Straight | 10 | 10 | 429 |
| 2 | Turn | 10 | 10 | 82 |
| 3 | Straight | 10 | 10 | 199 |
| 4 | Turn | 10 | 10 | 197 |
| 5 | Straight | 10 | 10 | 38 |
| 6 | Turn | 10 | 10 | 90 |
| 7 | Straight | 10 | 0 | 170 |
| 8 | Straight | 0 | 10 | 100 |
| 9 | Turn | 10 | 10 | 57 |
| 10 | Straight | 10 | 10 | 146 |
| 11 | Turn | 10 | 10 | 127 |
| 12 | Straight | 10 | 10 | 237 |
| 13 | Turn | 10 | 10 | 147 |
| 14 | Straight | 10 | 10 | 464 |
| 15 | Straight stopping | 10 | 0 | 76 |
| Aircraft Model | Taxiing Schemes | Unimpeded Taxiing | Taxiing with Waiting Points | ||
|---|---|---|---|---|---|
| Taxiing Time (s) | Fuel Consumption (kg) | Taxiing Time (s) | Fuel Consumption (kg) | ||
| B738 | Shortest taxiing time | 285 | 116.70 | 302 | 120.84 |
| Least fuel consumption | 407 | 84.44 | 422 | 88.86 | |
| A320 | Shortest taxiing time | 285 | 103.93 | 302 | 107.59 |
| Least fuel consumption | 407 | 75.04 | 422 | 79.24 | |
| B777 | Shortest taxiing time | 285 | 314.05 | 302 | 325.30 |
| Least fuel consumption | 407 | 226.21 | 422 | 238.25 | |
| A310 | Shortest taxiing time | 285 | 195.77 | 302 | 202.72 |
| Least fuel consumption | 407 | 141.51 | 422 | 148.95 | |
| B747 | Shortest taxiing time | 285 | 606.75 | 302 | 627.84 |
| Least fuel consumption | 407 | 442.12 | 422 | 464.69 | |
| A340 | Shortest taxiing time | 285 | 257.34 | 302 | 266.49 |
| Least fuel consumption | 407 | 185.22 | 422 | 195.70 | |
| Airports | Altitude (m) | Local Atmospheric Pressure (kPa) | |
|---|---|---|---|
| ZULS | 3570 | 65.91 | 9 |
| ZPPP | 2104 | 77.41 | 14 |
| ZSPD | 3.8 | 101.64 | 15.5 |
| Aircraft | Fuel Flow | Airport | ||
|---|---|---|---|---|
| ZULS | ZPPP | ZSPD | ||
| B738 | Turning | 0.160 | 0.146 | 0.113 |
| Idling | 0.119 | 0.108 | 0.084 | |
| Uniform speed | 0.133 | 0.120 | 0.093 | |
| Acceleration | 0.188 | 0.171 | 0.133 | |
| A320 | Turning | 0.144 | 0.130 | 0.101 |
| Idling | 0.108 | 0.098 | 0.076 | |
| Uniform speed | 0.120 | 0.109 | 0.085 | |
| Acceleration | 0.167 | 0.152 | 0.118 | |
| B777 | Turning | 0.426 | 0.387 | 0.300 |
| Idling | 0.296 | 0.269 | 0.209 | |
| Uniform speed | 0.339 | 0.308 | 0.239 | |
| Acceleration | 0.513 | 0.465 | 0.361 | |
| A310 | Turning | 0.268 | 0.244 | 0.189 |
| Idling | 0.196 | 0.178 | 0.138 | |
| Uniform speed | 0.220 | 0.200 | 0.155 | |
| Acceleration | 0.331 | 0.300 | 0.233 | |
| B747 | Turning | 0.426 | 0.387 | 0.300 |
| Idling | 0.344 | 0.313 | 0.243 | |
| Uniform speed | 0.372 | 0.337 | 0.262 | |
| Acceleration | 0.480 | 0.436 | 0.338 | |
| A340 | Turning | 0.176 | 0.160 | 0.124 |
| Idling | 0.128 | 0.116 | 0.090 | |
| Uniform speed | 0.144 | 0.130 | 0.101 | |
| Acceleration | 0.208 | 0.189 | 0.147 | |
| Aircraft | Taxiing Scheme | Fuel Consumption | ||
|---|---|---|---|---|
| ZULS | ZPPP | ZSPD | ||
| B738 | Most time-saving | 165.36 | 150.63 | 116.89 |
| Most fuel-saving | 119.52 | 109.03 | 84.46 | |
| A320 | Most time-saving | 147.79 | 134.00 | 104.07 |
| Most fuel-saving | 107.16 | 97.02 | 75.48 | |
| B777 | Most time-saving | 446.12 | 404.80 | 314.05 |
| Most fuel-saving | 321.30 | 291.65 | 226.21 | |
| A310 | Most time-saving | 284.55 | 258.43 | 200.47 |
| Most fuel-saving | 203.23 | 185.43 | 143.77 | |
| B747 | Most time-saving | 861.22 | 782.33 | 606.47 |
| Most fuel-saving | 627.64 | 570.15 | 441.98 | |
| A340 | Most time-saving | 364.92 | 331.66 | 257.53 |
| Most fuel-saving | 263.70 | 239.69 | 186.00 | |
© 2019 by the authors. Licensee MDPI, Basel, Switzerland. This article is an open access article distributed under the terms and conditions of the Creative Commons Attribution (CC BY) license (http://creativecommons.org/licenses/by/4.0/).
Share and Cite
Zhang, M.; Huang, Q.; Liu, S.; Li, H. Multi-Objective Optimization of Aircraft Taxiing on the Airport Surface with Consideration to Taxiing Conflicts and the Airport Environment. Sustainability 2019, 11, 6728. https://doi.org/10.3390/su11236728
Zhang M, Huang Q, Liu S, Li H. Multi-Objective Optimization of Aircraft Taxiing on the Airport Surface with Consideration to Taxiing Conflicts and the Airport Environment. Sustainability. 2019; 11(23):6728. https://doi.org/10.3390/su11236728
Chicago/Turabian StyleZhang, Ming, Qianwen Huang, Sihan Liu, and Huiying Li. 2019. "Multi-Objective Optimization of Aircraft Taxiing on the Airport Surface with Consideration to Taxiing Conflicts and the Airport Environment" Sustainability 11, no. 23: 6728. https://doi.org/10.3390/su11236728