Carbon Sequestration Total Factor Productivity Growth and Decomposition: A Case of the Yangtze River Economic Belt of China


Abstract
:1. Introduction
2. Methodology
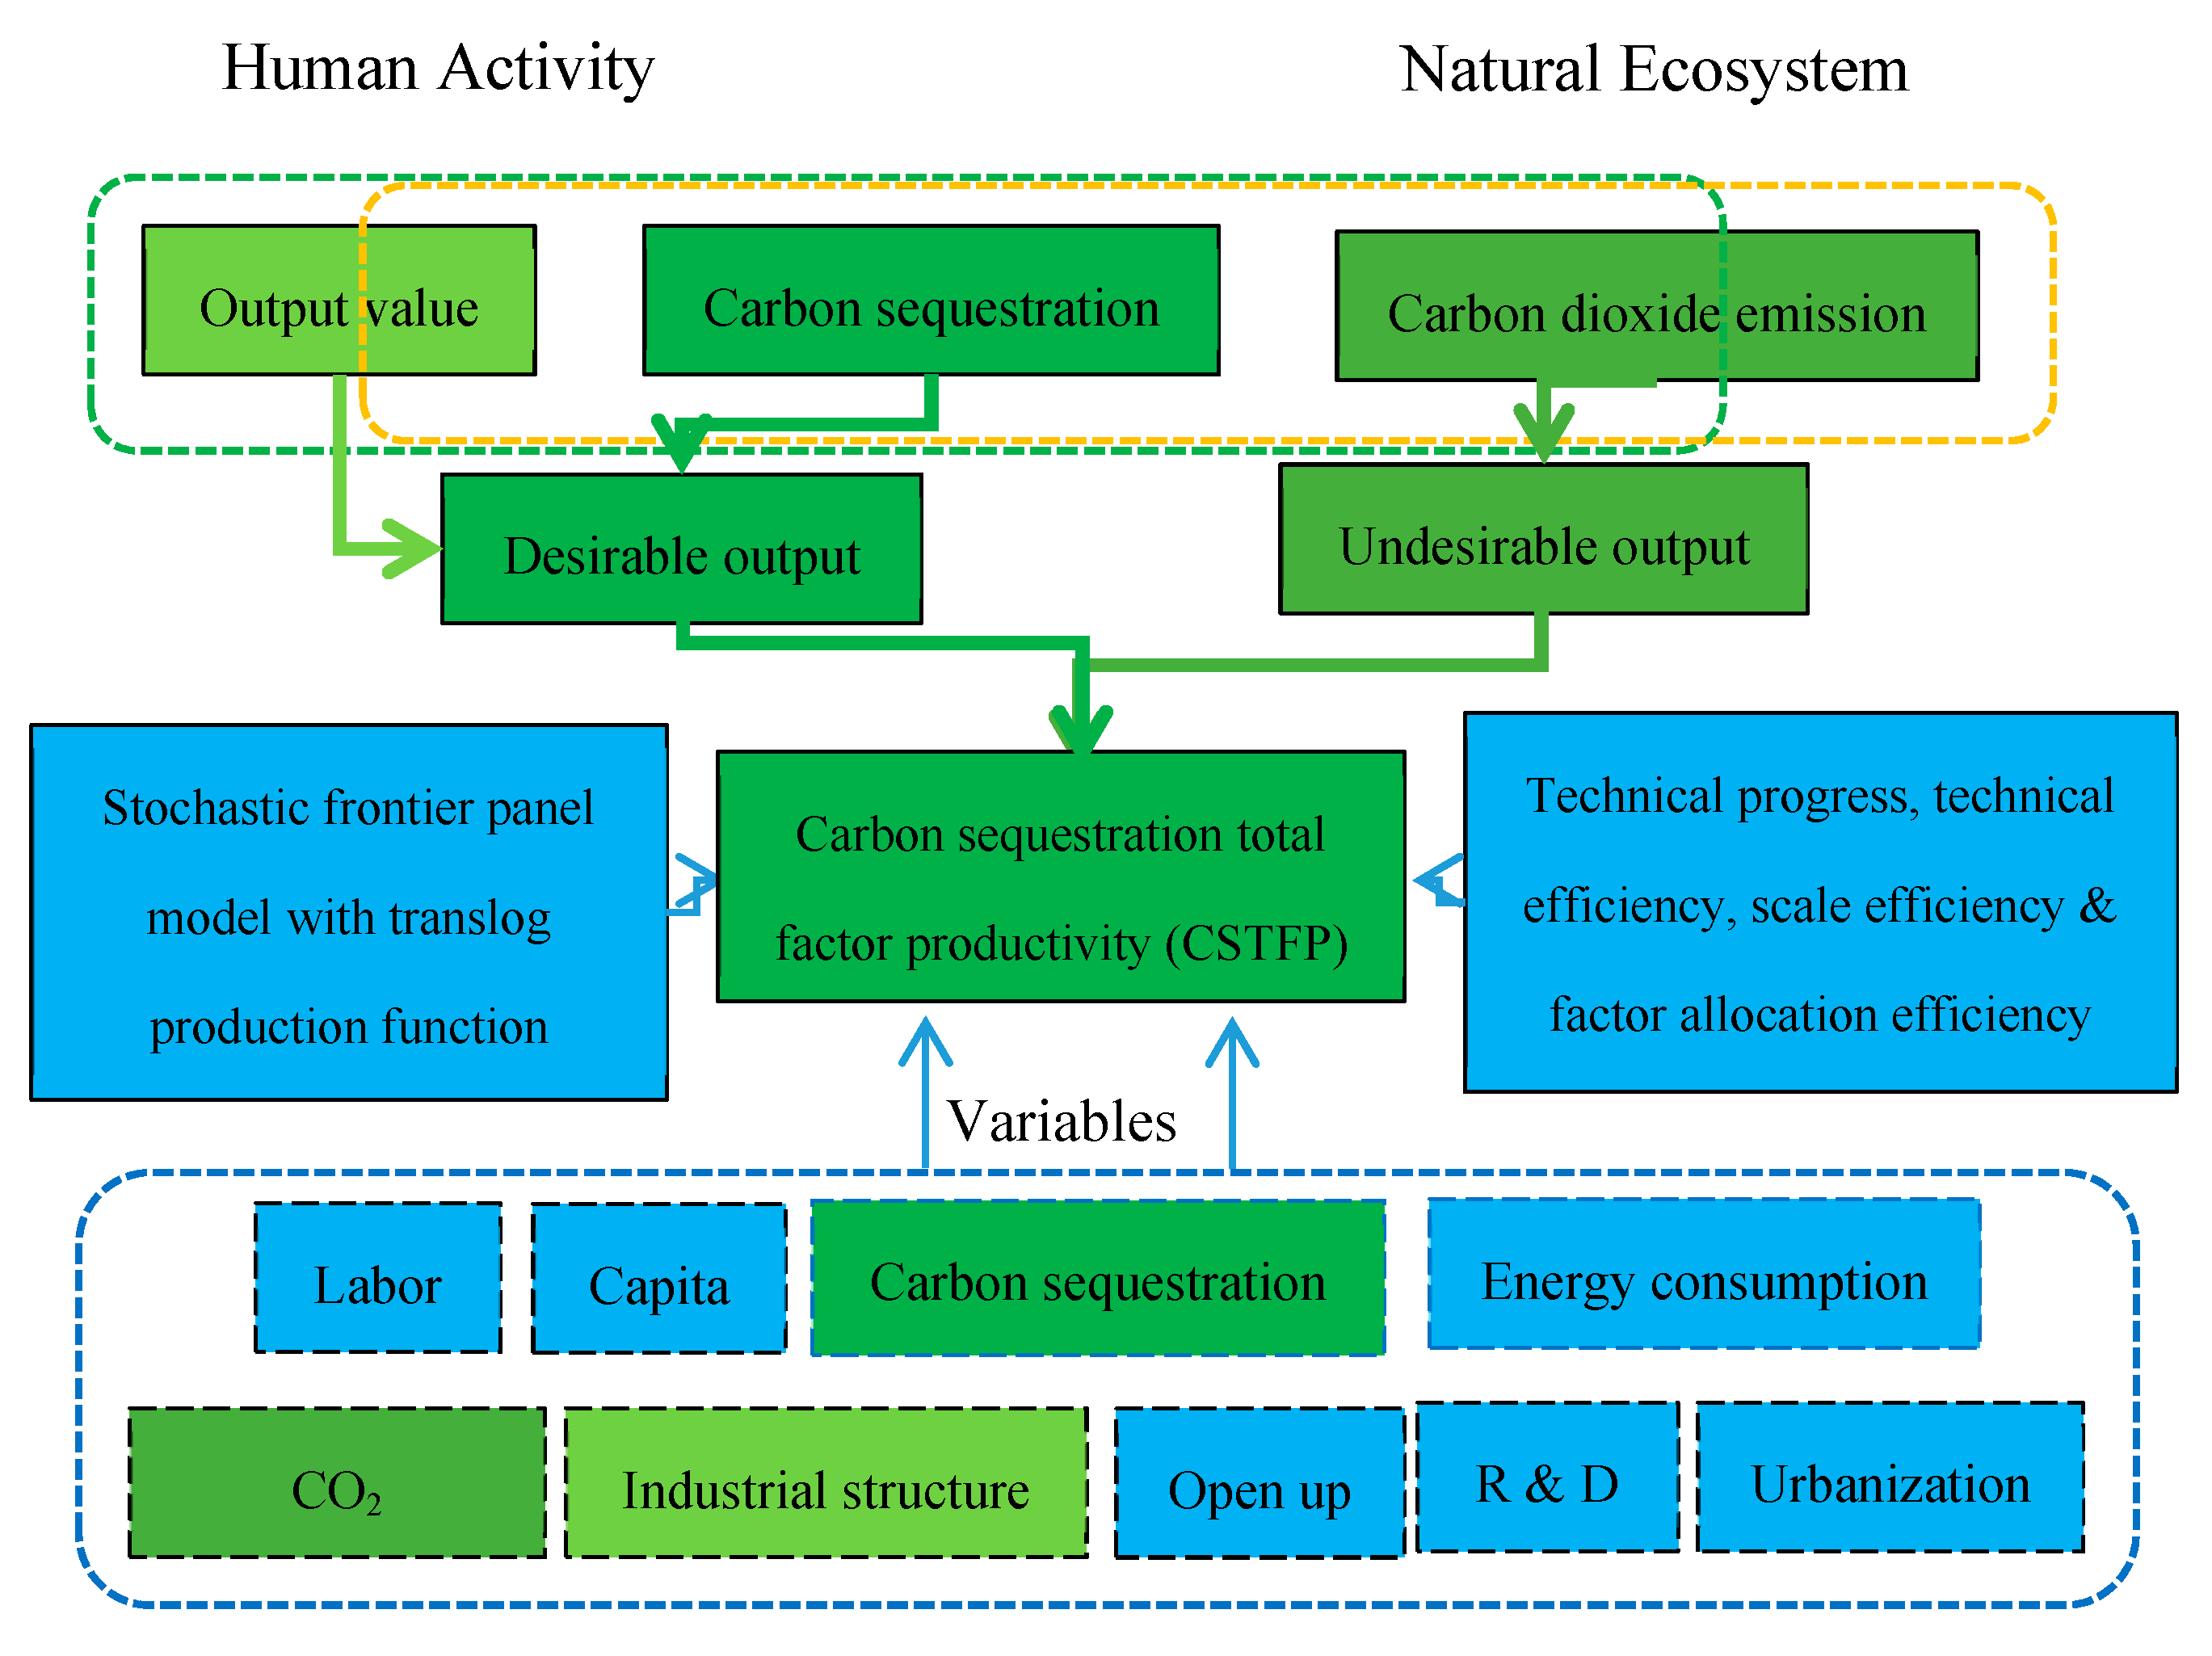
2.1. Conceptual Framework
2.2. Stochastic Frontier Analysis
2.3. Translog Production Function Setting
2.4. Technical Inefficiency Function Setting
2.5. Decomposition of CSTFP Growth
2.5.1. Rate of Technical Progress
2.5.2. Rate of Technical Efficiency Change
2.5.3. Rate of Scale Efficiency Change
2.5.4. Rate of Factor Allocation Efficiency Change
3. Study Area and Data
3.1. The Yangtze River Economic Belt (YREB) of China
3.2. Variables and Data
3.2.1. Output and Input Variables
3.2.2. Impact Variables of Technical Inefficiency Terms
4. Empirical Estimation
4.1. Model Test
4.2. Parameter Estimation
5. Results
5.1. The CSTFP Growth Is Obviously Improved Owing to Carbon Sequestration’s Synergy Effect
5.2. Three of Four Components Drives Positively the CSTFP Growth
5.3. Technical Efficiency Growth Is the Primary Contributor to the CSTFP Growth
5.4. Scale Efficiency is Stabilized While Factor Allocation Efficiency is Lowered
5.5. Distance on CSTFP Growth in Three Watershed Segments is Significant
6. Discussion
6.1. Technological Progress Is Improved by Synergistic Effect of Energy Inputs and Carbon Sequestration
6.2. Technical Efficiency Growth Is Benefited from Harmonious Symbiosis Influence of Carbon Sequestration
6.3. Inefficient Resource Allocation Is Mainly Due to Conflicts of Interest and Insufficient Coordination among Regions in YREB
6.4. CSTFP Growth Is Inadequate and Uncoordinated among 11 Provinces and Municipalities of YREB
6.5. Total Synergies Are Not Being Unleashed Enough for Promotion of the CSTFP Growth in YREB
7. Conclusions and Policy Implications
7.1. Conclusions
7.2. Policy Implications
7.2.1. Overall Synergies of Carbon Sequestration on Input–Output Mixes Should Be Given Full Play to Driving CSTFP Growth in YREB
7.2.2. Regional Close Cooperation and Harmonious Symbiosis Development Should Be Strengthened among Provinces and Municipalities of YREB
Author Contributions
Funding
Acknowledgments
Conflicts of Interest
References
- Lin, B.; Ge, J. Carbon sequestration and output of China’s forestry sector: An ecological economic development perspective. Sci. Total Environ. 2019, 655, 1169–1180. [Google Scholar] [CrossRef]
- UNFCCC. Kyoto Protocol to the United Nations Framework Convention on Climate Change. 1998. Available online: http://unfccc.int/resource/docs/convkp/kpeng.pdf (accessed on 29 November 2019).
- Heimann, M.; Reichstein, M. Terrestrial ecosystem carbon dynamics and climate feedbacks. Nature 2008, 451, 289–292. [Google Scholar] [CrossRef]
- Sellers, P.J.; Schimel, D.S.; Moore, B.; Liu, J.; Eldering, A. Observing carbon cycle-climate feedbacks from space. Proc. Natl. Acad. Sci. USA 2018, 115, 7860–7868. [Google Scholar] [CrossRef]
- Seneviratne, S.I.; Donat, M.G.; Mueller, B.; Alexander, L.V. No pause in the increase of hot temperature extremes. Nat. Clim. Chang. 2014, 4, 161–163. [Google Scholar] [CrossRef]
- Zscheischler, J.; Mahecha, M.D.; Harmeling, S.; Reichstein, M. Detection and attribution of large spatiotemporal extreme events in Earth observation data. Ecol. Inform. 2013, 15, 66–73. [Google Scholar] [CrossRef]
- Wolf, J.; West, T.O.; Le Page, Y.; Kyle, G.P.; Zhang, X.; Collatz, G.J.; Imhoffff, M.L. Biogenic carbon flfluxes from global agricultural production and consumption. Glob. Biogeochem. Cycles 2015, 29, 1617–1639. [Google Scholar] [CrossRef]
- Ryu, Y.; Berry, J.A.; Baldocchi, D.D. What is global photosynthesis? History, uncertainties and opportunities. Remote Sens. Environ. 2019, 223, 95–114. [Google Scholar] [CrossRef]
- Lugoi, L.P.; Bamutaze, Y.; Martinsen, V.; Dick, B.; Almas, A.R. Ecosystem productivity response to environmental forcing, prospect for improved rain-fed cropping productivity in lake Kyoga Basin. Appl. Geogr. 2019, 102, 1–11. [Google Scholar] [CrossRef]
- Oliver, W.K.; Atsumi, S. A carbon sequestration pathway increases carbon productivity in cyanobacteria. Metab. Eng. 2015, 29, 106–112. [Google Scholar] [CrossRef]
- Kay, S.; Rega, C.; Moreno, G.; Herder, M.; Palma, J.H.N.; Borek, R.; Josep, C.D.; Freese, D.; Giannitsopoulos, M.; Graves, A.; et al. Agroforestry creates carbon sequestration whilst enhancing the environment in agricultural landscapes in Europe. Land Use Policy 2019, 83, 581–593. [Google Scholar] [CrossRef]
- Wang, Q.; Su, M. The effects of urbanization and industrialization on decoupling economic growth from carbon emission—A case study of China. Sustain. Cities Soc. 2019, 51, 101758. [Google Scholar] [CrossRef]
- Lin, B.; Xu, M. Exploring the green TFP of China’s metallurgical industry under carbon tax: A perspective on factor substitution. J. Clean. Prod. 2019, 233, 1322–1333. [Google Scholar] [CrossRef]
- Najm, S. The green paradox and budgetary institutions. Energy Policy 2019, 133, 110846. [Google Scholar] [CrossRef]
- Grimaud, A.; Rouge, L. Carbon sequestration, economic policies and growth. Resour. Energy Econ. 2014, 36, 307–331. [Google Scholar] [CrossRef]
- Nishimizu, M.; Page, J.M. TFP growth, technological progress and technical efficiency change: Dimensions of productivity change in Yugoslavia, 1965–1978. Econ. J. 1982, 92, 920–936. [Google Scholar] [CrossRef]
- Wen, G.J. TFP change in China’s farming sector: 1952–1989. Econ. Dev. Cult. Chang. 1993, 42, 1–41. [Google Scholar] [CrossRef]
- Färe, R.; Grosskopf, S.; Norris, M.; Zhang, Z. Productivity growth, technical progress, and efficiency change in industrialized countries. Am. Econ. Rev. 1994, 84, 66–83. [Google Scholar]
- Coelli, T.J.; Rao, D.S.P.; O’Donnell, C.J.; Battese, G.E. An Introduction to Efficiency and Productivity Analysis; Springer: New York, NY, USA, 2005. [Google Scholar]
- Rao, G.M.; Wang, Y.; Wu, Z. Regional scientific and technological innovation mechanism of internal and external symbiosis cycle. J. Quant. Tech. Econ. 2009, 26, 87–93. (In Chinese) [Google Scholar]
- Hailu, A.; Veeman, T.S. Non-parametric productivity analysis with undesirable outputs: An application to the Canadian pulp and paper industry. Am. J. Agric. Econ. 2001, 83, 605–616. [Google Scholar] [CrossRef]
- Cao, J. Measuring Green Productivity Growth for China’s Manufacturing Sectors: 1991–2000. Asian Econ. J. 2007, 21, 425–451. [Google Scholar] [CrossRef]
- Chen, S.; Golley, J. ‘Green’ productivity growth in China’s industrial economy. Energy Econ. 2014, 44, 89–98. [Google Scholar] [CrossRef]
- Li, K.; Lin, B. Measuring green productivity growth of Chinese industrial sectors during 1998–2011. China Econ. Rev. 2015, 36, 279–295. [Google Scholar] [CrossRef]
- Yang, W.; Shi, J.; Qiao, H.; Shao, Y.; Wang, S. Regional technical efficiency of Chinese iron and steel industry based on bootstrap network data envelopment analysis. Socio-Econ. Plan. Sci. 2017, 57, 14–24. [Google Scholar] [CrossRef]
- Yang, Z.; Fan, M.; Shao, S.; Yang, L. Does carbon intensity constraint policy improve industrial green production performance in China? A quasi-DID analysis. Energy Econ. 2017, 68, 271–282. [Google Scholar] [CrossRef]
- Tian, P.; Lin, B. Promoting green productivity growth for China’s industrial exports: Evidence from a hybrid input-output model. Energy Policy 2017, 111, 394–402. [Google Scholar] [CrossRef]
- Feng, C.; Huang, J.; Wang, M. Analysis of green total-factor productivity in China’s regional metal industry: A meta-frontier approach. Resour. Policy 2018, 58, 219–229. [Google Scholar] [CrossRef]
- Kumar, S. Environmentally sensitive productivity growth: A global analysis using Malmquist–Luenberger index. Ecol. Econ. 2006, 56, 280–293. [Google Scholar] [CrossRef]
- Zhang, C.; Liu, H.; Bressers, H.T.A.; Buchanan, K.S. Productivity growth and environmental regulations-accounting for undesirable outputs: Analysis of China’s thirty provincial regions using the Malmquist-Luenberger index. Ecol. Econ. 2011, 70, 2369–2379. [Google Scholar] [CrossRef]
- Wang, Z.; Feng, C. Sources of production inefficiency and productivity growth in China: A global data envelopment analysis. Energy Econ. 2015, 49, 380–389. [Google Scholar] [CrossRef]
- Li, K.; Lin, B. Impact of energy conservation policies on the green productivity in China’s manufacturing sector: Evidence from a three-stage DEA model. Appl. Energy 2016, 168, 351–363. [Google Scholar] [CrossRef]
- Song, M.; Peng, J.; Wang, J.; Zhao, J. Environmental efficiency and economic growth of China: A ray slack-based model analysis. Eur. J. Oper. Res. 2018, 269, 51–63. [Google Scholar] [CrossRef]
- Mahlberg, B.; Luptacik, M.; Sahoo, B.K. Examining the drivers of total factor productivity change with an illustrative example of 14 EU countries. Ecol. Econ. 2011, 72, 60–69. [Google Scholar] [CrossRef]
- Shen, Z.Y.; Boussemart, J.P.; Hervé, L. Aggregate green productivity growth in OECD’s countries. Int. J. Prod. Econ. 2017, 189, 30–39. [Google Scholar] [CrossRef] [Green Version]
- Zhang, D. China’s forest expansion in the last three plus decades: Why and how? For. Policy Econ. 2019, 98, 75–81. [Google Scholar] [CrossRef]
- Aigner, D.J.; Lovell, C.A.K.; Schmidt, P. Formulation and estimation of stochastic frontier production function models. J. Econom. 1977, 6, 21–37. [Google Scholar] [CrossRef]
- Meeusen, W.; van den Broeck, J. Efficiency estimation from Cobb-Douglas production functions with composed error. Int. Econom. Rev. 1977, 18, 435–444. [Google Scholar] [CrossRef]
- Forsund, F.R.; Lovell, C.A.K.; Schmidt, P. A survey of frontier production functions and of their relationship to efficiency measurement. J. Econom. 1980, 13, 5–25. [Google Scholar] [CrossRef]
- Schmidt, P. Frontier production functions. Econ. Rev. 1986, 4, 289–328. [Google Scholar] [CrossRef]
- Bauer, P.W. Recent developments in the econometric estimation of frontiers. J. Econom. 1990, 46, 39–56. [Google Scholar] [CrossRef]
- Battese, G.E. Frontier production functions and technical efficiency: A survey of empirical applications in agricultural economics. Agric. Econom. 1992, 7, 185–208. [Google Scholar] [CrossRef] [Green Version]
- Battese, G.E.; Coelli, T.J. A model for technical inefficiency effects in a stochastic frontier production function for panel data. Empir. Econ. 1995, 20, 325–332. [Google Scholar] [CrossRef] [Green Version]
- Coelli, T.J. A computer program for frontier production function estimation: FRONTIER Version 2.0. Econ. Lett. 1992, 39, 29–32, (In North-Holland). [Google Scholar] [CrossRef]
- Arazmuradov, A.; Martini, G.; Scotti, D. Determinants of TFP in former Soviet Union economies: A stochastic frontier approach. Econ. Syst. 2014, 38, 115–135. [Google Scholar] [CrossRef] [Green Version]
- Zhang, Q.; Xu, Z.; Feng, T.; Jiao, J. A dynamic stochastic frontier model to evaluate regional financial efficiency: Evidence from Chinese county-level panel data. Eur. J. Oper. Res. 2015, 241, 907–916. [Google Scholar] [CrossRef]
- Chen, Z.; Barros, C.P.; Borges, M.R. A Bayesian stochastic frontier analysis of Chinese fossil-fuel electricity generation companies. Energy Econ. 2015, 48, 136–144. [Google Scholar] [CrossRef]
- Lin, B.; Long, H. A stochastic frontier analysis of energy efficiency of China’s chemical industry. J. Clean. Prod. 2015, 87, 235–244. [Google Scholar] [CrossRef]
- Li, H.Z.; Tian, X.L.; Zou, T. Impact analysis of coal-electricity pricing linkage scheme in China based on stochastic frontier cost function. Appl. Energy 2015, 151, 296–305. [Google Scholar] [CrossRef]
- Glass, A.J.; Kenjegalieva, K.; Sickles, R.C. A spatial autoregressive stochastic frontier model for panel data with asymmetric efficiency spillovers. J. Econom. 2016, 190, 289–300. [Google Scholar] [CrossRef] [Green Version]
- Pieri, F.; Vecchi, M.; Venturini, F. Modelling the joint impact of R&D and ICT on productivity: A frontier analysis approach. Res. Policy 2018, 47, 1842–1852. [Google Scholar]
- Balliauw, M.; Meersman, H.; Onghena, E.; Voorde, E.V. US all-cargo carriers’ cost structure and efficiency: A stochastic frontier analysis. Transp. Res. Part A 2018, 112, 29–45. [Google Scholar] [CrossRef]
- Tsionas, M.G.; Mallick, S.K. A Bayesian semiparametric approach to stochastic frontiers and productivity. Eur. J. Oper. Res. 2019, 274, 391–402. [Google Scholar] [CrossRef]
- Boyd, G.A.; Lee, J.M. Measuring plant level energy efficiency and technical change in the U.S. metal-based durable manufacturing sector using stochastic frontier analysis. Energy Econ. 2019, 81, 159–174. [Google Scholar] [CrossRef] [Green Version]
- Ondrich, J.; Ruggiero, J. Efficiency measurement in the stochastic frontier model. Eur. J. Oper. Res. 2001, 129, 434–442. [Google Scholar] [CrossRef]
- Kumbhakar, S.C. The specification of technical and allocative inefficiency in stochastic production and profifit frontiers. J. Econom. 1987, 34, 335–348. [Google Scholar] [CrossRef]
- Kumbhakar, S.C. Production frontiers, panel data, and time-varying technical inefficiency. J. Econom. 1990, 46, 201–211. [Google Scholar] [CrossRef]
- Bai, C.; Du, K.; Yu, Y.; Feng, C. Understanding the trend of total factor carbon productivity in the world: Insights from convergence analysis. Energy Econ. 2019, 81, 698–708. [Google Scholar] [CrossRef]
- Miao, Z.; Chen, X.; Baležentis, T.; Sun, C. Atmospheric environmental productivity across the provinces of China: Joint decomposition of range adjusted measure and Luenberger productivity indicator. Energy Policy 2019, 132, 665–677. [Google Scholar] [CrossRef]
- Shi, X.; Li, L. Green TFP and its decomposition of Chinese manufacturing based on the MML index: 2003–2015. J. Clean. Prod. 2019, 222, 998–1008. [Google Scholar] [CrossRef]
- Li, W.; Wang, W.; Wang, Y.; Mustafa Ali, M. Historical growth in total factor carbon productivity of the Chinese industry: A comprehensive analysis. J. Clean. Prod. 2018, 170, 471–485. [Google Scholar] [CrossRef]
- Wang, Q.; Zhang, C.; Cai, W. Factor substitution and energy productivity fluctuation in China: A parametric decomposition analysis. Energy Policy 2017, 109, 181–190. [Google Scholar] [CrossRef]
- Su, B.; Ang, B.W. Multiplicative decomposition of aggregate carbon intensity change using input-output analysis. Appl. Energy 2015, 154, 13–20. [Google Scholar] [CrossRef]
- Su, B.; Ang, B.W. Multi-region comparisons of emission performance: The structural decomposition analysis approach. Ecol. Indic. 2016, 67, 78–87. [Google Scholar] [CrossRef]
- Su, B.; Ang, B.W. Multiplicative structural decomposition analysis of aggregate embodied energy and emission intensities. Energy Econ. 2017, 65, 137–147. [Google Scholar] [CrossRef]
- Zhang, Z.; Ye, J.L. Decomposition of environmental TFP growth using hyperbolic distance functions: A panel data analysis for China. Energy Econ. 2015, 47, 87–97. [Google Scholar] [CrossRef]
- Debreu, G. The coefficient of resource utilization. Econometrica 1951, 19, 273–292. [Google Scholar] [CrossRef]
- Anga, F.; Kerstens, P.J. Decomposing the Luenberger-Hicks-Moorsteen TFP indicator: An application to U.S. agriculture. Eur. J. Oper. Res. 2017, 260, 359–375. [Google Scholar] [CrossRef]
- Diewert, W.E.; Fox, K.J. Decomposing productivity indexes into explanatory factors. Eur. J. Oper. Res. 2017, 256, 275–291. [Google Scholar] [CrossRef]
- Boussemart, J.-P.; Leleu, H.; Shen, Z. Environmental growth convergence among Chinese regions. China Econ. Rev. 2015, 34, 1–18. [Google Scholar] [CrossRef]
- Cheng, Z.H.; Li, L.; Liu, J.; Zhang, H. Research on energy directed technical change in China’s industry and its optimization of energy consumption pattern. J. Environ. Manag. 2019. [Google Scholar] [CrossRef]
- NBS. China Statistical Yearbook 2000–2016; Chongqing Statistical Yearbook 2000–2016; Sichuan Statistical Yearbook 2000–2016; Guizhou Statistical Yearbook 2000–2016; Yunan Statistical Yearbook 2000–2016; Hubei Statistical Yearbook 2000–2016; Hunan Statistical Yearbook 2000–2016; Jiangxi Statistical Yearbook 2000–2016; Anhui Statistical Yearbook 2000–2016; Shanghai Statistical Yearbook 2000–2016; Jiangsu Statistical Yearbook 2000–2016; Zhejiang Statistical Yearbook 2000–2016; China Statistics Press: Beijing, China, 2000–2016.
- NDRC. Price Yearbook of China 2000–2016; Editorial Department of Price Yearbook of China Press; Chinese Price Society: Beijing, China, 2000–2016.
- Shan, H. Re-estimation of China’s capital stock k: 1952–2006. J. Quant. Tech. Econ. 2008, 25, 17–31. (In Chinese) [Google Scholar]
- Development and Reform Office of China. Guidelines for the Preparation of Provincial Greenhouse Gas Inventories; No. 1041; Development and Reform Office Climate: Beijing, China, 2011.
- Xie, H.Y.; Chen, X.S.; Lin, K.R.; Hu, Y.Y. Ecological footprint of fossil energy and electric power based on carbon cycle. Acta Ecol. Sin. 2008, 1729–1735, (In Chinese with English Abstract). [Google Scholar] [CrossRef]
- He, H.; Pan, Y.; Zhu, W.; Liu, X.; Zhang, Q.; Zhu, X. Measurement of terrestrial ecosystem service value in China. Acta Ecol. Appl. Sin. 2005. [Google Scholar] [CrossRef]
- Mei, X.Y.; Zhang, X.F. Carbon storage and carbon sequestration of typical wetland vegetation in the Yangtze estuary—A case study of the reed belt in dongtan, chongming. Chin. J. Ecol. Agric. 2008, 16, 269–272, (In Chinese with English Abstract). [Google Scholar] [CrossRef]
- Tian, Y.Y.; Zhang, J.Q. Differentiation of net carbon effect in agricultural production in China. Chin. J. Nat. Resour. 2013, 28, 1298–1309, (In Chinese with English Abstract). [Google Scholar]
- 80. Mohan Dey, M.; Javien Paraguas, F.; Srichantuk, N.; Xinhua, Y.; Bhatta, R.; Thi Chau Dung, L. Technical efficiency of freshwater pond polyculture production in selected Asian countries: Estimation and implication. Aquac. Econ. Manag. 2005, 9, 39–63. [Google Scholar] [CrossRef]


| Variables | Marks | Observed Values | Mean | S.D. | Min. | Max. | |
|---|---|---|---|---|---|---|---|
| Explained variable | Local GDP (RMB 100 million yuan) | Y | 187 | 11,056.22 | 9438.172 | 993.53 | 53,138.6 |
| Explanatory variable | Labor (10,000 workers) | L | 187 | 3058.321 | 1201.332 | 752.26 | 4860 |
| Capital stock (RMB 100 million yuan) | K | 187 | 22,509.77 | 20,796.25 | 1776.29 | 119,790 | |
| Energy consumption (10,000 ton) | E | 187 | 10,154.21 | 5792.988 | 2331.52 | 32,876.9 | |
| carbon sequestration (10,000 ton) | CS | 187 | 15,686.54 | 8962.507 | 501.5 | 34,729.8 | |
| Exogenous variables | Carbon emission intensity (ton/10,000RMB¥) | CI | 187 | 0.8894 | 0.5141 | 0.3316 | 3.1028 |
| Ratio of secondary industry (%) | SI | 187 | 46.04 | 5.3618 | 29.83 | 56.6 | |
| Urbanization rate (%) | UE | 187 | 47.51 | 15.77 | 23.36 | 89.6 | |
| Research and development level (%) | RD | 187 | 1.2817 | 0.7167 | 0.3478 | 3.726 | |
| Opening level (%) | OP | 187 | 30.4 | 38.4908 | 3.3477 | 158.333 |
| Indexes | Equivalent Coal Factors | Carbon Emission Factors |
|---|---|---|
| Raw coal | 0.7143 | 0.7559 |
| Coke | 0.9714 | 0.855 |
| Crude oil | 1.4286 | 0.5857 |
| Petrol | 1.4714 | 0.5538 |
| Kerosene | 1.4714 | 0.5714 |
| Diesel oil | 1.4571 | 0.5921 |
| Fuel oil | 1.4286 | 0.6185 |
| Nature gas | 1.33 | 0.4483 |
| Coke oven gas | 0.5928 | 0.3548 |
| Categories | Factor | Unit |
|---|---|---|
| Forest [76] | 13.97 | tCO2/hm2 |
| Artificial wetland [77,78] | 6.07 | tCO2/hm2 |
| Inshore and coastal [77,78] | 3.70 | tCO2/hm2 |
| River [77,78] | 2.19 | tCO2/hm2 |
| Lake [77,78] | 1.47 | tCO2/hm2 |
| Rice [79] | 3.50 | tCO2/t |
| Wheat [79] | 2.66 | tCO2/t |
| Corn [79] | 2.71 | tCO2/t |
| Beans [79] | 2.48 | tCO2/t |
| Potatoes [79] | 1.71 | tCO2/t |
| Peanut [79] | 3.15 | tCO2/t |
| Rapeseed [79] | 1.83 | tCO2/t |
| Tobacco [79] | 0.67 | tCO2/t |
| Generalized Likelihood Rate | Critical Value | Result | ||
|---|---|---|---|---|
| 227.576 | 141.32 | 17.67 | Refuse | |
| 286.444 | 17.612 | 5.138 | Refuse | |
| 279.23 | 21.667 | 7.045 | Refuse | |
| 158.621 | 279.23 | 10.371 | Refuse |
| Variable | Estimation I | Estimation II | Estimation III | |||
|---|---|---|---|---|---|---|
| Coef. | S.D | Coef. | S.D | Coef. | S.D | |
| lnL | 3.278 *** | (0.622) | 1.863 ** | (0.735) | 3.42 *** | (0.756) |
| lnK | −0.571 * | (0.347) | −1.368 ** | (0.563) | −1.66 *** | (0.439) |
| lnE | 2.366 *** | (0.585) | 0.581 *** | (0.418) | ||
| lnCS | −1.491 *** | (0.269) | ||||
| t | 0.190 *** | (0.0482) | 0.109 | (0.0719) | 0.277 *** | (0.0564) |
| lnL × lnK | −0.559 *** | (0.0575) | −0.196 * | (0.110) | 0.456 *** | (0.087) |
| lnL × lnE | 0.199 | (0.127) | −0.487 *** | (0.105) | ||
| lnK × lnE | −0.749 *** | (0.108) | −0.583 *** | (0.0855) | ||
| lnL × lnCS | 0.524 *** | (0.0744) | ||||
| lnK × lnCS | −0.401 *** | (0.0403) | ||||
| lnE × lnCS | 0.335 *** | (0.0455) | ||||
| lnL × t | 0.0278 *** | (0.00585) | −0.0134 | (0.00877) | −0.0431 *** | (0.0087) |
| lnK × t | −0.0468 *** | (0.00974) | −0.0648 *** | (0.0188) | −0.0354 ** | (0.0092) |
| lnE × t | 0.0682 *** | (0.0107) | 0.0187 * | (0.0076) | ||
| lnCS × t | 0.0269 *** | (0.0038) | ||||
| lnL × lnL | 0.140 *** | (0.0307) | 0.148 *** | (0.0471) | −0.472 *** | (0.1021) |
| lnK × lnK | 0.318 *** | (0.0394) | 0.551 *** | (0.0788) | 0.4 *** | (0.0444) |
| lnE × lnE | 0.170 ** | (0.0834) | 0.327 *** | (0.0669) | ||
| lnCS × lnCS | −0.113 *** | (0.015) | ||||
| t2 | 0.00169 ** | (0.000737) | 0.000665 | (0.00132) | −0.000186 | (0.000788) |
| Constant | −6.730 *** | (2.253) | 7.455 *** | (2.670) | 2.129 | (1.1859) |
| Technical inefficiency | ||||||
| CI | 0.560 *** | (0.0281) | 0.524 *** | (0.0218) | ||
| UE | −3.050 *** | (0.390) | −0.893 *** | (0.214) | −0.975 *** | (0.157) |
| SI | −0.923 ** | (0.458) | −0.902 *** | (0.156) | −1.225 *** | (0.1104) |
| RD | 0.109 * | (0.0679) | 0.0604 * | (0.0362) | 0.124 *** | (0.017) |
| OP | −0.724 ** | (0.343) | −0.134 ** | (0.0588) | −0.138 *** | (0.0367) |
| Constant | 1.865 *** | (0.213) | 0.669 *** | (0.125) | 0.769 *** | (0.0922) |
| log likelihood | 228.1329 | 319.5497 | 372.2396 | |||
| wald chi2(13) | 15,687.35 | 7368.21 | 18878.13 | |||
| prob > chi2 | 0 | 0 | 0 | |||
| γ | 0.986104207 | 0.93437562 | 0.999995001 | |||
| ΔTFP | ΔTP | CR | ΔTE | CR | ΔSE | CR | ΔAE | CR | |
|---|---|---|---|---|---|---|---|---|---|
| Estimation 1 (two-factor) | −26.55 | −25.77 | −93.00 | 0.03 | 0.11 | 0.55 | 1.98 | −1.36 | −4.91 |
| Estimation 2 (three-factor) | −3.76 | 0.90 | 15.25 | −0.08 | −1.36 | 0.17 | 2.88 | −4.75 | −80.51 |
| Estimation 3 (four-factor) | 0.20 | 1.72 | 18.55 | 2.65 | 28.59 | 0.37 | 3.99 | −4.53 | −48.87 |
| ΔLTFP | ΔLTP | CE | ΔLTE | CE | ΔSE | CE | ΔAE | CE | |
|---|---|---|---|---|---|---|---|---|---|
| Upper reaches | 0.62 | 3.86 | 23.84 | 4.06 | 25.07 | 0.49 | 2.99 | −7.80 | −48.09 |
| Middle reaches | −0.14 | 2.38 | 20.96 | 3.00 | 26.35 | 0.23 | 2.07 | −5.75 | −50.62 |
| Lower reaches | 0.11 | −2.01 | −48.66 | 0.29 | 7.01 | 0.39 | 9.43 | 1.44 | 34.9 |
| the YREB | 0.20 | 1.72 | 18.58 | 2.65 | 28.54 | 0.37 | 3.97 | −4.53 | −48.9 |
© 2019 by the authors. Licensee MDPI, Basel, Switzerland. This article is an open access article distributed under the terms and conditions of the Creative Commons Attribution (CC BY) license (http://creativecommons.org/licenses/by/4.0/).
Share and Cite
Rao, G.; Su, B.; Li, J.; Wang, Y.; Zhou, Y.; Wang, Z. Carbon Sequestration Total Factor Productivity Growth and Decomposition: A Case of the Yangtze River Economic Belt of China. Sustainability 2019, 11, 6809. https://doi.org/10.3390/su11236809
Rao G, Su B, Li J, Wang Y, Zhou Y, Wang Z. Carbon Sequestration Total Factor Productivity Growth and Decomposition: A Case of the Yangtze River Economic Belt of China. Sustainability. 2019; 11(23):6809. https://doi.org/10.3390/su11236809
Chicago/Turabian StyleRao, Guangming, Bin Su, Jinlian Li, Yong Wang, Yanhua Zhou, and Zhaolin Wang. 2019. "Carbon Sequestration Total Factor Productivity Growth and Decomposition: A Case of the Yangtze River Economic Belt of China" Sustainability 11, no. 23: 6809. https://doi.org/10.3390/su11236809