1. Introduction
In recent years, there has been increasing interest in household food waste (FW) from both academics and policy makers. On one hand, literature on household FW has increased more than twofold in the last five years [
1,
2], and research has focused mainly on identifying the factors associated with the behavior of individuals towards FW. On the other hand, the importance of FW has been highlighted at various territorial levels. At an international level, the FW issue has been included in the concept of sustainable consumption and production, which is among the 17 Sustainable Development Goals defined by the United Nations (UN) in the 2030 Agenda for Sustainable Development to transform our world. Indeed, UN Sustainable Development Goal 12 includes states that its target is to halve per capita FW at retail and consumer levels and reduce food loss throughout production and food supply chains (FSCs), including post-harvest losses, by 2030 [
3]. Moreover, the importance of the FW issue has been acknowledged in Europe by including this issue in the EU action plan for circular economy [
4]. Indeed, interventions by member states, regions, cities, and businesses along the FSC are essential for the prevention of FW and for dealing with the different situations that may arise across countries and regions, and awareness campaigns are required in order to change consumer behavior [
5].
In the EU28, approximately 88 million tons of food are wasted annually, the associated costs of which have been estimated at €143 billion [
6]. As already mentioned, in developed countries, food losses generally occur in the final stages of the FSC, mainly due to the decisions made by producers and final consumers, while food loss in developing countries generally occurs in the earlier FSC stages because of a lack of financial, technical, and managerial resources. In the same study [
6], it was estimated that that two-thirds of the total cost of food loss and waste are caused by household FW, which amounts approximately to €98 billion. As regards the Italian context, the estimated cost of FW occurring in the final FSC stage amounts to approximately €12 billion per year, according to the recent estimates provided by the observatory Waste Watcher (Last Minute Market/SWG) with reference to the year 2017.
The European Commission (EC) prioritizes the widespread dissemination of good practices regarding FW prevention in order to raise awareness at the various territorial levels. However, it is not an easy task to plan and implement effective policies and initiatives, due to the various aspects that should be taken into consideration.
Firstly, the action of wasting food by individuals has been proven to be the result of multiple complex factors and types of behavior, rather than the outcome of a single behavior [
7,
8,
9]. Various studies have focused on the main activities that are responsible for FW, identifying consumers’ misunderstandings regarding “use by” and “best before” dates on food expiration date labels [
10] as one of the most important.
Secondly, it has been demonstrated [
9] that there are a range of factors that encourage people to reduce FW at both individual and contextual (territorial) levels. For this reason, even if planning and harmonization at a central European level is essential from a methodological perspective (i.e., common definition, common methodologies to tackle FW issues), it is much more important to analyze national contexts separately and enhance the level of disaggregation of the analysis in order to accurately consider individual and territorial heterogeneity [
4] when sample data make it possible.
Bearing in mind the previously mentioned issues, this paper considered date marking as an activity that leads individuals to throw away edible food. Specifically, a recent study published in 2018 by the FW [
11] estimated that up to 10% of the total amount of the FW generated annually in the EU is associated with misunderstanding the expiration dates, which mainly concern main food categories such as fruit and vegetables, bakery products, meat including fish and poultry, and dairy products. Therefore, consumers who misinterpret the meaning of “use by” and “best before” tend to waste more food. On the other hand, food business operators as well as national or international regulatory authorities [
12], who are responsible for the date marking of food products, may also have an important role in FW generation.
In 2015, the EC carried out a specific survey—the Flash Eurobarometer (FE) n. 425—which is the most recent representative survey at the national level to analyze consumer behavior regarding the expiry dates found on food labels. The Eurobarometer results confirmed that the expiry dates found on food products are easily misunderstood, and that only 47% of European citizens comprehend the meaning of best before labels and a small percentage of European citizens (40%) understand the meaning of “use by”, with a substantial heterogeneity observed among the various countries [
13].
These results in terms of dispersion strongly support the need to carry out analysis at least at a national level, or for macro-regions where sample surveys allow this level of disaggregation. This was also underlined by Toma et al. [
14], (p. 3) who stressed that, despite the fact that date labeling in EU countries follows food Regulation (EU) No. 1169/2011 of the European Parliament and Council, the different regimes and the speed with which each country puts the legislation into effect may influence the understanding of date labeling for their citizens.
Within this framework, this paper focused on the Italian context and had two main aims. The first aim was to determine whether and to what extent Italian consumers comprehend use by and best before dates by exploring consumers’ behavioral, attitudinal, and personal characteristics regarding date marking.
We then considered the possibility of removing best before dates on some products, which has recently been proposed by the European Parliament. The FE survey investigated how respondents would react if best before dates for certain non-perishable foods, such as rice, pasta, coffee, and tea were removed, since this information is currently required by law. By adopting the generalized maximum entropy (GME) estimator introduced by Golan et al. [
15] and first introduced in a segmentation perspective for the FW context by Principato et al. [
16] and Secondi et al. [
17], we identified the factors distinguishing individuals according to their different behaviors towards this simulated action (i.e., removal of best before date from a pack of spaghetti).
In general, the contribution of this paper is intended to represent a “virtual” application context where an action is not taken on the prevention of food waste (as has been done up to now by a large part of the literature on FW at the domestic level, mainly aimed at understanding factors that can contribute to a reduction of food waste), compared to the outcomes/reactions that a concrete and corrective action (specifically, removing the expiry date “to be consumed preferably by” from some products) could have on FW generation. On this issue, the FE n.425 survey represents a valuable source of data to be exploited.
However, it is worth noting the limit of analyzing behavior of an action on the basis of a statistical survey (and, in this sense, the simulation to be contrasted with an actual real action) and not therefore on the basis of activating a “true” action (specifically, this study started from a survey carried out by the European commission aimed at understanding—albeit through a sample survey —the extent of the problem of understanding expiration dates), but it is also true that the implementation of concrete actions/policies—especially those related to economic and social issues—often begins from a “virtual” action implemented through the use of econometric and statistical tools (specifically regression models used for forecasting purposes, or in other contexts computable general equilibrium models and agent-based models).
The rest of the paper is structured as follows.
Section 2 illustrates the main characteristics of the dataset used for the analysis and the theoretical statistical framework used for analyzing consumer behavior.
Section 3 contains a summary of the results of the FE 425 survey and the GME multinomial logit model estimates. In
Section 4, the results obtained are discussed and useful insights for territorial interventions are provided.
2. Materials and Methods
2.1. The Best Before and Use by Expiry Dates
The current European legislation on date marking is governed by EU-Regulation n. 1169/2011 regarding food information to consumers (FIC), which defines two ways of expressing expiry dates on most pre-packed foods. On one hand, the best before date indicates the date (minimum durability) up to which the food maintains its quality when properly stored, and a wide range of refrigerated, frozen, dried (pasta, rice), and tinned foods are therefore marked in this way. As specified in the briefing published by European Parliament in 2015 [
18] (p. 2), European legislation does not prohibit the marketing of foods after their best before date has passed, while the specific marketing options of are regulated at the national level [
19].
On the other hand, in the case of highly perishable foodstuffs such as fresh fish, meat, or dairy products the use by date establishes the maximum date up to which the food can be eaten safely, as foreseen by article 24 (1) of the FIC regulation.
It is important to note that the two different labels should enable consumers to distinguish whether the date concerns a safety threshold (i.e., use by) or a quality threshold (i.e., best before). As stressed in the recent report published by the European Commission [
11], even if best before and use by dates are intended for consumers, they also prove useful for retailers and manufacturers in organizing food (re)distribution and inventory management.
However, differences between consumers’ intentions and actual behavior exist due to difficulties EU citizens have in understanding date labeling, as demonstrated by the FE 425 survey 425 carried out in 2015 [
13].
From a purely institutional perspective, the EU intends to simplify the labels placed on foods, as well as to raise awareness regarding the use of expiry dates. In fact, as regards this issue, the EU intends to establish a platform on food losses and FW in order to promote initiatives and actions so that consumers can gain a better understanding of use by and best before dates. The EU also intends to distribute leaflets and brochures explaining the different meanings and consequences related to the safety of foodstuffs when the expiration dates have passed.
From an academic perspective—combined with the research focused on understanding the role of label expiration dates in consumer behavior [
20]—there is a growing body of research on the relationships between consumer understanding and the use of date labels and FW generation [
21,
22,
23,
24]. There is another important aspect regarding food storage in terms of the sensory skills required to understand the freshness and quality of foods, which can be determined through taste, smell, and touch. A specific study carried out on this issue [
25] found that elderly people tend to use these senses more than younger people, who pay more attention to date labels or storage times. It is therefore important to instruct consumers, especially young people, to use their senses for assessing the edibility of a food and to enhance consumers’ understanding of expiry dates and labels.
2.2. The FE Survey 425: An Overview Focused on Italian Consumers
The microdata used in this study were collected within the FE survey n. 425 carried out by the TNS political and social network in the EU28 member states from 1 to 3 September 2015. Telephone interviews were conducted in order to obtain a total sample of approximately 26,000 respondents from different social and demographic backgrounds (European Commission, 2015).
The aim of the survey was to gain a better understanding of the perceptions, behavior, and practices of EU28 citizens regarding the management and consumption of foodstuffs, and to study the role expiry dates play in generating FW [
13].
The survey found that approximately 47 out of 100 EU28 citizens correctly comprehended best before dates, while only 40% understood the term “use by”. In both cases, a high percentage of EU28 citizens (at least 25%) mistakenly believed that date marking varies according to the type of foodstuff.
In this study, we focused on the Italian context by referring to a sample of 1003 individuals who participated in the survey. The representativeness of the sample at the national level, constructed by stratifying for NUTS2 region and urbanization levels and supported by the introduction of post-stratification weights (
Table 1) gave us the opportunity to carry out a single-country level analysis, thus enhancing the importance of taking into careful consideration and highlighting the heterogeneity on this issue registered across the various EU28 countries, as well as towards the global EU28 results.
It was observed that Italian consumers were not completely aware of their role in reducing FW, since (in response to the question 1 of the FE-425 questionnaires) only 54% of Italian consumers acknowledged that consumers were the main category responsible. It should be noted that the percentage was considerably lower than the average value of the EU28 countries (76%). In Italy, the second most responsible category was found to be the hospitality and food service sector, with a percentage of 46%, followed by shops and retailers (32%), food manufacturers (30%), public authorities (18%), and lastly farmers (12%).
When Italian consumers were asked what they would do to reduce FW at home, most of them believed that meal planning and shopping more carefully (45%) were the best solutions, followed by re-using leftovers instead of wasting them (40%) while only 16% believed that more detailed information on best before and use by dates and food product labels (i.e., information on storing and preparing food) would help to reduce waste.
Expiry dates proved to be more important for Italians than the total (global) EU28 citizens, as approximately 68% stated that they always look at them when shopping and preparing meals, compared to 58% of EU28 citizens.
2.3. The Multinomial Framework: The GME Econometric Specification
With the aim of understanding how Italian consumers consider best before dates, we referred to the multinomial logit framework by referring to Question 7 from the FE survey, regarding how consumers would behave if they found a package of spaghetti without a best before date and they could not remember when they bought it. The studied possible answers (J = 4) to this question enabled us to implement different scenarios of individuals’ reactions (in the analysis, the last category “You never look at the dates” was considered together with the responses “Don’t know” and Not available). In the multinomial framework, each response—compared to a selected reference situation—corresponded to the estimation of a regression model. As further detailed in
Section 3, we obtained J-1 regression models, with one category as referent category.
In considering both the analysis and sample size at country-level and in order to explore this issue at a more disaggregated level, we used the GME non-parametric approach [
15,
26]. Bearing these characteristics in mind, the GME enabled us not to impose parametric assumptions on the error distributions, thus leaving the data to speak for themselves. Moreover, it provides better results than classical estimators when the data are characterized by ill-conditioned (highly collinear data) or ill-posed (small and limited sample size) situations.
The GME multinomial logit model estimation was included in the general multinomial framework concerning unordered discrete data.
The development of the statistical methodological framework able to describe the data generation process [
15] considered an experiment composed of N trials, in which
y1j,
y2j, …,
yNj, binary variables were observed and where y
ij for
i = 1, 2, …,
T took on one of the
J unordered categories
j = 1, 2, …,
J [
26,
27].
By assuming that
pij—as the probability of alternative
j for unit
i—is related to a set of covariates, the following equation can be specified [
28].
where
βij is the
vectors of unknowns,
is the
covariate vector, and
is the function which links the probabilities
pij to the set of covariates in order to satisfy the condition that
. By adding the noise component to Equation (1), we obtain
In order to capture the unknown and unobservable
p and
e, we used indirect empirical measurements of the noisy observable
y and the known covariates
xi. According to Golan et al. (1996a), we introduced the information contained in the (
T ×
K) matrix
X of covariates by transforming the statistical models into an inverse problem with noise, linear in
p:
when estimating this model within the GME framework, it was necessary to reparametrize the elements of
e since
p is already in probability form. Bearing in mind the nature of the dependent variable
y, the error term could assume values between [−1, 1], and therefore we adopted the support space
with a number of support points
M equal to 3 and
wij as the corresponding probabilities to be estimated, so that
, where
.
As a result, the maximization of the joint entropy (signal and error terms)
subject to data constraints
and the normalization constraints led us to the solution of this optimization problem, and therefore to obtain the estimated of
pij and
wijm (and then
eij) as
and
With the aim of improving the readability of the estimation results, we referred to the relative risk ratios (RRRs) that can be obtained from the estimated coefficient
as follows:
For each covariate, the RRR measured how the risk of observing the specific outcome category in the studied group varies compared to the risk of observing the outcome in the reference group. A value of the RRR higher (lower) than 1 means that the risk of observing the outcome category in the comparison group was higher (lower) than the risk of observing the outcome category in the reference group.
3. Results
3.1. Best Before and Use By Dates: Do We All Understand Correctly and in the Same Way?
One of the first results obtained using the FE-425 microdata was that approximately 67% of Italians “always” check at use by or best before dates on food labels when shopping and preparing meals. Indeed, the percentage of Italians who replied “always” to the question regarding how often they check expiry dates when shopping and preparing meals (i.e., Question Q3 in the FE questionnaire) was approximately 9 percentage points higher than the EU28 overall. Similarly, EU28 citizens paid less attention than Italians in checking expiry dates “often” or “sometimes” (23% of Italians declaring “often”, compared to 21% of EU28 citizens, and 9% of Italians declaring “sometimes”, compared to 7% of EU28 citizens).
However, the amount of attention Italians paid to expiry dates differed significantly between males and females (Pearson chi2 (5) = 24.0217, Pr = 0.000); women paid more attention to the expiry dates on food labels than men. This was confirmed by the fact that 73.70% of women said they always check them, against 61.77% of men. Furthermore, 22.25% of Italian men said that they often check expiry dates, while 4.54% seldom do so and 3.46% never check them. As regards Italian women, 18.33% often check expiry dates, 5.19% sometimes check them, 1.48% seldom check them, and only 1.11% never check them.
A significant, although slight, relationship (Pearson chi2 (25) = 36.5610, Pr = 0.064) emerged between attention to date marking and age group. Indeed, most of the interviewees (irrespective of age) claimed to always check the expiry dates on the labels of food products, with people aged 65 and over paying close attention to them (approximately 73.42% of people in this age group claimed to always check expiration dates), as did people aged between 35–44 (approximately 71.69% of people in this age group claimed to always check expiration dates). On the other hand, the highest percentages of people who seldom or never check best before or use by dates were observed among youths: approximately 1 in 10 youths aged between 15 and 24 stated that they seldom or never check expiry dates. However, the second highest percentage was found for middle-aged people (between 55 and 64 years old); more than 6% of the individuals in this age group declared that they seldom or never check expiry dates.
The questionnaires contained two questions regarding the issue of understanding (correct comprehension) or misunderstanding best before and use by dates.
On observing the interviewees’ responses to the question concerning the meaning of the best before date, it was evident that more than 50% of the Italians perfectly understood the meaning of this food label (55.68%), thus proving that Italians understand food labels better than the average EU28 citizens (in which group the same percentage was equal to 47%).
However, approximately one Italian in five (20.34%) confused the meaning of the best before label with the use by, since they stated that food can be consumed up to the indicated date, but it cannot be consumed later, and approximately 21.45% of Italians were convinced that the meaning of this wording varies according to the type of food on which it is placed, while the others declared “none of these” or said that they did not know.
More than half of the Italian respondents (51.34%) knew exactly what the use by expiry date means, once again showing that Italians are more knowledgeable than the EU28 national average (approximately equal to 40%). However, nearly 50% of the Italian respondents confused “use by” with “best before” (20.24%), stated that the meaning of this label varies according to the type of food (26.47%), or did not find the correct answer in any of the options or declared that they did not know (or did not answer the question).
A first in-depth distinction of awareness of expiration dates was made by age group. Based on the non-parametric chi2 independence test—even bearing in mind the limitations of a bivariate analysis—a dependency between age class and knowledge of understanding of the term “best before” did not seem to emerge. It would be interesting to see if, when viewed from a multivariate perspective, age—the effect of which was considered along with other potentially confounding factors—represents a statistically significant factor.
As regards the term “use by”, the existence of a statistically significant dependency relationship, albeit a weak one (p-value < 0.10), was observed. On the basis of joint distributions, those who appeared to have a better understanding of the meaning of “use by” were those who fell within the 25–34 age group (64.18% answered the question correctly), while the fewest correct answers were observed for those aged 15–24 (41.67% replied correctly) and those aged 65 and over (48.27% replied correctly).
3.2. Exploring the Need for Best Before Labeling on Non-Perishable Foods: A Multinomial GME Approach
3.2.1. If You Find in Your Pantry a Packet of Spaghetti without an Indication of Best Before Date, What Would Your Reaction Be?
The FE survey also included a question which introduced us to a simulation (virtual) scenario. The interviewees were asked how they would behave if they could found a package of spaghetti without a best before date, and they could not remember when they bought it (Question Q7 in the FE survey). Faced with this situation, most people would tend to consume this food if the product looked all right and the packaging was not damaged: the percentage of Italian respondents who selected this response category was equal to 43.25%, higher than the average percentage level for the same statement given by all EU28 individuals who participated in the survey. Approximately, only one Italian out of five “would use spaghetti anyway” (21.23%), while this option was selected by more than one-third of EU28 citizens. As a result, a product without a best before indication would be used by approximately 64% of the Italians against approximately 70% of the overall EU28 citizens.
A total 29.59% of Italians replied that they would throw it away, while 5.20% responded “don’t know” and 0.73% declared that they never check expiry dates. Before analyzing from a multivariate perspective using the GME multinomial regression model, the factors (both sociodemographic and attitudinal–personal characteristics) related to the various statements (i.e., the four considered response categories detailed below) offered by this question were distinguished the percentages of responses to each category according to region.
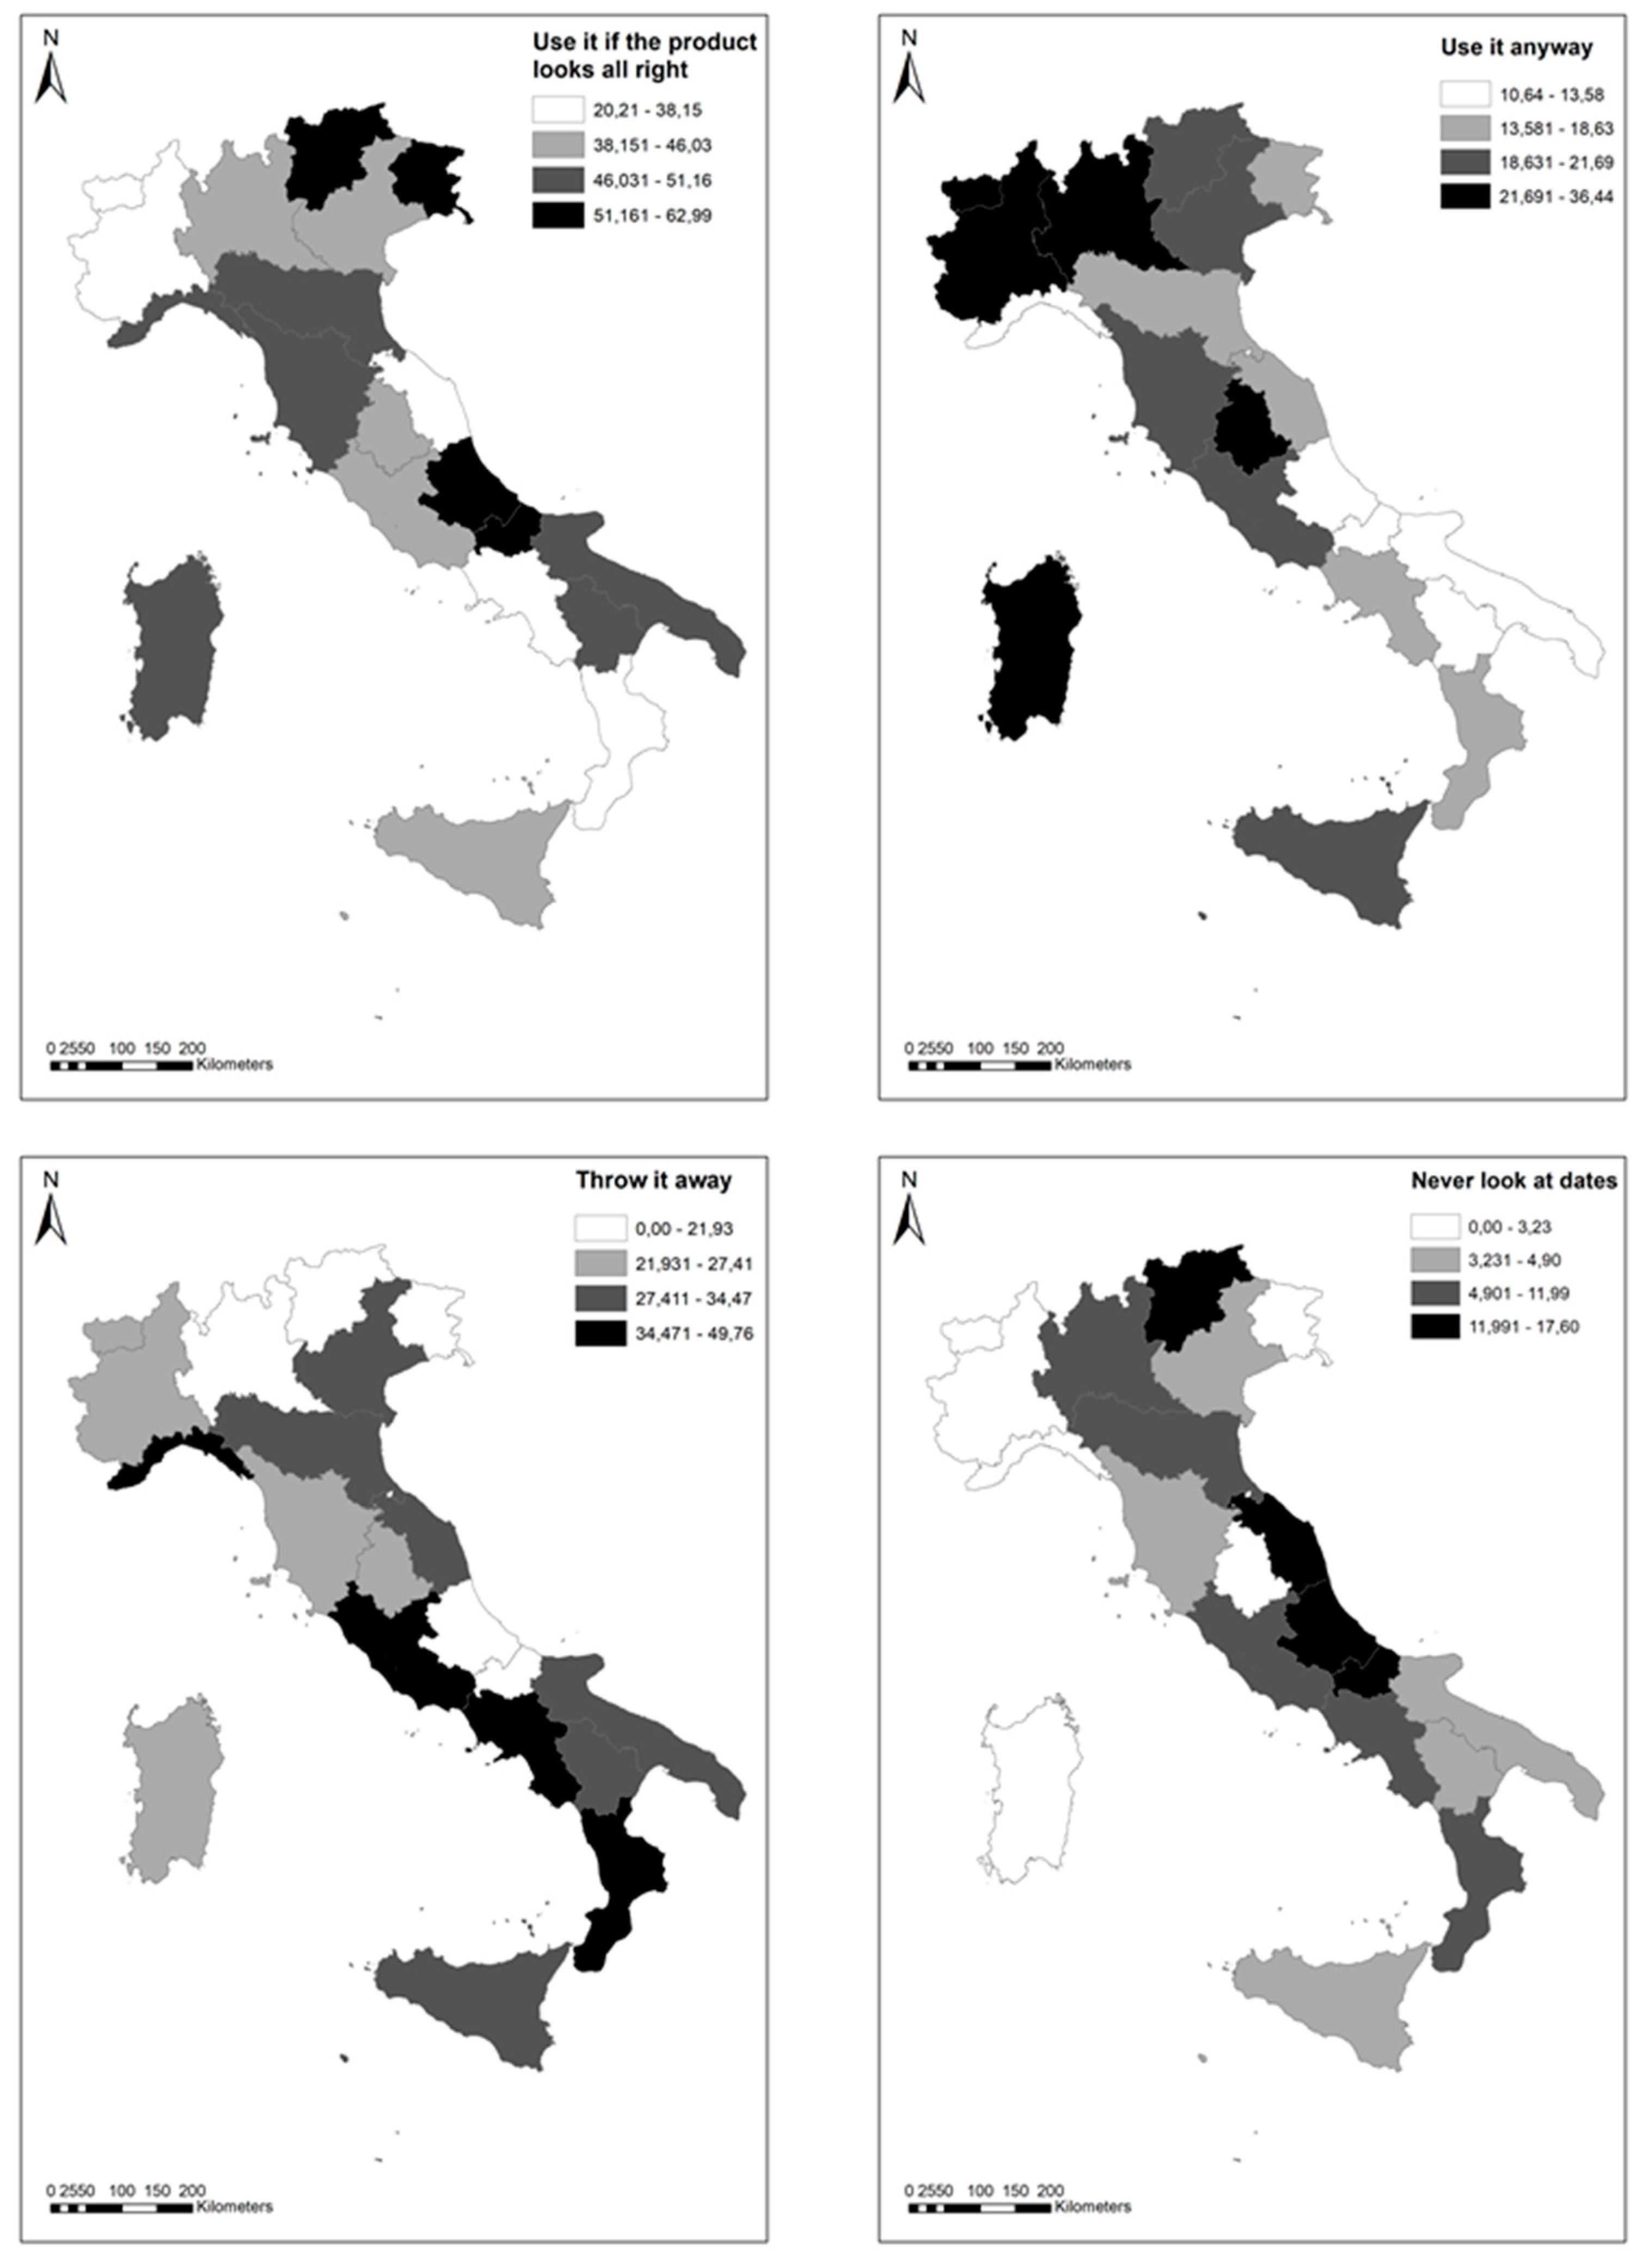
Figure 1 shows the distribution of responses across the Italian regions by distinguishing the situations (by reading the cartograms from the top left to the bottom right): (a) you would use it only if the packaging is not damaged and the product looks all right; (b) you would use it anyway; (c) you would throw it away; (d) you never look at dates or don’t know.
In order to understand the cartograms reported in
Figure 1, it is important to note that the darker the color, the larger is the percentage of individuals it represents. For example, when focusing on the percentage of people who would use spaghetti anyway, the greatest percentage of individuals was found in Piedmont/Valle d’Aosta (36.44%), followed by individuals residing in Umbria (32%) and Lombardy (28.86%) while the lowest percentages—as the lightest color in the figure highlights—were found in Liguria (13.58%), Abruzzo/Molise (13.12%), and Puglia/Basilicata (10.64%). On the other hand, the highest percentages of people who would throw away the packet of spaghetti without a best before label were observed in Calabria (49.76%), Campania (40.82%), and Liguria (36.15%), while the most knowledgeable individuals were those residing in Trentino Alto Adige, where nobody declared that they would throw the pack of spaghetti away.
3.2.2. The Multinomial GME Estimation Results
The estimation results of the GME multinomial model reported in
Table 2 show the estimated coefficients, the related standard errors, and the significance level. As previously mentioned, a key issue in the multinomial framework is that the reported estimates referred to J-1 estimated models (with
J = 4 the number of the categories of the dependent variable), with one category/level chosen as referent group.
Table 1, below, shows the estimation results given the dependent variable “
If you found a package of spaghetti in your kitchen cupboard with no best before date indicated on the label and you could not remember when you bought it, what would you do?”, and the reference category “Use it anyway” to which the estimates were compared. Therefore, the parameter estimates for each outcome
J of the dependent variable are related to the referent group. As a result, the standard interpretation (for a continuous variable) of a generic estimated coefficient in the multinomial logit is that for a unit change in the studied covariate, the logit of outcome
J relative to the referent group is expected to change by its respective parameter estimate (which is in log-odds units), holding constant the other variables in the model. In order to facilitate the interpretation of the results, we computed the RRRs, which enabled us to obtain a measure of likelihood of each specific outcome compared to the referent outcome for each covariate in the regression models.
Before analyzing the estimation results, it is worth underlining that the estimated model revealed a reduction of uncertainty (distance from the uniform distribution) from the collected data as highlighted by the normalized entropy, equal to 0.8092 [
15]—used to assess the adequacy of the estimated model—and the pseudo-R
2, equal to 0.1908. Therefore, the selected model may help to explain the drivers and the profiles and behaviors of individuals concerning the different behaviors towards a product (package of spaghetti) without a best before date. Another diagnostic tool that characterizes the GME discrete choice estimator is the entropy ratio statistic (ERS = 261.8), which behaves like the likelihood ratio test by comparing the log-likelihood value of the unconstrained problem, which was equal to
(with
T the number of observations and
J the number of unordered discrete choice categories), with the same value observed for the constrained problem
1110.6.
Focusing on the estimated coefficient and the computed RRRs, the following results proved interesting for discussion.
Firstly, focusing on sociodemographic characteristics, and specifically regarding age, we found that older people were less likely to throw away products without best before dates. In fact, individuals aged 55 and over were less likely to consume a product without a best before label only if the packaging was not damaged and the product looked all right (RRR = 0.707) and the same results were obtained for the statement “you would throw it away” (RRR = 0.557). The interpretation of this result—as for all of the results in the estimated models—must consider the reference category for age (individuals aged 40–54) and the selected referent category for the outcome variable (“Use it anyway”). Moreover, the macro-regional context in which individuals reside was observed to be highly important. In fact, the possibility of wasting or throwing away a product without best before dates was higher in the southern Italian regions (RRR = 2.223 for the category “You would use it only if the packaging is not damaged and the product looks all right” and RRR = 3.142 for the category “You would throw it away”) compared to north-western regions. However, it is worth noting that all the macro-areas (north-east, center, and south, except for islands) had RRRs greater than 1, thus highlighting a higher likelihood of wasting a product without a best before dates compared to the north-western regions. Once again, as regards the macro-regional context, it was observed that people residing in southern regions were also more likely to not check expiration dates on products (RRR = 2.682). As regards household size, significant relationships were observed for a household of four or more people; individuals in these households were more likely to check the packaging and the state of the product in order to decide whether to eat it or not (RRR = 1.782). On the other hand, households composed of two individuals were more likely (RRR = 2.054) to throw away a product without a best before label compared than single person households.
Secondly, attitudinal variables were found to play an important role. Individuals who tried to minimize FW at home (i.e., by planning their shopping and meals better) or out-of-home (i.e., by checking/asking for smaller portion sizes in shops were those who were more likely to waste products (in our case the spaghetti) without best before labels (RRR = 1.401 and RRR = 1.775, respectively). On the other hand, people who asked for smaller portion sizes in shops were also those most likely to never check the expiry dates on products.
4. Discussion and Conclusions
Best before dates were first introduced by the EU in 1979 and even today, Italian consumers, as well as consumers in other European countries, are not sure of or cannot correctly interpret these labels on food products, as they confuse them with a true expiry date affecting the food safety of a product, like the use by date. Consequently, many consumers throw food away when they are uncertain whether it is safe to eat [
21]; the confusion and misunderstanding between the meanings of expiration dates has been recognized as one of the most important causes of FW [
9,
14,
22,
29,
30,
31].
Judging from the answers given during the FE survey (n = 425), the term “best before” is still very important, as it indicates when the quality of a product will start to decline. In fact, focusing on the Italian context, 69% of Italians said that they would miss the label (compared to an EU28 overall value of 44%), and the rest of the citizens required this information on some non-perishable products such as rice, pasta, coffee, or tea. A total 2% did not express an opinion on this statement.
The descriptive results of the FE 425 survey must first of all bring attention to the effects that a possible action aimed at removing the expiration date from some foods could have in terms of reduction of food waste. At this point, the research question on which our paper was based arises: How could any action in this area be implemented in every single country? Specifically, should the application be uniform within the macro-areas existing in each member country? Does the local context play an important role here too?
This survey gave us the opportunity to evaluate Italian consumers’—thus focusing on a single national context—reactions against an effective action represented by removing the expiry date from spaghetti. Considering those individuals who would still use the product even in the absence of the best before label and who would probably use their sensory skills (vision and smell) to evaluate the wholesomeness and safe-integrity of the product as a reference category, we analyzed the characteristics of those people who—in different percentages among the regional (macro) areas of Italy—would use the product only if the packaging seemed undamaged and the product seemed edible, rather than those who would who throw the spaghetti away in any case and those who never check expiry dates.
Our results can be addressed to the strategy to be pursued at an international level in order to halve FW by 2030, as envisaged by the European Union in the circular economy package [
31,
32], which is also one of the United Nations Sustainable Development Goals (SDG 12.3). Indeed, in this study, by referring to the results of the multinomial regression model, we sought to identify profiles (groups) of those individuals with whom it is necessary to intervene in order to correct any wasteful behavior, and the individuals who misunderstand the real meaning of the best before label.
The individuals who would throw away the product in any case if the expiry date (best before) was no longer expressed on the package proved to be mainly individuals under the age of 55, thus confirming that older people are more likely to use their sensory skills [
25] to determine the quality and safety of a product rather than checking expiry dates. Moreover, at the Italian national level these individuals mainly resided in southern Italian regions. However, it is important to note that the most valuable macro-area was represented by the north-west, since all the other macro-areas had higher RRR values (>1).
Those who would “conditionally” throw away a packet of spaghetti without an expiry date and only keep it if both the package seemed undamaged and the product seemed edible were those who reside in southern and north-eastern macro-areas, and were part of large families (households with four or more individuals), probably with children within the family nucleus that might make people more attentive towards expiry dates. To complete this profile, our results suggested that people who are concerned about FW pay more attention to packaging and product aesthetics. This result may confirm that consumers who are aware of FW have a better attitude towards it [
8,
9,
33,
34], try to plan their shopping better [
17,
31,
34,
35], and are ready to ask for smaller portions when they go out for lunch or dinner [
16,
36].
The analysis at the national level once again highlighted the existence of differences in behavior towards FW across countries (specifically, in this study, the differences observed between Italian people and the overall EU28) and, even more importantly, the validity and strong need to carefully consider the territorial dimension (at the maximum level of disaggregation, compatibly with the statistical significance of the results) in the analyses, as underlined by Secondi et al. [
9], for the inclusion of this dimension in explaining of the variability associated with this type of behavior, and by Corrado et al. [
4] with regard to the need for surveys and statistical surveys which give the chance to policy-makers of taking decisions locally or at a greater level of disaggregation, going deeper up to the municipality level. At these levels of disaggregation (European LAU-1 or LAU-2 levels), non-parametric estimators—such as the GME estimator used in this study—can offer further valuable advantages.
Furthermore, our results different ways of applying a hypothetical removal of expiry dates within a single country. For example, having identified different behaviors at the regional macro-area level—also confirmed by the estimated regression model—the practical suggestion for policy-makers could be to first implement targeted preliminary actions (information and awareness-raising campaigns) on the role of expiry dates and on their actual meaning in specifically selected areas—i.e., the groups living in those regions where an incorrect behavior is expected to be observed. Only after having bridged this information gap should the best before date be eliminated from products, therefore hopefully leading to an effective result of this concrete action in reducing FW.
Further research should be carried out in order to pursue these objectives in terms of both understanding the drivers linked to FW, and in terms of statistical methodology capable of providing a correct and proper interpretation of these phenomena. However, this study could be the basis for the implementation of effective policies on which to apply impact assessments. At the same time, the stimulus towards uniform investigations and surveys, thus respecting the coherence and comparability dimensions of the statistical information provided by Eurostat, and implemented to ensure statistical significance at local level—for example by using small area estimation (SAE) methods—could be one of the next FW reduction targets to be achieved using a bottom-up strategy, that is, by considering the local level as being capable of reducing the overall amount of FW generated.


