Subtractive Building Massing for Performance-Based Architectural Design Exploration: A Case Study of Daylighting Optimization


Abstract
:1. Introduction
Parametric Modelling for Building Massing Design
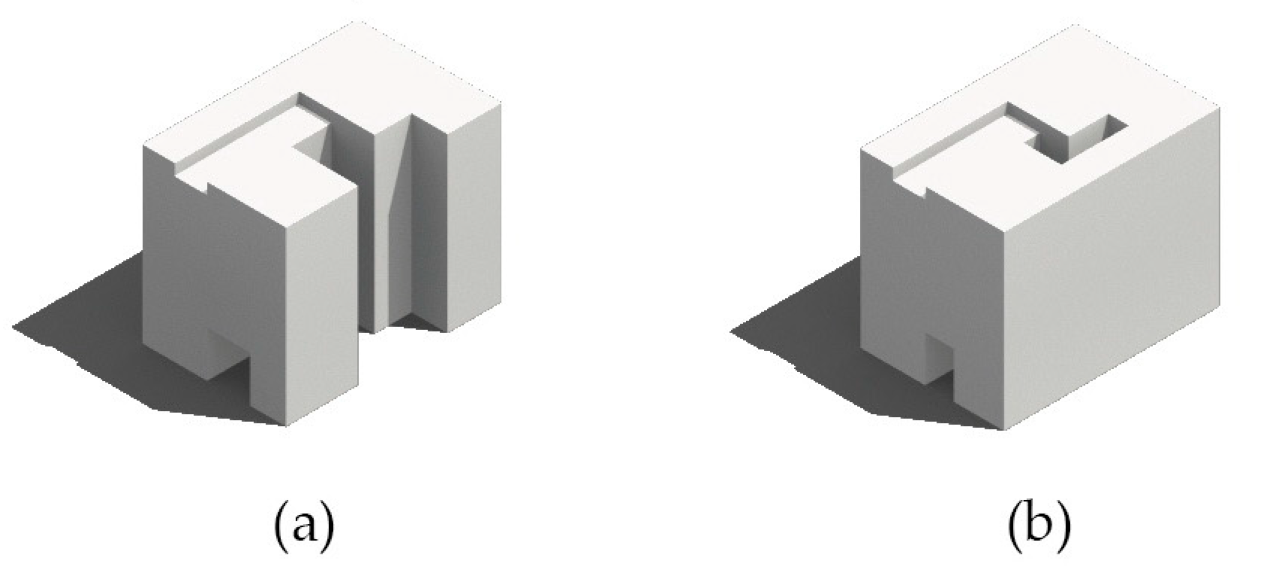
- First, the subtractive form generation principle is one of the most generic and widely applied massing strategies in architecture. This strategy can fit many different common types of building designs [4]. Using this principle ensures that, with simple constraints, most of the building massings generated have acceptable and reasonable architectural features. In addition, by removing different parts from a predefined building volume, the subtracted building massing can show great topological variability. These two advantages can efficiently overcome the weaknesses identified above.
- Second, many passive energy-saving strategies for building massing design, such as courtyards, stilts, and solar envelopes, can be schematically described as removing (subtracting) parts from a building block [3,35], which complies with the subtractive form generation principle. Thus, with different parts removed, the subtracted building massing can be recognized as different combinations and arrangements of these passive energy-saving strategies imposed in the building massing design.
- Third, the subtractive form generation approach allows for easy customization of the types of building design features that are generated. Architects can tune the types of features by adjusting various global parameters associated with the subtractors. For example, such parameters may include the size, position, and number of subtracting parts.
2. Methods
2.1. Overview of Proposed Algorithm
2.2. Generative Steps
2.2.1. Subtractor Initialization
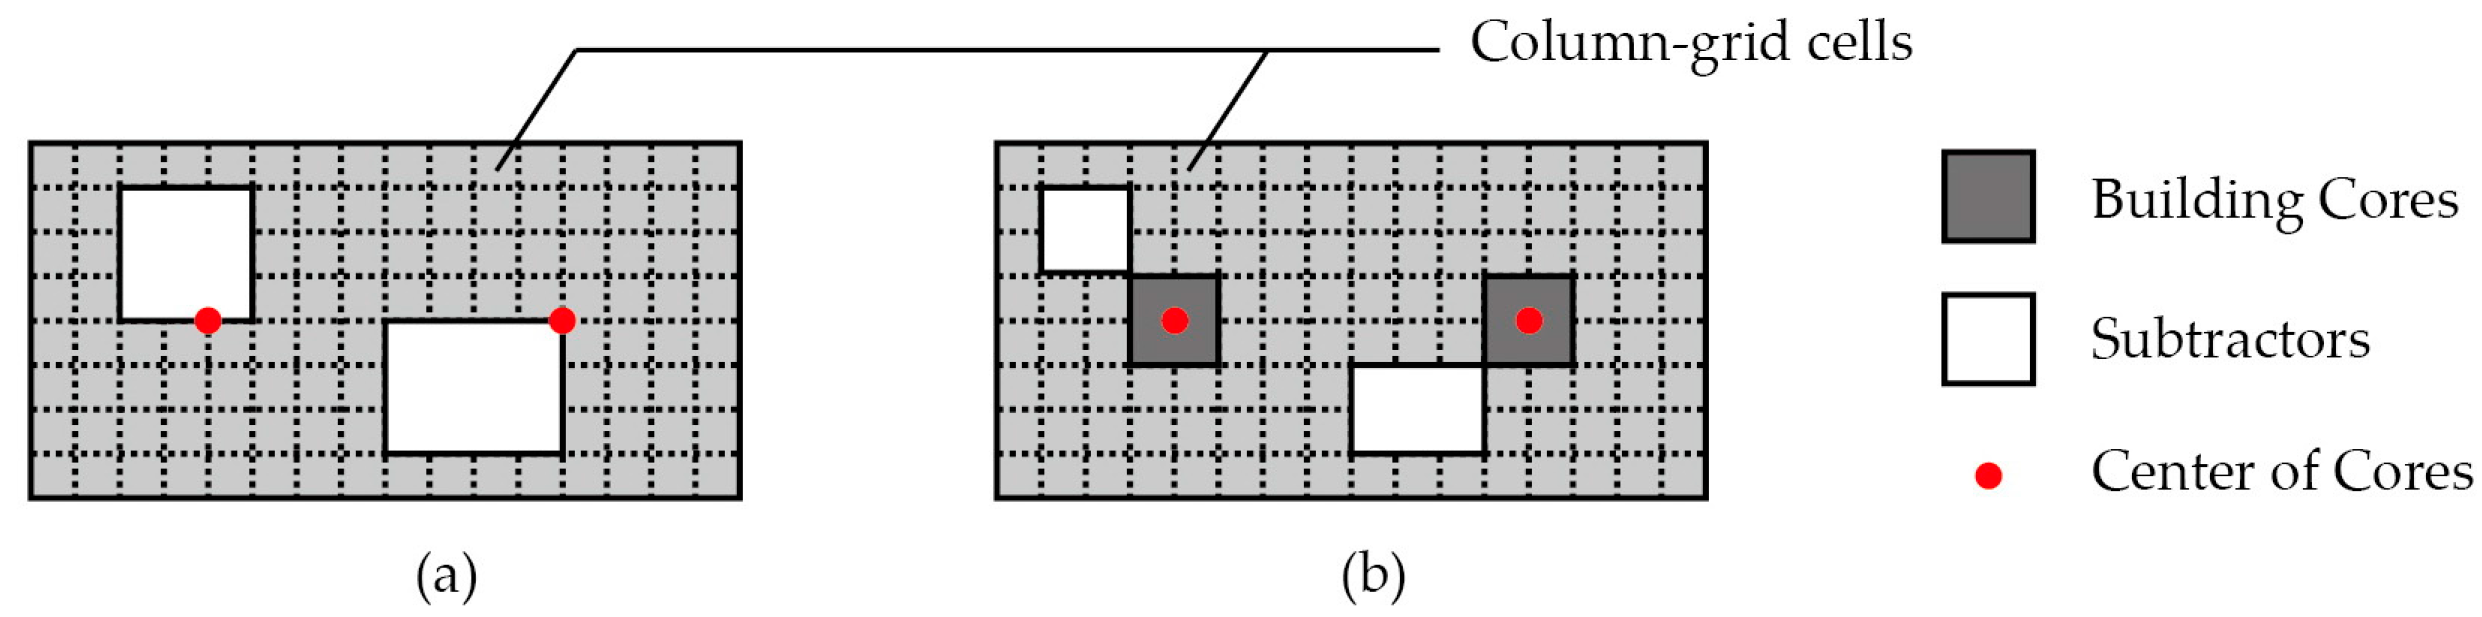
2.2.2. Subtractor Constraints
2.2.3. Subtractor Alignment
2.2.4. Building Cores
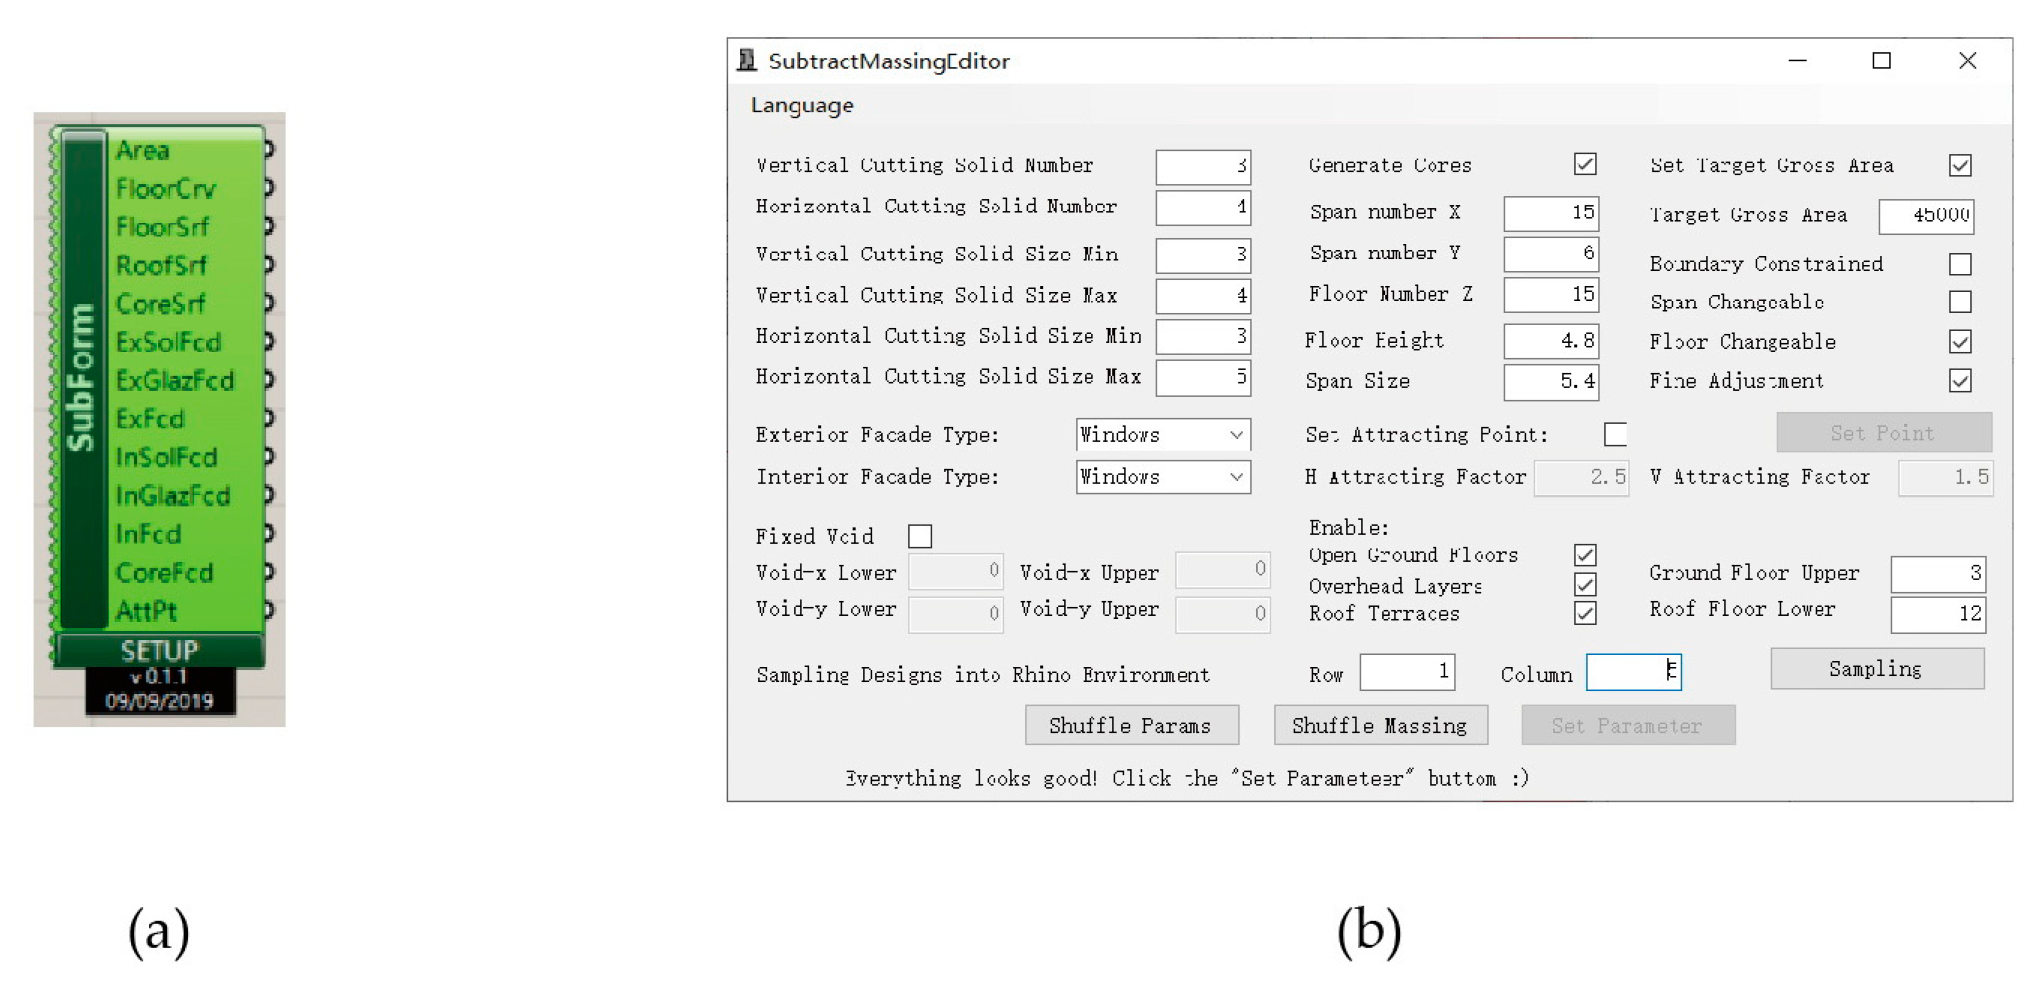
2.3. Implementation
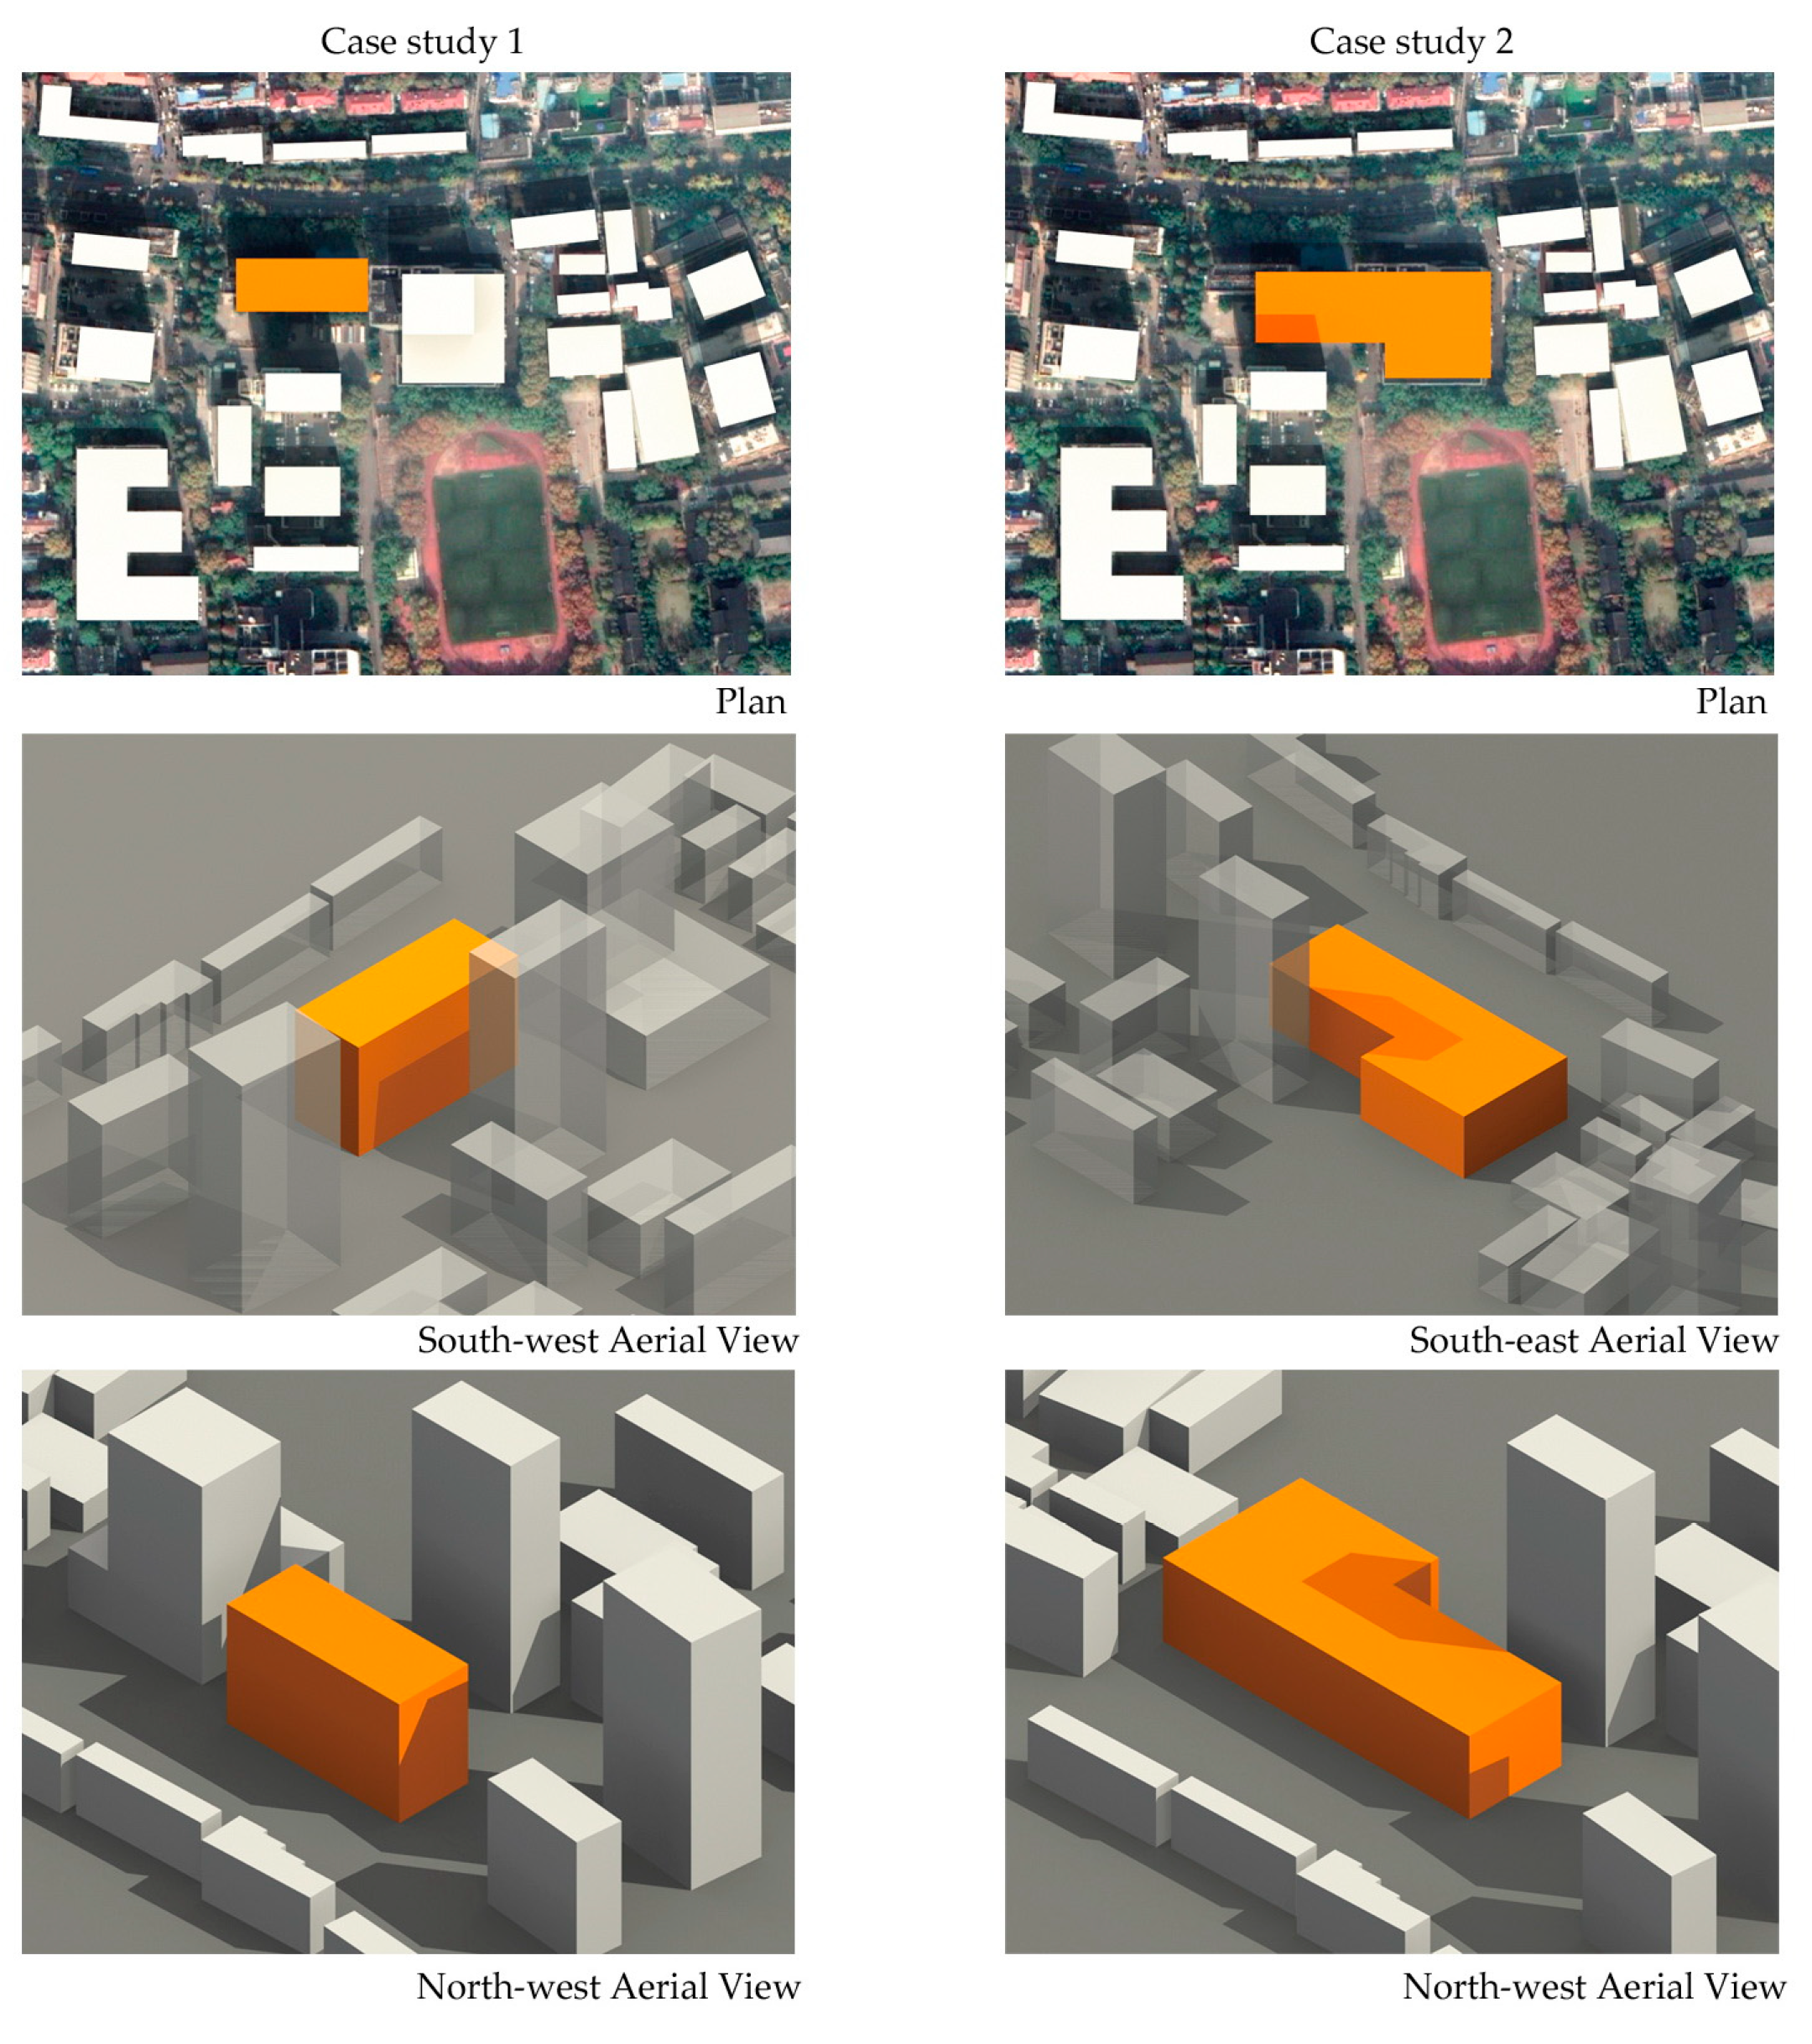
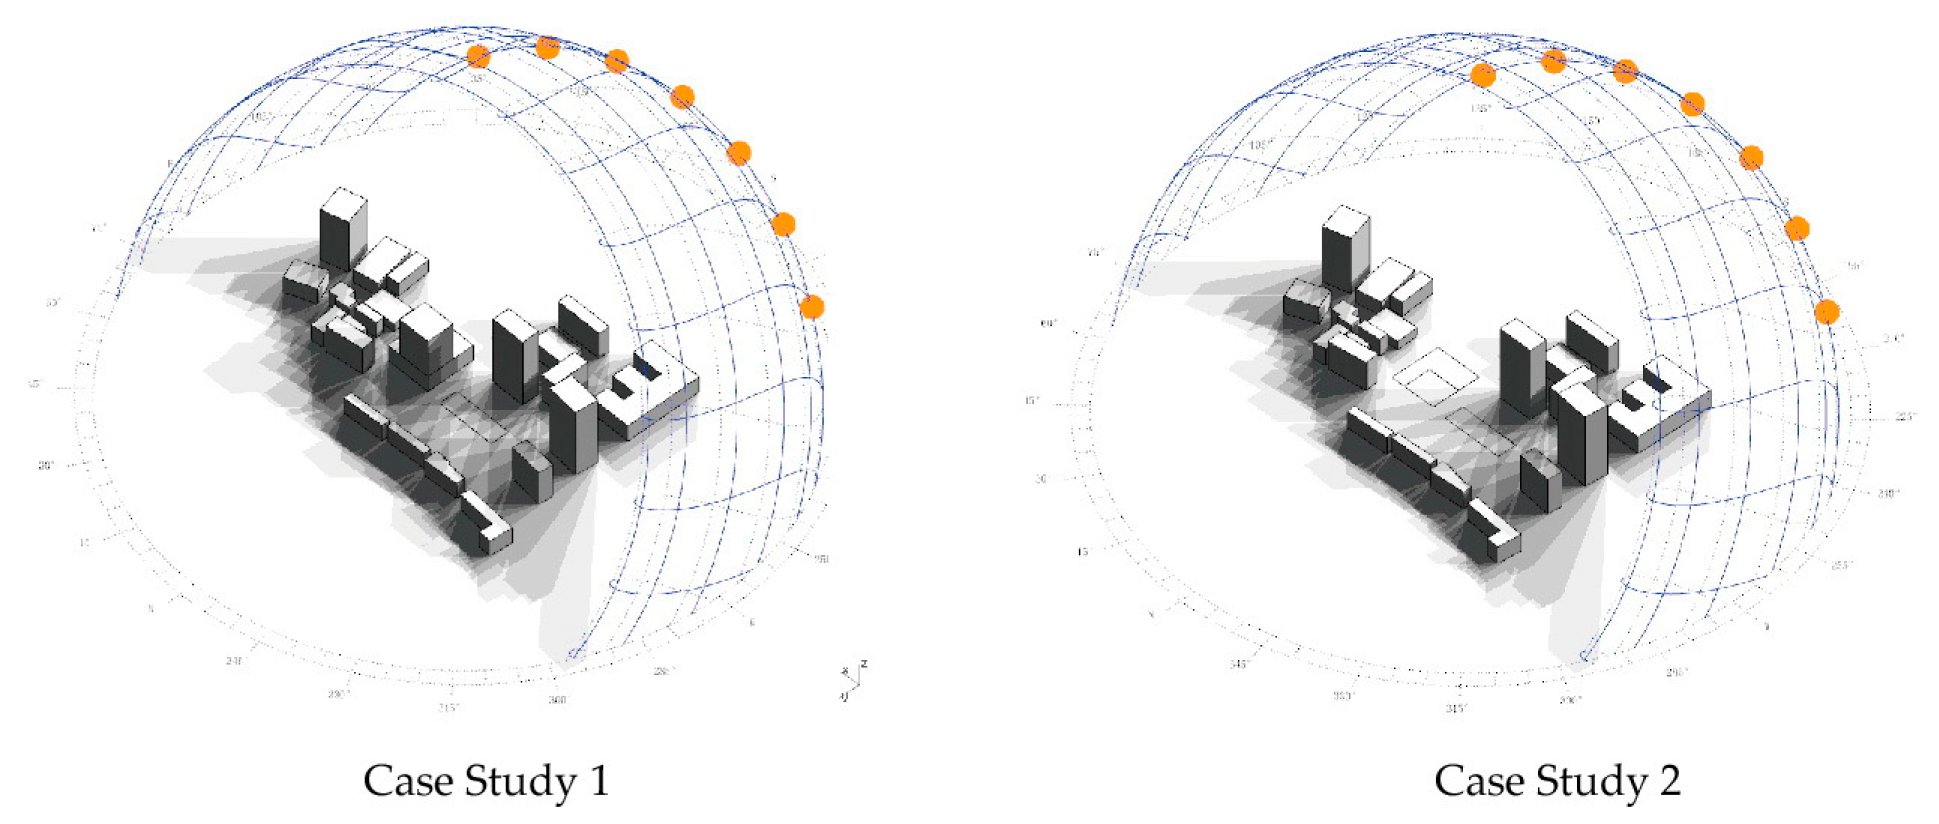
2.4. Case Studies
2.4.1. Design Setting
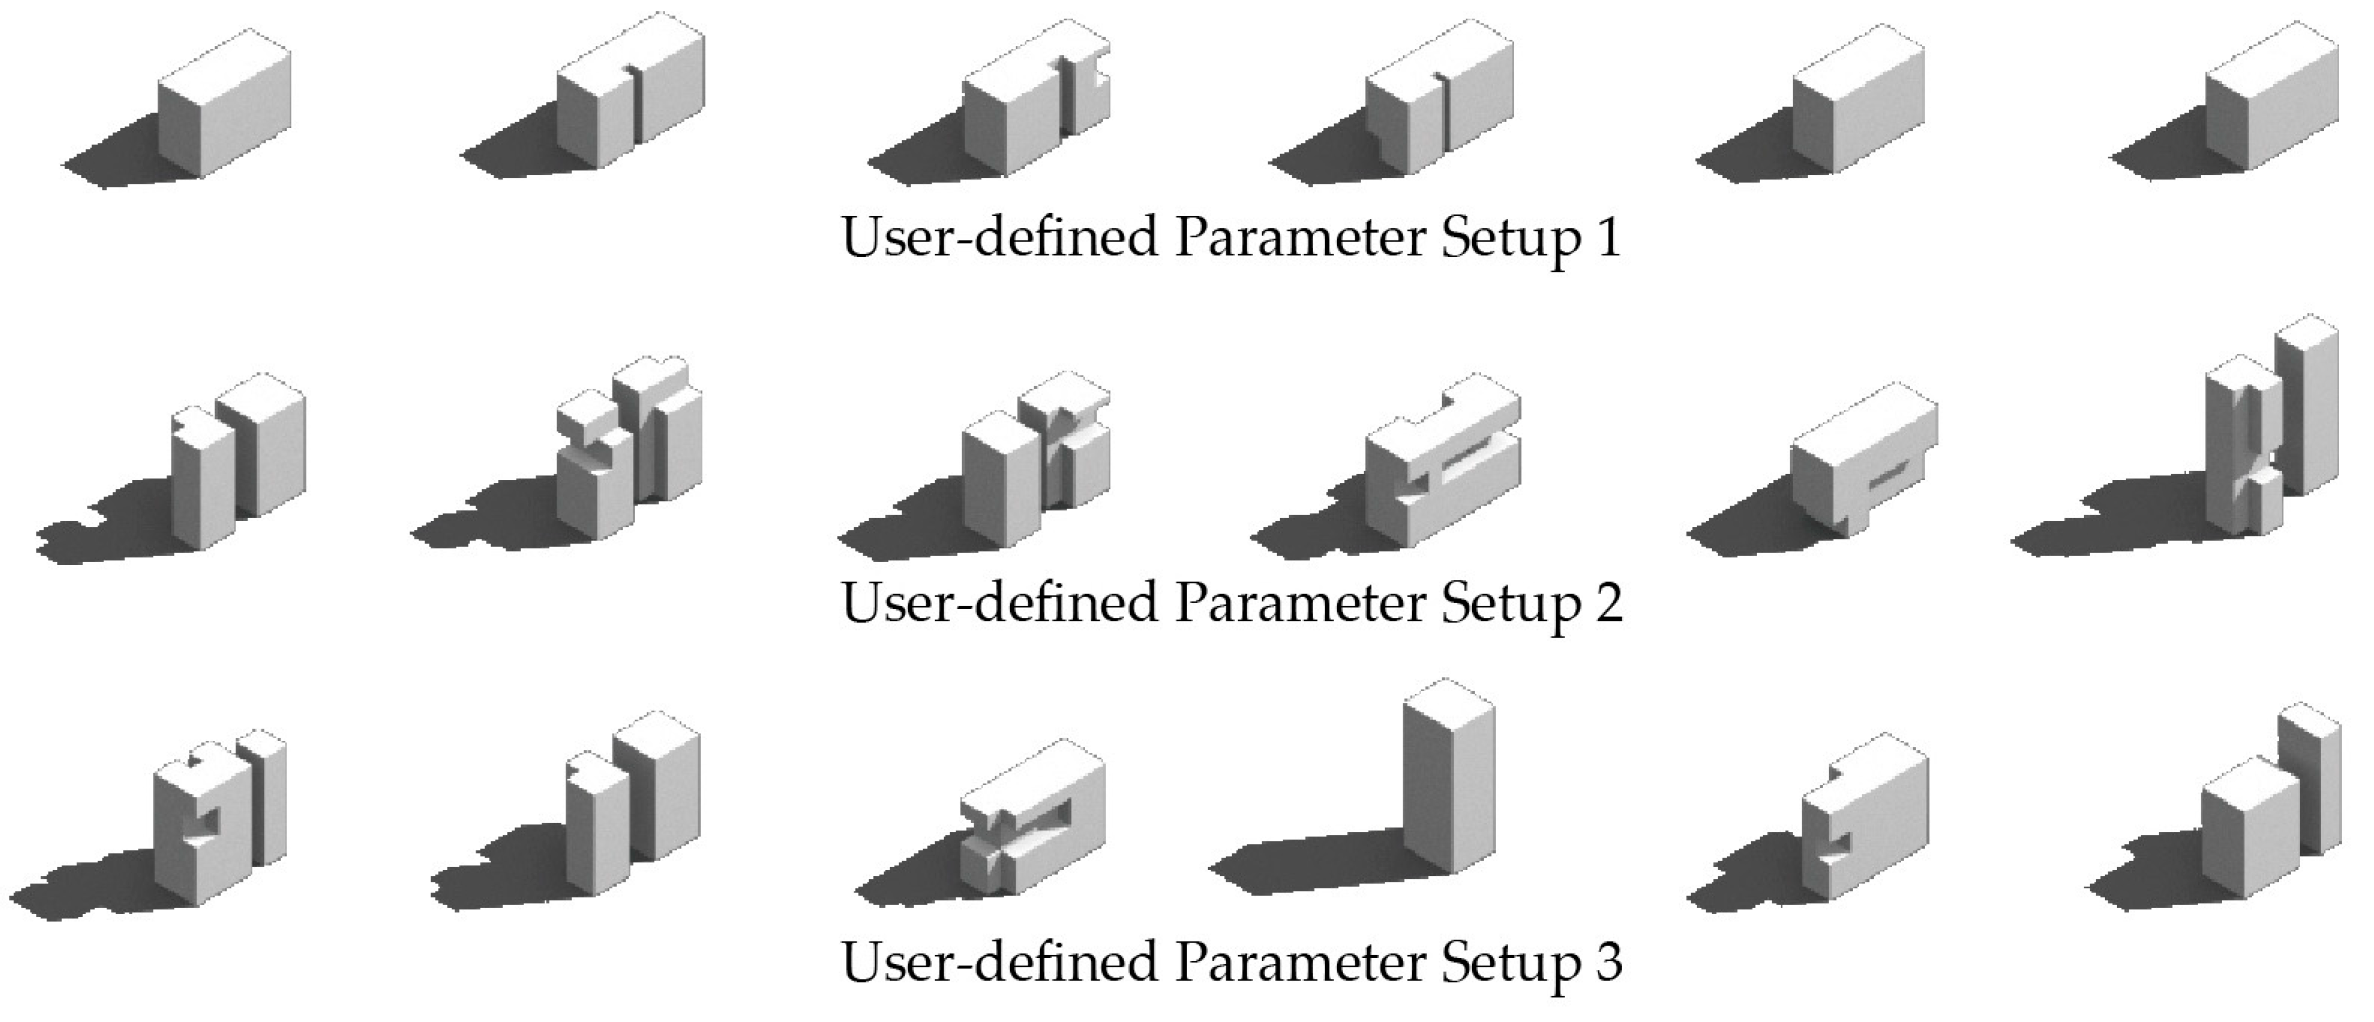
2.4.2. Initialization Parameters
3. Results
3.1. Case Study 1
3.2. Case Study 2
4. Discussion
- More complex shapes for the maximal volume beyond box-like masses to make possible combinations, such as towers and podiums and non-orthogonal geometries.
- Provide more practical user-defined constraints to regulate the overall building massing, such as maximum height, width, and length of the building massing.
- Provide additional placement strategies of building cores, such as placing the cores at corners rather than in the center of the building.
5. Conclusions
Author Contributions
Funding
Acknowledgments
Conflicts of Interest
References
- Shi, X. Performance-Based and Performance-Driven Architectural Design and Optimization. Front. Archit. Civ. Eng. China 2010, 4, 512–518. [Google Scholar] [CrossRef]
- Kolarevic, B.B.; Malkawi, A. Performative Architecture: Beyond Instrumentality; Spon Press: New York, NY, USA, 2005. [Google Scholar]
- DeKay, M.; Brown, G.Z. Sun, Wind, and Light: Architectural Design Strategies, 2nd ed.; John Wiley & Sons: Hoboken, NJ, USA, 2014. [Google Scholar]
- Simitch, A.; Warke, V. The Language of Architecture: 26 Principles Every Architect Should Know; Rockport Pub: Beverly, MA, USA, 2014. [Google Scholar]
- McMullan, R. Environmental Science in Building, 4th ed.; Palgrave Macmillan Education: London, UK, 1998. [Google Scholar]
- Nault, E.; Waibel, C.; Carmeliet, J.; Andersen, M. Development and Test Application of the UrbanSOLve Decision-Support Prototype for Early-Stage Neighborhood Design. Build. Environ. 2018, 137, 58–72. [Google Scholar] [CrossRef] [Green Version]
- Yi, Y.K.; Malkawi, A.M. Site-Specific Optimal Energy Form Generation Based on Hierarchical Geometry Relation. Autom. Constr. 2012, 26, 77–91. [Google Scholar] [CrossRef]
- Turrin, M.; Von Buelow, P.; Stouffs, R. Design Explorations of Performance Driven Geometry in Architectural Design Using Parametric Modeling and Genetic Algorithms. Adv. Eng. Inform. 2011, 25, 656–675. [Google Scholar] [CrossRef]
- Woodbury, R.F.; Burrow, A.L. Whither Design Space? AIE EDAM Artif. Intell. Eng. Des. Anal. Manuf. 2006, 20, 63–82. [Google Scholar] [CrossRef]
- Dino, I.G. Creative Design Exploration by Parametric Generative Systems in Architecture. Metu J. Fac. Arch. 2012, 29, 207–224. [Google Scholar] [CrossRef]
- Touloupaki, E.; Theodosiou, T. Performance Simulation Integrated in Parametric 3D Modeling as a Method for Early Stage Design Optimization—A Review. Energies 2017, 10, 637. [Google Scholar] [CrossRef] [Green Version]
- Shi, X.; Tian, Z.; Chen, W.; Si, B.; Jin, X. A Review on Building Energy Efficient Design Optimization from the Perspective of Architects. Renew. Sustain. Energy Rev. 2016, 65, 872–884. [Google Scholar] [CrossRef]
- Wortmann, T. Efficient, Visual, and Interactive Architectural Design Optimization with Model-Based Methods. PhD Thesis, Singagore University of Technology and Design, Singapore, 2018. [Google Scholar] [CrossRef]
- Janssen, P. Dexen: A Scalable and Extensible Platform for Experimenting with Population-Based Design Exploration Algorithms. AI EDAM 2015, 29, 443–455. [Google Scholar] [CrossRef]
- Kyropoulou, M.; Ferrer, P.; Subramaniam, S. Optimization of Intensive Daylight Simulations: A Cloud-Based Methodology Using HPC (High Performance Computing). In Proceedings of the PLEA 2018 HONG KONG Smart and Healthy within the 2-Degree Limit, Hong Kong, China, 10–12 December 2018; pp. 150–155. [Google Scholar]
- Wortmann, T.; Nannicini, G. Introduction to Architectural Design Optimization. In City Networks: Collaboration and Planning for Health and Sustainability; Karakitsiou, A., Migdalas, A., Rassia, S.T., Pardalos, P.M., Eds.; Springer International Publishing: Cham, Switzerland, 2017; pp. 259–278. [Google Scholar] [CrossRef]
- Burry, M.; Murray, Z. Architectural Design Based on Parametric Variation and Associative Geometry. In Proceedings of the 15th eCAADe Conference Proceedings, Vienna, Austria, 17–20 September 1997; ISBN 0-9523687-3-0. [Google Scholar]
- Oxman, R. Thinking Difference: Theories and Models of Parametric Design Thinking. Des. Stud. 2017, 52, 4–39. [Google Scholar] [CrossRef]
- Harding, J.E.; Shepherd, P. Meta-Parametric Design. Des. Stud. 2017, 52, 73–95. [Google Scholar] [CrossRef] [Green Version]
- Caldas, L.; Santos, L. Generation of Energy-Efficient Patio Houses With GENE_ARCH. eCAADe 30 2012, 1, 459–470. [Google Scholar]
- Chen, K.W.; Janssen, P.; Schlueter, A. Multi-Objective Optimization of Building Form, Envelope and Cooling System for Improved Building Energy Performance. Autom. Constr. 2018, 94, 449–457. [Google Scholar] [CrossRef]
- Chen, K.W.; Choo, T.S.; Norford, L. Enabling Algorithm-Assisted Architectural Design Exploration for Computational Design Novices. Comput. Des. Appl. 2019, 16, 269–288. [Google Scholar] [CrossRef]
- Wang, L.; Janssen, P.; Ji, G. Progressive Modelling for Parametric Design Optimization: An Example of How Parametric Design Optimization Can Support Reflection. In Proceedings of the 24th CAADRIA Conference, Wellington, New Zealand, 15–18 April 2019; pp. 383–392. [Google Scholar]
- Chen, K.W. Architectural Design Exploration of Low-Exergy (LowEx) Buildings in the Tropics. Ph.D. Thesis, ETH Zurich, Switzerland, 2015. [Google Scholar]
- Xu, X.; Yin, C.; Wang, W.; Xu, N.; Hong, T.; Li, Q. Revealing Urban Morphology and Outdoor Comfort through Genetic Algorithm-Driven Urban Block Design in Dry and Hot Regions of China. Sustainability 2019, 11, 3683. [Google Scholar] [CrossRef] [Green Version]
- Si, F.; Wang, T. Building Massing Optimization in Early de Sign Stage. In Proceedings of the 20th International Conference of the Association for Computer-Aided Architectural Design Research in Asia, Daegu, Korea, 20–22 May 2015; pp. 583–592. [Google Scholar]
- Janssen, P. A Generative Evolutionary Design Method. Digit. Creat. 2006, 17, 49–63. [Google Scholar] [CrossRef]
- Wang, L.; Janssen, P.; Ji, G. Utility of Evolutionary Design in Architectural Form Finding: An Investigation into Constraint Handling Strategies. In International Conference on-Design Computing and Cognition; Springer International Publishing: Cham, Switzerland, 2019; pp. 177–194. [Google Scholar] [CrossRef]
- Stouffs, R.; Janssen, P.; Roudavski, S. An Evolutionary Design Process: Adaptive-Iterative Explorations in Computational Embryogenesis Vignesh. In Proceedings of the 18th International Conference on Computer-Aided Architectural Design Research in Asia (CAADRIA 2013), Singapore, 15–18 May 2013; pp. 137–146. [Google Scholar]
- Yi, H. User-Driven Automation for Optimal Thermal-Zone Layout during Space Programming Phases. Arch. Sci. Rev. 2016, 59, 279–306. [Google Scholar] [CrossRef]
- Yi, H.; Yi, Y.K. Performance Based Architectural Design Optimization: Automated 3D Space Layout Using Simulated Annealing. In Proceedings of the 2014 ASHRAE/IBPSA-USA Building Simulation Conference, Atlanta, GA, USA, 10–12 September 2014; pp. 292–299. [Google Scholar]
- Cichocka, J.; Browne, W.N.; Ramirez, E.R. Optimization in the Architectural Practice An International Survey. In Proceedings of the 22nd CAADRIA Conference, Suzhou, China, 5–8 April 2017; pp. 387–397. [Google Scholar]
- Janssen, P. A Design Method and Computational Architecture for Generating and Evolving Building Designs. PhD Thesis, The Hong Kong Polytechnic University, Hong Kong, China, 2005. [Google Scholar]
- Woodbury, R. Elements of Parametric Design; Routledge: Abingdon, UK, 2010. [Google Scholar]
- Akin, O.; Moustapha, H. Strategic Use of Representation in Architectural Massing. Des. Stud. 2004, 25, 31–50. [Google Scholar] [CrossRef]
- Wortmann, T. Architectural Design Optimization-Results from a User Survey. In Proceedings of the Architecture Across Boundaries 2019, Suzhou, China, 19–21 June 2019; CKnE Social Sciences: Dubai, UAE. [Google Scholar] [CrossRef]
- Wang, L.; Janssen, P.; Ji, G. Diversity and Efficiency: A Hybrid Evolutionary Algorithm Combining the Island Model with a Steady-State Replacement Strategy. In Proceedings of the 24th CAADRIA Conference, Wellington, New Zealand, 15–18 April 2019; pp. 593–602. [Google Scholar]
- Sun, Y.; Turrin, M.; Sariyildiz, S.; Ren, S.; Yang, D. Multi-Disciplinary and Multi-Objective Optimization Problem Re-Formulation in Computational Design Exploration: A Case of Conceptual Sports Building Design. Autom. Constr. 2018, 92, 242–269. [Google Scholar] [CrossRef]
- Jakubiec, J.A.; Reinhart, C.F. DIVA 2.0: Integrating Daylight and Thermal Simulations Using Rhinoceros 3D, Daysim and EnergyPlus. Proc. Build. Simul. 2011, 20, 2202–2209. [Google Scholar]
- Raji, B.; Tenpierik, M.J.; van den Dobbelsteen, A. Early-Stage Design Considerations for the Energy-Efficiency of High-Rise Office Buildings. Sustainability 2017, 9, 623. [Google Scholar] [CrossRef] [Green Version]
- Yi, Y.K.; Malkawi, A.M. Optimizing Building Form for Energy Performance Based on Hierarchical Geometry Relation. Autom. Constr. 2009, 18, 825–833. [Google Scholar] [CrossRef]
- Cao, K.; Huang, B.; Wang, S.; Lin, H. Sustainable Land Use Optimization Using Boundary-Based Fast Genetic Algorithm. Comput. Environ. Urban Syst. 2012, 36, 257–269. [Google Scholar] [CrossRef]
- Dogan, T.; Reinhart, C.; Michalatos, P. Autozoner: An Algorithm for Automatic Thermal Zoning of Buildings with Unknown Interior Space Definitions. J. Build. Perform. Simul. 2016, 9, 176–189. [Google Scholar] [CrossRef]
- Wang, X.Y.; Yang, Y.; Zhang, K. Customization and Generation of Floor Plans Based on Graph Transformations. Autom. Constr. 2018, 94, 405–416. [Google Scholar] [CrossRef]
- Bradner, E.; Iorio, F.; Davis, M. Parameters Tell the Design Story: Ideation and Abstraction in Design Optimization. Simul. Ser. 2014, 46, 172–197. [Google Scholar]
- Okudan, G.E.; Tauhid, S. Concept Selection Methods—A Literature Review from 1980 to 2008. Int. J. Des. Eng. 2008, 1, 243. [Google Scholar] [CrossRef]


| Number of Subtractors | Size Constraint | |||
|---|---|---|---|---|
| Vertical Subtractors | Horizontal Subtractors | Vertical Subtractors | Horizontal Subtractors | |
| Setup 1 | 2 | 3 | [2, 3] | [2, 3] |
| Setup 2 | 3 | 4 | [3, 4] | [3, 5] |
| Setup 3 | 4 | 5 | [3, 5] | [3, 5] |
© 2019 by the authors. Licensee MDPI, Basel, Switzerland. This article is an open access article distributed under the terms and conditions of the Creative Commons Attribution (CC BY) license (http://creativecommons.org/licenses/by/4.0/).
Share and Cite
Wang, L.; Janssen, P.; Chen, K.W.; Tong, Z.; Ji, G. Subtractive Building Massing for Performance-Based Architectural Design Exploration: A Case Study of Daylighting Optimization. Sustainability 2019, 11, 6965. https://doi.org/10.3390/su11246965
Wang L, Janssen P, Chen KW, Tong Z, Ji G. Subtractive Building Massing for Performance-Based Architectural Design Exploration: A Case Study of Daylighting Optimization. Sustainability. 2019; 11(24):6965. https://doi.org/10.3390/su11246965
Chicago/Turabian StyleWang, Likai, Patrick Janssen, Kian Wee Chen, Ziyu Tong, and Guohua Ji. 2019. "Subtractive Building Massing for Performance-Based Architectural Design Exploration: A Case Study of Daylighting Optimization" Sustainability 11, no. 24: 6965. https://doi.org/10.3390/su11246965