Article

Can the Famous University Experience of Top Managers Improve Corporate Performance? Evidence from China

UNEP-Tongji Institute of Environment for Sustainable Development, School of Economics and Management, Tongji University, Shanghai 200092, China
*
Author to whom correspondence should be addressed.
Sustainability 2019, 11(24), 6975; https://doi.org/10.3390/su11246975
Submission received: 1 November 2019 / Revised: 1 December 2019 / Accepted: 4 December 2019 / Published: 6 December 2019

Abstract

:
With the continuous improvement of China’s overall education level, the number of top managers with famous university experience in listed companies has been increasing. The question then becomes whether the performance of the listed companies is better if there are more top managers with famous university experience in the top management team (TMT). Based on the sample of listed companies in China from 2008 to 2018, we adopted the two-way fixed effect model and panel propensity score matching (Panel-PSM) methodology to examine the impact of top managers with famous university experience on corporate performance and its mechanism. We found that the higher the proportion of top managers with famous university experience in the TMT, the better the corporate performance will be, and this positive effect is larger in companies with high business complexity. We also found that this effect is mediated by overconfidence of the TMT. The proportion of top managers with famous university experience in the TMT will inhibit the overconfidence of the TMT, which will ultimately benefit corporate performance.

1. Introduction

Companies are profit-oriented organizations whose core function is creating value. There are many potential factors affecting corporate performance, which can be summarized as external governance environment [1,2], internal governance mechanisms [3,4,5] and micro-level factors [6,7]. In recent years, the relationship between individual experience of top managers and corporate performance has received great attention. It is well accepted that top managers, who are responsible for the planning, organization, leadership and control of corporate material and non-material resources, play an essential role in the operation and management of the enterprise [8]. Compared with listed companies in developed countries, the ownership of listed companies in China is relatively centralized [9], which has a strengthening effect on the discretion of top managers, and therefore, enlarges their power in decision-making. In other words, the influence of personal characteristics (experience, personality etc.) of top managers on corporate performance is enlarged in China.
Upper echelons theory reveals the theoretical framework of the relationship between the personal cognition of top managers, the strategic choice of companies and corporate performance [10,11]. Experience and demographic characteristics are effective indicators, as the cognition of top managers is difficult to observe directly. It is an effective way to reveal the black box of “cognition-corporate performance” to investigate the role of the experience and background characteristics of top managers in shaping cognition. The famous university experience is one of the characteristics of top managers’ educational background.
Existing literature has proven the relationship between top managers’ educational level [12,13], professional background [14,15], overseas study background [16,17], overseas academic experience [18,19] and corporate performance. However, there are relatively few studies are devoted to the impact of the famous university experience of top managers on corporate performance, as well as to its mechanism, most of which are based on the American education system and listed companies [20]. According to the various levels of national support, universities in China can be divided into diverse hierarchies, such as “985 project” universities. Educational resources are allocated differently on the basis of distinct hierarchies. The higher the hierarchies of universities are, the more inclined the national policies will be, and the more educational resources will be obtained [21]. Compared with ordinary universities, the number of “985 project” universities is limited and the admission threshold is higher. For Chinese students, being able to enter “985 project” universities requires them to win in the fierce competition of college entrance examination. Concurrently, top managers who succeed in entering famous universities will then acquire more abundant educational resources and gain platform advantages. As the top managers with the famous universities experience, not only will their success in entering famous universities through fierce competition in college entrance examination have a crucial impact on their psychological state, skill accumulation and social capital accumulation, but also their study experience will have an important impact on these aspects. Chakravarty examined the influence of the Indian Joint Entrance Examination (JEE) on corporate directors; he found that the early education experience had a strong shaping effect on the individual’s psychological state and ability [22]. Generally speaking, Indian students admitted to “famous universities” had a more positive psychological state, and were more likely to show overconfidence in their future work.
Overconfidence refers to the psychological deviation that people tend to overestimate the probability of their success and underestimate the probability of their failure. According to behavioral finance theory, overconfident managers are inclined to overestimate their abilities, which encourage them to make more optimistic financial plans. Heaton paid attention to the relationship between overconfidence of managers and the corporate financial strategy [23]. He believed that overconfident managers would overestimate the returns of the investment projects they chose. Even if managers were loyal to shareholders, they would still invest in the projects with negative net present value (NPV). A series of studies have indicated that overconfidence of top managers is highly correlated with corporate financial decision-making [24], such as investment and financing decisions [25,26,27], capital structure decisions [28,29], cash holding decisions [30], acquisition decisions [31,32,33] and dividend distribution decisions [34,35]. Overconfidence of top managers will influence corporate performance by affecting the choice of corporate financial strategy [36,37,38].
Contradictory findings have appeared in the literature regarding the relationship between overconfidence and corporate performance. Hackbarth have pointed out that overconfident managers prefer higher debt levels, which are conducive to alleviating agency problems, restraining the “tunneling” behavior of management, and reducing conflicts between management and shareholders, thus increasing corporate value [28]. Nevertheless, based on agency cost theory and asymmetric information, Heaton proved that overconfidence of managers will damage corporate performance [24].
We raised and explored three questions: (1) Can the famous university experience of top managers improve corporate performance? (2) What is the mechanism of this effect? (3) What circumstances can change the influence of the relationship between famous university experience of top managers and corporate performance? Based on the sample of listed companies in Shanghai and Shenzhen Stock Exchanges from 2008 to 2018, we took the experience of top managers in famous universities as a factor characterizing their cognitive psychological characteristics. We found that the top managers who were admitted to and studied in famous universities may have more positive psychological state than their peers, which can be seen from their overconfidence. This underlying psychological state, overconfidence, may affect the strategic decision-making of top managers in the future, and thus, affect corporate performance. Furthermore, we distinguished between high and low business complexity companies, and found the positive relationship between famous university experience and corporate performance is stronger in companies with high business complexity.
Our study contributes to the literature as follows. First, this paper examines how the education background of top managers affects corporate performance from a new perspective. When it comes to top managers’ education background, previous studies have focused extensively on their professional, academic and studying-abroad experience. We highlight the significant role of famous university experience, which fills in a research gap. Moreover, this paper examines whether the famous university experience of top managers can be regarded as the source of overconfidence, which contributes to the behavioral finance theory. We found that overconfidence mediates the impact of famous university experience of top managers on corporate performance. Furthermore, the emphasis on corporate business complexity is also a contribution of this paper. Business complexity was included in our research framework, and we found that a high proportion of top managers in the top management team (TMT) is more beneficial to companies with business complexity. The findings are expected to be both theoretically and practically meaningful.
This paper proceeds as follows. In the second section, we describe the theoretical basis of the influence of top managers famous universities experience on corporate performance, as well as the mediating and moderating effect of this relationship, and develop hypotheses for empirical testing. Section 3 presents the research design, sample selection method, variables and models of the empirical research. The Section 4 reports the results of the descriptive statistical analysis and estimation of empirical models, including two-way fixed effect model and panel propensity score matching (Panel-PSM) methodology. Section 5 exhibits the robustness test, mainly through the transformation of variable measurement and instrumental variables. The final section discusses the theoretical contributions, practical implications, limitations, future research directions and then concludes the study.

2. Theory and Hypotheses

Neoclassical economics compares an enterprise to a “black box”, namely, an organization that pursues maximum profit or shareholder wealth under certain technological and market constraints [39]. Black box theory holds that all the elements of an enterprise can be considered as part of the enterprise’s capital. Value of financial resources, material resources, human resources and information resources is added through internal flows [40,41]. In the context of knowledge economy, the overall quality of managers has become an essential factor in the development of enterprises [42]. The top management team is responsible for the strategy development and execution. As a central part of human capital, top managers are the source of a company’s continued competitive advantage [43,44]. In the view of upper echelon theory, the quality of top managers directly determines corporate decision-making and performance [11]. Famous university experience belongs to the characteristics of top managers’ educational background, which is an important symbol of the quality of top managers. Judge and Chevalier have studied the relationship between the graduate university level of the managers and corporate performance [45,46]. They found that companies with managers who graduated from Ivy League universities had better organizational performance than those with managers who graduated from general universities. However, why the famous university experience of top managers in adolescence has an impact on corporate performance remains to be clarified.

2.1. Famous University Experience of Top Managers and Corporate Performance

From the perspective of human capital, excellent top management team is the most precious human resource of an enterprise. Maintaining a high-quality top management team is the key to obtaining sustainable competitiveness [47,48]. Generally speaking, human capital is accumulated through university education and vocational training. Well-educated employees are better at understanding, creating and processing information than uneducated employees [49,50,51,52,53]. Nonetheless, with increasing age, the marginal utility of human capital investment decreases. It is more efficient to invest in human capital in adolescence than in other periods, since adolescents are more inclined to accept new knowledge, skills and ideas. Compared with other stages, university education has a good investment efficiency in human capital investment, which often occurs in a person’s adolescence. In 1960, economist Beker calculated the average return rate on university education, which was found to be considerable, reaching 10 to 12% annually [54]. Whether human resources can become the source of competitive advantage of an enterprise depends on its scarcity, which means the human resources owned by an enterprise cannot be easily obtained by competitors. Universities play an important role in the process of competitive selection and talent diversion [55]. Graduates from famous universities are a kind of social scarce resource. Top managers graduating from famous universities enjoy better educational resources than their peers from ordinary universities, which enables them to gain stronger cognitive ability and stronger ability to master new knowledge; at same time, they have higher ethical and professional standards than their peers [56]. To a certain extent, the educational background of top managers reflects their human capital. Top managers graduating from famous universities have higher human capital than those from ordinary ones, which will be transformed into economic benefits through the “black box” of the corporate.
From the perspective of social capital, top managers, as the central part in an organization, determine corporate social capital by their social network [57,58]. Social capital plays an irreplaceable role in information acquisition, personnel organization and transaction costs reduction [59,60,61]. Similar to material capital, the amount of social capital owned by enterprises has an important impact on organizational integration and performance. Relationship networks, trust and norms in social capital enhance external expansion ability as well as internal cohesion; moreover, they can increase opportunities, reduce costs and promote performance of the corporate [62,63,64]. Top managers’ social capital is the connection among top managers, internal and external personnel, which exists in the structure of top managers’ interpersonal relationship. To a large extent, the quality of corporate social capital depends on the social network system woven by top management teams, which is closely related to the famous university experience of top managers [22]. The famous university experience of top managers will improve their reputation, as it is easier to get the recognition from society by entering famous universities, which makes external organizations more willing to establish links with companies, so as to make companies closer to the social network center and optimize its external social capital. One the other hand, a famous university experience can bring high-quality peer social capital to top managers, which is not only a relationship network, but also a channel of information exchange and a community of shared interests. The social circle of alumni from famous universities is of relatively high quality, from which firms can obtain key resources and important information. Bellivean pointed out that managers who graduated from famous universities had more connections with politicians and civil servants, which allowed them to gain government contracts and lobbied for more preferential taxes rate, so as to achieve better corporate performance. When it comes to China, where strong social-human relationships and circle culture exist, this situation seems to be more pronounced. Therefore, we assume the following:
Hypothesis 1.
The proportion of top managers with famous university experience in the TMT is positively related to corporate performance.
From the analysis above, it can be seen that top managers with famous university experience will have a crucial impact on corporate performance; what, then, is the possible mechanism of this impact?

2.2. Famous University Experience, Overconfidence and Corporate Performance

Overconfidence is one of the key manifestations to show the irrationality of corporate executives, which refers to the psychological deviation that people tend to overestimate their success probability and underestimate their failure probability [65,66]. Studies have shown that overconfidence varies among individuals of different gender, age and educational background. The famous university experience of top managers may lead to their overconfidence in two stages. The first stage is the experience of succeeding in a rigorous selection examination, and the second stage is the experience of studying in a famous university. The college entrance examination system is one of the most important systems for selecting talents in China. Success in such an important selection test in adolescence will invisibly led to the belief that they can accomplish whatever they want, which makes them overconfident in their future work. Chakravarty found that the top managers who once succeeded in India’s Joint Entrance Examination (JET) tended to be overconfident in corporate management [25]. Research shows that top managers who have attended famous universities may have a sense of intellectual superiority, and they tend to believe that their knowledge, skills and work experience are sufficient to meet the challenges of business management [67,68]. They often exaggerate their managerial competence and technical ability. When making decisions, they use their own knowledge and experience without considering the opinions of others [69,70]. In addition, high positions that top managers own will also increase their overconfidence. To sum up, the degree of overconfidence of corporate top managers is generally higher than that of others [71].
However, the famous university experience of top managers may also inhibit overconfidence. Top managers receive high-quality education in famous universities, which brings them advanced knowledge, technology and a broader vision, so that they can analyze the situation more rationally and consider uncertainties more comprehensively when making decisions, to avoid blindly overestimating benefits or underestimating risks. In addition, top managers from famous universities are more likely to encounter colleagues from famous universities in their work, which will inhibit their sense of superiority. When the proportion of top managers with famous universities experience in the TMT is high, the clustering effect caused by similar educational experience will inhibit the overconfidence level of top managers, making them more modest and rational. Therefore, with the increasing proportion of top managers with famous universities experience in the TMT, the individual top managers’ overconfidence level will offset, and overall level of overconfidence of the TMT will be lower.
As a psychological characteristic, overconfidence of top managers can affect corporate performance by influencing strategies. Thus, compared with overconfident managers, do rational managers make better choices for companies and improve their performance? Overconfident managers tend to overestimate returns and underestimate risks [72], which will increase operational risks and financial risks, thereby reducing the ultimate profits of companies. When overconfident top managers overestimate the profitability of the company, they tend to make more imprudent investment decisions, leading to the problem of over-investment [73,74,75], which will increase the operational risks. When overconfident managers underestimate project risks, they are prone to adopting more aggressive financing strategies and shorter debt maturity structure, which will increase the scale of debt financing. As a result, the level of corporate financial leverage will be raised and companies will be exposed to higher financial risks. High operational and financial risk will have a negative impact on corporate performance. On the contrary, rational managers with a low level of overconfidence can ensure that the company’s operational and financial risks are at a normal level, thus, avoiding undertaking long-term overload risk and damaging the company’s performance. Based on the analysis above, we assume the following competitive hypotheses:
Hypothesis 2a.
The higher the proportion of top managers with famous universities experience in the TMT, the higher the level of overconfidence of the TMT, and the worse the corporate performance.
Hypothesis 2b.
The higher the proportion of top managers with famous universities experience in the TMT, the lower the level of overconfidence of the TMT, and the better the corporate performance.

2.3. The Moderating Role of Business Complexity

According to the analysis above, the proportion of executives with famous university experience in TMT will have an impact on the corporate performance, which is mediated by overconfidence. Corporate performance is deeply influenced by business complexity [76,77], the relationship between famous university experience of TMT and corporate performance may vary under different business complexity. Therefore, it is necessary to introduce corporate business complexity as a moderating variable, to study whether the direction and intensity of this impact will differ under distinct business complexity. The business complexity of a company refers to the degree of diversification of its business. Companies with high business complexity require managers with high management talent and a board of directors with strong insight [78], owing to the distinct business style and corporate culture contained in the irrelevant branches of the complex business. The more complex the business is, the more difficult top managers acquire information, coordinate and manage [79]. At the same time, companies with high business complexity are more sensitive to the internal and external environment, and face more internal and external uncertainties [80]. The business complexity has different requirements for different managers. For managers with weaker competencies, a company with higher business complexity may mean disaster, but for managers with stronger competencies, a company with higher business complexity just provides a platform for them to display their talents. Relatively speaking, a high proportion of top managers with famous university experience can enhance the comprehensive quality and management ability of the TMT. Business complexity will enlarge the function of top managers’ ability, thus, enhancing the positive effect on the corporate performance. Moreover, the board of directors is an essential part of the TMT, playing the role of supervision and consultation. Under the conditions of “two rights separation”, the higher the complexity of the company’s business, the more serious the principal-agent problem between shareholders and managers is, and the more opportunistic the managers are, which requires more effective supervision to reduce the damage to the value of the company caused by managers’ tunneling [81,82]. The higher the proportion of top managers with famous university experience in the TMT is, the stronger the ability of board of directors to perform the function of supervision, thus, alleviating the problem of principal-agent and improving the company’s performance. Therefore, we hypothesize the following:
Hypothesis 3.
The positive relationship between the proportion of top managers with famous university experience in the TMT and corporate performance is moderated by business complexity. Specifically, this relationship becomes stronger when firms have higher business complexity.
To sum up, the theory framework of this paper can be summarized as a model including mediating effect and moderating effect, as is shown in Figure 1.

3. Research Design

3.1. Data and Sample

Listed manufacturing firms on the Shanghai and Shenzhen Stock Exchange from 2008 to 2018 were chosen as samples in order to ensure the comparability of accounting information, owing to that new accounting standards for business enterprises have been implemented in China since 2007. Samples were screened according to the following criteria: (1) the observations of top managers who have served in the corporate for less than one year were deleted, since the change of corporate performance caused by a certain impact takes a period of time to appear due to the lagging effect. (2) ST and *ST companies were excluded, as these companies are faced with the risk of delisting, and the abnormal financial status of these companies will affect the reliability of the research conclusion. (ST Companies: Loss of the company for two consecutive years, special treatment. *ST Companies: Loss of the company for three consecutive years, Delisting early warning.) (3) Financial companies are eliminated due to its unique assets structure and accounting system. (4) All continuous variables were winsorized at the upper and lower 1% tails of the distribution for reducing the influence of outliers. After the above treatment, 3926 observations were finally obtained, including 382 listed firms. The main data source used for this study was the China Stock Market & Accounting Research Database (CSMAR), and the missing data were obtained from the annual reports of listed companies manually. STATA 15 and R were used for data analysis.

3.2. Variables

3.2.1. Dependent Variable: Corporate Performance

Corporate performance can be divided into financial performance and non-financial performance. Return on asset (ROA), Tobin’s Q and Economic Value Added (EVA) are selected as indicators to measure financial performance, which were employed as our dependent variable. Return on asset (ROA) measures the company’s accounting performance. As the core index of the DuPont analysis system, ROA can reflect the short-term operating performance of enterprises; Tobin’s Q measures the company’s capital market performance, specifically, the company’s long-term operating performance. Compared with P/E ratio, Tobin’s Q is more suitable in Chinese capital market [83]; Economic Value Added (EVA) is an index to measure the company’s operating performance, which reflects the net added value of shareholders.

3.2.2. Independent Variable: Proportion of Top Managers with Famous University Experience in TMT

We took the proportion of top managers with famous university experience in TMT as our independent variable. The reason for choosing TMT rather than the individuals of top managers is that although the CEO has the ultimate decision power, there is a division of labor between the management teams. Corporate performance is largely determined by the comprehensive ability of the TMT. Therefore, the characteristics of TMT are more persuasive than those of CEO in explaining organizational performance.
The TMT of the company consists of the chief executive officer (CEO), board members, the chief financial officer (CFO), the general manager, the deputy general manager, the president, the vice president, the board secretary and other top managers disclosed in the annual report according to the company law of the people’s Republic of China. Famous universities are defined as 34 universities which are listed in the “985 project”. To a lager extent, the higher educational resources in China are concentrated in a number of top universities, which leads to a pyramidal structure distribution of Chinese universities. Top managers with famous university experience are defined as those who are admitted by the “985 Project” University through the college entrance examination and complete undergraduate studies in a “985 Project” University.

3.2.3. Control Variables

The following factors that might influence corporate performance were included as controls: firm size (Size), firm age (Age), top management team size (TMT_size), financial leverage (Leverage), investment opportunities (OI), free cash flow (FCF) and cash reinvestment ratio (CIR) [22,84,85]. In addition, industry and year fixed effects were also controlled here.

3.2.4. Mediating Variable: Overconfidence

Earnings forecast bias is used to measure the overconfidence of TMT with reference to Jiang [86]. Specifically, situations can be divided into four categories: (1) the company is predicted to make a profit but actually make loss. (2) The company’s profit increased at a rate lower than predicted. (3) The company’s earnings are predicted to increase, but, in fact, decline. (4) The company makes much more loss than predicted. If one of the four situations mentioned above exits, overconfidence of TMT is assigned as 1; otherwise, it is assigned as 0.

3.2.5. Moderating Variable: Business Complexity

Operating revenue, business scope and financial leverage are used as three indicators of business complexity with reference to Coles [87]. Factor analysis using three indicators were conducted to construct a comprehensive index as a measurement of business complexity. If the index of the company is higher than the median, business complexity is assigned as 1, which means that the business complexity of the company is high; otherwise, it is assigned as 0. The description of each variable is presented in Table 1.

3.3. Model Estimation

Keeping in mind the above analysis, the effect of famous university experience on corporate performance was explored through the following models. Model (1) was used to explore the main effect of famous university experience on corporate performance, which is a two-way fixed effect model with industry and time effect controlled.
P e r f o r m a n c e i , t = β 0 + β 1 p r o p _ f c u i , t +   γ C o n t r o l i , t + I n d u s t r y i + Y ear t + ε i , t
Overconfidence was introduced in Model (2) and Model (3) to test the mediation mechanism. The most widely used methods to check the mediation effect are the Step-wise method, Bootstrap method and Markov Chain Monte Carlo (MCMC) method. Under the condition that information is difficult to obtain, the Bootstrap method is more accurate [88]. In view of this, the bootstrap method was adopted in this study to test the mediation model, in order to check if overconfidence mediate the relationship between famous university experience and corporate performance.
O C i , t = α 0 + α 1 p r o p _ f c u i , t +   γ C o n t r o l i , t + I n d u s t r y i + ε i , t
P e r f o r m a n c e i , t = β 0 + β 1 p r o p f c u i , t + β 2 O C i , t +   γ C o n t r o l i , t + I n d u s t r y i + Y e a r t + ε i , t
Model (4) was constructed to test the moderating effect of business complexity:
P e r f o r m a n c e i , t = β 0 + β 1 × p r o p f c u i , t + β 2 b c l i , t + β 3 × p r o p f c u i , t × b c l i , t +   γ C o n t r o l i , t +   I n d u s t r y i + Y ear t + e i , t
In models (1) to (4), i indexes firms and t indexes years. In order to overcome the problem of heteroscedasticity and sequence correlation of sample data, the above model parameters are estimated using the robust standard error of clustering at the firm level.

4. Results

4.1. Descriptive Statistics

Table 2 shows the descriptive statistical results of the main variables. The mean values of ROA, Tobin_q and EVA are 8.4%, 2.44% and 9.9%, respectively, which shows that the performance of the listed companies is generally good. The samples were divided into two groups. Mean test shows that there exit significant differences in financial performance between companies with high business complexity and those with low business complexity. The average, median and standard deviation of famous university top managers proportion are 12.6%, 8.8% and 10.9% respectively. It can be seen that the proportion of top managers in the listed companies is low and varies between different companies. The average, median and standard deviation of overconfidence are 0.613, 1 and 0.487, respectively, indicating that the overall overconfidence of the TMT is generally high and varies widely.

4.2. Regression Analysis

4.2.1. Main Effect

The estimation results for model (1) are presented in Table 3. Column I includes the independent and dependent variables only. Result of Column I suggests that the proportion of top managers with famous university experience in TMT is positively related to ROA (b = 0.0162, p < 0.1), Tobin_q (b = 0.0326, p < 0.05) and EVA (b = 0.078, p < 0.05). Column II includes controls. Result of Model1 shows that taking control variables into consideration, the proportion of top managers with famous university experience in TMT remains positively related to ROA (b = 0.0385, p < 0.01), Tobin_q (b = 0.0518, p < 0.01) and EVA (b = 0.188, p < 0.05), this finding supports Hypothesis 1, which means the increase in the proportion of top managers with famous university experience in TMT contributes to corporate performance.

4.2.2. Mediating Effect

Model 2 and Model 3 in Table 4 add the mediating effect of overconfidence. Column I shows the positive relationship between overconfidence and the proportion of top managers with famous university experience in the TMT (b = −0.118, p < 0.01). This result supports Hypothesis 2b, which proposes that the higher the proportion of top managers in the TMT, the lower the overconfidence level of the TMT.
Column II to IV suggest the proportion of top managers with famous university experience in the TMT is positively related to ROA (b = 0.019, p < 0.10), Tobin_q (b = 0.074, p < 0.05), and EVA (b = 0.122, p < 0.10), while overconfident is negatively related to ROA(b = −0.01, p < 0.10), Tobin_q (b = −0.052, p < 0.05) and EVA (b = −0.028, p < 0.05), indicating the mechanisms to improve corporate performance by restraining the overconfidence of the TMT.
Following the approach used by Chen [89], we tested Model 4 using the bootstrap method. 5000 samples were selected through the non-parametric percentile method for deviation correction, with a confidence interval of 95%. The results demonstrate that lower level of confidence interval (LLCI) = −0.236, and the upper level of confidence interval (ULCI) = −0.073. The 95% confidence interval does not contain 0, indicating the mediating effect of overconfidence is significant.

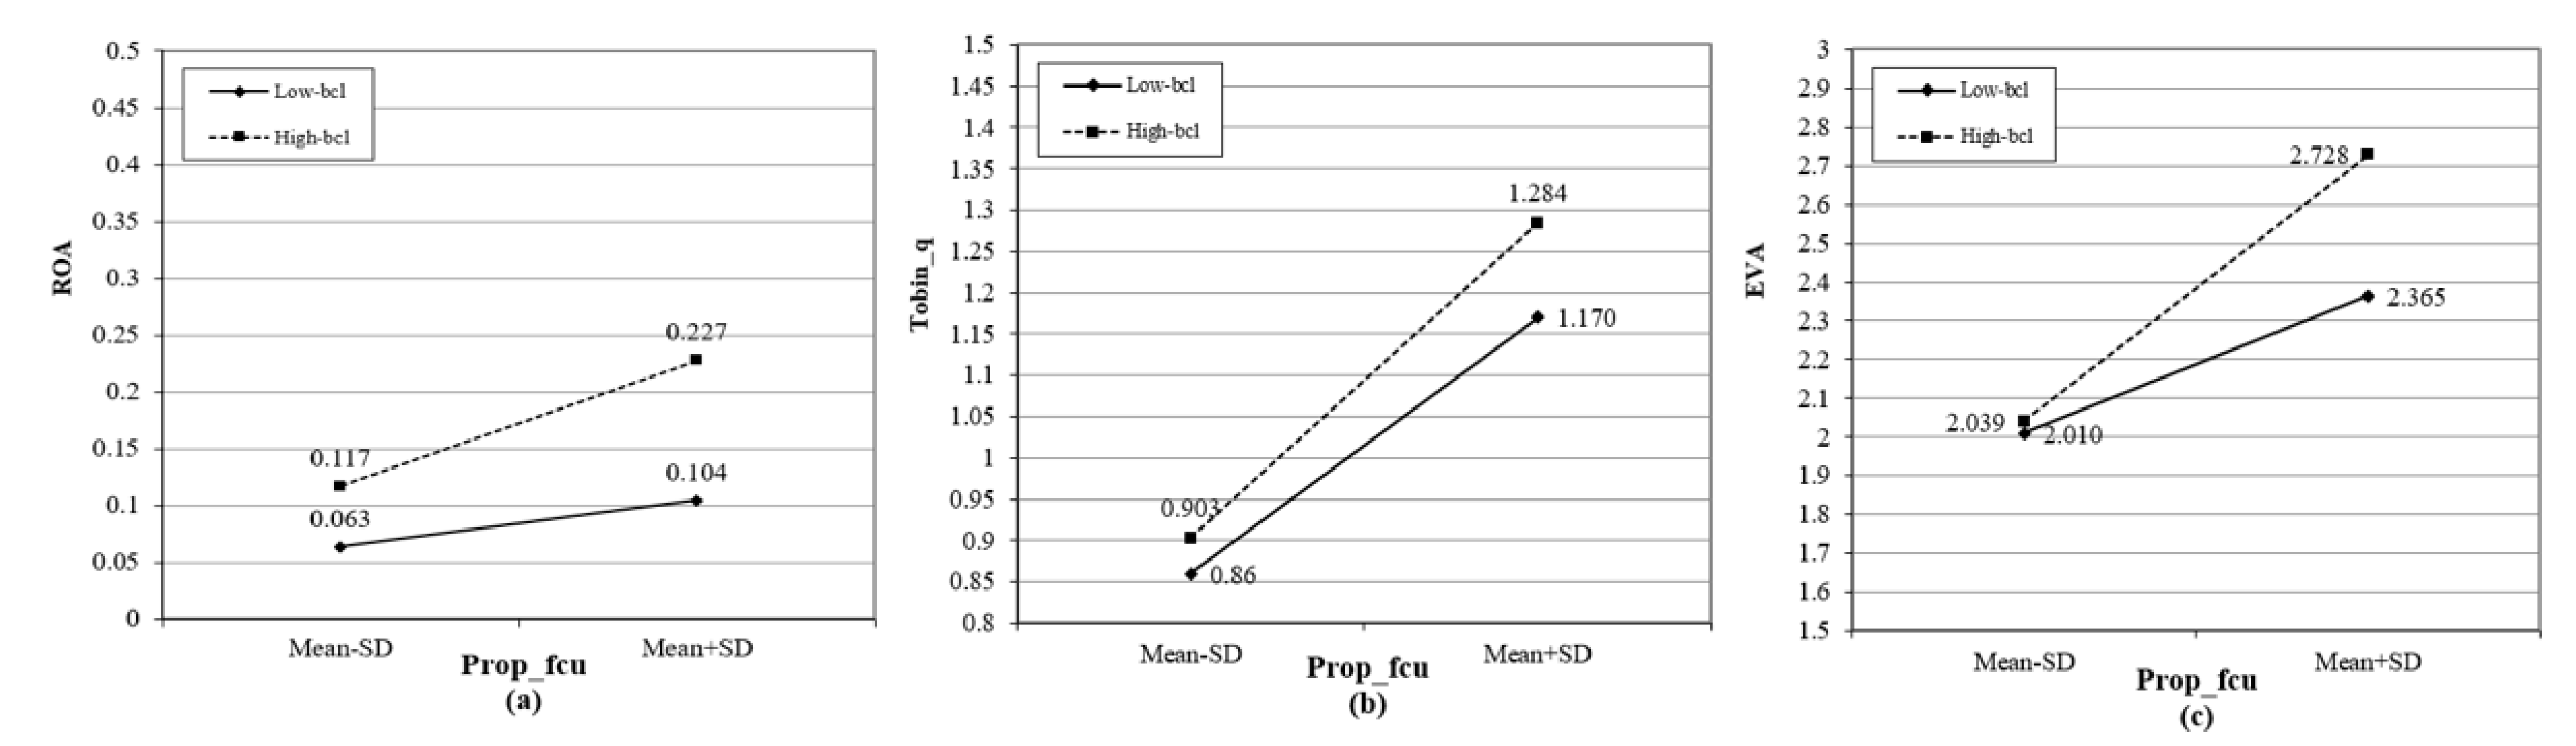
4.2.3. Moderating Effect

Table 5 includes business complexity and its interaction term with proportion of top managers with famous university experience in TMT. The interaction term is positively related to ROA (b = 0.07, p < 0.01), Tobin_q (b = 0.075, p < 0.01) and EVA (b = 0.349, p < 0.1), supporting hypothesis 3 in that the positive relationship between the proportion of top managers with famous university experience in TMT and corporate performance is stronger for companies with high business complexity than those with lower ones. Figure 2 was drawn to visualize the moderating effect of the company’s business complexity.

4.3. Panel-PSM

A sample selection bias may exist, as companies with good performance usually offer considerable salary and are more attractive to graduates from famous universities. At the same time, graduates from famous universities tend to choose companies with better performance. In order to test the causal relationship between the famous university experience of top managers and corporate performance, we used the method of propensity score matching (PSM) to make counterfactual inference, so as to reduce model dependence in observational studies.
Following Imai [90], we used the Panel-PSM method to match the sample companies. The basic idea is to find a matching set with similar characteristics in the control group (samples with the proportion over the threshold) for the treatment group (samples with the proportion below the threshold) through the method of propensity score matching, and to select a matching set for each treatment group company. The matching set is composed of the control group individuals and their historical sets in the same year as the treatment group. The Panel-PSM method makes full use of the historical data of the control group, which is conducive to improving the matching accuracy. The results of individuals in the control group were used to estimate the counterfactual results of individuals in the treatment group, and the average treatment effect (ATT) was calculated. The specific calculation method is shown in Model (5):
τ A T T = E [ p e r f o r m a n c e i , t + F ( D i , t = 1 , D i , t 1 = 0 , { D i , t l } l = 2 L )   p e r f o r m a n c e i , t + F ( D i , t = 0 , D i , t 1 =   0 , { D i , t l } l = 2 L ) | D i , t = 1 , D i , t 1 = 0 ]
The threshold is set as 12.6%, since the mean value of prop_fcu in Table 1 is 12.6% (i.e., the treatment group is above 12.6% and the control group is below 12.6%). D = 1 is the treatment group, D = 0 is the control group. The distribution of treatment group and control group is shown in Figure 3. In Figure 3, the abscissa represents the year, and the ordinate represents the company code. Each module in the figure represents whether a company is in the treatment group or in the control group in a certain year (i.e., the red module represents the treatment group, and the blue module represents the control group). It can be seen from the figure that the distribution of control group and treatment group is relatively uniform, indicating that the proportion of the samples in treatment group and control group is roughly the same, which is suitable for matching.
The propensity score is calculated through the Logit model using firm size, firm age and free cash flow as dependent variables. The bootstrap method is used to estimate Model (5). L and F are the number of years lagged and extended relatively to the base year respectively. In this paper, 2013 is taken as the base year, and 5 years of forward extension are selected to observe the short-term effect and long-term effect. The estimated results are shown in Table 6.
Table 6 shows the relative change of the corporate performance after the increase of the proportion. Column I, IV and VII reflect the average treatment effect (ATT) of the performance of the treatment group company compared to the control group company. It can be seen that both the short-term effect and the long-term effect are positive and statistically significant, indicating that the higher the proportion, the better the performance. In order to verify whether the business complexity plays a moderating role, we further divided the samples into companies with higher business complexity and lower business complexity, and used the Panel-PSM method to make counterfactual inference. The results are shown in Table 6. It can be seen that, generally speaking, compared with the sample with low business complexity (Column II, V and VIII), ATT in the sample with high business complexity (Column III, VI and IX) is higher, which indicates that the business complexity of the company has a positive mediating effect.

5. Robustness Checks

5.1. Variable Measurement

Definition of famous universities. The definition of famous universities as “985 project” universities may lead to a loss of samples, thus, we expanded the famous universities to “double first-class” universities. The regression results show that the proportion of “double first-class” top managers in the TMT has a significant positive impact on corporate performance, and the mediating effect of overconfidence and the moderating effect of the business complexity still holds.
Measurement of overconfidence. Considering that numerous top managers hold shares in the company, we measure the overconfidence of top managers following Kim [91], by investigating the number of shares held by the TMT. Specifically, if the TMT raises its shares in the company, it indicates that the TMT is confident in the future, and the level of overconfidence is high; if the TMT reduces or remains its shares, it indicates that the level of overconfidence is low.
Measurement of business complexity. The company’s business complexity can be measured not only by business level indicators, but also by industry indicators. We use industry characteristics to characterize the company’s business complexity in the robustness test. According to the sample distribution of this paper, the first main business is manufacturing and construction enterprises into the enterprise group with low business complexity, and the first main business is scientific research and technology service industry, information transmission, computer service and software industry as representatives of high-tech industry into the enterprise group with high business complexity.
Other contingencies. There are many factors that affect corporate performance from the perspective of educational background. The existing literature research shows that the professional background, academic background, educational level, overseas study experience of top managers will affect the corporate performance. These factors may moderate the relationship between famous university experience and corporate performance. Therefore, the interactions of professional background, academic background, educational level and overseas study experience are taken into consideration.
The results of the robustness tests above are basically consistent with the previous regression results, which show that the research conclusions of this paper are relatively reliable.

5.2. Instrumental Variable

Selection bias may diminish as top managers who graduated from famous universities are more inclined to work in companies with good performance. Following Chakravarty [22], we instrumented the ratio of the number of students enrolled in the “985 project” universities to the total number of people in the province where the listed company is located. We add this instrumental variable into the regression model, and find that the regression results are robust, which are not shown in this paper.
To prove the validity of the instrumental variables, we conducted a series of tests. A Hausman test was carried out, and no endogeneity problems of the instrumental variable were found. A Stock test was adopted to examine the correlation between the instrumental variable and original variables [92]. The Sanderson chi-square test and F-test were conducted to examine overidentification and weak identification [93]. As is shown in Table 7, all chi-square statistics and F-statistics are significant at the level of 1%, indicating that the instrumental variable was exogenous and correlated; overidentification and weak identification problems did not exit.

6. Discussion

6.1. Theoretical Contributions

Our study makes contributions to the literature in several ways. First, we discussed the relationship between the famous university experience of top managers and corporate performance. Although previous studies have proven that the learning background of the company’s top managers is an important factor affecting the corporate performance, they mainly focus on top managers’ professional, academic and studying-abroad background. In this paper, we explored whether the experience in famous universities of top managers affects the company’s performance. We believe that, compared with the top managers graduating from ordinary universities, those graduating from famous universities are superior in both human capital and social capital accumulation. Entering a prestigious university and receiving high-quality education in adolescence is beneficial to the improvement of the quality of top managers, as well as the establishment of more sophisticated social network system, which can be translated into tangible economic benefits through the “black box” of the company.
Second, our study highlights the mediating role of overconfidence in the connection. Based on behavioral finance theory, it is believed that the famous university experience of top managers may affect their overconfidence. Consistent with Chakravarty, overconfidence mediates the impact of famous university experience on corporate performance. The result shows that the famous university experience of top managers reduces the level of overconfidence of top management teams. Specifically, although the experience of being admitted to a prestigious university as a teenager can breed complacency and self-indulgence of top managers, broad vision, rational thinking and homogeneous social circles can inhibit their overconfidence. As a whole, TMTs with more top managers with famous university experience tend to have lower levels of overconfidence. With low overconfidence, the TMT will have a more rational understanding of the risks and benefits of the company’s investment projects, which helps to control the company’s operational risks and financial risks.
Third, we emphasized the moderating effect of business complexity. We have discussed the relationship between the famous university experience of top managers and the corporate performance in different contexts. According to the business complexity of companies, companies are divided into companies with high business complexity and low business complexity. The higher the business complexity, the more difficult and complex the information acquisition, coordination, command and management of the company, which simply provides a platform for the performance of the top managers with famous university experience.

6.2. Practical Implications

The research in this paper also has implications for practice. To begin with, top managers are key factors in the sustainable development of a company. A TMT with a good education background is conducive to improving the corporate performance. By recruiting more prestigious talents and maintaining the existing elites of the company, the company’s sustainable development can be realized. Moreover, the research shows that one of the ways that top managers influence the company’s performance is to curb the level of overconfidence of the TMT. Attention should be paid to preventing the excessive level of overconfidence caused by the arrogance of the top managers. Last but not least, this study shows that different types of enterprises need different talents. For companies with huge assets and wide business scope, the increase in the proportion of top managers with famous university experience has a greater marginal contribution to the company’s performance, while for those with low business complexity, introducing top managers with famous university experience may not be economical.

6.3. Limitations and Future Research Directions

Our research is bound by some limitations. First, the role of top managers in the company varies due to the distinct power allocation, function allocation and internal interpersonal interaction of the TMT, which is ignored in this study. Second, the proportion of top managers with famous university experience in the TMT affects the degree of educational heterogeneity of the TMT. Existing research shows that the relationship between educational heterogeneity of the TMT and corporate performance is non-linear, thus, the relationship between the proportion of top managers with famous university experience in the TMT and corporate performance may be non-linear as well. Finally, state-owned enterprises and non-state-owned enterprises are not distinguished, which may have a moderating effect due to its different governance structures.
Further research could be applied to improve our studies. To begin with, different power distribution and decision-making mechanisms of the TMT can be taken into account, so as to analyze the influence of the proportion of top managers in top management teams on corporate performance from a single static state to a multi dynamic state. In addition, more specific relationship between the proportion of top managers with famous universities experience in the TMT and corporate performance can be examined from the perspective of heterogeneity. The high order term of the proportion of top managers with famous universities experience in the TMT can be introduced to test whether there is a non-linear relationship between the proportion of top managers in the TMT and the company’s performance. Moreover, the relationship between rhetorical strategies and CSP may be influenced by its ownership, due to their different incentive mechanism, strategic orientation and human resources policy. Future research can further divide the sample enterprises into state-owned enterprises and non-state-owned enterprises according to ownership, and investigate the impact of the famous university experience of top managers on corporate performance under different governance mechanisms.

7. Conclusions

Famous university experience of top managers is crucial to obtain comprehensive abilities and build social networks, which ultimately enhance corporate invisible capital and values; therefore, relevant research on the famous university experience of top managers toward corporate performance is of both theoretical and practical significance. Two-way fixed models and panel-PSM methodology were used to conduct analyses of the sampled panel data of listed companies on the Shanghai and Shenzhen Stock Exchange in China from 2008 to 2018. Several conclusions have been drawn. The famous university experience of top managers can significantly improve the corporate performance. The higher the proportion of top managers with famous university experience in the TMT, the better the performance of the company; the influence of the famous university experience of top managers on the company’s performance is mediated by overconfidence. With an increasing proportion, the overconfidence of top managers tends to decrease, which is conducive to improving the corporate performance; famous university experience of top managers has a stronger positive impact on the performance of those companies with high business complexity compared to companies with low business complexity. The results provide practical implications for the TMT to improve corporate performance by maintaining the proper faction of top managers with famous university experience.

Author Contributions

Q.R. contributed to the study design. W.X. contributed to the data collection, and C.L. contributed to the drafting of the manuscript. All the authors read, revised, and approved the final manuscript.

Funding

This research was funded by the Fundamental Research Funds for the Central Universities (Grant No. 22120190051).

Conflicts of Interest

The authors declare no conflicts of interest.

References

  1. Zahra, S.A. Environment, corporate entrepreneurship, and financial performance: A taxonomic approach. J. Bus. Ventur. 1993, 8, 319–340. [Google Scholar] [CrossRef]
  2. Nickell, S. Competition and corporate performance. J. Political Econ. 1996, 104, 724–746. [Google Scholar] [CrossRef]
  3. Molina, L.M.; García-Morales, V.J. Combined Influence of Absorptive Capacity and Corporate Entrepreneurship on Performance. Sustainability 2019, 11, 1–26. [Google Scholar]
  4. Bhagat, S.; Bolton, B. Corporate governance and firm performance. J. Corp. Financ. 2008, 14, 257–273. [Google Scholar] [CrossRef]
  5. Feng, M.; Li, C.; McVay, S.; Skaife, H. Does ineffective internal control over financial reporting affect a firm’s operations? Evidence from firms’ inventory management. Acc. Rev. 2015, 90, 529–557. [Google Scholar] [CrossRef]
  6. Lovelace, B.; Bundy, J.; Hambrick, D.C.; Pollock, T.G. The shackles of CEO celebrity: Sociocognitive and behavioral role constraints on “star” leaders. Acad. Manag. Rev. 2018, 43, 419–444. [Google Scholar] [CrossRef]
  7. Quigley, T.J.; Hambrick, D.C. Has the “CEO effect” increased in recent decades? A new explanation for the great rise in America’s attention to corporate leaders. Strateg. Manag. J. 2015, 36, 821–830. [Google Scholar] [CrossRef]
  8. Wowak, A.J.; Hambrick, D.C. A model of person-pay interaction: How executives vary in their responses to compensation arrangements. Strateg. Manag. J. 2010, 31, 803–821. [Google Scholar] [CrossRef]
  9. Abidin, S.; Reddy, K.; Chen, L. Determinants of ownership structure and performance of seasoned equity offerings: Evidence from Chinese stock markets. Int. J. Manag. Financ. 2012, 8, 304–331. [Google Scholar] [CrossRef]
  10. Hambrick, D.; Mason, P.A. Upper echelons: The organization as a reflection of its top managers. Acad. Manag. Rev. 1984, 9, 193–206. [Google Scholar] [CrossRef] [Green Version]
  11. Hambrick, D.C. Upper Echelon Theory: An Update. Acad. Manag. Rev. 2007, 32, 334–343. [Google Scholar] [CrossRef]
  12. Jalbert, T.; Furumo, K.; Jalbert, M. Does educational background affect CEO compensation and firm performance? J. Appl. Bus. Res. 2010, 27, 15–40. [Google Scholar] [CrossRef]
  13. Gottesman, A.A.; Morey, M.R. CEO Educational Background and Firm Financial Performance. J. Appl. Financ. 2010, 20, 70–82. [Google Scholar]
  14. Lindorff, M.; Prior, J.E. CEO business education and firm financial performance: A case for humility rather than hubris. Educ. + Train. 2013, 55, 461–477. [Google Scholar] [CrossRef]
  15. Çelikyurt, U.; Dönmez, B.N. Engineer CEOs and firm performance in BIST manufacturing Firms. Muhasebe Ve Finans. Derg. 2017, 75, 171–182. [Google Scholar] [CrossRef]
  16. Lee, H.U.; Park, J.H. The influence of top management team international exposure on international alliance formation. J. Manag. Stud. 2008, 45, 961–981. [Google Scholar] [CrossRef]
  17. Lin, D.; Lu, J.; Liu, X.; Choi, S.J. Returnee CEO and innovation in Chinese high-tech SMEs. Int. J. Technol. Manag. 2014, 65, 151–171. [Google Scholar] [CrossRef]
  18. Francis, B.; Hasan, I.; Wu, Q. Professors in the boardroom and their impact on corporate governance and firm performance. Financ. Manag. 2015, 44, 547–581. [Google Scholar] [CrossRef]
  19. Cho, C.H.; Jung, J.H.; Kwak, B.; Lee, J.; Yoo, C.Y. Professors on the Board: Do they contribute to society outside the classroom? J. Bus. Ethics 2017, 141, 393–409. [Google Scholar] [CrossRef]
  20. Morresi, O. How much is CEO education worth to a firm? Evidence from European firms. PSL Q. Rev. 2017, 70, 311–353. [Google Scholar]
  21. Wang, D.D. Performance-based resource allocation for higher education institutions in China. Socio Econ. Plan. Sci. 2019, 65, 66–75. [Google Scholar] [CrossRef]
  22. Chakravarty, S.; Hegde, P. The Joint Entrance Exam, overconfident directors and firm performance. J. Corp. Financ. 2019, 56, 298–318. [Google Scholar] [CrossRef]
  23. Heaton, J.B. Managerial optimism and corporate finance. Financ. Manag. 2002, 31, 33–45. [Google Scholar] [CrossRef]
  24. Heaton, J.B. Managerial optimism: New observations on the unifying theory. Eur. Financ. Manag. 2019, 25, 1150–1167. [Google Scholar] [CrossRef]
  25. Malmendier, U.; Tate, G. CEO overconfidence and corporate investment. J. Financ. 2005, 60, 2661–2700. [Google Scholar] [CrossRef] [Green Version]
  26. Hackbarth, D. Determinants of corporate borrowing: A behavioral perspective. J. Corp. Financ. 2009, 15, 389–411. [Google Scholar] [CrossRef]
  27. Gervais, S.; Heaton, J.B.; Odean, T. Overconfidence, compensation contracts, and capital budgeting. J. Financ. 2011, 66, 1735–1777. [Google Scholar] [CrossRef]
  28. Hackbarth, D. Managerial traits and capital structure decisions. J. Financ. Quant. Anal. 2008, 43, 843–881. [Google Scholar] [CrossRef] [Green Version]
  29. Barros, L.; Silveira, A.D. Overconfidence, Managerial Optimism, and the Determinants of Capital Structure. Braz. Rev. Financ. 2008, 6, 293–335. [Google Scholar] [CrossRef] [Green Version]
  30. Ramiah, V.; Zhao, Y.; Moosa, I.; Graham, M. A behavioural finance approach to working capital management. Eur. J. Financ. 2016, 22, 662–687. [Google Scholar] [CrossRef]
  31. Roll, R. The hubris hypothesis of corporate takeovers. J. Bus. 1986, 59, 197–216. [Google Scholar] [CrossRef]
  32. Hayward, M.L.; Hambrick, D.C. Explaining the premiums paid for large acquisitions: Evidence of CEO hubris. Adm. Sci. Q. 1997, 42, 103–127. [Google Scholar] [CrossRef]
  33. Malmendier, U.; Tate, G. Who makes acquisitions? CEO overconfidence and the market’s reaction. J. Financ. Econ. 2008, 89, 20–43. [Google Scholar] [CrossRef] [Green Version]
  34. Deshmukh, S.; Goel, A.M.; Howe, K.M. CEO overconfidence and dividend policy. J. Financ. Intermediation 2013, 22, 440–463. [Google Scholar] [CrossRef] [Green Version]
  35. Deshmukh, S.; Anand, M.G.; Keith, M.H. Do CEO Beliefs Affect Corporate Cash Holdings? Working Paper; DePaul University: Chicago, IL, USA; Navigant Consulting: Chicago, IL, USA, 2018. [Google Scholar]
  36. Hirshleifer, D.; Low, A.; Teoh, S.H. Are overconfident CEOs better innovators? J. Financ. 2012, 67, 1457–1498. [Google Scholar] [CrossRef] [Green Version]
  37. Ahmed, A.S.; Duellman, S. Managerial overconfidence and accounting conservatism. J. Account. Res. 2013, 51, 1–30. [Google Scholar] [CrossRef]
  38. Ho, P.H.; Huang, C.W.; Lin, C.Y.; Yen, J.F. CEO overconfidence and financial crisis: Evidence from bank lending and leverage. J. Financ. Econ. 2016, 120, 194–209. [Google Scholar] [CrossRef]
  39. Coase, R.H. The nature of the firm. Economica 1937, 4, 386–405. [Google Scholar] [CrossRef]
  40. Richardson, G.B. The organisation of industry. Econ. J. 1972, 82, 883–896. [Google Scholar] [CrossRef]
  41. Nelson, R.R. Why do firms differ, and how does it matter? Strateg. Manag. J. 1991, 12, 61–74. [Google Scholar] [CrossRef]
  42. Lieberson, S.; O’Connor, J.F. Leadership and organizational performance: A study of large corporations. Am. Sociol. Rev. 1972, 37, 117–130. [Google Scholar] [CrossRef]
  43. Hiller, N.J.; Hambrick, D.C. Conceptualizing executive hubris: The role of (hyper-) core self-evaluations in strategic decision-making. Strateg. Manag. J. 2005, 26, 297–319. [Google Scholar] [CrossRef]
  44. Crossland, C.; Zyung, J.; Hiller, N.J.; Hambrick, D.C. CEO career variety: Effects on firm-level strategic and social novelty. Acad. Manag. J. 2014, 57, 652–674. [Google Scholar] [CrossRef]
  45. Judge, T.A.; Cable, D.M.; Boudreau, J.W.; Bretz, R.D., Jr. An empirical investigation of the predictors of executive career success. Pers. Psychol. 1995, 48, 485–519. [Google Scholar] [CrossRef] [Green Version]
  46. Chevalier, J.; Ellison, G. Are some mutual fund managers better than others? Cross-sectional patterns in behavior and performance. J. Financ. 1999, 54, 875–899. [Google Scholar] [CrossRef]
  47. Child, J. Managerial and organizational factors associated with company performance-part II. A contingency analysis. J. Manag. Stud. 1975, 12, 12–27. [Google Scholar] [CrossRef]
  48. Hofstede, G. Motivation, leadership, and organization: Do American theories apply abroad? Organ. Dyn. 1980, 9, 42–63. [Google Scholar] [CrossRef]
  49. Schultz, T.W. Investment in Human Capital. The Role of Education and of Research; The Free Press: New York, NY, USA, 1971; pp. 1–18. [Google Scholar]
  50. Blundell, R.; Dearden, L.; Meghir, C.; Sianesi, B. Human capital investment: The returns from education and training to the individual, the firm and the economy. Fisc. Stud. 1999, 20, 1–23. [Google Scholar] [CrossRef] [Green Version]
  51. Currie, J. Healthy, wealthy, and wise: Is there a causal relationship between child health and human capital development? J. Econ. Lit. 2009, 47, 87–122. [Google Scholar] [CrossRef] [Green Version]
  52. Wallenborn, M. Vocational Education and Training and Human Capital Development: Current practice and future options. Eur. J. Educ. 2010, 45, 181–198. [Google Scholar] [CrossRef]
  53. Dessler, G. Human Resource Management, 15th ed.; Florida International University: Miami, FL, USA, 2012; pp. 5–20. [Google Scholar]
  54. Beker, G.S. Human Capital; Columbia: New York, NY, USA, 1964; pp. 5–37. [Google Scholar]
  55. Bell, R.E.; Youngson, A.J. Present and Future in Higher Education; Tavistock: London, UK, 1973; pp. 47–55. [Google Scholar]
  56. Thomas, W.H.; Feldman, D.C. How broadly does education contribute to job performance? Pers. Psychol. 2009, 62, 89–134. [Google Scholar]
  57. Bourdieu, P. The social space and the genesis of groups. Information 1985, 24, 195–220. [Google Scholar]
  58. Moran, P. Structural vs. relational embeddedness: Social capital and managerial performance. Strateg. Manag. J. 2005, 26, 1129–1151. [Google Scholar] [CrossRef]
  59. Coleman, J.S. Social capital in the creation of human capital. Am. J. Sociol. 1988, 94, S95–S120. [Google Scholar] [CrossRef]
  60. Nahapiet, J.; Ghoshal, S. Social capital, intellectual capital, and the organizational advantage. Acad. Manag. Rev. 1998, 23, 242–266. [Google Scholar] [CrossRef]
  61. Tsai, W.; Ghoshal, S. Social capital and value creation: The role of intrafirm networks. Acad. Manag. J. 1998, 41, 464–476. [Google Scholar]
  62. Gulati, R. Network location and learning: The influence of network resources and firm capabilities on alliance formation. Strateg. Manag. J. 1999, 20, 397–420. [Google Scholar] [CrossRef]
  63. Katz, N.; Lazer, D.; Arrow, H.; Contractor, N. Network theory and small groups. Small Group Res. 2004, 35, 307–332. [Google Scholar] [CrossRef]
  64. Hwang, B.H.; Kim, S. It pays to have friends. J. Financ. Econ. 2009, 93, 138–158. [Google Scholar] [CrossRef]
  65. Hur, K.S.; Kim, D.H.; Cheung, J.H. Managerial Overconfidence and Cost Behavior of R&D Expenditures. Sustainability 2019, 11, 4878. [Google Scholar]
  66. Belliveau, M.A.; O’Reilly, C.A., III; Wade, J.B. Social capital at the top: Effects of social similarity and status on CEO compensation. Acad. Manag. J. 1996, 39, 1568–1593. [Google Scholar]
  67. Barber, B.M.; Odean, T. Boys will be boys: Gender, overconfidence, and common stock investment. Q. J. Econ. 2001, 116, 261–292. [Google Scholar] [CrossRef]
  68. Malmendier, U.; Tate, G.Y. Overconfidence and early-life experiences: The effect of managerial traits on corporate financial policies. J. Financ. 2011, 66, 1687–1733. [Google Scholar] [CrossRef] [Green Version]
  69. Edward, R.J.; Schoemaker, P.H. Managing overconfidence. Sloan Manag. Rev. 1992, 33, 7–17. [Google Scholar]
  70. Hall, C.C.; Ariss, L.; Todorov, A. The illusion of knowledge: When more information reduces accuracy and increases confidence. Organ. Behav. Hum. Decis. Process. 2007, 103, 277–290. [Google Scholar] [CrossRef]
  71. Benton, M. The Knowledge Illusion: Why We Never Think Alone. Qual. Manag. J. 2017, 24, 51. [Google Scholar]
  72. Kumar, S.; Goyal, N. Behavioral biases in investment decision making–a systematic literature review. Qual. Res. Financ. Mark. 2015, 7, 88–108. [Google Scholar] [CrossRef]
  73. Smit, H.T.J.; Matawlie, N.R. Do Overconfident CEOs Ignore Toehold Strategies; Technical Report; Erasmus University: Rotterdam, The Netherlands, 2017. [Google Scholar]
  74. Huang, W.; Jiang, F.; Liu, Z.; Zhang, M. Agency cost, top executives’ overconfidence, and investment-cash flow sensitivity—Evidence from listed companies in China. Pac. Basin Financ. J. 2011, 19, 261–277. [Google Scholar] [CrossRef]
  75. Pikulina, E.; Renneboog, L.; Tobler, P.N. Overconfidence and investment: An experimental approach. J. Corp. Financ. 2017, 43, 175–192. [Google Scholar] [CrossRef] [Green Version]
  76. Seo, K.; Kim, E.E.K.; Sharma, A. Examining the determinants of long-term debt in the US restaurant industry: Does CEO overconfidence affect debt maturity decisions? Int. J. Contemp. Hosp. Manag. 2017, 29, 1501–1520. [Google Scholar] [CrossRef]
  77. Akben, S.E. Corporate diversification and firm value: Evidence from emerging markets. Int. J. Emerg. Mark. 2015, 10, 294–310. [Google Scholar] [CrossRef]
  78. Mackey, T.B.; Barney, J.B.; Dotson, J.P. Corporate diversification and the value of individual firms: A Bayesian approach. Strateg. Manag. J. 2017, 38, 322–341. [Google Scholar] [CrossRef]
  79. Stein, J.C. Internal capital markets and the competition for corporate resources. J. Financ. 1997, 52, 111–133. [Google Scholar] [CrossRef]
  80. Child, P.; Diederichs, R.; Sanders, F.H.; Wisniowski, S.; Cummings, P. SMR forum: The management of complexity. Sloan Manag. Rev. 1991, 33, 73–81. [Google Scholar]
  81. Kingwell, R. Managing complexity in modern farming. Aust. J. Agric. Resour. Econ. 2011, 55, 12–34. [Google Scholar] [CrossRef]
  82. Demsetz, H.; Lehn, K. The structure of corporate ownership: Causes and consequences. J. Political Econ. 1985, 93, 1155–1177. [Google Scholar] [CrossRef]
  83. Bushman, R.M.; Piotroski, J.D.; Smith, A. What determines corporate transparency? J. Account. Res. 2004, 42, 207–252. [Google Scholar] [CrossRef]
  84. Rakhmayil, S.; Yuce, A. Executive qualification and firm value. J. Appl. Bus. Econ. 2013, 14, 52–70. [Google Scholar]
  85. Quigley, T.J.; Hambrick, D.C.; Misangyi, V.F.; Rizzi, G.A. CEO selection as risk-taking: A new vantage on the debate about the consequences of insiders versus outsiders. Strateg. Manag. J. 2019, 40, 1453–1470. [Google Scholar] [CrossRef]
  86. Cui, Y.; Zhang, Y.; Guo, J.; Hu, H.; Meng, H. Top management team knowledge heterogeneity, ownership structure and financial performance: Evidence from Chinese IT listed companies. Technol. Forecast. Soc. Chang. 2019, 140, 14–21. [Google Scholar] [CrossRef]
  87. Coles, J.L.; Daniel, N.D.; Naveen, L. Boards: Does one size fit all? J. Financ. Econ. 2008, 87, 329–356. [Google Scholar] [CrossRef] [Green Version]
  88. Wen, Z.; Ye, B. Analyses of Mediating Effects: The Development of Methods and Models. Adv. Psychol. Sci. 2014, 22, 731–745. [Google Scholar] [CrossRef]
  89. Chen, R.; Zheng, Y.; Liu, W. Mediation Analysis: Principles, Procedures, Bootstrap Methods and Applications. J. Mark. Sci. 2015, 9, 120–135. [Google Scholar]
  90. Imai, K.; Kim, I.S. When should we use unit fixed effects regression models for causal inference with longitudinal data? Am. J. Political Sci. 2019, 63, 467–490. [Google Scholar] [CrossRef]
  91. Kim, J.B.; Wang, Z.; Zhang, L. CEO overconfidence and stock price crash risk. Contemp. Account. Res. 2016, 33, 1720–1749. [Google Scholar] [CrossRef]
  92. Stock, J.H.; Wright, J.H.; Yogo, M. A survey of weak instruments and weak identification in generalized method of moments. J. Bus. Econ. Stat. 2002, 20, 518–529. [Google Scholar] [CrossRef]
  93. Sanderson, E.; Windmeijer, F. A weak instrument F-test in linear IV models with multiple endogenous variables. J. Econom. 2016, 190, 212–221. [Google Scholar] [CrossRef] [Green Version]
Figure 1. Theoretical framework.
Sustainability 11 06975 g001
Figure 2. Moderating effect of business complexity. (a) ROA as dependent variable; (b) Tobin_q as dependent variable; (c) EVA as dependent variable.
Sustainability 11 06975 g002
Figure 3. Visual distribution of treatment group and control group.
Sustainability 11 06975 g003
Table 1. Variable assignment explanation.
CategoryVariablesSymbolMeaning
Dependent VariableReturn on assetsROANet profit/total assets
Tobin’s Q Tobin_q Net operating profit after tax/replacement cost
Economic Value AddedEVA(Net operating profit after tax-Total capital) × Weighted average cost of capital
Independent
Variables
Proportion of top managers with famous universities experience in the TMTProp_fcuThe proportion of top managers graduated from “985 project” universities in the TMT
Control VariablesFirm SizeSizeNatural logarithm of total assets
Firm AgeAgeNatural logarithm of years after initial public offering
Top management sizeTMT_sizeThe total number of top managers in the TMT
Firm Financial LeverageLeverageLiabilities/assets
Investment opportunitiesOIDepreciation expenditure/total sales
Free cash flowFCFNet Operating Profits Less Adjusted Taxes + Depreciation and amortization − Increase in operating capital − Capital expenditure
Cash reinvestment ratioCIRNet cash flow from operating activities/(net fixed assets + Net held-to-maturity securities + Net Long-term debt investments + Net Long term equity investment + Current asset-current liability)
Mediating VariableOverconfidenceOCIf the TMT is overconfident, assign 1;
otherwise, assign 0
Moderating VariableBusiness complexitybclIf the business complexity is higher than median, assign 1; otherwise, assign 0
Table 2. Descriptive statistics of main variables.
VariablesFull SampleHigh
Business Complexity
Low
Business Complexity
Mean
t-Test
MeanP50SDMinMaxMeanP50SDMinMaxMeanP50SDMinMax
ROA0.0840.0850.15−2.7062.5290.0650.0770.181−2.7061.6110.1050.0920.102.5290.022 **
Tobin_q2.441.7123.2120.089121.51.7391.1483.2510.089121.53.262.492.9620.25552.831.32 *
EVA0.0990.0310.614−7.39522.720.0910.0260.628−7.3958.50.1080.0380.597−0.922.72−0.028 **
Prop_fcu0.1260.0880.10900.9540.1240.0860.10400.9540.1280.0880.0900.0290.032
OC0.61310.487010.62110.485010.60610.48901−0.015
Note: * p < 0.05, ** p < 0.01.
Table 3. Main effect.
VariablesIII
ROATobin_qEVAROATobin_qEVA
Prop_fcu0.0162 *0.0326 **0.078 **0.0385 ***0.0518 ***0.188 **
(1.72)(2.12)(2.20)(2.65)(2.66)(2.34)
Size 0.543 ***
(4.55)
−0.563 ***
(−12.90)
0.372 ***
(7.05)
Age0.094
(1.07)
0.244 ***
(7.49)
−0.109 ***
(−2.79)
TMT_size−0.019
(−0.64)
0.034 **
(1.97)
0.003
(0.14)
Leverage−0.29 ***
(−4.62)
−0.143 ***
(−5.46)
−0.228 ***
(−7.17)
OI0.307 ***
(7.31)
0.029
(1.46)
0.265 ***
(10.86)
FCF0.028
(1.62)
0.018
(1.61)
0.056 ***
(4.12)
CIR0.077 ***
(3.06)
0.062 ***
(5.17)
0.097 ***
(6.62)
IndustryYesYesYesYesYesYes
YearYesYesYesYesYesYes
N392639263926392639263926
Adj_R20.09110.08420.08520.09110.08420.0852
Note: * p < 0.10, ** p < 0.05, *** p < 0.01; T-value of regression coefficient are in parentheses.
Table 4. Mediating effect of overconfident.
VariablesIIIIIIIV
OCROATobin_qEVA
Prop_fcu−0.118 ***
(−2.67)
0.019 *
(1.72)
0.074 **
(2.01)
0.122 **
(2.32)
OC−0.01 *
(−1.78)
−0.052 *
(−1.92)
−0.028 **
(−2.08)
ControlYesYesYesYes
IndustryYesYesYesYes
YearYesYesYesYes
N3926392639263926
Adj_R 20.0280.080.1390.08
Note: * p < 0.10, ** p < 0.05, *** p < 0.01; T-value of regression coefficient are in parentheses.
Table 5. Moderating effect of business complexity.
VariablesROATobin_qEVA
Prop_fcu0.042 ***0.325 ***0.372 **
(3.15)(5.93)(2.44)
bcl0.053
(1.06)
0.043 **
(2.07)
0.029
(0.99)
Prop_fcu×bcl0.07 ***
(3.66)
0.075 ***
(3.43)
0.349 *
(1.95)
controlYesYesYes
industryYesYesYes
yearYesYesYes
N392639263926
Adj_R20.09110.08420.0852
Note: * p < 0.10, ** p < 0.05, *** p < 0.01; T-value of regression coefficient are in parentheses.
Table 6. Estimation of average treatment effect.
τ ATT
T = 0ROATobin_qEVA
I
Full Sample
II
Low Business Complexity
III
High
Business Complexity
IV
Full Sample
V
Low Business Complexity
VI
High
Business Complexity
VII
Full Sample
VIII
Low Business Complexity
IX
High
Business Complexity
+1 to 00.003 **0.0028 ***0.0032 ***0.0126 ***0.0108 *0.021 ***0.013 **0.0043 **0.0178 ***
+2 to 00.012 **0.002 *0.022 ***0.0052 **0.0041 ***0.007 ***0.0223 *0.0055 ***0.034 ***
+3 to 00.006 *0.0012 **0.0032 ***0.0078 **0.0012 **0.021 ***0.0164 *0.0103 ***0.0062 ***
+4 to 00.005 **0.0032 ***0.0051 ***0.0226 ***0.0208 *0.031 ***0.025 *0.0143 **0.0152 ***
+5 to 00.021 **0.0029 *0.0372 ***0.0142 **0.0044 ***0.0101 **0.0524 *0.0145 ***0.0268 ***
Notes: * p < 0.10, ** p < 0.05, *** p < 0.01.
Table 7. Weak instrument tests for instrumental variables.
Test MethodChi-Square/F-Statisticp-Value
Hausman Test16.2380.000
Stock and Yogo15.1320.003
Sanderson-Windmeijer17.6220.000

