1. Introduction
Over the last decade, interest in companies’ social disclosure has increased substantially. The United Nations Environmental Program [
1] shows that the number of companies that released social information doubled between 2006 and 2013. Burrit [
2] defines social disclosure as the qualitative and quantitative information that measures, calculates or estimates companies’ social impact. Similarly, López-Arceiz et al. [
3] refer to social disclosure as a way of measuring the social effect an organization has on its stakeholders: that is, social disclosure makes known nonfinancial data related to social issues. The Global Reporting Initiative (GRI) requirements categorize nonfinancial disclosure information as workforce, human rights, community, and product responsibility.
Essentially, the information disclosed in sustainability reports allows firms to confirm their attempts to adapt to the social and economic context in which they operate. As such, social information disclosure legitimizes firms’ actions [
4]. In fact, prior research suggests that this desire for legitimacy is the primary reason why firms reveal social information [
5].
This study analyzes the social information provided by the Thomson Reuters Eikon database, which is one of the most important databases at the international level. We build a social index that reflects the information quality of companies from various countries and regions. Our index allows companies to increase transparency and to improve key social aspects of their operations. The index also boosts attention among researchers and the general public vis-à-vis the distribution of social quality information, which is particularly relevant given that the Global Reporting Initiative (GRI) 400 became effective on 1 July 2018 [
6]. The GRI guidelines were chosen because they represent the most widely recognized international standards that involve external reporting on social issues [
7].
To build our social index, we use categorical principal component analysis (CATPCA) and partial triadic analysis (PTA) to analyze different types of social information. In addition, we use between-group analysis to determine whether a relation exists between the GRI 400 standards, industries, and geographical regions.
Our results show that companies in Asia, Africa, the Middle East, and Latin America are more likely to disclose information on public policy, customer health, diversity, and equal opportunities relative to companies. However, companies from the United States and Europe tend more to disclose information on human rights and the local community.
As regards social indicators and industries, and particularly in the pharmaceutical and chemical as well as metal and mining industries, companies in Asia and Latin America primarily focus on disclosure related to customer health as well as product and service safety throughout the different stages of the product life cycle. These results confirm that companies reveal information in order to evidence their ability to adapt to the needs of the social-economic context in which they operate, thus legitimizing their actions [
4,
5].
The remainder of the paper is structured as follows.
Section 2 discusses previous works and limitations.
Section 3 provides the research methods, sample description, and analysis technique.
Section 4 presents the results of the empirical analysis in detail. Finally,
Section 5 offers some conclusions and implications.
2. Previous Works and Limitations
Interest has recently grown not only in the academic world but also in the business environment with regard to corporate disclosure reports related to social policy goals [
8]. The private sector is becoming increasingly aware of companies’ social policies, and, more and more, governments are extending their policies and regulations in relation to social disclosure. As such, private and public goals are converging to motivate firms to increase disclosure of their social activities, which has a desirable effect on society at large.
Current interest from both companies and society in understanding firms’ impact on society as a whole makes the topic of corporate social disclosures highly relevant. In recent years, companies have increasingly included social aspects of their operations in annual reports [
9]. Firms voluntarily provide social information as an addendum to the compulsory accounting data they are required to report. Their motivation to disclose social information can stem both from a growing awareness of social policies in the business world and from demands by stakeholders and others to provide such information.
Deegan [
5] argues that companies disclose social information in order to ensure public trust. Thus, in a desire to satisfy corporate stakeholders, firms are motivated to efficiently allocate resources. Choudhury [
10] suggests that disclosing social information reduces information asymmetries that can lead to market failures and that it instills confidence in the market. Similarly, Iris and Chiu [
11] find that when firms voluntarily disclose relevant social information about their business operations, they provide investors with important and otherwise inaccessible information. Given that the goal of social disclosure is to improve how others perceive the company, the most relevant theories in social disclosure are related to legitimacy and stakeholder interests, which are most commonly explained using a sociopolitical approach.
Suchman [
12] defines legitimacy as “a generalized perception or assumption that the actions of an entity are desirable, proper, or appropriate within some socially constructed system of norms, values, beliefs, and definitions” (p. 574). Accordingly, companies carry out strategies, including the disclosure of financial reports, that allow them to gain, or maintain, legitimacy [
5]. In other words, companies undertake strategies that they deem necessary to build or preserve their image [
7], based on public pressure related to the social and political environment [
13].
Stakeholder theory accepts the existence of different interest groups that have differing ideas about what should be considered optimal company performance and that have diverse capacities to influence the organization’s activity (Deegan, 5, p. 294). Different stakeholders take into account varying information regarding a company’s relation to social aspects in their strategic decision-making [
14,
15]. Recently, stakeholders have increasingly been focusing on their relationships with firms not only with regard to the economic but also the social aspects of a firm’s operations [
16,
17]. As a result, the social information a firm chooses to disclose (or not disclose) may influence stakeholders’ decisions related to the firm.
According to legitimacy and stakeholder theories, firms therefore reveal social disclosures to protect their reputation and identity by engaging with stakeholders. Prior literature refers to this interaction as a form of moral discourse [
18,
19]. However, the social impact of a firm cuts both ways—whereas social action can have a positive impact on a firm’s reputation, it can also have a negative effect if a firm’s decisions on social issues are perceived negatively by stakeholders [
15].
Using a range of different methodologies, several previous studies analyze the various social aspects which organizations disclose. Hogner [
20] looked at US companies’ social reports for several years and examined the variations between years. He found that changes in firms’ social information disclosure are linked to variations in the social performance expectations of the community. Gray, Kouhy, and Lavers [
21] used content analysis to study UK companies over 13 years and found that firms increasingly disclosed information related to employees and the community. Adams and Kuasirikum [
22] conducted a comparative and longitudinal study of corporate reports on ethical issues of chemical and pharmaceutical firms in the United Kingdom and Germany from 1985 to 1995. They examined all types of ethical reports, including customer relations, product quality, public welfare activities, safety, and product policies, and found substantial differences in the nature and patterns of the reports over time and between the two countries.
Snider, Hill, and Martin [
23] explored the legal, ethical, and moral aspects of Forbes magazine’s top 50 US companies (e.g., Coca-Cola, General Motors, Microsoft Hewlett-Packard) and top 50 non-US companies (e.g., Toshiba, Fiat Group, Sony, HSBC Group). They found that both US and non-US firms focus their attention on a similar group of stakeholders and, in general, on similar social problems. The difference between US and non-US companies relates to the specificity of the messages concerning the firms’ ultimate goals with variations evident in specific stakeholder categories such as customers, employees, shareholders, competitors, and society.
Gallego-Álvarez [
24] focused on analyzing the social information disclosed by Spanish companies belonging to the Ibex-35, which includes the main Spanish companies in the stock market. He defines ethical behavior as a set of actions taken by a company to improve the quality of life of its workers as well as relevant employee social conditions such as employment, health and safety, training and education, nondiscrimination, disciplinary practices, and freedom of association. Archel, Husillos, Larrinaga, and Spence [
25] also used a sample of Spanish firms to examine social disclosure in the automotive sector in the context of the relational dynamic between companies, society, and state. They found that companies used social disclosure to legitimize new production processes.
Gonçalves, Medeiros, Niyama, and Weffort [
26] examined the social disclosure of 83 companies listed on the Sao Paulo Stock Mercantile (BM) and Futures Exchanges (FBovespa) from 2005 to 2009. They used a composite index of 13 indicators to evaluate companies’ level of social disclosure. These indicators include a description of the objectives and goals for social programs, economic/financial value of the material resources allocated to social programs, economic/financial value of the human resources used in volunteer programs, and a description of the future social policies to be implemented by companies.
Chiu and Wang [
27] analyzed social disclosure for a sample of 246 Taiwanese companies. They manually compiled social information, including information related to public policy, diversity, human rights, employee relations, and philanthropy. Among other aspects, this information reported on the number of personnel involved in policy implementation, a stated human rights policy, employee benefits covered by insurance, the composition of the workforce by location, and philanthropy policies.
Sobhani, Amran, and Zainuddin [
28] examined companies in Bangladesh. They found that customer health, as well as the health and safety of products and services at the different stages of the product life cycle, are the indicators most widely used by pharmaceutical and chemical as well as real state (banking and insurance) firms. Gallego-Álvarez, Formigoni, and Pompa-Antunez [
29] provide similar results for Brazil. Companies located in the southeast region of the country, which accounts for more than half of the national production, including major factories and steel plants, place the greatest emphasis on social indicators related to customer health as well as public policy initiatives related to anti-corruption or anti-bribery practices.
Prior research has also examined social behavior based on the geographical region or country in which firms are located. Welford [
30] analyzed the social practices and disclosures of firms for three geographical areas—Europe, North America, and Asia. He found that Asian companies have more policies on ethics, bribery, and corruption as well as health and safety than are found in developing countries in Africa and Latin America. Specifically, Malaysia and Singapore disclose a greater amount of relevant information on codes of conduct on ethics, bribery, and corruption. This is probably because they trade at high levels with other countries that are perceived as extremely corrupt. Using a combination of interviews and content analysis, Islam and Craig [
31] examined the social reporting practices of a major export organization within a developing country such as Bangladesh. They found that the amount of information (measured in words) provided by companies on diversity increased from zero to 412 between 1987 and 2005. This increase is considerably high in relation to other social aspects such as child labor or other human resources.
Content analysis is one of the most frequently used methods in research on social disclosure. This analysis technique is based on searching for the presence or absence of information on a set of social topics. Other business aspects and broader contexts, such as region or location, can also be applied. Yong, Wenhao [
32] and Natoli, Zuhair [
33], among others, use content analysis to examine the social information made available by firms.
Previous literature also highlights that, although widely used, content analysis has certain limitations, particularly related to the finite number of social indicators considered by such studies. Studies have also noted the number of companies analyzed and single-country status as limitations [
34]. To alleviate these concerns, researchers can employ other types of methods. For example, categorical and numerical variables can be used to identify positive or negative social aspects of social information in different companies belonging to several countries. These variables require special treatment.
Given this discussion, we construct our analysis in order to more accurately represent the real social situation, so as to include both positive and negative factors of companies around the world. Specifically, we use CATPCA [
35] statistical techniques. Both techniques allow us to obtain a numerical value for each of the social factors from each of our sample firms. The final numerical value is the social index score, which is a linear combination of the values of the original numerical variables and the original categorical variables that are transformed into numerical variables. This index thus provides a global measurement of relevant social information worldwide.
We build the proposed index to create a common language for firms and stakeholders that allows for greater transparency and accountability between organizations. This new index allows us to expand the scope for measuring and analyzing social disclosure across both industry sector and country or geographical region. Using CATPCA and PTA allows us to deal with both categorical and numerical variables using publicly available information. The algorithm we develop from these methods can solve the missing values problem as well as problems related to combining the categorical and numerical variables published by firms and gathered in the databases. Because our index more closely reflects the actual situation of the social policies currently being carried out by companies in different countries and geographical areas, we open up a fresh avenue of research on social issues.
4. Results
Table 3 provides the results by companies based on five subgroups: categorical positive variables, numerical positive variables, categorical negative variables, numerical negative variables, and low contribution variables. The second and third columns, respectively, indicate whether the variable was originally a categorical indicator and/or stated in the negative form. As previously discussed, a higher value or an affirmative answer to a negative indicator suggests a negative response that does not support social conduct. For instance, variable V023—management departures—is assessed negatively with the question “Has an important executive management team member or a key team member announced a voluntary departure (other than for retirement) or has been ousted?” In this case, a negative answer supports positive social behavior. This variable is also a categorical indicator because only two answers, yes or no, are possible.
The fourth column of
Table 3 provides the weight of each indicator. Given the large number of indicators, we use these weights as the coefficients to construct an average of all the indicators. Thus, the greater a variable’s weight in the index the more the variable contributes to it. For example, V023—in subgroup 4, categorical negative variables—has a weight of 1.34%. In other words, this indicator provides 1.34% of the total information for the entire index, or 1.34% of the average of all the indicators.
According to
Table 3, subgroup 1, categorical positive variables, has the greatest weight in the index. This finding shows that these indicators, which account for 68.06% of the total index weight, are the most relevant because they provide the most information. Subgroup 2, numerical positive indicators, accounts for 0.85% of the index’s weight. Subgroups 3 and 4 provide the weights of categorical negative and numerical negative variables, respectively. Categorical negative variables account for 23.46% of the index’s weight, and numerical negative variables account for 1.52% of the index’s weight. These findings once again suggest that the categorical variables are more relevant to the index than the numerical indicators. Finally, subgroup 6, low contribution variables, includes all other variables—both categorical and numerical and/or positive and negative—that do provide non-significant information to the index. This subgroup adds 6.11% to the weight of the index.
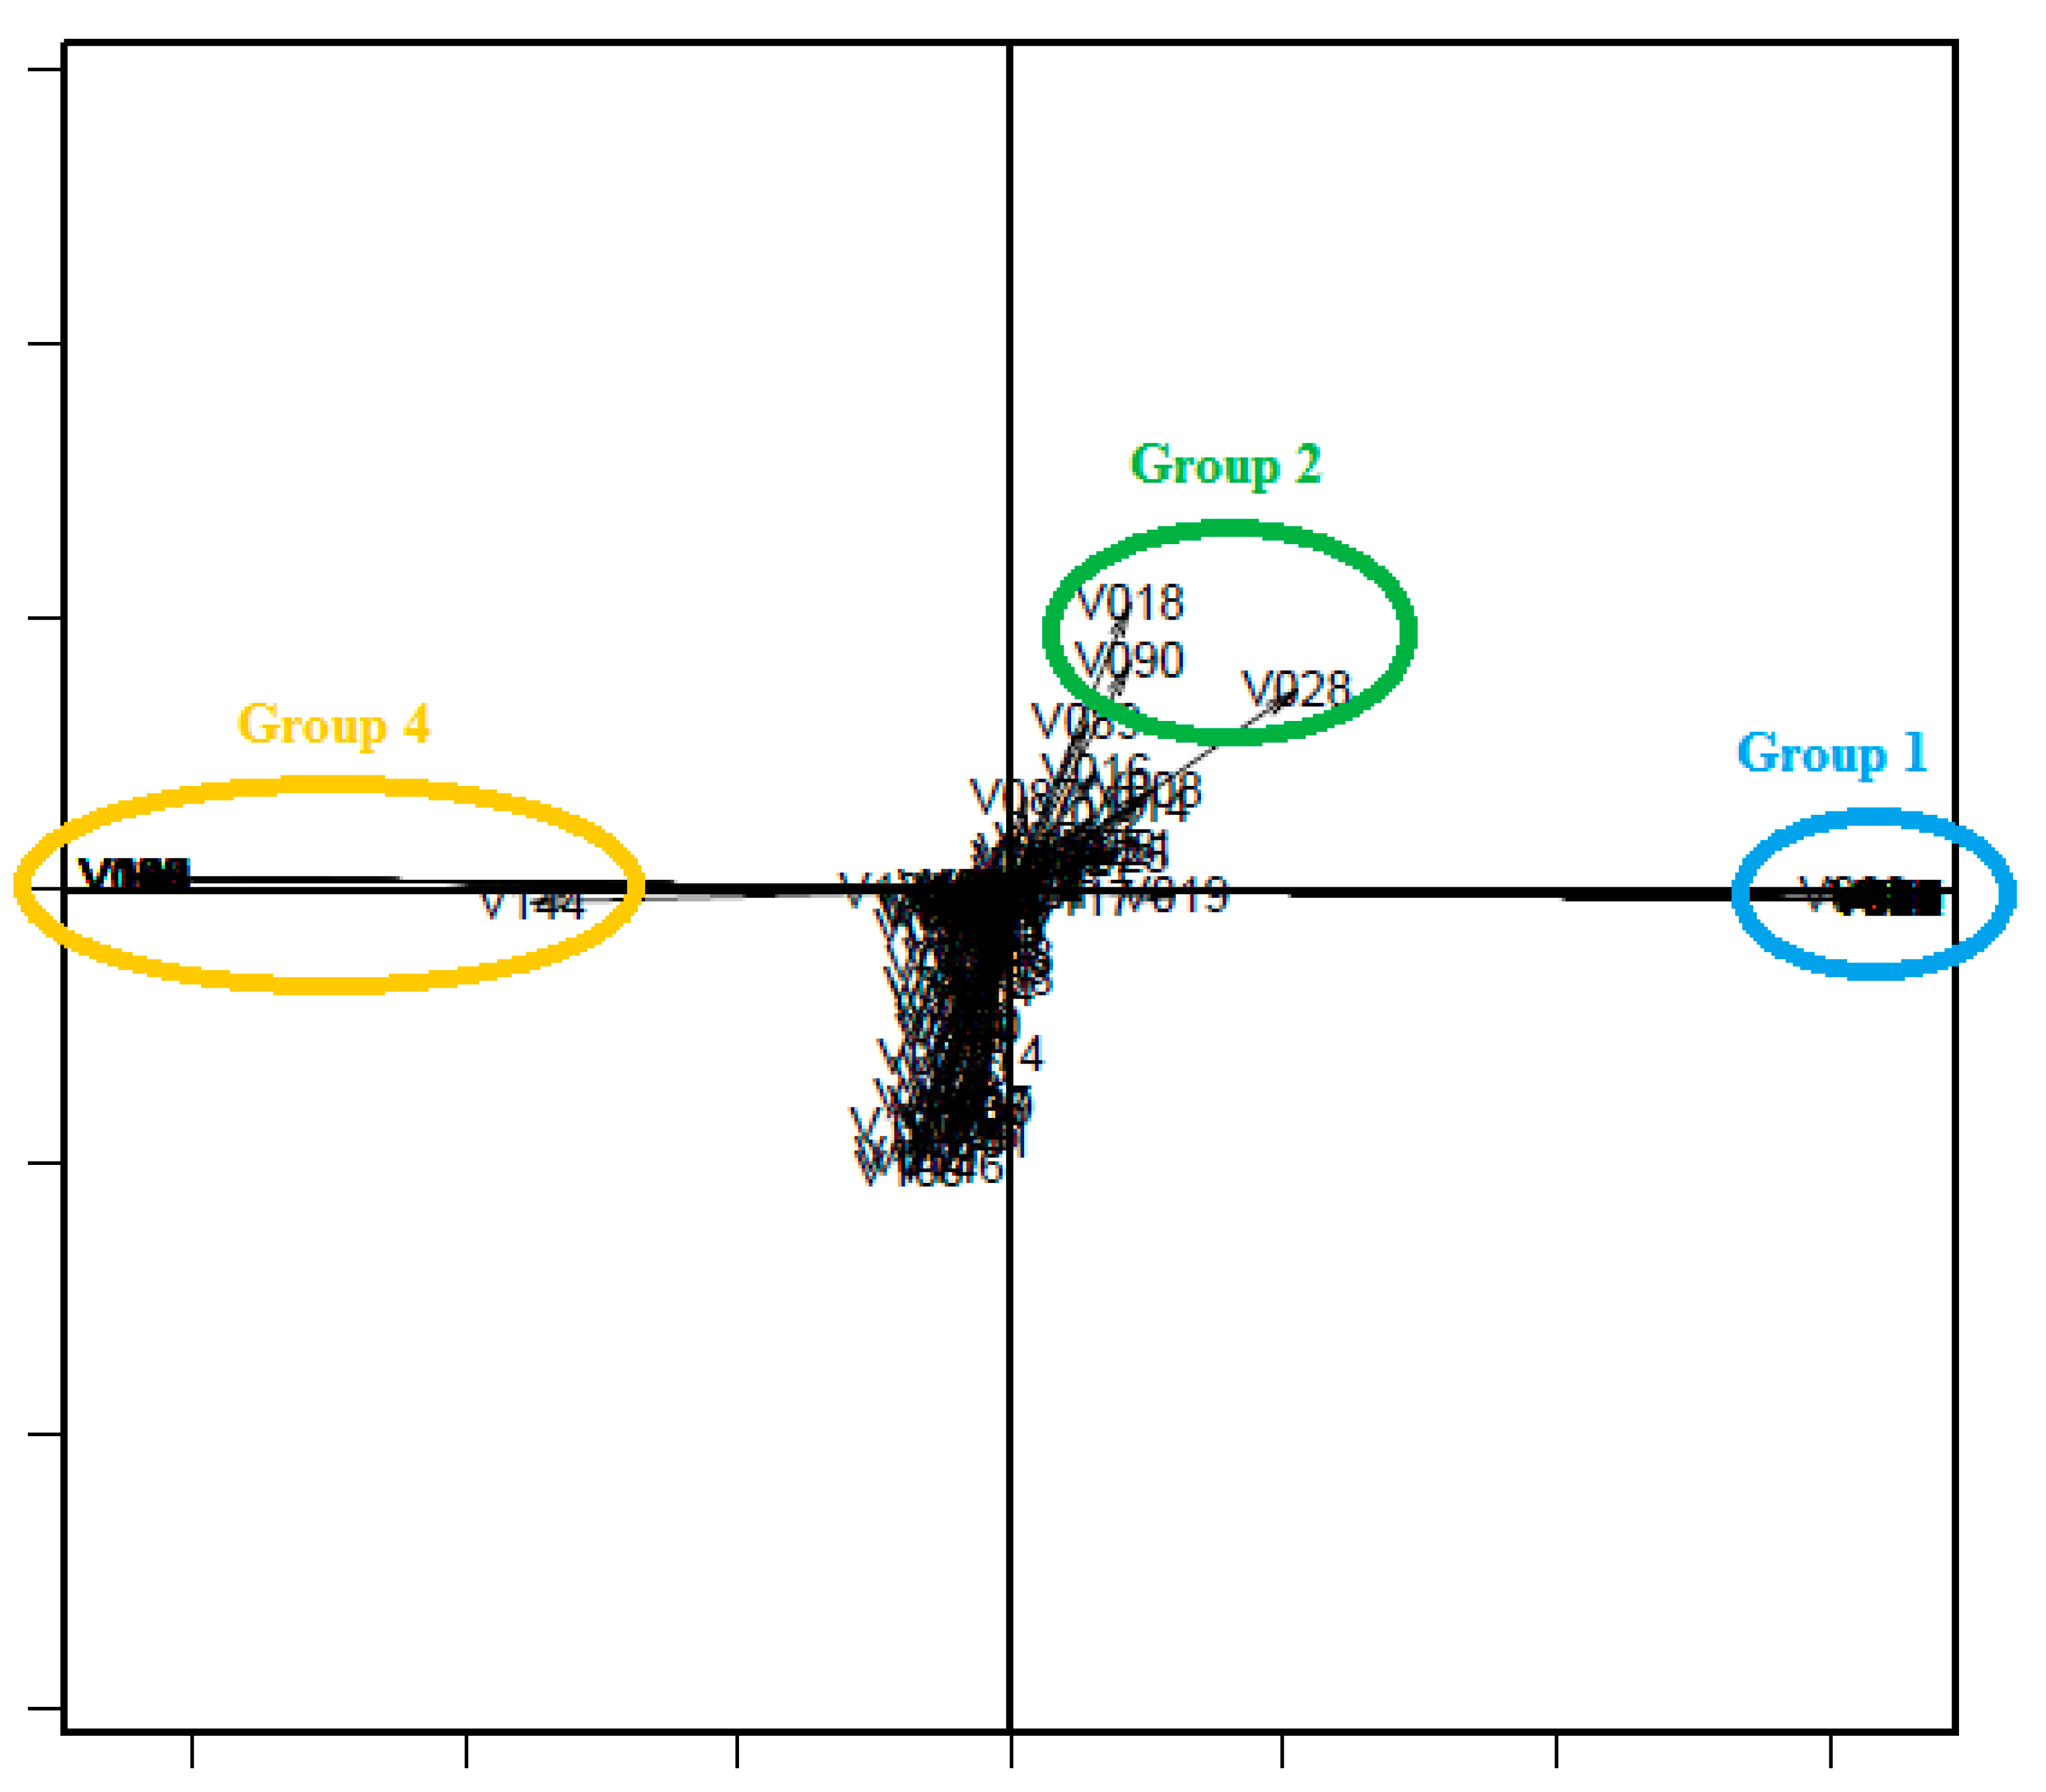
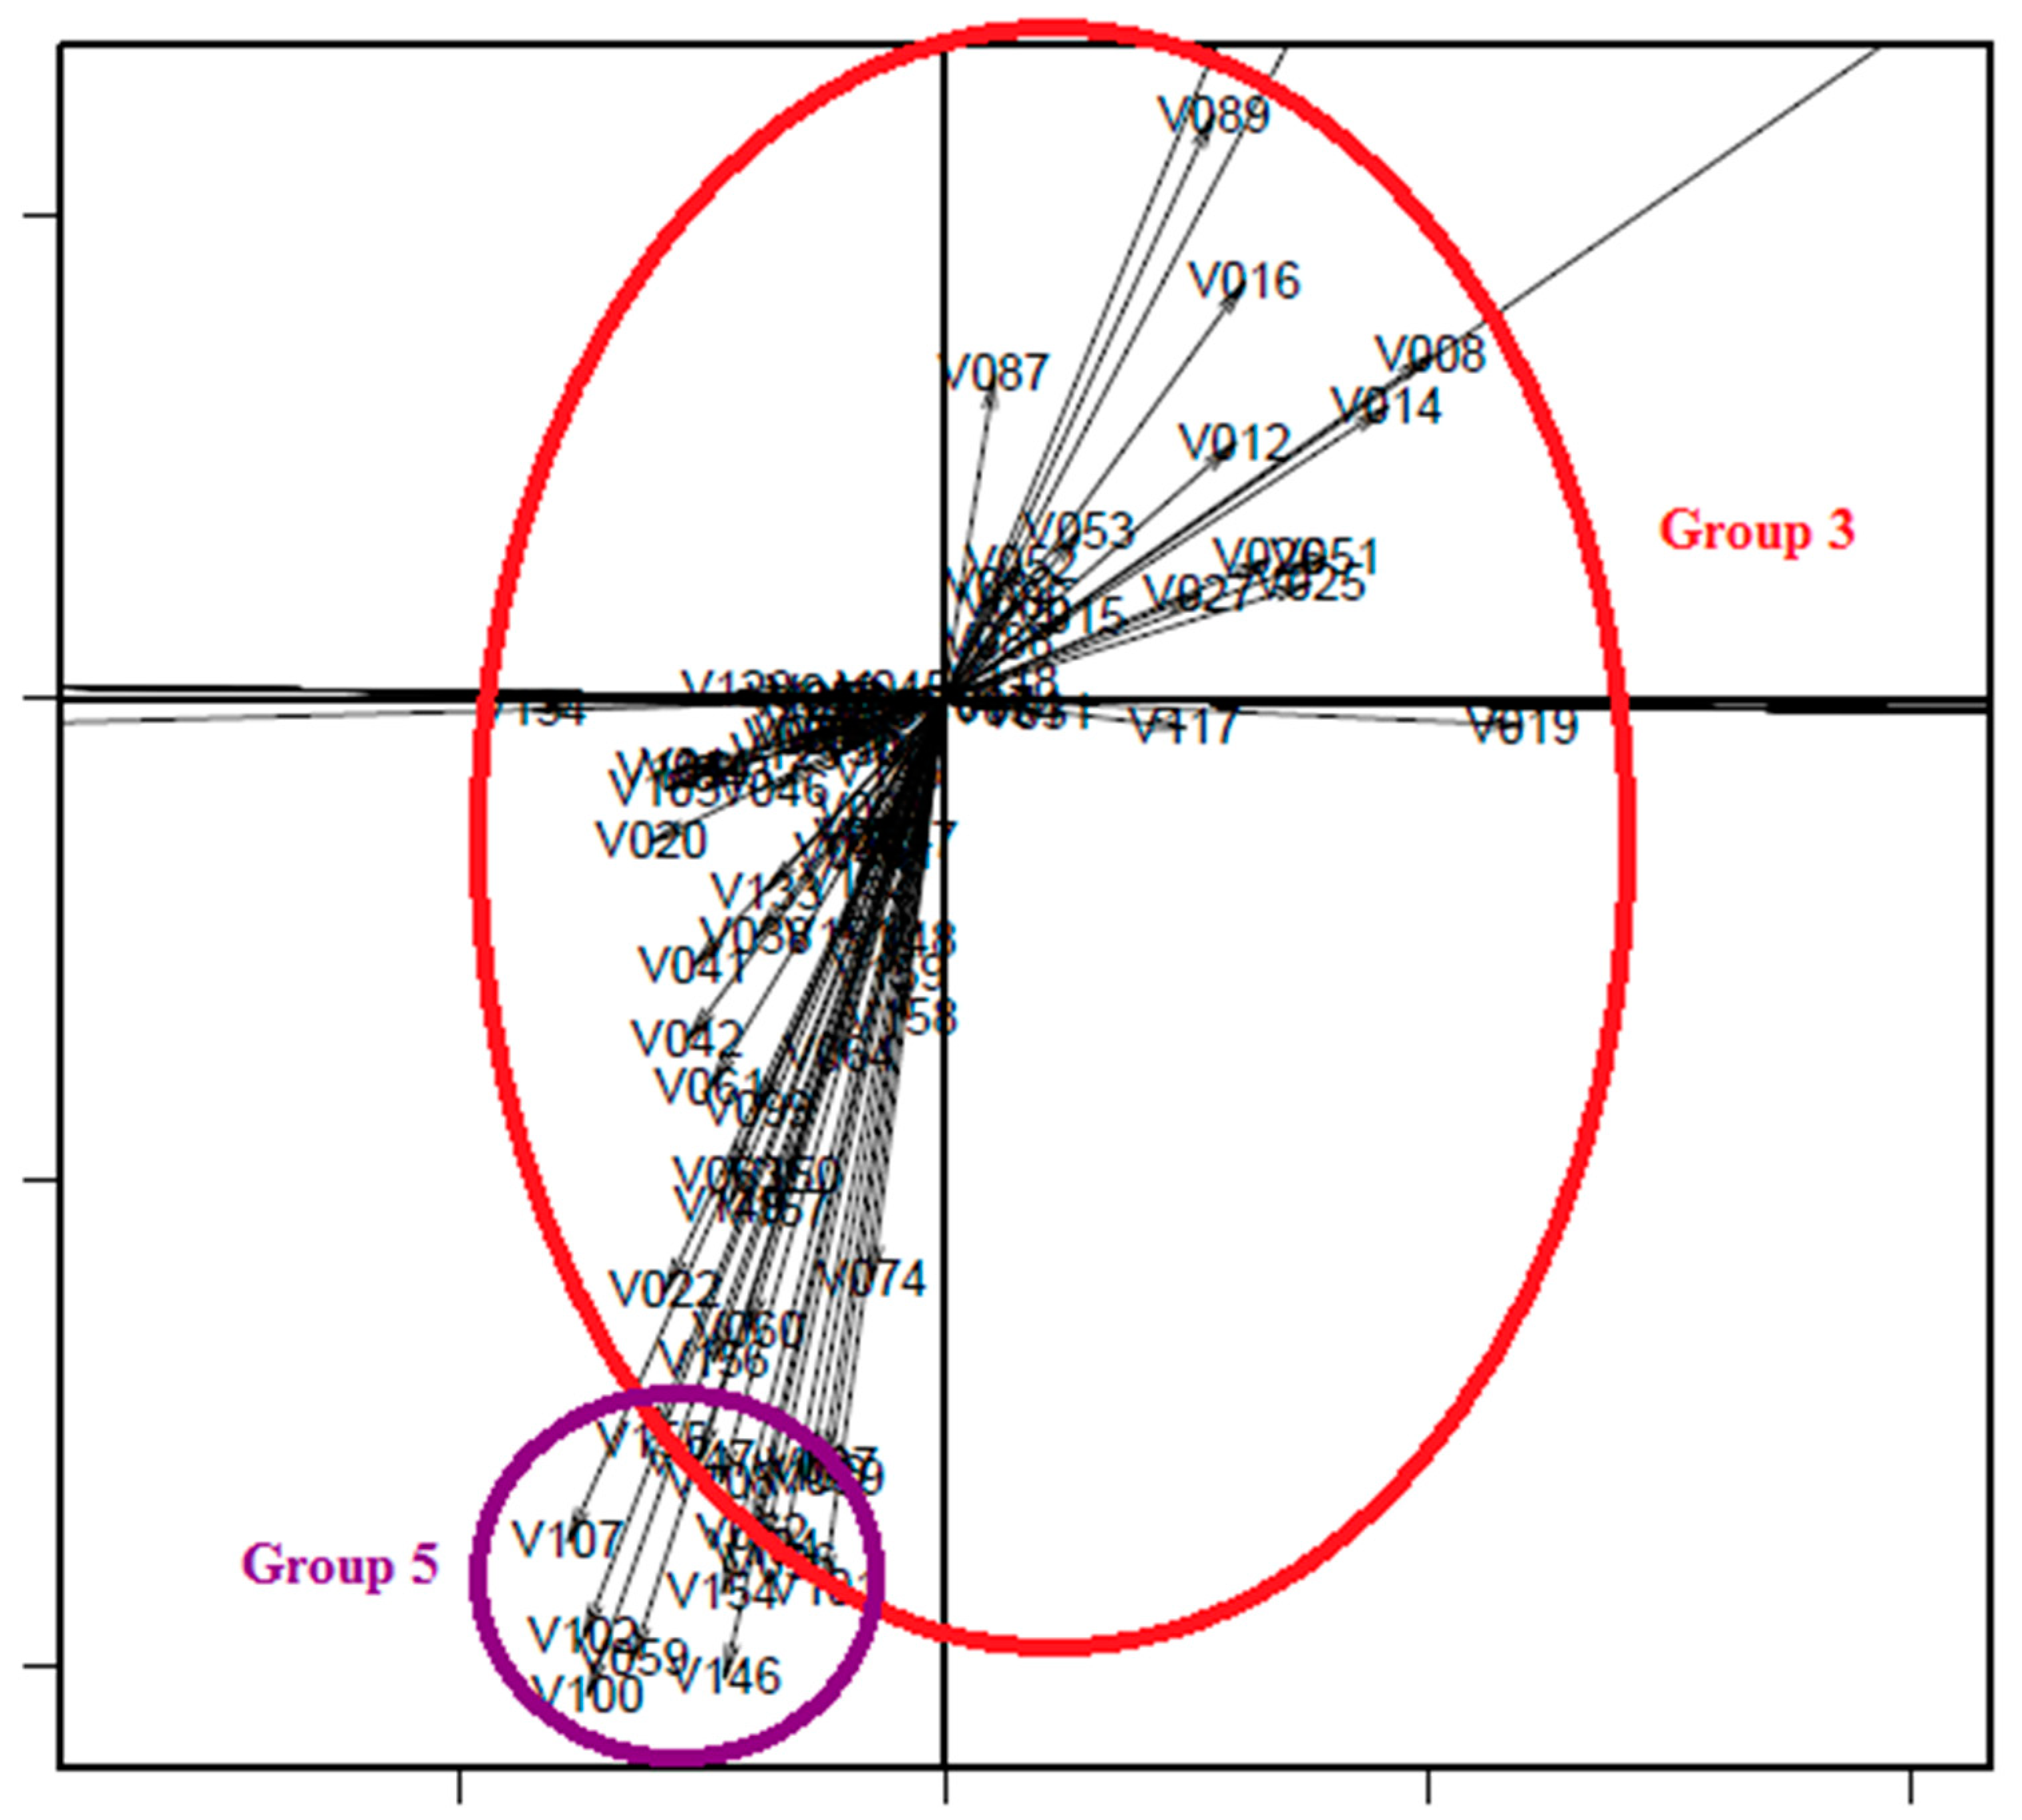
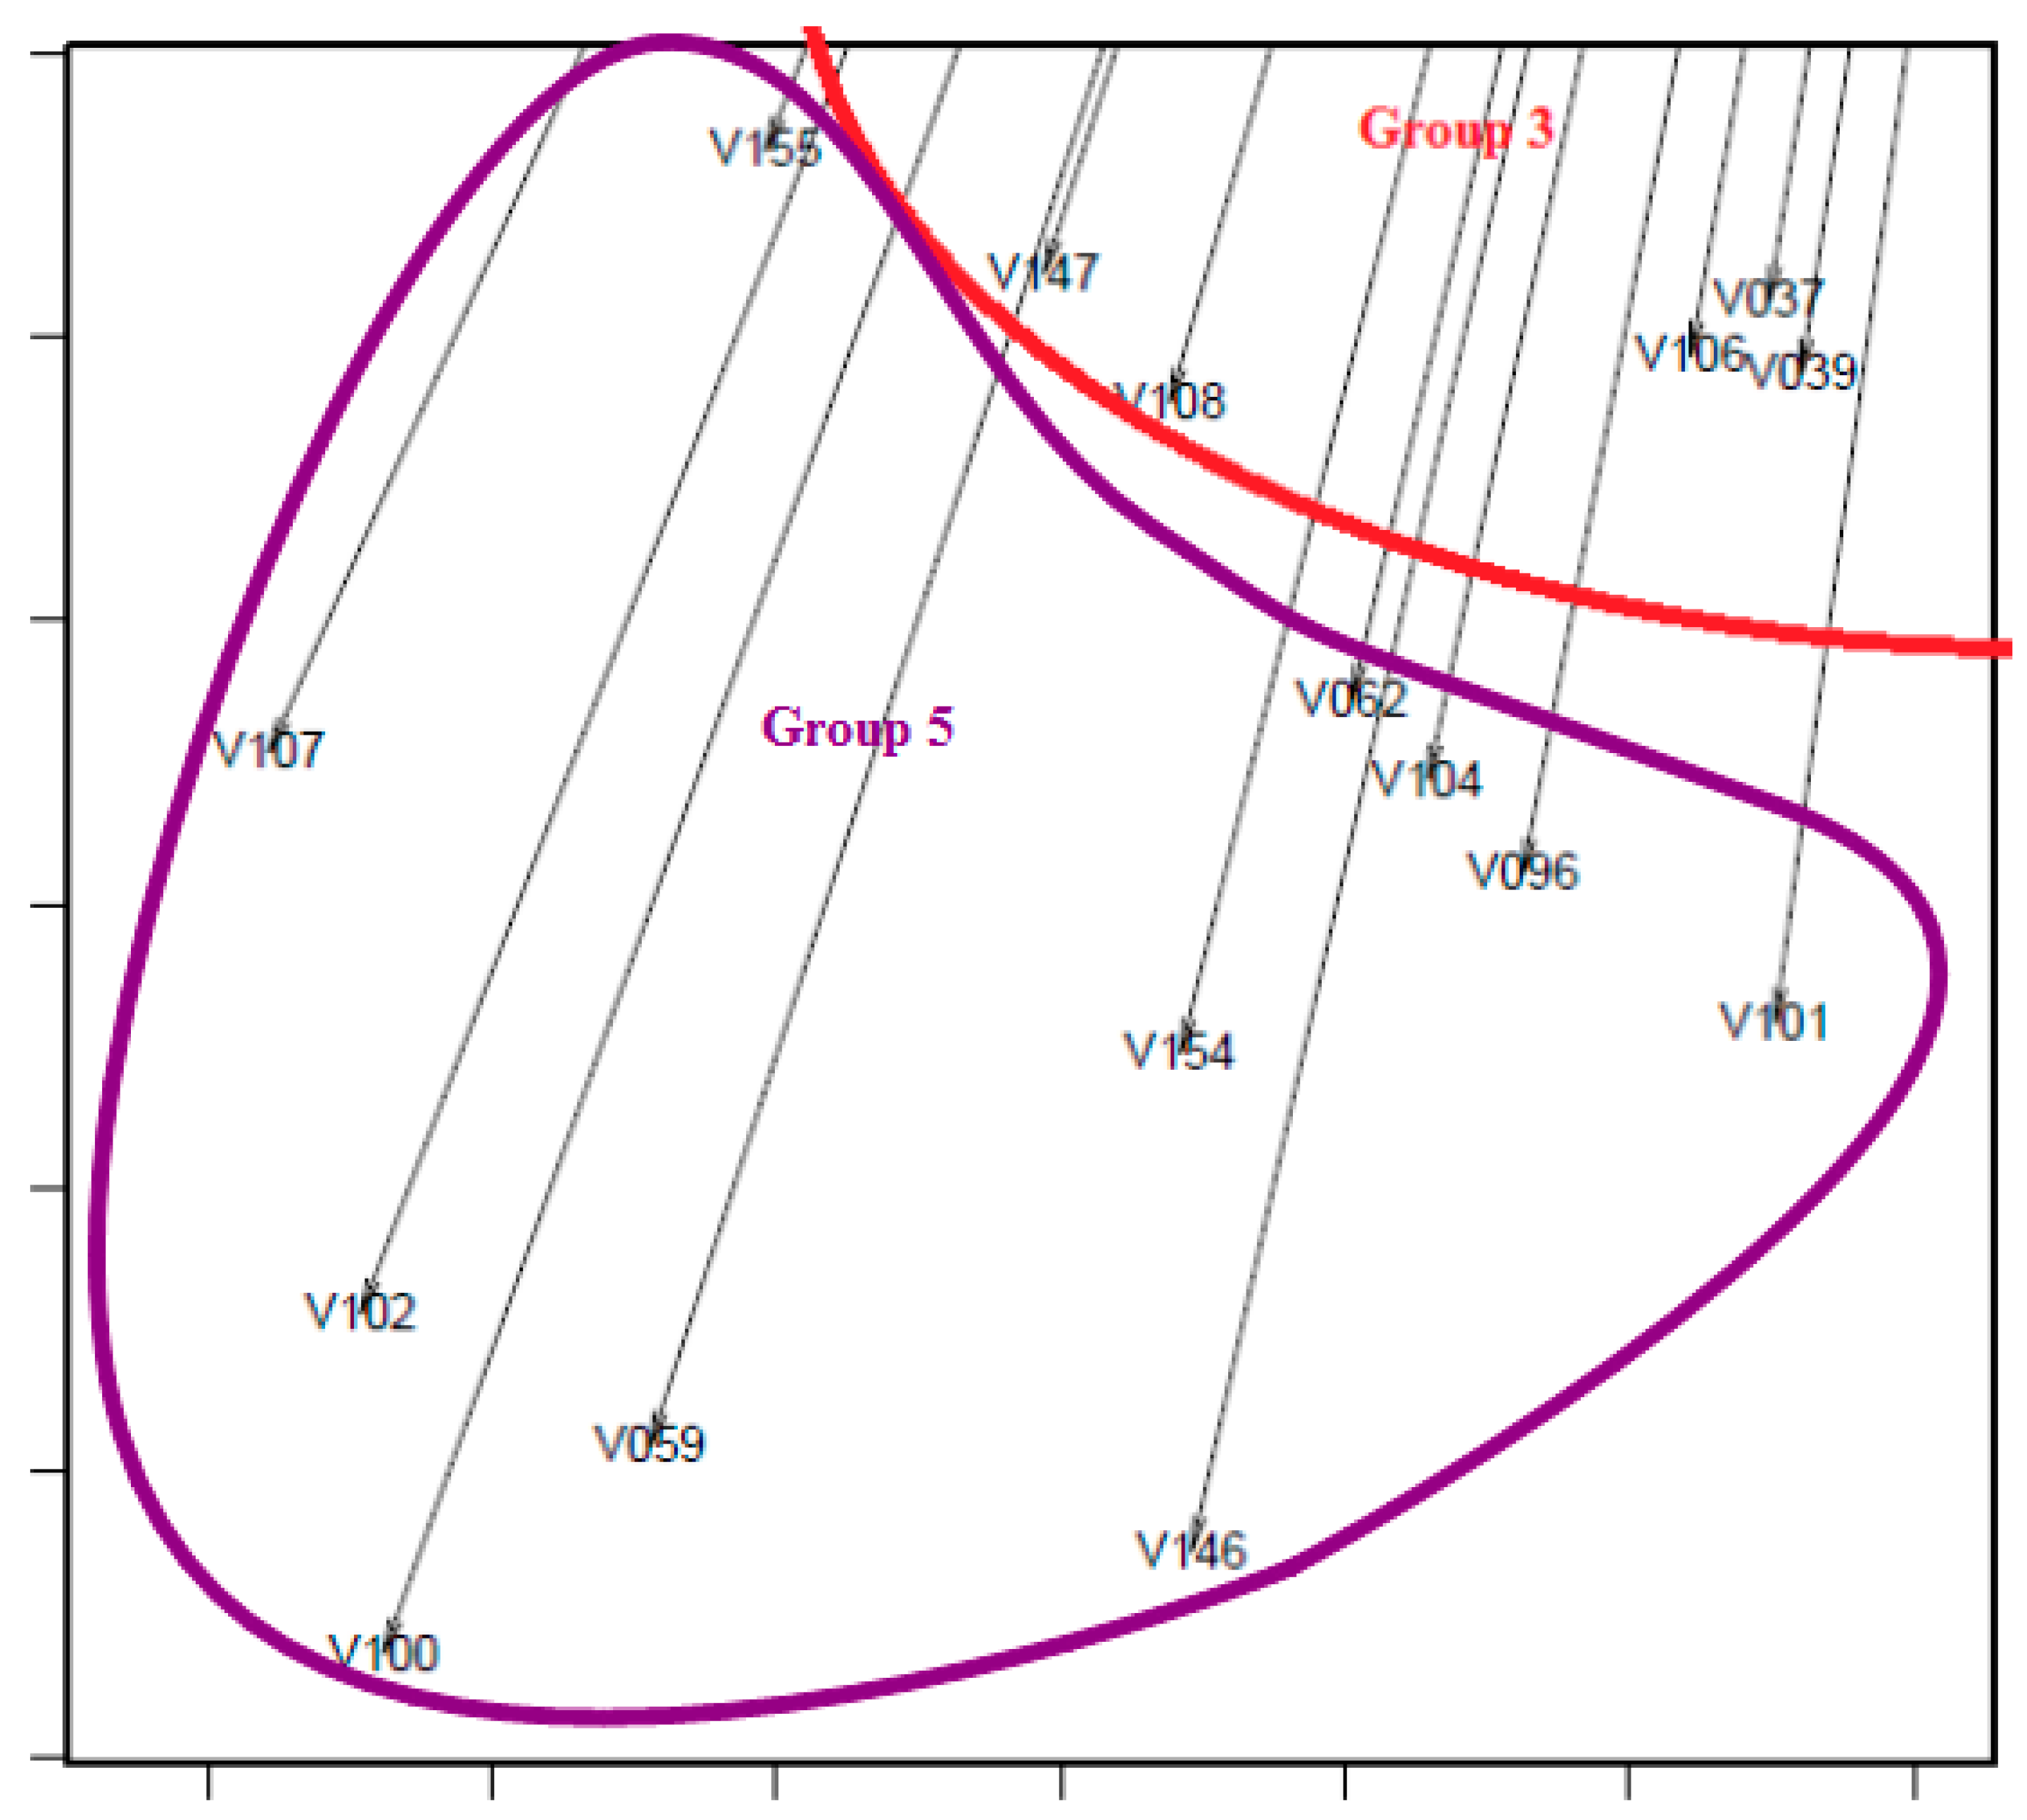
To confirm our results of the CATPCA and PTA calculations, we create an interstructure that demonstrates the relations between the indicators and the proposed index.
Figure 1 plots our findings, and
Figure 2 and
Figure 3 provide more detailed graphing of
Figure 1 for clarity. In this plot, the positive horizontal semi-axis represents our index. Consequently, the closer an indicator is located to that semi-axis, the more weight it gives to the index.
As previously mentioned, we interpret the construction of the index with this interstructure plot based on the length and angle of the vectors that symbolize the different indicators. Because the index is a weighted average of all the indicators, some indicators provide more information than others in the construction of the index, depending on the similarity and diversity between them. In the plot, both axes are used to portray that amount of information; they do not have a unit of measurement. However, the positive horizontal semi-axis is a representation of the index, so the closer an indicator’s vector is to that semi-axis and the longer it is, the more weight it provides to the average when the index is constructed.
In line with
Table 3, the weight of each subgroup matches its placements on the interstructure plot. Accordingly, the vectors of subgroup 1, categorical positive indicators, which contribute the greatest weight to the index’s construction (68.06%), are located very close to the positive horizontal semi-axis and have the longest vectors. Similarly, vectors subgroup 3, categorical negative indicators, which contribute the second-highest weight to the index (23.46%), are very long and located close to the horizontal semi-axis, but on the negative side of the semi-axis. Because subgroups 2, 4, and 5 do not contribute as much weight (0.85%, 6.11%, and 1.52%, respectively) to the index as subgroups 1 and 3, their vectors are shorter vectors and/or are not very close to the horizontal semi-axis. Subgroup 4 appears on the left side of the plot because its indicators are in the negative form. Subgroup 5 vectors appear furthest from the horizontal semi-axis that represents the index because the information provided by these indicators is very poor and thus not significant to the construction of the index.
To confirm the strength of the cluster classification, we perform a discriminant analysis to determine whether we effectively characterize the clusters.
Table 4 shows that 153 out of the 159 indicators retain the initial classification. All the variables in subgroups 1, 2, and 5 stay in their respective groups as per the discriminant analysis. One of the 11 variables in subgroup 3 together with five of the 76 variables in subgroup 4 do not align with the findings of the initial analysis. Consequently, 96.2264% of the initially grouped indicators are accurately arranged. This finding thus provides strong support for our results from the CATPCA and PTA.
Moreover, we also performed discriminant analysis in order to check the classification for the countries into regions.
Table 5 shows that 64.7% of all the companies are accurately arranged.
We then conducted a between-group analysis to analyze the relation of geographical areas and activity sectors with the GRI indicators. This data matrix includes rows or columns (or both) that belong to different groups. Therefore, we run the between-group analysis on the 5412 sample companies (in rows) and the 159 social indicators (in columns); that is, we use our original matrix with all the variables transformed into numerical form.
The first step of the between-group analysis is to evaluate the averages of the rows and columns according to the group to which they belong. We examine nine geographical regions, 22 sectors, and 15 GRI indicators. Accordingly, we run two between-group analyses using two matrices: one matrix with nine rows (regions) and 15 columns (GRI indicators) and one matrix with 22 rows (sectors) and 15 columns (GRI indicators).
Table 1 provides the classifications for geographical regions and industry sectors.
Table 6 shows the indicators that belong to each of the 15 GRI standards.
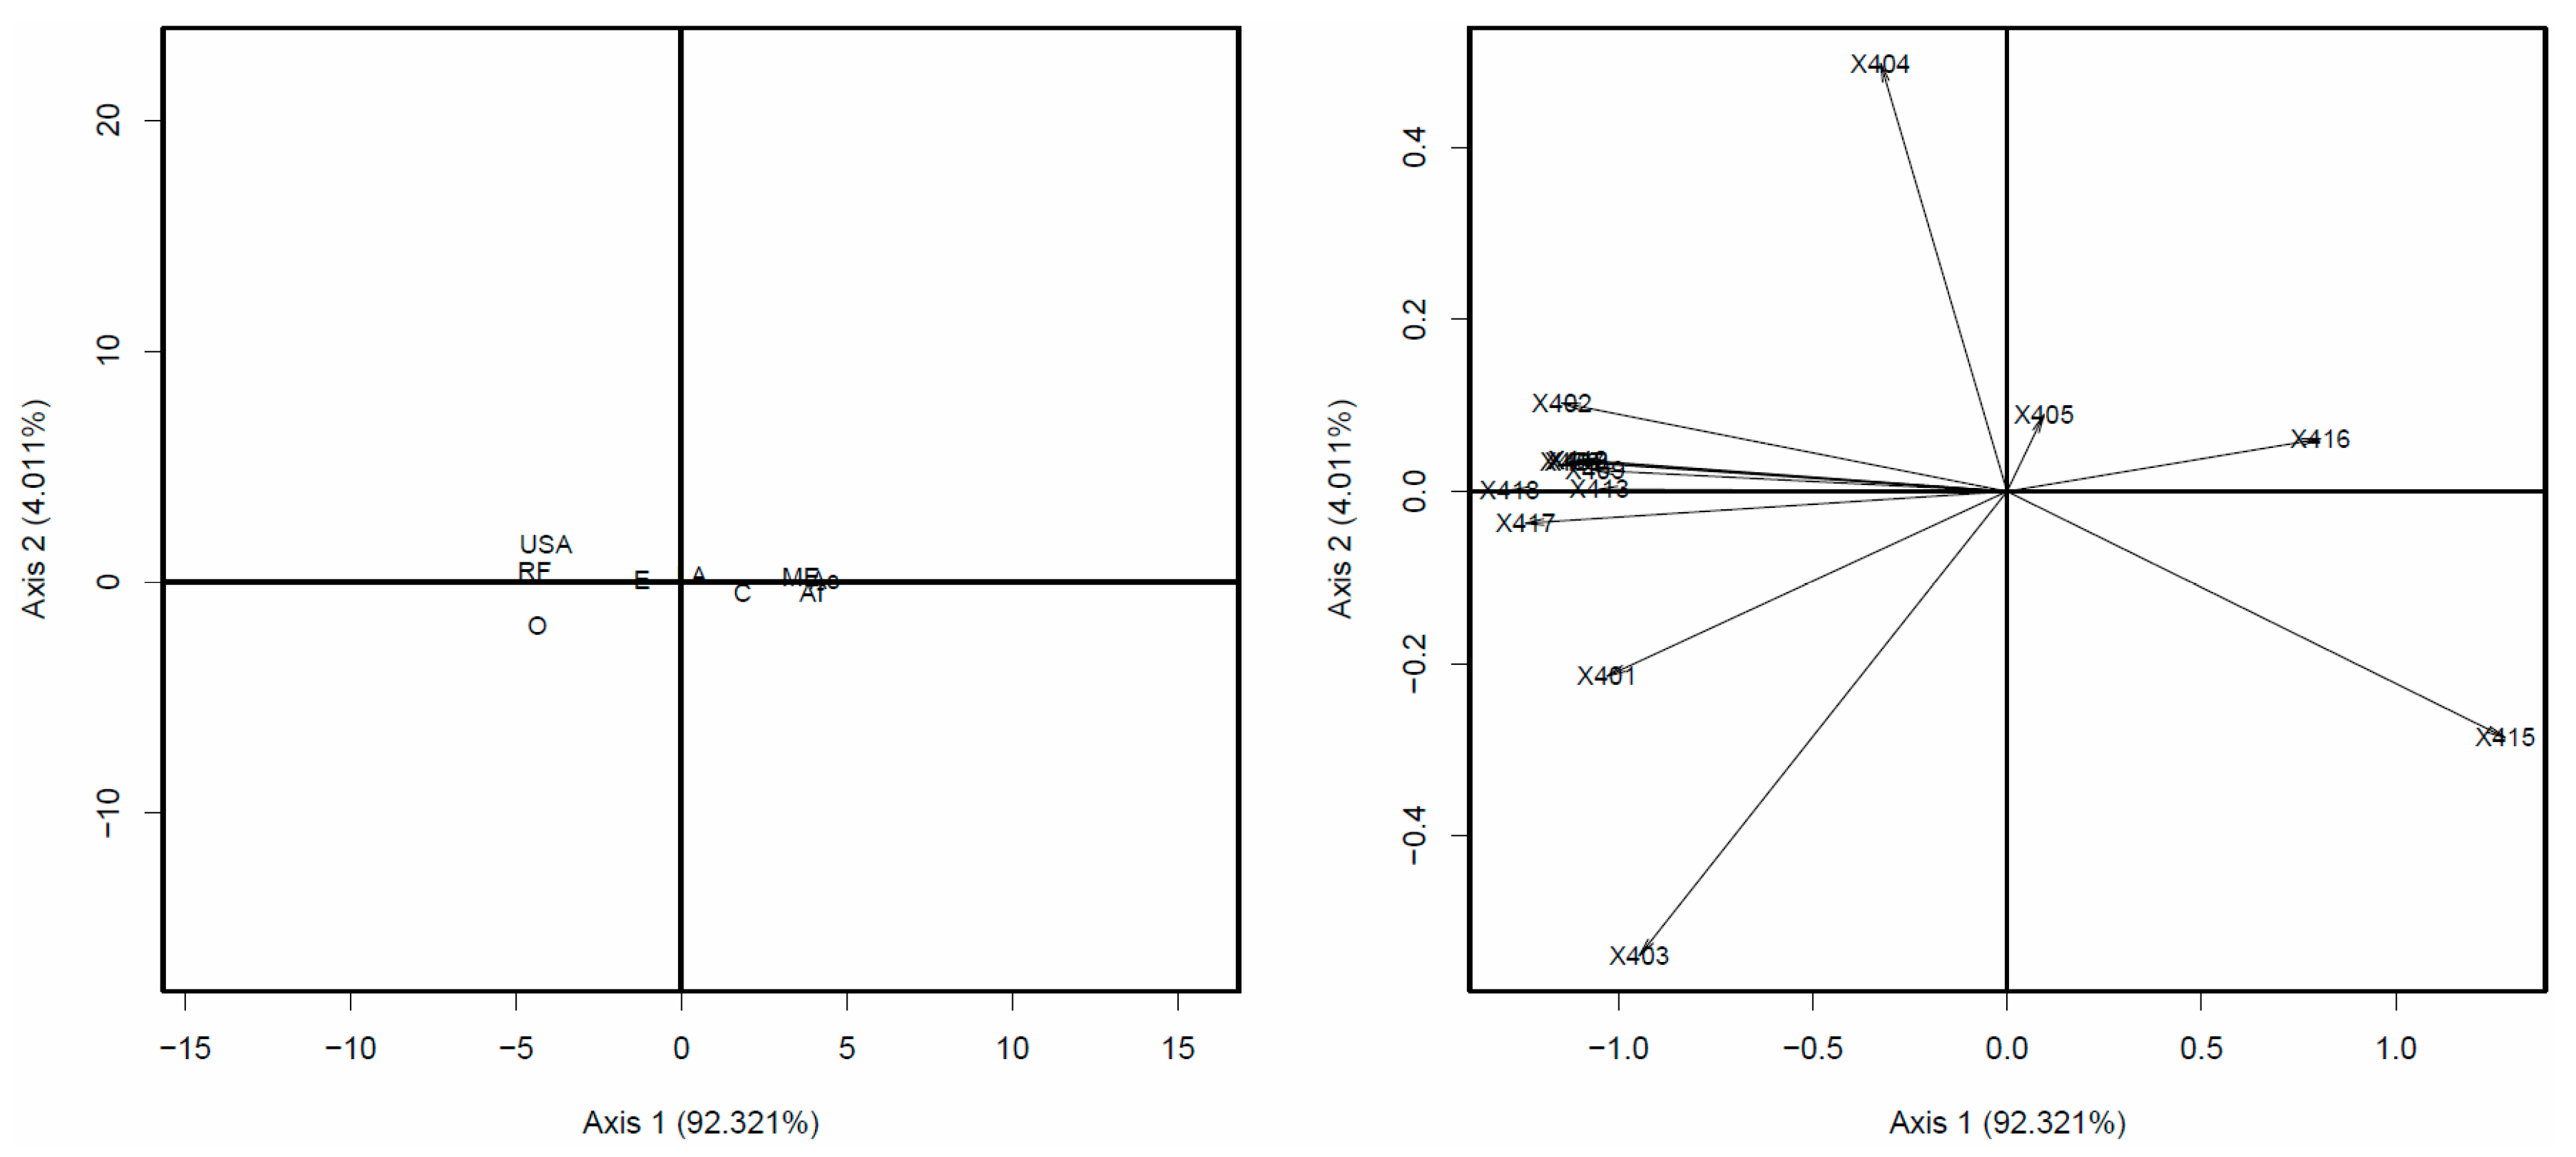
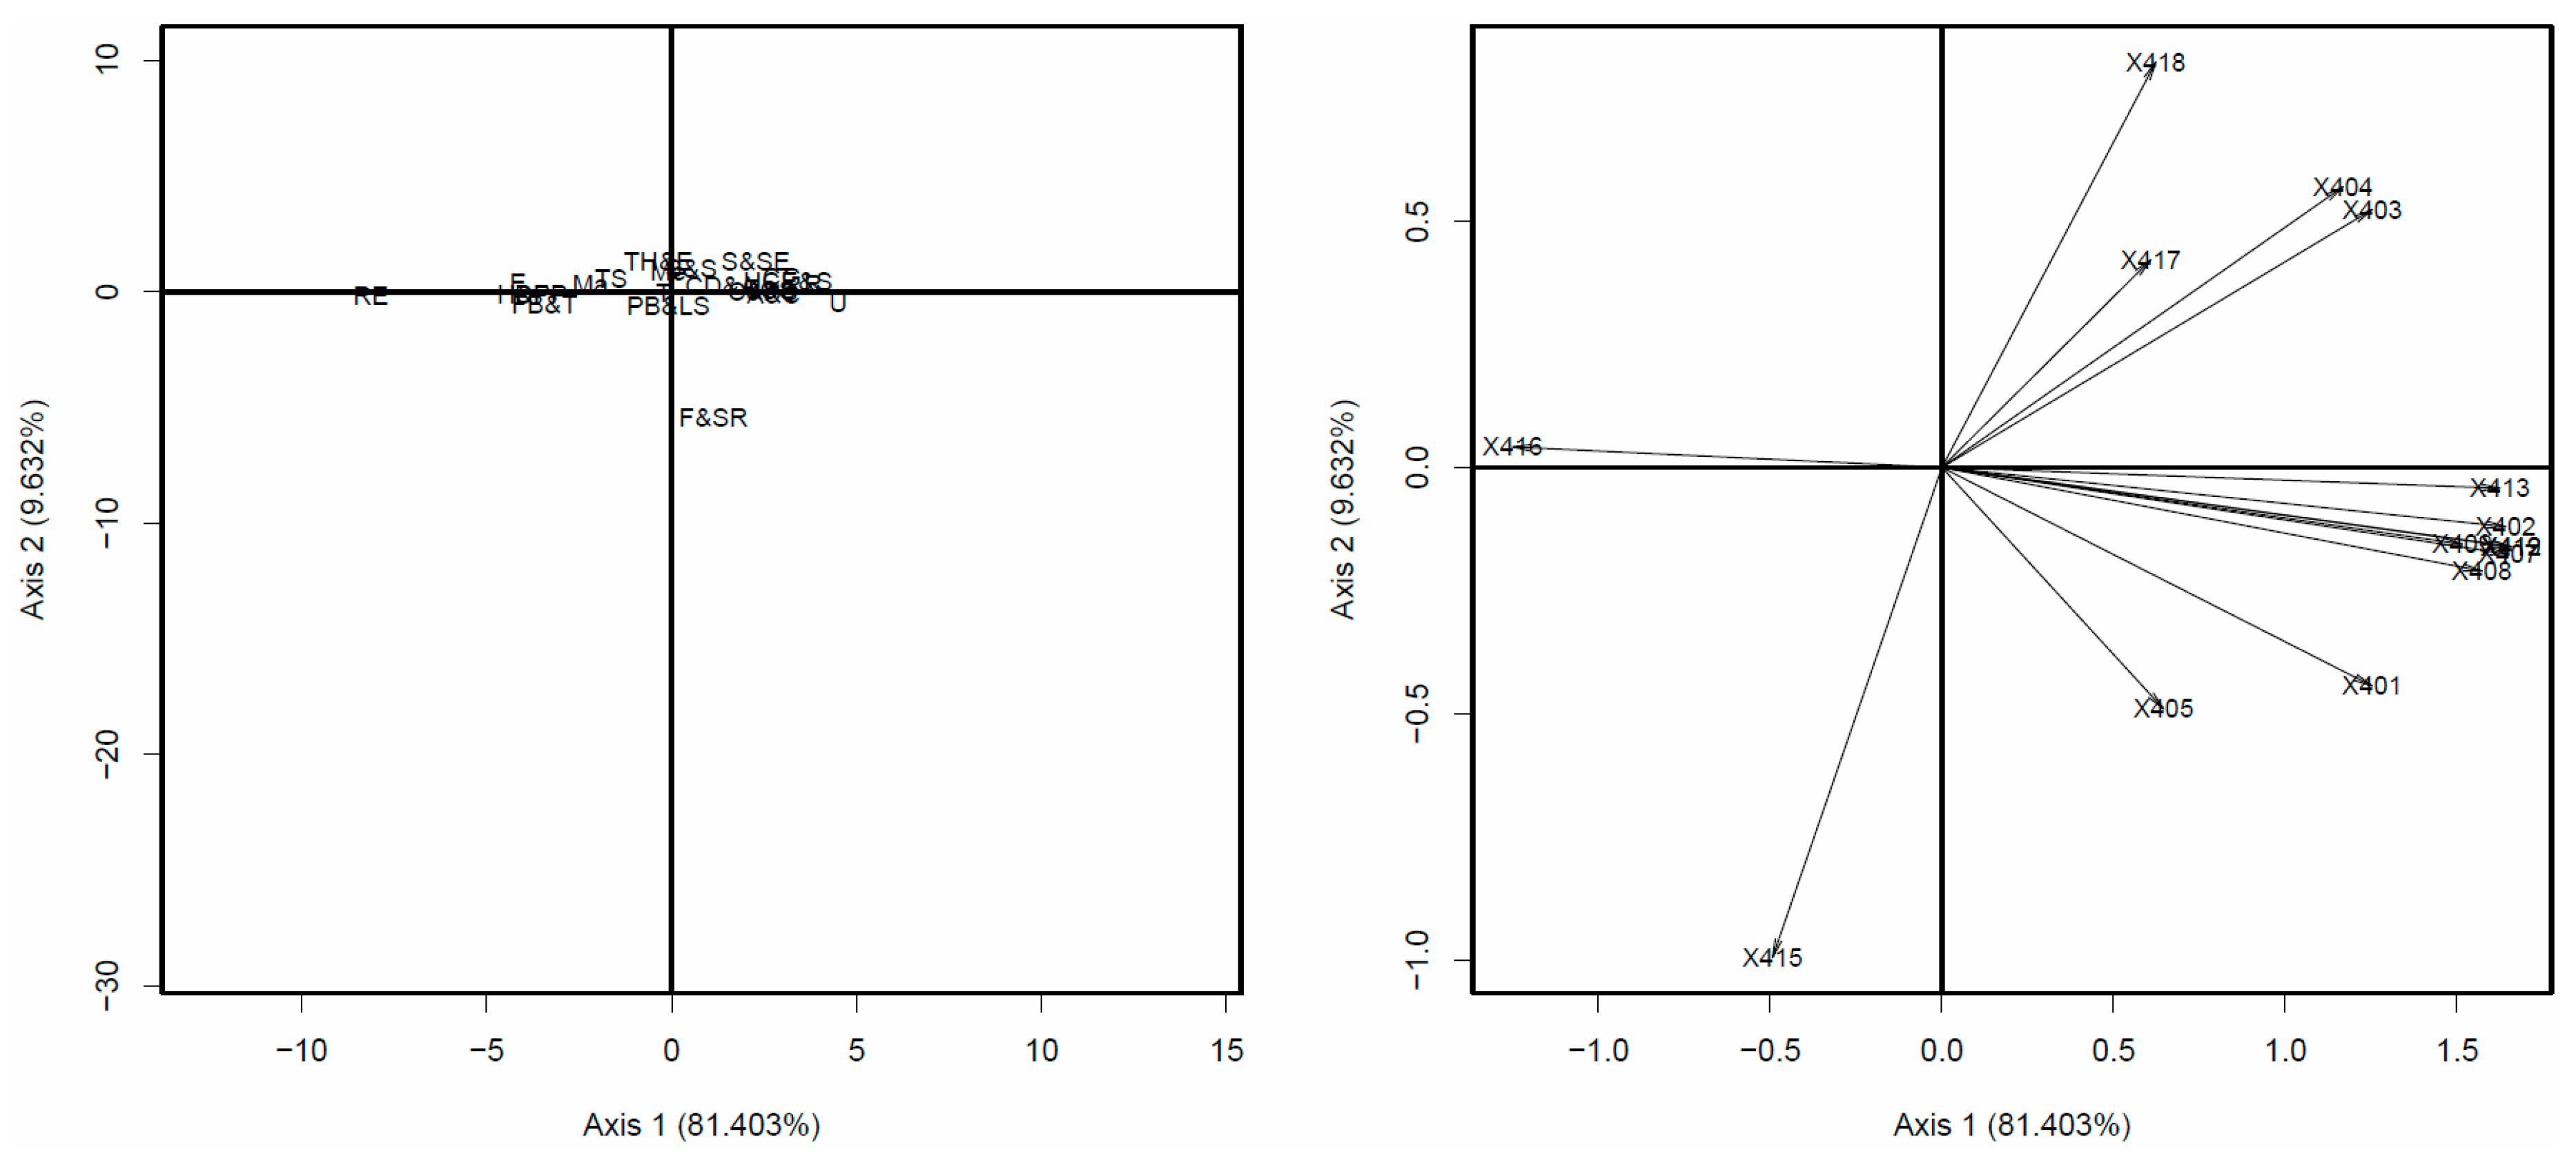
Figure 4 and
Figure 5 depict the relation between regions and industry sectors, respectively, and GRI indicators per the between-group analysis. Similar to
Figure 1, the axes do not have units because they graphically demonstrate the relations between geographical zones (
Figure 4) or industries (
Figure 5) and the GRI indicators. We interpret the findings based on the quadrants or semi-planes in which the regions or industries are located and, in the case of the GRI indicators, on the length and angle of the vectors. The percentages refer to the explained variance of each axis. Because we plot a matrix with several rows and columns on just two axes (i.e., a two-dimensional graph), some information is wasted during that dimension reduction.
The explained variance for the first axis is 92.321% for
Figure 4 (regions) and 81.403% (sectors). Because these percentages are so high, we do not discuss the second axes. Consequently, we draw our conclusions from the placement of the regions, sectors, or GRI indicators on the left or right semi-planes and not from their placement on the upper or lower semi-planes. The placement of regions or sectors on the right (left) semi-plane indicate the increased importance of GRI indicators plotted on the right (left) semi-plane; GRI indicators on the opposite semi-plane of the regions or industries are of little or no importance.
Figure 4 shows that Asia, Africa, the Middle East, and Latin America are located on the right semi-plane. Therefore, they are more closely related to the indicators on the right side: public policy (X415), customer health (X416), and, although its vector is quite short, diversity and equal opportunities (X405). The other indicators, appearing in the left semi-plane, are of little importance. Conversely, the Russian Federation, Oceania, the United States, and Europe appear on the left semi-plane, indicating the increased importance of the other 12 GRI indicators also appearing in the left semi-plane.
The importance of public policy, a GRI indicator associated with Asia, Africa, the Middle East, and Latin America, may highlight some risks associated with corruption, bribery, and undue influence. Public policy refers to the firm’s collaboration in the development of public policies that benefit society at large. Such activities may include, for example, use of pressure groups and financial or in-kind contributions to political parties, politicians, or their interests. Hence, in line with the findings of Welford [
30], our results suggest that aspects such as ethics, bribery, or corruption are of more interest in these countries.
Prior research shows that customer health is a priority in countries in less developed regions such as Africa and Latin America [
16,
17,
36]. Firms wish to garner customer loyalty by emphasizing the safety of the products they sell. Companies may increase their efforts along this line by revealing health and safety aspects of the products and services at the different stages of the product’s life cycle, such as development of product concept, research and development, certification, manufacturing and production, marketing and promotion, storage, distribution, and supply, use and service and disposal, reuse, or recycling.
Although widely relevant worldwide, diversity and equal opportunities are particularly important for developing countries, which may need to increase social behavior in these areas. When companies actively promote diversity and equal opportunities, they generate benefits, for both company and worker alike, by gaining access to a larger and more diverse set of potential workers. Society at large also benefits from this situation because greater equality promotes social stability and supports greater economic development. These policies also positively affect women by increasing their participation, responsibilities, and pay within [
6]. Consequently, our results on the GRI indicators of diversity and equality of opportunities support the findings of Islam and Craig [
31].
Figure 5 shows that the GRI indicators public policy (X415) and customer health (X416) appear together on a semi-plane—the left semi-plane in this case. The corresponding sectors, which also appear in the left semi-plane are real estate; energy; diversified financials; household and personal products; food, beverage, and tobacco; materials; telecommunication services; technology hardware and equipment; transportation; media; and pharmaceuticals, biotechnology, and life sciences. We obtain the same indicators because these industries are related to the countries in the right semi-plane of
Figure 4. These results support the findings of both Sobhani et al. [
28] and Gallego-Álvarez et al. [
29].
The remaining 13 GRI indicators are related to utilities, retailing, health care equipment and services, capital goods, consumer services, automobiles and components, commercial and professional services, semiconductors and semiconductor equipment, consumer durables and apparel, food and staples retailing, as well as software and services.
5. Conclusions and Implications
The rise in the number of companies disclosing information to stakeholders on their social behavior derives from an increased focus on social policies in the business world and, relatedly, to companies’ desire to legitimize their social actions by disclosing this information to stakeholders as well as society as a whole [
9].
Thus, the objective of social disclosure is to improve stakeholders’ and society’s image of the company. As such, prior research primarily relies on sociopolitical approaches, which confirm that companies disclose social information to protect their reputation and identity by engaging with stakeholders.
However, the methods by which social data are obtained, the use of a limited number of social indicators, and even the number of companies analyzed, which, in some cases, belong to a single country, might limit the applicability of previous studies [
34]. To mitigate these concerns, we use both categorical and numerical variables that identify positive or negative social aspects of social information for a large sample of companies belonging to several countries or regions. We build a social index using a linear combination of the values of all the original numerical variables and categorical variables, which are transformed into numerical variables. To construct our social index, we use the statistical techniques of CATPCA and PTA to analyze the different types of social information. In addition, we use between-group analysis to determine the relation of industries and geographical regions, respectively, with the new GRI 400 standards, which became effective on 1 July 2018 [
6].
Our results show that companies belonging to different geographical areas of Asia, Africa, the Middle East, and Latin America tend to disclose more information about public policy, customer health, as well as diversity and equal opportunities. However, companies from other geographical areas including the United States and Europe disclose more information on other social aspects such as human rights and the local community. We also verify the relation between social indicators and industries. Customer health, product and service health, and safety throughout the different stages of the product life cycle are the indicators most widely used by firms belonging to the pharmaceutical and chemical industries as well as metal and mining industries. These findings are in line with prior findings reported by [
28,
29] for companies in Bangladesh and Brazil, respectively. Consequently, our results add evidence to the notion that companies’ disclosure of their social behavior is relative and adaptable to the needs and norms of the social and economic context in which they operate. By responding appropriately (i.e., disclosing relevant social information), companies earn, or retain, their legitimacy [
4,
5].
Our index provides a measure of relevant social sustainability information in a global context and across industries. Therefore, companies can use the index as a measuring stick to determine their weak and strong areas in social aspects and disclosure in relation to their peers, based both on region and sector. In addition, other public and private enterprises (e.g., government bodies, stakeholders, society) can use the index to assess strengths and weaknesses when reporting in order to reward good practices and encourage increased disclosure (e.g., by demanding more information in a given country or a given industry). Furthermore, future studies that require social disclosure information and which need to examine the policy implications of disclosure, such as strengthening social legislation and related controls, can use our index and build on our results. The results also provide a relevant policy criterion to decide whether to distribute more or less awards or where to prioritize abatement and enforcement efforts among existing sources to positively affect social disclosure practices. In this sense, policymakers could use this index in their countries’ companies in order to improve the effectiveness of their policies based on greater transparency and in the context of the relational dynamic between companies, society, and state. Moreover, firms might use this index to consider the relevance of disclosure not only for themselves but also as a way of knowing in which environments social disclosure proves more effective.
Our main limitations stem from the non-availability of a longitudinal database, which could help to better understand the social evolution of our results, including the effect of institutional frameworks. Future research should examine more time periods to determine how the social indicator index evolves over time, both in the context of geographical areas and industries. Another interesting line of inquiry would be to investigate how institutional factors such as culture or legal systems influence the social aspects that companies disclose.


