5.1. Research Methodology
The present paper corroborates the results of two quantitative researches regarding the perception on using neuromarketing applications in online social networks, one from the organization’s perspective and the second from the user’s point of view. These two researches were designed together, mirroring each other, thus we can have a real image of the extent to which the organization’s purposes meet the user’s benefits in terms of collecting and using data from social networks through neuromarketing applications.
Considering that modern companies focus on being as friendly as possible with their customers, trying to avoid a distant and cold relationship based just on transactions, we see the emergence of a need to build a business model that delivers experiences for customers, not just sales for the company and return on investment for shareholders. Customers want to be treated as people, not numbers, thus the use of big data and all the information that is out there should be aligned with the sustainable mindset, in which companies meet their own goals without compromising someone else’s wellbeing. Thus, the major question of our research is: Can companies make a correlation between their business purposes when using neuromarketing and the benefits that each customer seeks in social media? This question led us to the idea of double research that evaluated the same thing—neuromarketing usage in social media—from both perspectives (organizations and customers) in order to identify connection points and see how they can be implemented.
Before designing the quantitative researches, we conducted two qualitative researches—an in-depth interview with organizations and a focus group with social network users in order to have a better understanding of the specialized language that can be used when discussing neuromarketing and its use in social media networks. As a result, in the surveys, we have allocated a special section for each of the four most used neuromarketing techniques—eye tracking, face coding, voice recognition, and EEG.
The response to neuromarketing use in online social networks depends on the market’s familiarity with both concepts. Considering that the study was conducted on the Romanian market, an ex-communist country, with a relatively new approach to business when compared to the US or Western Europe, it was important to take into consideration this gap when analyzing organizations’ and individuals’ response to emerging trends such as neuromarketing. At this moment in time, there is not any work dedicated to this precise analysis, only isolated studies on different areas of expertise or consumer segments, such as smartphone adoption process among teenagers [
57], technology acceptance (more precisely adoption of Facebook) by Romanian university students [
58], UN study on adoption and use of e-Government services: The case of Romania [
59], or technology acceptance for marketing strategies [
60].
Having this gap of information, we decided that, before discussing the use of neuromarketing in social media, we would take these two concepts and analyze them separately, aiming at first to understand the place of social media in the life of organizations and individuals, and then the perception on neuromarketing as a general concept.
This research designing process led to the following four objectives for each study, as can be seen in
Table 1.
Considering that this type of approach was not found in other papers (putting in the same model the results of two separate studies on neuromarketing use in social media), we started our research design from one of our 2019 working papers [
61], in which the authors were testing a model for social media use and education, based on the Technology Acceptance Model (TAM) developed by Davis [
62]. TAM was one of the most popular prediction-oriented research models dedicated to predicting the primary motivational factors for the use and acceptance of new technologies and systems [
58], thus we were able to adapt it to our research envision and build on the purpose/benefit parallel analysis.
The hypotheses for our study were that, for companies, social media was used as a more personalized way of communication about their products and services, and, for individuals, social media represented both a source of information and a tool of entertainment. Regarding the use of neuromarketing in social media, the hypotheses were that companies were embracing these opportunities, while consumers were more reserved, due to privacy issues.
As a research method, we have chosen the survey, conducting online interviews both with organizations’ representatives and social media users. Being exploratory research, we did not focus on representativeness but still tried to keep the sample size and structure as close as possible to a statistically representative study for this specific market. Thus, we interviewed 150 organizations and 385 individual users, and the first selection condition for both categories was to be a social media user.
The sampling structure for the survey with organizations was done according to a set of criteria that influenced both the use of technology and the investments in such activities—capital form (Romanian, foreign, and mixt), area of activity (using the classification of Individual Consumption According to Purpose - COICOP), number of employees (under 9, 10–49, 50–249, 250 and more) and turnover (less or equal to 2 mil. EUR, 2–10 mil. EUR, 10–50 mil. EUR, more than 50 mil. EUR). For the survey with individual users we structured the sample according to age (18–30, 31–40, 41–50, 51–60, more than 60), gender (male, female), and education level (primary school, high school, university).
The questionnaire was built on a Lime Survey platform, and respondents received a link, and responses were automatically sent to the database. Data were collected in the Fall of 2018. For information analysis we used IBM SPSS Statistics 25.
5.2. Research Results
In this section, we will present the research results in parallel (organizations and individual users) for each objective, as they are especially designed to be compared, thus showing which of the company’s efforts really connected with the market’s needs.
5.2.1. The Use of Social Media
This objective must be seen from a business perspective for organizations and from a personal one for social media users. Moreover, these two perspectives must align when putting into practice, thus that the organization has a sustainable strategy when it comes to its business models and online campaigns.
The use of social media can have different underlying motivators, depending on the platform (Facebook, LinkedIn, Instagram, etc.). Thus, it is important to identify which are the platforms that organizations and individuals use and what activities they associate with each of them. As can be seen in
Table 2, both organizations and individuals are most often found on Facebook, be it for business or personal reasons. The second platform, however, differs, with more companies using LinkedIn compared to individuals (58.6% versus 38.1%), whereas Instagram is more popular with individual users (85.1% versus 53.4%).
The foundation of a sustainable communication model is represented by the alignment of organizational purposes to the consumer needs. This also means being where your consumer is and saying/doing what is right for your consumer. Knowing the reasons for which consumers are using social media platforms gives companies the opportunity to adapt and meet their clients halfway. As we can see from
Table 3 and
Table 4, companies do not take into consideration the trends for each platform all the time, and many times fall into the trap of convenience and designing a general communication strategy for several social media networks. For example, Facebook is used by individuals as a tool of communication with other people or for entertainment, whereas companies push products and services promotions on it. For Instagram, a match can be observed, as companies use it for promotions and information, and the individual user is also there for the same reason—following organizations of interest. The most aligned platforms in terms of organizational versus individuals’ purposes are Twitter (used for general public information) and LinkedIn (used for recruitment and jobs).
5.2.2. The Degree of Familiarity with the Concept of Neuromarketing
The analysis of neuromarketing utility must be understood in the light of organizations’ and individuals’ familiarity with the concept. Evidence indicates that people fear change and the unknown [
63]. Thus, asking companies to invest in, and people to participate in neuromarketing studies without having, first of all, a real image about the level of their knowledge on the subject is too hypothetical in order to have any meaning.
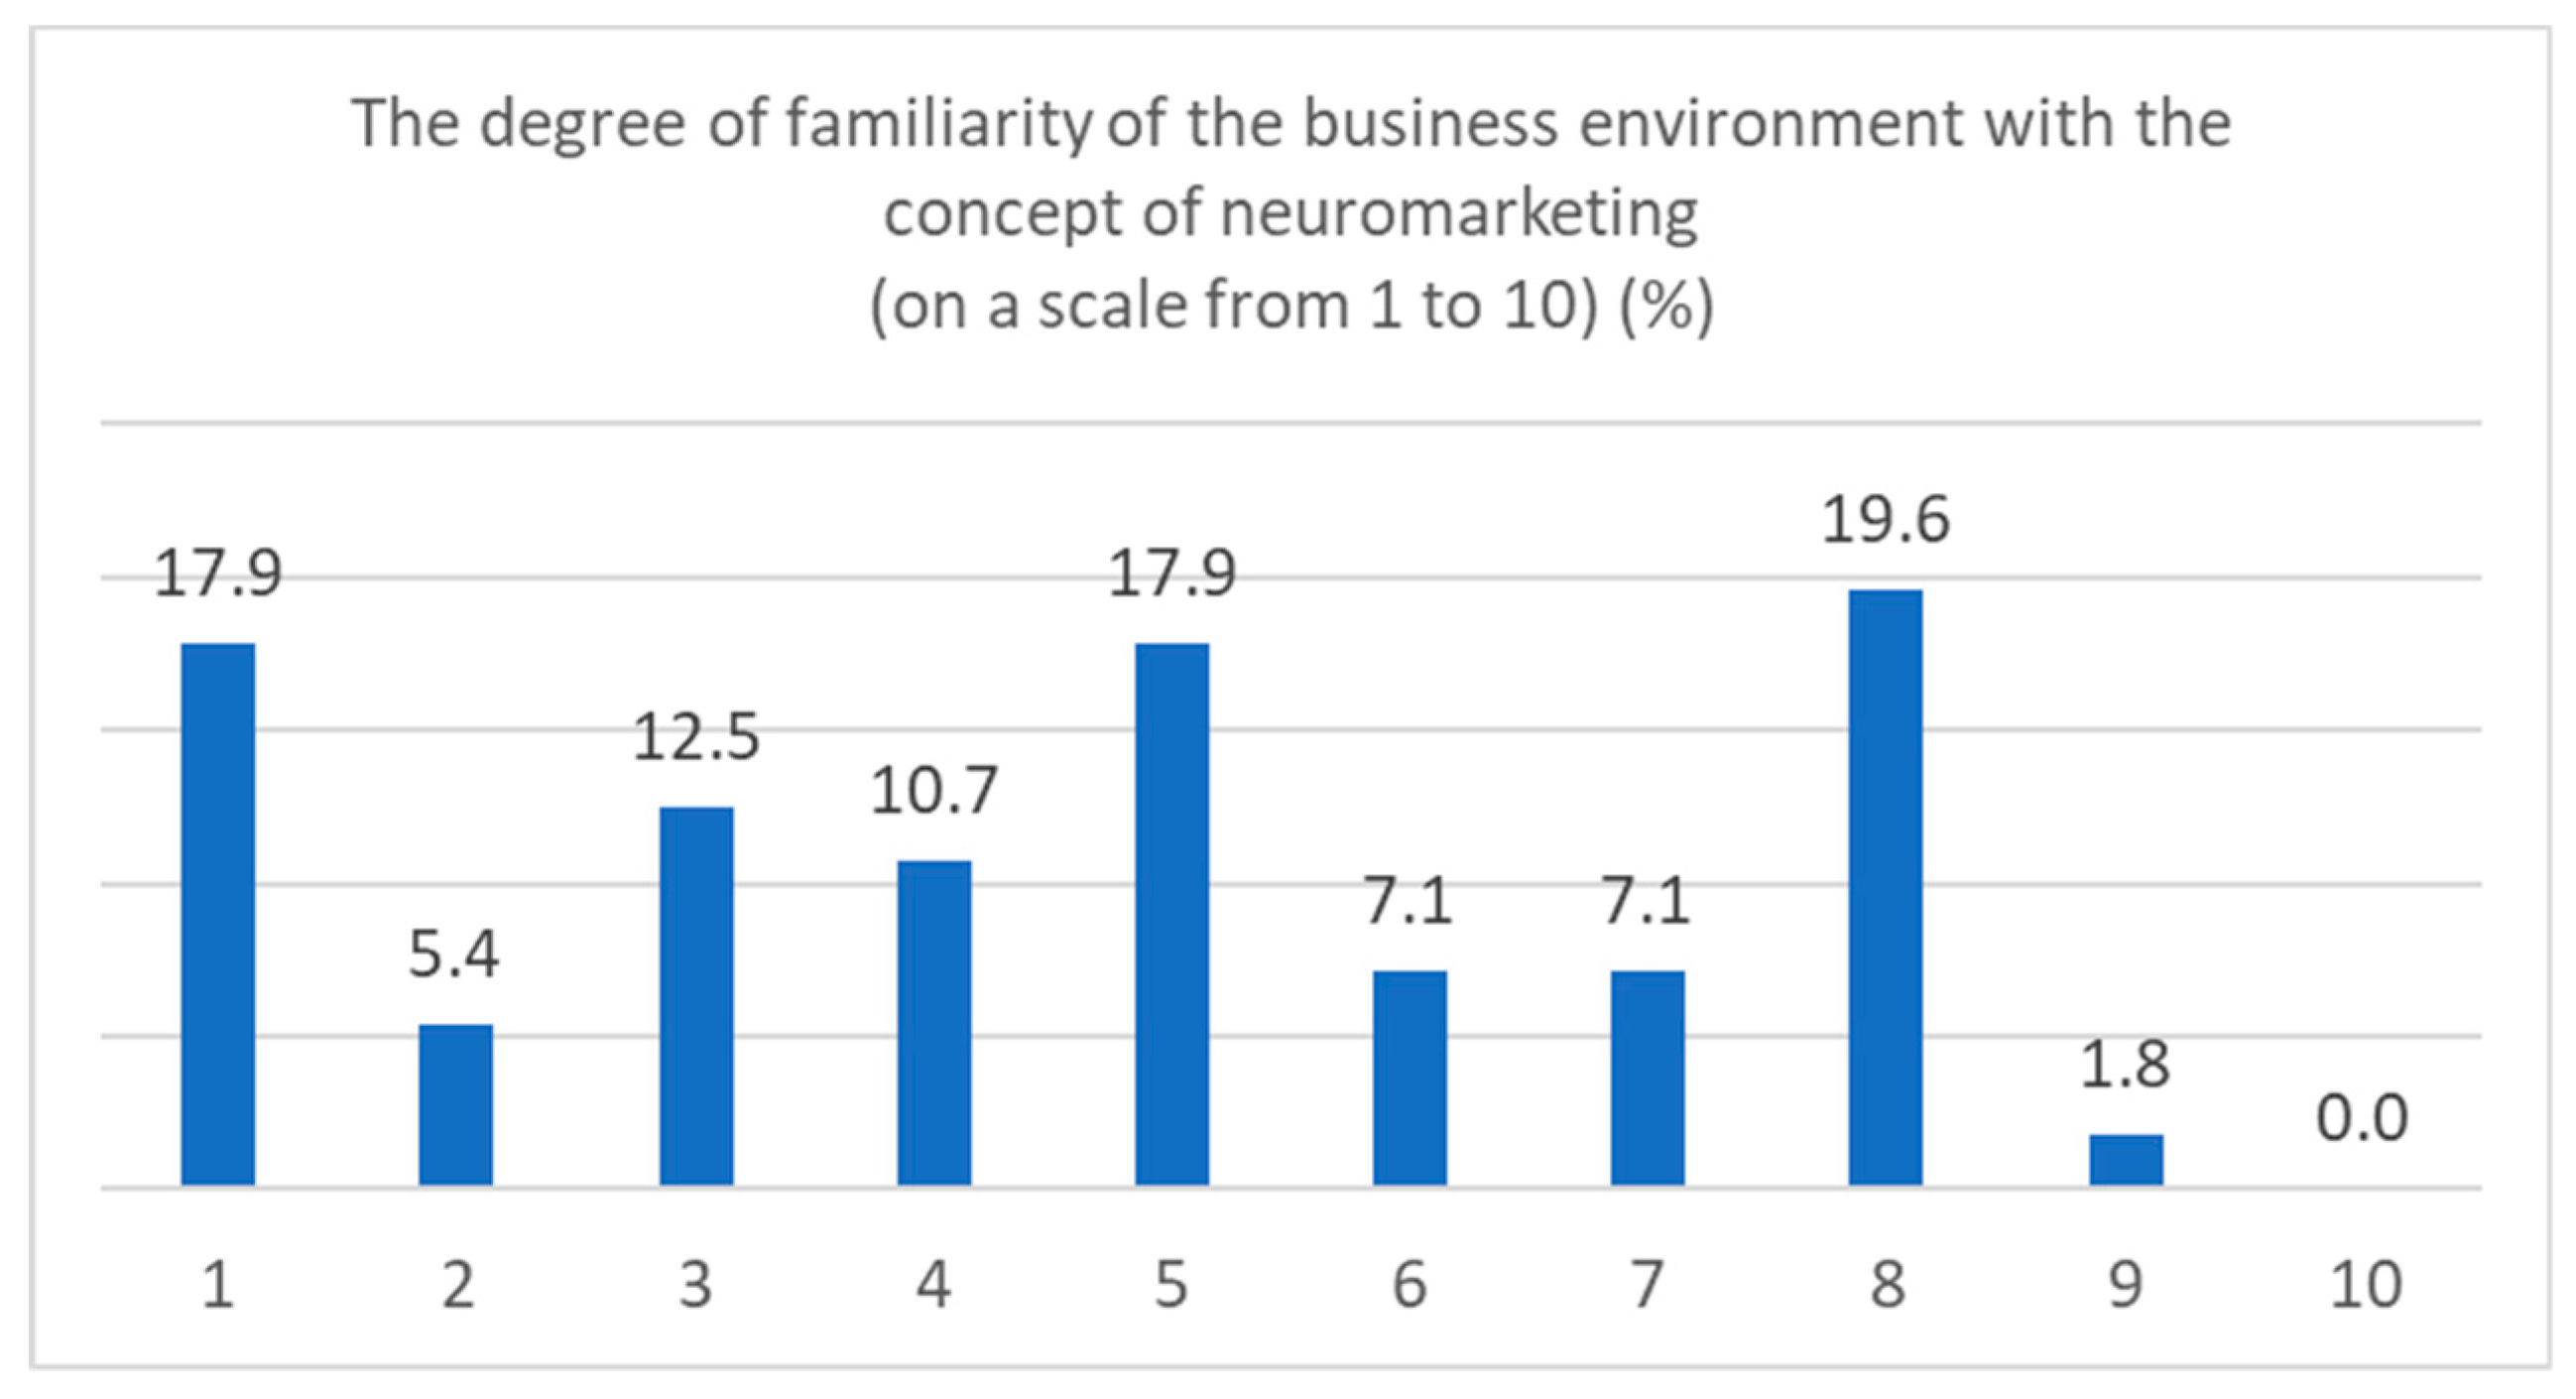
As can be seen in
Figure 1, there is a concentration in three areas when it comes to organizations’ familiarity with neuromarketing: Those who know nothing about it, those who declare an average level of knowledge, and a category of respondents who consider themselves familiar with this concept, but do not have the confidence to say that they know too much, hence the high percentage of those who chose a score of 8 out of 10.
The average score of 4.6, on a scale from 1 to 10, showed a relatively low degree of familiarity, which led to the need for more detailed communication on the subject of neuromarketing with the business environment, thus that they can understand both the process of information analyzing, as well as its usefulness. This need was also supported by the mental associations that research participants made with neuromarketing, where we had a category that thinks of this concept as a technique of influencing/manipulating the consumer. Naturally, there was also a category of organizations that have some correct ideas about neuromarketing (finding the reactions to stimuli, objective research of consumer behavior, analyzing consumer brain waves, etc.), and we can build on this when trying to raise awareness in the market.
The research on individual users showed a concentration of most answers near the minimum limit of the scale (as shown in
Figure 2), which denoted a very low level of familiarization of the market with the concept of neuromarketing. This conclusion was also supported by the mental associations that consumers made with this concept, as it should be noted that the highest percentage was for those who did not know what the concept of neuromarketing referred to (16.2%), to which we can add the other 9.2% who have made wrong associations. Besides this quarter of the market that was not at all familiar with the concept, we also have 15.1% that explained neuromarketing as being “something related to marketing”. There were, however, also a few correctly made associations with the term neuromarketing—analysis of clients’ response to stimuli (9.2%), identifying influence factors (8.1%), analysis of brain activity (7.4%), and analysis of consumer behavior (3.2%). One last thing to mention is the fact that there are also negative associations, in the direction of manipulating the human brain (4.3%).
These conclusions show us that the market is not homogeneous in terms of familiarity with the concept, rather seeing only certain dimensions of it. Having this in mind, we also asked our respondents about the actual participation in neuromarketing studies. When it comes to organizations, only 4% of them have conducted/ordered up until now such studies, and 14.3% of them have used the results of neuromarketing studies done by others. It is encouraging to see that 73.2% of companies from the Romanian market intend to use such research in the future, proving a high level of acceptance on the market.
The research on individuals showed us a percentage of 60.2% of users who would participate in future neuromarketing studies, which again confirms the level of acceptance mentioned above. It is important, however, to know the barriers such as people motivating their refusal by lack of knowledge about the procedure or lack of trust in the data collection process, or how their data will be used after.
5.2.3. The Degree of Utility for Each Neuromarketing Application in Social Media. Purposes and Benefits
This section contains both the results of the third and fourth research objectives, as they are linked—would they use neuromarketing in social networks and why. However, we have to see the answer to the “why” question from two different angles—the business purposes for organizations and the benefits that users feel they can get. At the end of this part, we will use the results to build a model, which correlates purposes with benefits in order to give organizations the opportunity of a sustainable communication process, showing:
- -
What are the reasons which have a correspondent in each party;
- -
What are the business purposes that do not correspond to any benefits in the consumer’s view;
- -
And what are the benefits expected by consumers that do not reflect at all in the present business approach.
Before asking any questions about the four neuromarketing applications evaluated within our research, we have inserted a short description for each of them, thus to make sure that all respondents have a proper understanding of the concept they are evaluating.
In order to find out respondents’ take on neuromarketing use in social media (third objective of the research), we used a 5-point scale (Osgood scale), from very useful to very unuseful. The answers to the “why” question (fourth objective of the research) were spontaneous ones, thus we can see how companies and individuals are expressing themselves when it comes to reasoning why neuromarketing in social networks can be a good thing. We have avoided the less insightful option of closed questions, where respondents just agree with the options, which are in front of them, even if those are not the most important ones.
For
eye-tracking, most companies checked the “very useful” button (as seen in
Figure 3A), leading to an average score of 4.02, on a scale from 1 to 5. Consumers, however, tended to be more mellow in their opinion, most of them choosing “useful” (as seen in
Figure 3B), which led to a lower average—3.93, but still a good one in terms of meaning for the neuromarketing acceptance level.
The most important purpose for which companies would use eye tracking in social networks is to find out what the elements are that draw people’s attention, a fact which also corresponds to the main benefit consumers see in allowing the use of this neuromarketing application for their social media accounts—finding out their areas of interest (
Table 5).
Face coding also brings a majority of positive answers from the business perspective, more than ¾ found this neuromarketing application useful or very useful, leading to an average score of 4.02 (as seen in
Figure 4A). In the consumer survey, face coding gathered most answers in the “useful” option (as seen in
Figure 4B), with an average score of 3.76. This score was still a positive one, considering that if people tended to see the usefulness of this application, they would also tend to approve its implementation within social platforms.
More than half of respondents from the business survey declared that they would use face coding in social networks in order to test campaign components or determine the reactions to posted content (as seen in
Table 6). The subsequent purpose was corresponding to the most mentioned benefit by individual users—to determine the impact of social media content on users. What is more important is the second benefit—understanding consumer desires and preferences, as they show us individual’s need to be understood by companies, thus they can better adapt their social media communication to this.
Voice recognition seems to be less useful both in the opinion of companies and individuals (as seen in
Figure 5a,b). The average score from business perspective is 3.42 and from individual’s perspective is 3.39, which demonstrates a relative indifference to this neuromarketing application.
When asked about the reasons they would use it, companies thought of determining the reactions to posted content as the main purpose (
Table 7). The reason which found a correspondent in the most mentioned benefit by individual users was determining the impact of social media elements on users.
EEG (Electroencephalography) was the hardest to sell, as most people saw it as being the most intrusive one. From the individual user’s perspective, it was the less useful one out of all the neuromarketing applications evaluated in this study, with an average score of 3.21. The business perspective scored a little bit higher (average score of 3.46), however, both companies and individuals tended to be neutral in respect to the use of EEG in social networks (as seen in
Figure 6a,b).
In the case of EEG, we have good correspondence when it comes to the company’s purpose for using it in social networks and individual user’s benefit from allowing it to be used—determining the reaction to different stimuli (
Table 8).
Last, but not least, even if some of the neuromarketing applications now have a lower score in usefulness, their level of acceptance can grow if organizations convert to a sustainable communication model, in which their marketing purposes are aligned with consumer’s expected benefit. Thus, the model that we will present below is not just for maintaining what is already working, but also to make social media connections more immersive.

 ,
, 


