Next Article in Journal
Smart Water Quality Monitoring System Design and KPIs Analysis: Case Sites of Fiji Surface Water
Previous Article in Journal
Museum Tourism 2.0: Experiences and Satisfaction with Shopping at the National Gallery in London
 
 
Correction published on 14 May 2020, see Sustainability 2020, 12(10), 4017.
Article

Influence of Parapets on Wave Overtopping on Mound Breakwaters with Crown Walls

1
Department of Transportation, Universitat Politècnica de València, Camino de Vera s/n, 46022 Valencia, Spain
2
Department of Hydraulic Engineering and Environment, Universitat Politècnica de València, Camino de Vera s/n, 46022 Valencia, Spain
*
Author to whom correspondence should be addressed.
Sustainability 2019, 11(24), 7109; https://doi.org/10.3390/su11247109
Submission received: 24 October 2019 / Revised: 27 November 2019 / Accepted: 2 December 2019 / Published: 11 December 2019

Abstract

:
Background literature on the influence of parapets on the overtopping of mound breakwaters is limited. In this study, numerical tests were conducted using computational fluid dynamics (CFD) to analyze the influence of nine crown wall geometries (seven with parapets). The CFD model was implemented in OpenFOAM® and successfully validated with laboratory tests. A new estimator of the dimensionless mean wave-overtopping discharges (logQ) on structures with parapets is proposed. The new estimator depends on the estimation of logQ of the same structure without a parapet. The effects on wave overtopping of the parapet angle (εp), parapet width (wp), and parapet height (hp) were analyzed. Low values of εp and wp/hp ≈ 1 produced the highest parapet effectiveness to reduce the mean wave-overtopping discharges.

1. Introduction

The crest elevation of conventional mound breakwaters must ensure the mean wave-overtopping discharge is below acceptable limits. Wave overtopping on mound breakwaters with crown walls can be decreased by (1) increasing the size of the breakwater (e.g., higher crest elevation or wider crest berm), or (2) using a parapet (recurved wall or bullnose) on the crown wall. There is extensive literature focused on mean wave-overtopping discharges on mound breakwaters, q(m3/s/m), with several prediction tools, such as those given by EurOtop [1,2], Van Gent et al. [3], and Molines and Medina [4,5]. However, the literature background on the influence of parapets on the overtopping of mound breakwaters is limited. Studies on vertical breakwaters and dikes (see EurOtop [2]) indicate that wave-overtopping discharges decrease when a parapet is implemented, but the performance of parapets on mound breakwaters may be different from dikes and vertical breakwaters. Figure 1 illustrates the cross-section of a mound breakwater with a crown wall and parapet, along with the most relevant geometric parameters.
In Figure 1, Rc is the crown wall crest freeboard, Ac is the armor crest freeboard, Gc is the armor crest berm width, cotα is the armor slope, h is the water depth at the toe, ht is the water depth on the toe berm, Bt is the toe berm width, Ch is the crown wall height, Cb is the crown wall width, hp is the parapet height, hn is the parapet height including the parapet slope, wp is the parapet width, and εp is the parapet angle.
The parapet is usually parametrized in literature according to two parameters: hn and εp (see van Doorslaer et al. [6]), hn and wp (see Kortenhaus et al. [7]), or wp and Rc-Ac (see Coeveld et al. [8]). However, there are three parameters which completely define the geometry of the parapet—hp, wp, and εp—because tanεp = (hn − hp)/ wp in Figure 1b.
In this study, a parametric analysis is conducted to characterize the influence of hp, wp, and εp on wave overtopping. As a novelty, the dimensionless variables wp/hp and εp are used to characterize the geometry of the parapet. The systematic analysis of different parapet geometries is a costly task in laboratory tests due to the complexity, construction restrictions, and facility instrumentation. These limitations can be overcome, to a certain extent, using numerical simulations based on computational fluid dynamics (CFD) techniques. Thus, the study presented herein reports a series of CFD simulations that analyze the influence of nine crown wall geometries on wave-overtopping discharges.
This paper is structured as follows. Firstly, the literature on wave-overtopping discharges on coastal structures with parapets is reviewed. Secondly, 2D physical and numerical model tests are described. Thirdly, the numerical tests are validated. Fourthly, a new wave-overtopping estimator is proposed to consider the influence of a parapet. Finally, general conclusions are drawn.

2. Literature Review

Bradbury et al. [9] conducted irregular wave tests to investigate the hydraulic effects of crown walls on mound breakwaters. Several cross-sections were tested, some of them including parapets, which showed a reduction in wave overtopping. The authors proposed a set of exponential formulas with coefficients calibrated to estimate the mean wave overtopping of each geometry, but they did not explicitly consider the geometry of the parapet. Cornett et al. [10] analyzed different overhanging and chamfered parapets on vertical structures and reported a reduction in wave overtopping, due to the parapet, in the range 0.67 ≤ Rc/Hm0 ≤ 3.33, where Hm0 is the significant wave height at the toe.
Kortenhaus et al. [7,11] analyzed the influence of parapets on wave overtopping and wave loading of complex vertical walls. The authors proposed a reduction factor defined as k = qwith parapet/qwithout parapet, which was lower for a higher dimensionless relative crest freeboard (Rc/Hm0). These authors also concluded that the parapet provided considerable reductions in wave overtopping for Rc/Hm0 > 1.5, but its effect was almost negligible for Rc/Hm0 < 1.2. These authors considered the influence of the parapet height (hn) and width (wp) in the reduction factor. Pearson et al. [12] reformulated the reduction factor given by Kortenhaus et al. [7] in the case of high crest freeboards, including the influence of the water depth at the toe (h).
Coeveld et al. [8] conducted 2D physical tests on mound breakwaters with crown walls. These authors analyzed the influence of a crown wall (with and without parapet) on wave overtopping and proposed three formulae to estimate the mean wave-overtopping discharge, the number of overtopping events, and the maximum individual wave overtopping volume. These authors concluded that mound breakwaters without crown walls had similar or larger mean overtopping discharges than those with crown walls under the same wave conditions. Equation (1) provides an estimation of the mean wave-overtopping discharges, given by Coeveld et al. [8]:
q with   crown   wall q without   crown   wall = 1.55 exp ( 4 R c A c H m 0 0.4 G c H m 0 2 w p H m 0 ) .
Van Doorslaer et al. [6] analyzed the influence of crown walls on reducing the wave overtopping of non-breaking waves over a smooth dike slope. The authors proposed a reduction factor of the wave height, considering the influence of the parapet angle (εp) and height (hn). Van Doorslaer et al. [13] extended the method of Van Doorslaer et al. [6] to cover both breaking and non-breaking waves.
Castellino et al. [14] and Martinelli et al. [15] conducted numerical and experimental investigations, respectively, of non-breaking wave forces and overtopping discharges on vertical breakwaters with parapets. Their data showed good agreement with the reduction factor proposed by Pearson et al. [12].
Formentín and Zanuttigh [16] proposed a method for the parametrization of the reductive effects of bullnoses of crown walls on the average wave overtopping discharge. The authors proposed a reduction factor using genetic programming to be applied on the mean wave overtopping estimator proposed by EurOtop [2] for dikes, dependent on the Iribarren number, intermediate berm, wave length, Ch/Rc, and εp.
EurOtop [2] proposed the method from van Doorslaer et al. [6] to account for the effect caused by a parapet on wave overtopping on dikes, as well as the methods of Kortenhaus et al. [7] and Pearson et al. [12], on vertical structures; however, no method has been proposed for mound breakwaters.

3. Model Tests

3.1. Physical Model

The cases analyzed in this study were based on the physical tests of the CUBIPOD Project described by Smolka et al. [17], who conducted 164 small-scale physical tests in the wave flume of the Laboratory of Ports and Coasts at the Universitat Politècnica de València (LPC-UPV). The LPC-UPV wave flume (1.2 m × 1.2 m × 30 m) had a piston wave-maker with an Active Wave Absorption Control System (AWACS).
The two-layer Cubipod armored mound breakwater test results were used in this study. Tests were conducted in non-breaking wave conditions with a crown wall and no toe berm. The characteristics of the physical model were: Rc(m) = 0.203 and 0.263, Ac(m) = 0.15, Gc = 3D50, and the armor slope was cotα = 1.5. The characteristics of the armor layer were: D50(m) = 0.0382, ρr(kg/m3) = 2290, and ф = 1.18 (n = 0.41), where D50 is the nominal diameter of the units, ρr is the mass density of the units, ф is the packing density of the armor, and n is the armor porosity (see Figure 2). Armor units were placed on a filter layer (D50 = 0.017 m) protecting the core (D50 = 0.007 m). Figure 2 illustrates the cross-section of the physical tests conducted in this study with water level h(m) = 0.55. The physical model was designed to avoid significant damage to the armor layer. The physical model approximately represented a Spanish Mediterranean breakwater at a scale 1:50. The physical model was scaled using the Froude similarity law with Reynolds number higher than 30,000 in the armor layer. The tests adequately represented significant prototype overtopping discharges, according to Lykke-Andersen et al. [18]. Under these conditions, the flow conditions in the outer zone of the breakwater were also turbulent. The flow characteristics on the core of the breakwater were affected by the scale effects: the scale method of Burcharth et al. [19] was used to define the size of the core rocks in the physical tests.
During the tests, wave characteristics, wave overtopping, crown wall stability, and armor layer damage were analyzed (see Molines et al. [20]). Wave overtopping was recorded with a chute connected to a collection tank weighted by a load cell. Capacitive wave gauges were used to measure the surface elevation and incident wave conditions. Figure 3 illustrates the longitudinal cross-section of the wave flume, along with the wave gauge positions used to separate incident and reflected waves using the method of Mansard and Funke [21]. To this end, wave gauges were separated in the range Lm/4 to Lm/8 in the generation and model areas, respectively.
The physical model was tested with regular and irregular waves, increasing the incident wave height while maintaining the Iribarren number to be approximately constant at Irm = tanα/(Hm0/Lm)0.5 ≈ 4.0 and 5.0, until armor damage was significant or massive overtopping occurred (Lm is the local mean wavelength at the toe). One thousand irregular waves were generated during each test, following the JONSWAP spectrum with γ = 3.3.
In this study, one regular test and seven irregular tests of two-layer Cubipod armors were used; the characteristics are summarized in Table 1.

3.2. Numerical Model

The physical tests analyzed by Smolka et al. [17] described above were simulated using the CFD code OpenFOAM®, an open source platform of C++ applications and libraries that employs the finite volume method (FVM) to discretize and approximate a solution to the Navier–Stokes Equations (2) and (3):
u ¯ = 0
t ρ u ¯ + · 1 n ρ u ¯ × u ¯ = n p + µ · u ¯ + n ρ f b ¯ I ,
where u ¯ is velocity, p is pressure, ρ is the fluid density, υ is kinematic viscosity, and f b ¯ is body forces, namely gravity and surface tension. I is the hydraulic gradient, represented by the Darcy–Forchheimer formulation with the modifications introduced by van Gent [22], given by Equation (4):
I = A u ¯ + B u ¯ u ¯ + c t ρ u ¯ ,
where:
A = α 1 n 3 n 2 μ D 50 2 ,
B = β ( 1 + 7.5 KC ) 1 n n 2 ρ D 50 2 ,
where n is porosity, D50 = (M50r)1/3 is the nominal diameter, M50 is the median mass of the armor unit, ρr is the mass density of the armor unit, and KC is the Keulegan–Carpenter number that accounts for the transient nature of flows. Note that α and β are parameters that need to be calibrated. According to Higuera et al. [23], parameter C has little influence and yields good results with a constant value C = 0.34.
Table 2 illustrates the material properties used to define the porous media in the numerical model, namely, α, β, C, n, and D50. n and β given in Table 2 are those proposed by Jacobsen et al. [24], and α is that proposed by Guanche et al. [25]. The parameters α, β, C are not easily estimated from physical tests and they are usually taken from the literature; D50 can be easily measured in the laboratory. Section 4.3 shows a sensitivity analysis of the influence of the porosity of the porous media (n) on the results of the numerical model.
The approximation of the flow model equations was achieved using the PIMPLE algorithm, a combination of the PISO (see Issa [26]) and SIMPLE (see Patankar and Spalding [27]) algorithms implemented in OpenFOAM® as interFoam.
The flow under study was clearly turbulent, and its characteristics prohibited a direct numerical simulation (DNS) approach, so a turbulence model should be implemented. However, Jacobsen et al. [24], among others, observed in the past that an accurate description of the bulk hydrodynamic variables, such as wave height or dissipation through porous materials, can be achieved without a turbulence model. The work presented herein adopted this approach, and, as discussed below, it confirmed this assumption. The flow turbulence inside the porous media was considered by the α and β parameters, as detailed in Jensen et al. [28].
The water free surface was tracked using the partial VOF (Volume of Fluid) method, a variation of the original VOF, proposed by Hirt and Nichols [29]. The approach represents both air and water by adding an extra variable to the numerical model: the fluid fraction (F). This variable takes values from 0 to 1, according to whether a mesh cell is occupied by air (0) or water (1). Its transport is reproduced thanks to an additional convective transport equation (see Equation (7)):
F t + · 1 n u ¯ F + · 1 n u ¯ c F 1 F = 0 ,
where u is velocity and t is time. It is worth remarking that, using this approach, both air and water are modeled as a single fluid where mechanical properties, denoted by ξ, are weighted in each mesh cell according to the air and water content:
ξ = ξ w a t e r F + ξ a i r ( 1 F ) .
As a consequence of Equation (7), certain regions will always show F values between 0 and 1, thus making the exact location of the air–water interface unclear. In the case presented herein, an approach based on an artificial compression velocity (uc) was implemented. This velocity contributed to compressing the fluid interface thanks to the third term of Equation (7) (see Berberovic et al. [30]).
The numerical model presented herein was 2D. Flow features in the third dimension do not seem to play a relevant role in porous regions. According to Jacobsen et al. [31], 3D numerical models could show minor improvements in the accuracy, with a much higher computational cost. However, a 2D numerical model aggravates a phenomenon described by Jacobsen et al. [24], where air pockets trapped between the water flow and solid contours may show unphysical behavior because of its incapability of mixing both fluid phases, which may lead to overestimation of pressures exerted by the air on solid structures. However, this study did not analyze wave forces on crown walls.
As regards the numerical model boundary conditions, the library IHFoam was used to provide the porous media of the mound breakwater (see Higuera et al. [23,32,33,34]). An impermeable, no-slip boundary condition was imposed on the solid contours, leaving the upper boundary condition of the numerical model open to the atmosphere, allowing both fluids to leave the domain and only air to enter the domain when the pressure dropped below zero.
In order to discretize the domain, a 2D mesh structure of rectangular elements was employed. Mesh refinement was applied to regions of interest or where larger gradients were expected, as shown in Figure 4, so that computational costs became affordable without losing significant accuracy in the model results. The regions of interest were those near the wave free surface, the breakwater crest, its upper cross-section (where overtopping occurs), and the parapet (when present), where the mesh element size was reduced down to 1/32 of the mesh element size in the freestream region (∆x). Additionally, a gradual refinement in the x-direction was imposed on the region upstream of the structure with a ratio of 4, similar to Higuera et al. [23]. As a result, the numerical model used in this study had between 90,000 and 100,000 cells, depending on the crown wall geometry.
Unstructured meshes show better results in complex geometries when a selective refinement is required, as they avoid the over-refinement of regions without large gradients (Kim and Boysan [35]). These meshes also adapt to complex geometries much better and their generation algorithms based on arbitrary topologies show fewer closure issues (Biswas and Strawn [36]). Additionally, mesh non-orthogonality should have a limited effect on results provided that the mesh skewness is kept low enough (Huang and Prosperetti [37]).
However, a structured rectangular hexahedral mesh was considered the best choice for the case presented herein for the following reasons. First, structured meshes are generally more accurate than unstructured meshes for similar numbers of elements (Biswas and Strawn [36]). Second, structured meshing is generated with simpler and faster algorithms, as its access to memory is more regular, thus reducing latency times significantly (Keyes et al. [38]). Finally, topologically orthogonal meshes avoid certain issues of numerical diffusion in fluid interfaces in multiphase flows like that analyzed herein (Bayon [39]).
Meshes are refined near certain solid boundaries to resolve boundary layers, thus leading to highly skewed elements, but this problem is overcome by ensuring the alignment of mesh axes with solid boundaries (Hirsch [40]).
Mesh convergence was assessed in order to determine the independence of the results. Five different mesh sizes were analyzed, corresponding to ∆x(cm) values of 1.00, 2.00, 2.96, 4.00, and 5.33. The Richardson extrapolation method was used as described by Celik et al. [41], and the mesh showed a mesh apparent order of MAO = 1.8 and a grid convergence index of GCI = 8.5%, which is often considered a good indicator of numerical uncertainty.
Despite the apparent severity of the numerical model simplifications, the suitability of this approach has been proven in the past by a number of authors who employed similar techniques to evaluate the performance of coastal structures under wave attacks (see Higuera et al. [23], Tsai et al. [42], and Castellino et al. [14]) and other hydraulic applications involving complex air–water interactions (see Bayon and Lopez-Jimenez [43], and Bayon et al. [44,45]).
Table 3 shows the characteristics of the crown wall and parapets referred to in the parameters depicted in Figure 1b. Seven structures had a parapet and two structures had no parapet (#A0 and #B0).
Irregular wave series with the JONSWAP spectrum and γ = 3.3, similar to the physical model tests, were generated in the numerical model with 500 waves instead of 1000 waves. For rubble mound breakwaters, Romano et al. [46] noted that mean wave overtopping discharges and probability of wave overtopping generally give stable predictions from tests of 500 waves. Each pair of Hm0 and Tp generated the same free surface time series because the same seed was used for all the simulations. The numerical models were tested exactly under the same wave attack. Hm0 and Tp given in Table 1 were the same as that of Smolka et al. [17], but the time series were different because different seeds were used in physical and numerical tests. In this study, 7 × 9 = 63 numerical tests with irregular waves and 1 test with regular waves were analyzed. Tests with and without parapets were run in a single processor with 2 Gb of RAM in the RIGEL Cluster of the Universitat Politècnica de València and used around 700 s of CPU and 200 s of CPU per simulated second, respectively.
Wave heights were measured in the numerical wave flume at the same distances as in the LPC-UPV wave flume, and wave overtopping was extracted by integrating the product of the cross-sectional area and water velocity passing above the crest at every timestep.

4. Validation of the Numerical Model

In this study, the relative mean-squared error given by Equation (9) was used to measure the goodness of fit:
rMSE = MSE Var = 1 N i = 1 N ( o i e i ) 2 Var ( o i ) ,
where MSE is the mean-squared error, Var is the variance of the measurements, N is the number of data, oi is the observed value, and ei is the estimated value. Herein, 0% ≤ rMSE ≤ 100% estimates the proportion of variance not explained by the model; the lower the rMSE, the better the estimation.
The CFD model implemented in OpenFOAM® was validated using physical tests without parapets (structure #A0). Section 4.1 and Section 4.2 describe the validation on regular and irregular waves, respectively. Section 4.3 shows a sensitivity analysis of the influence of the porosity of the porous media on the numerical results. The validated model was used in Section 5 to analyze the influence of the geometry of the parapet on wave overtopping.

4.1. Regular Test

A regular test of the CUBIPOD Project (structure #A0 without parapet) with H(m) = 0.203 and T(s) = 2.62 was used to validate the numerical model in the time domain. The test had an initial ramp time of 10 s and nine incident waves with the target H(m) = 0.203 and T(s) = 2.62. The crest of the first wave started at t(s) = 11.75 in G1 and the crest of the last wave started at t(s) = 32.55 in G1. Figure 5a–d illustrates the time series of the incident and reflected waves at wave gauge G1 and G6, respectively, (see Figure 3) and Figure 5e illustrates the cumulative wave-overtopping mass. Figure 5 shows good agreement between the waves and the overtopping mass given by the numerical model and measured in the physical tests. Differences were observed in the shape of the wave-overtopping curve, since a collection tank was used in the laboratory tests, while flow passing immediately over the crown wall was integrated in the CFD simulations. Hence, water flowed slower on the chute connected to the collecting tank than it did passing over the crown wall in the simulations. The individual wave-overtopping volumes were similar in the numerical and physical tests, but overtopping records in physical tests were delayed because of the position of the collection tank in the laboratory test. The Mansard and Funke [21] method was used to separate incident and reflected waves.

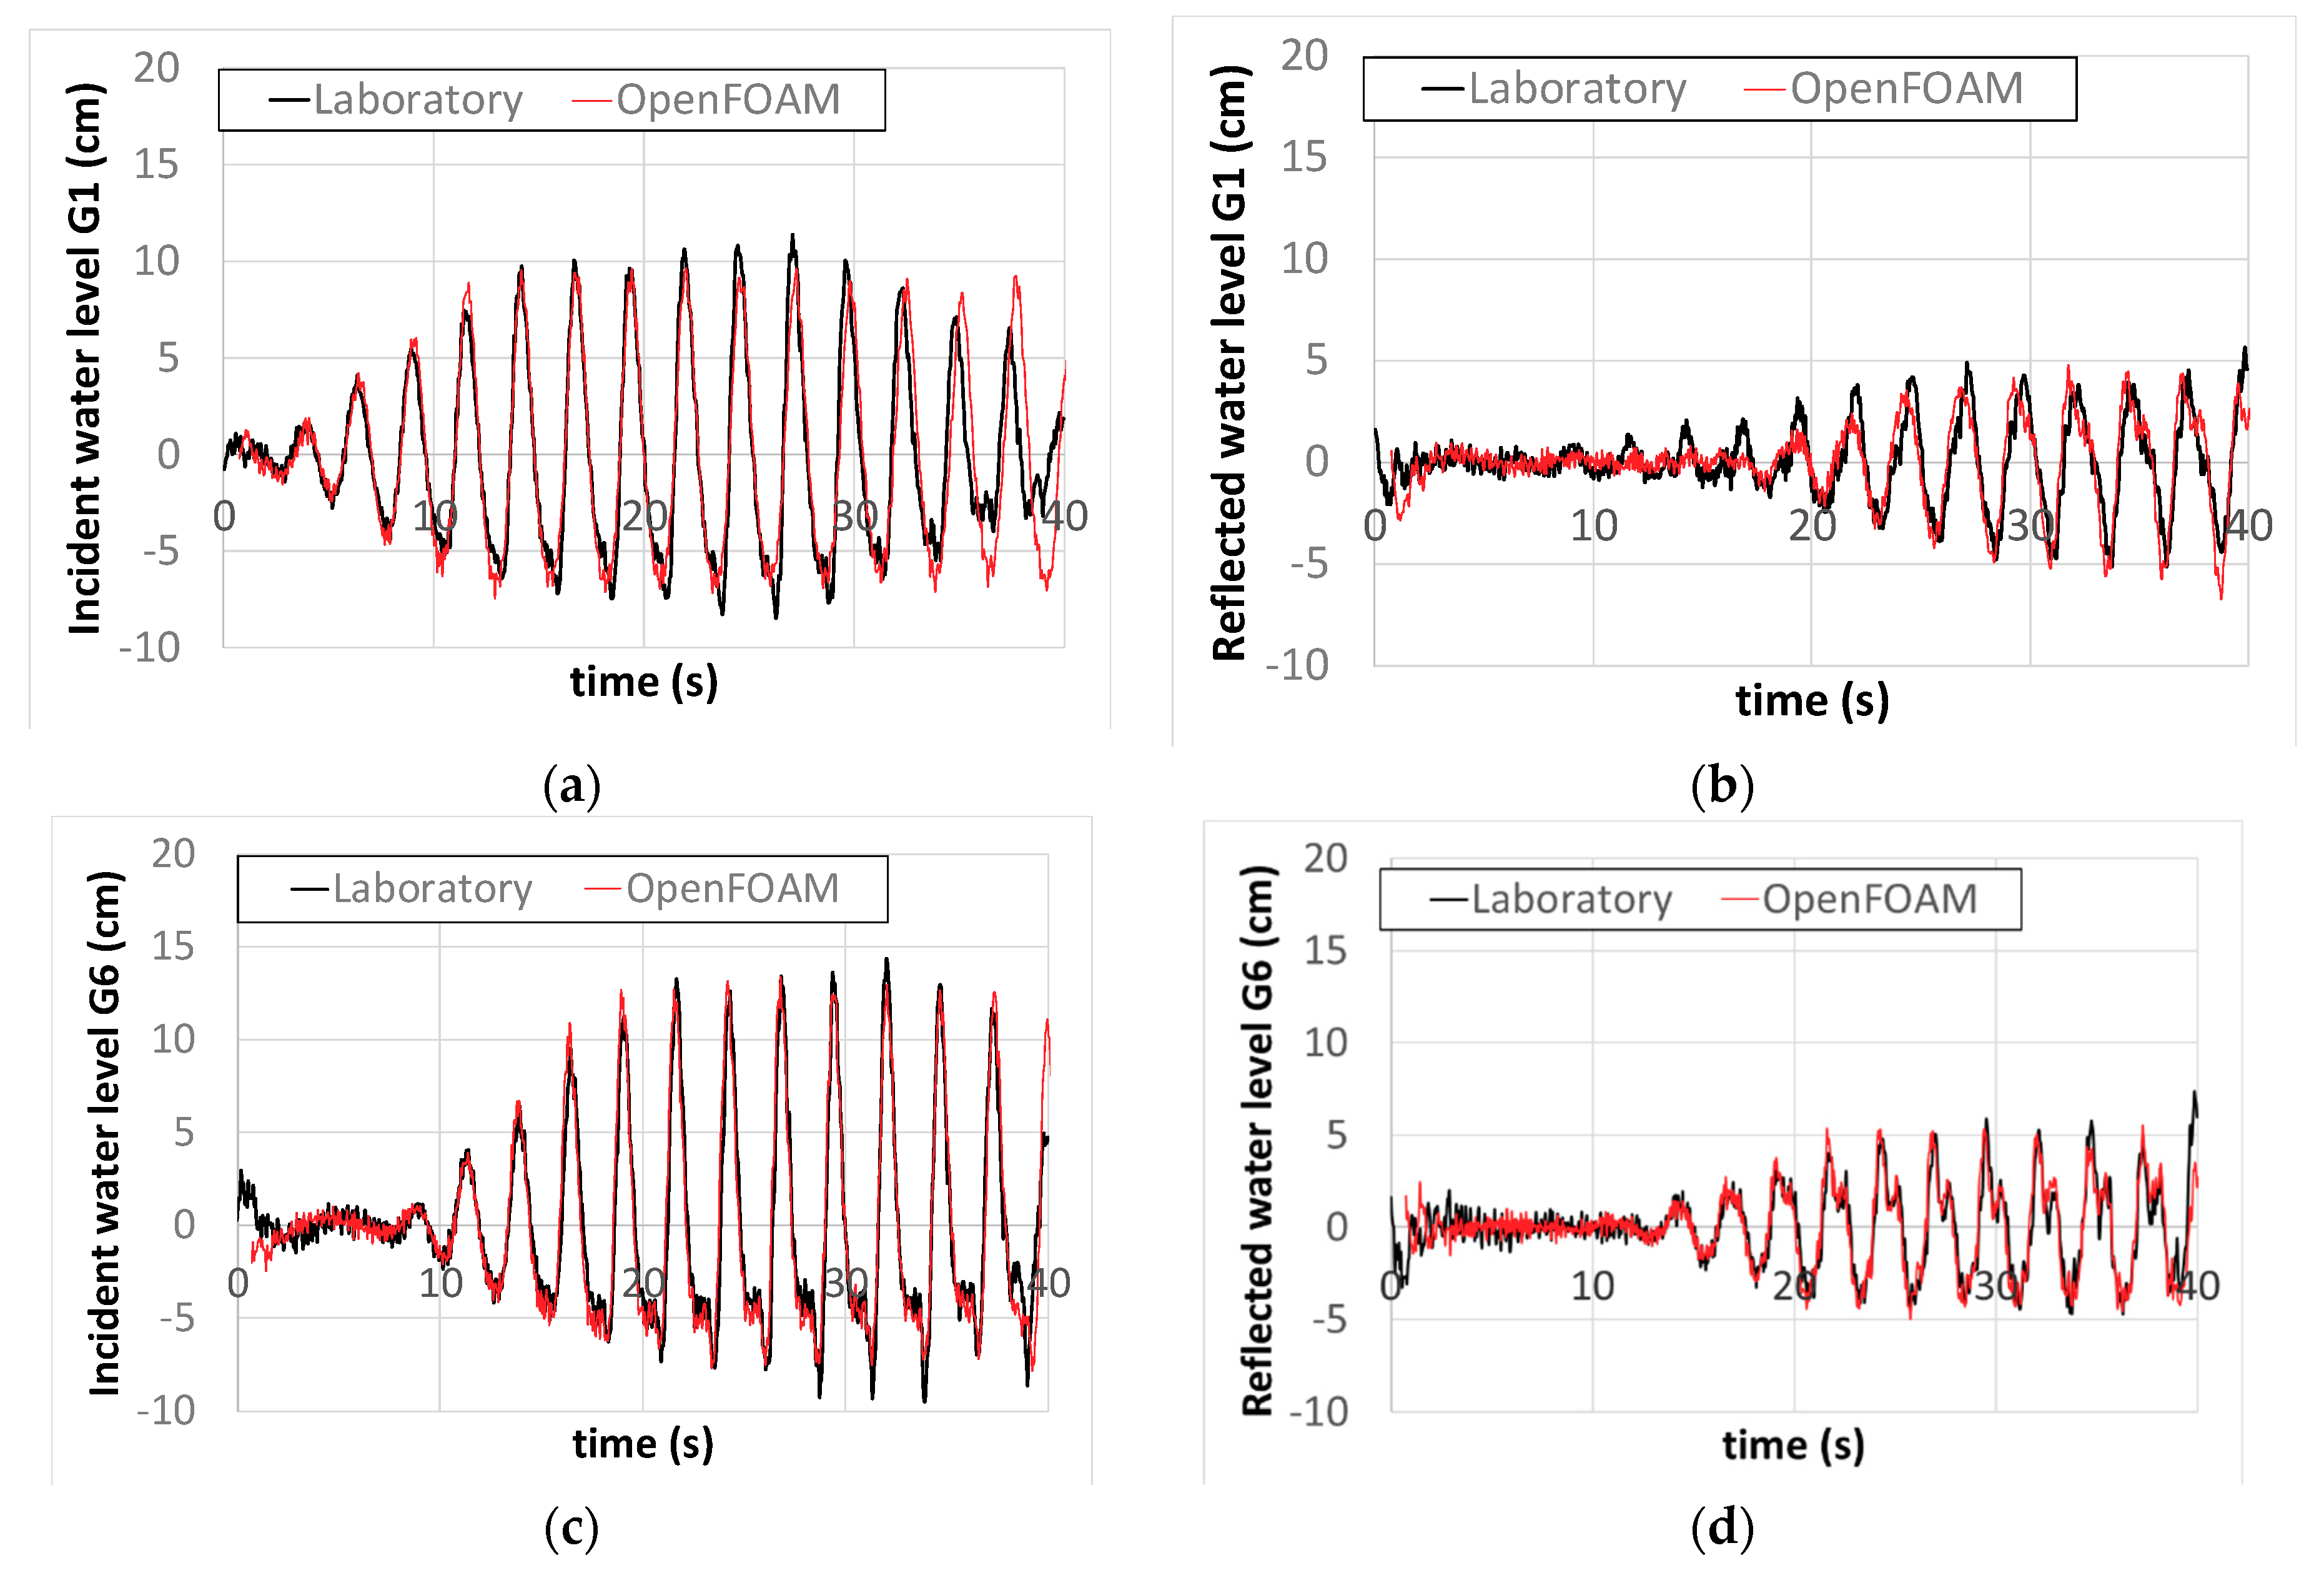
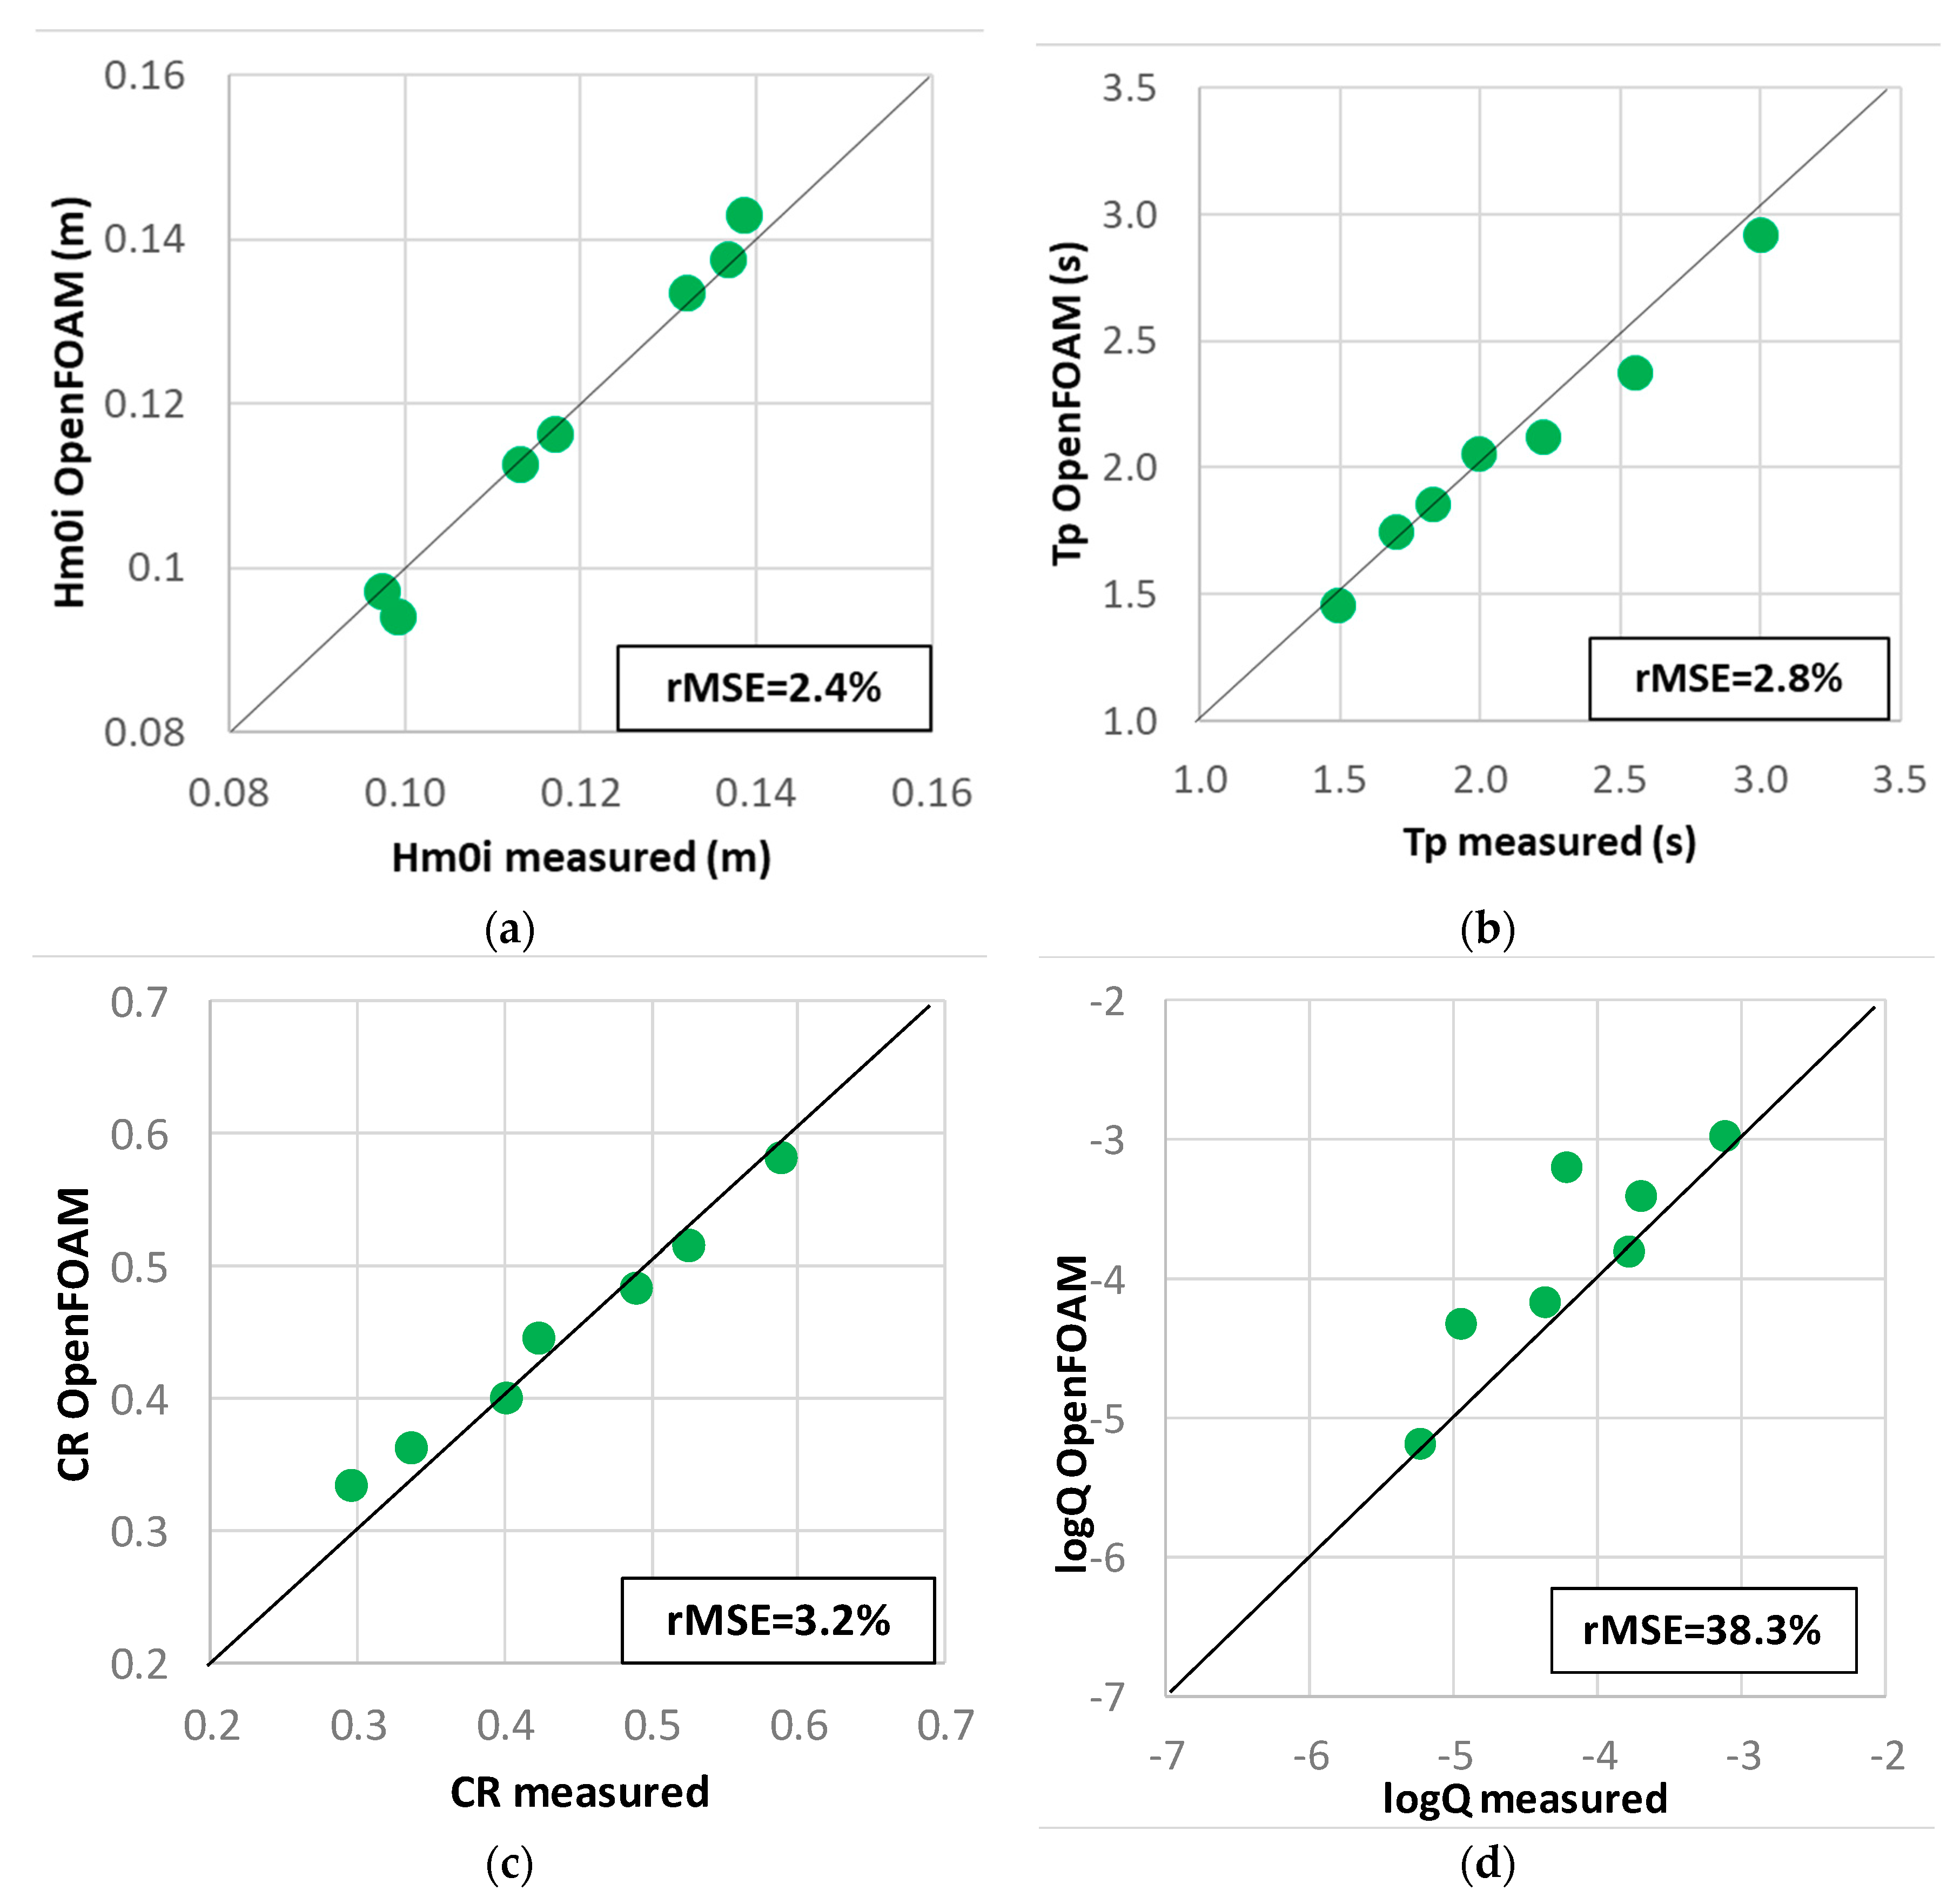
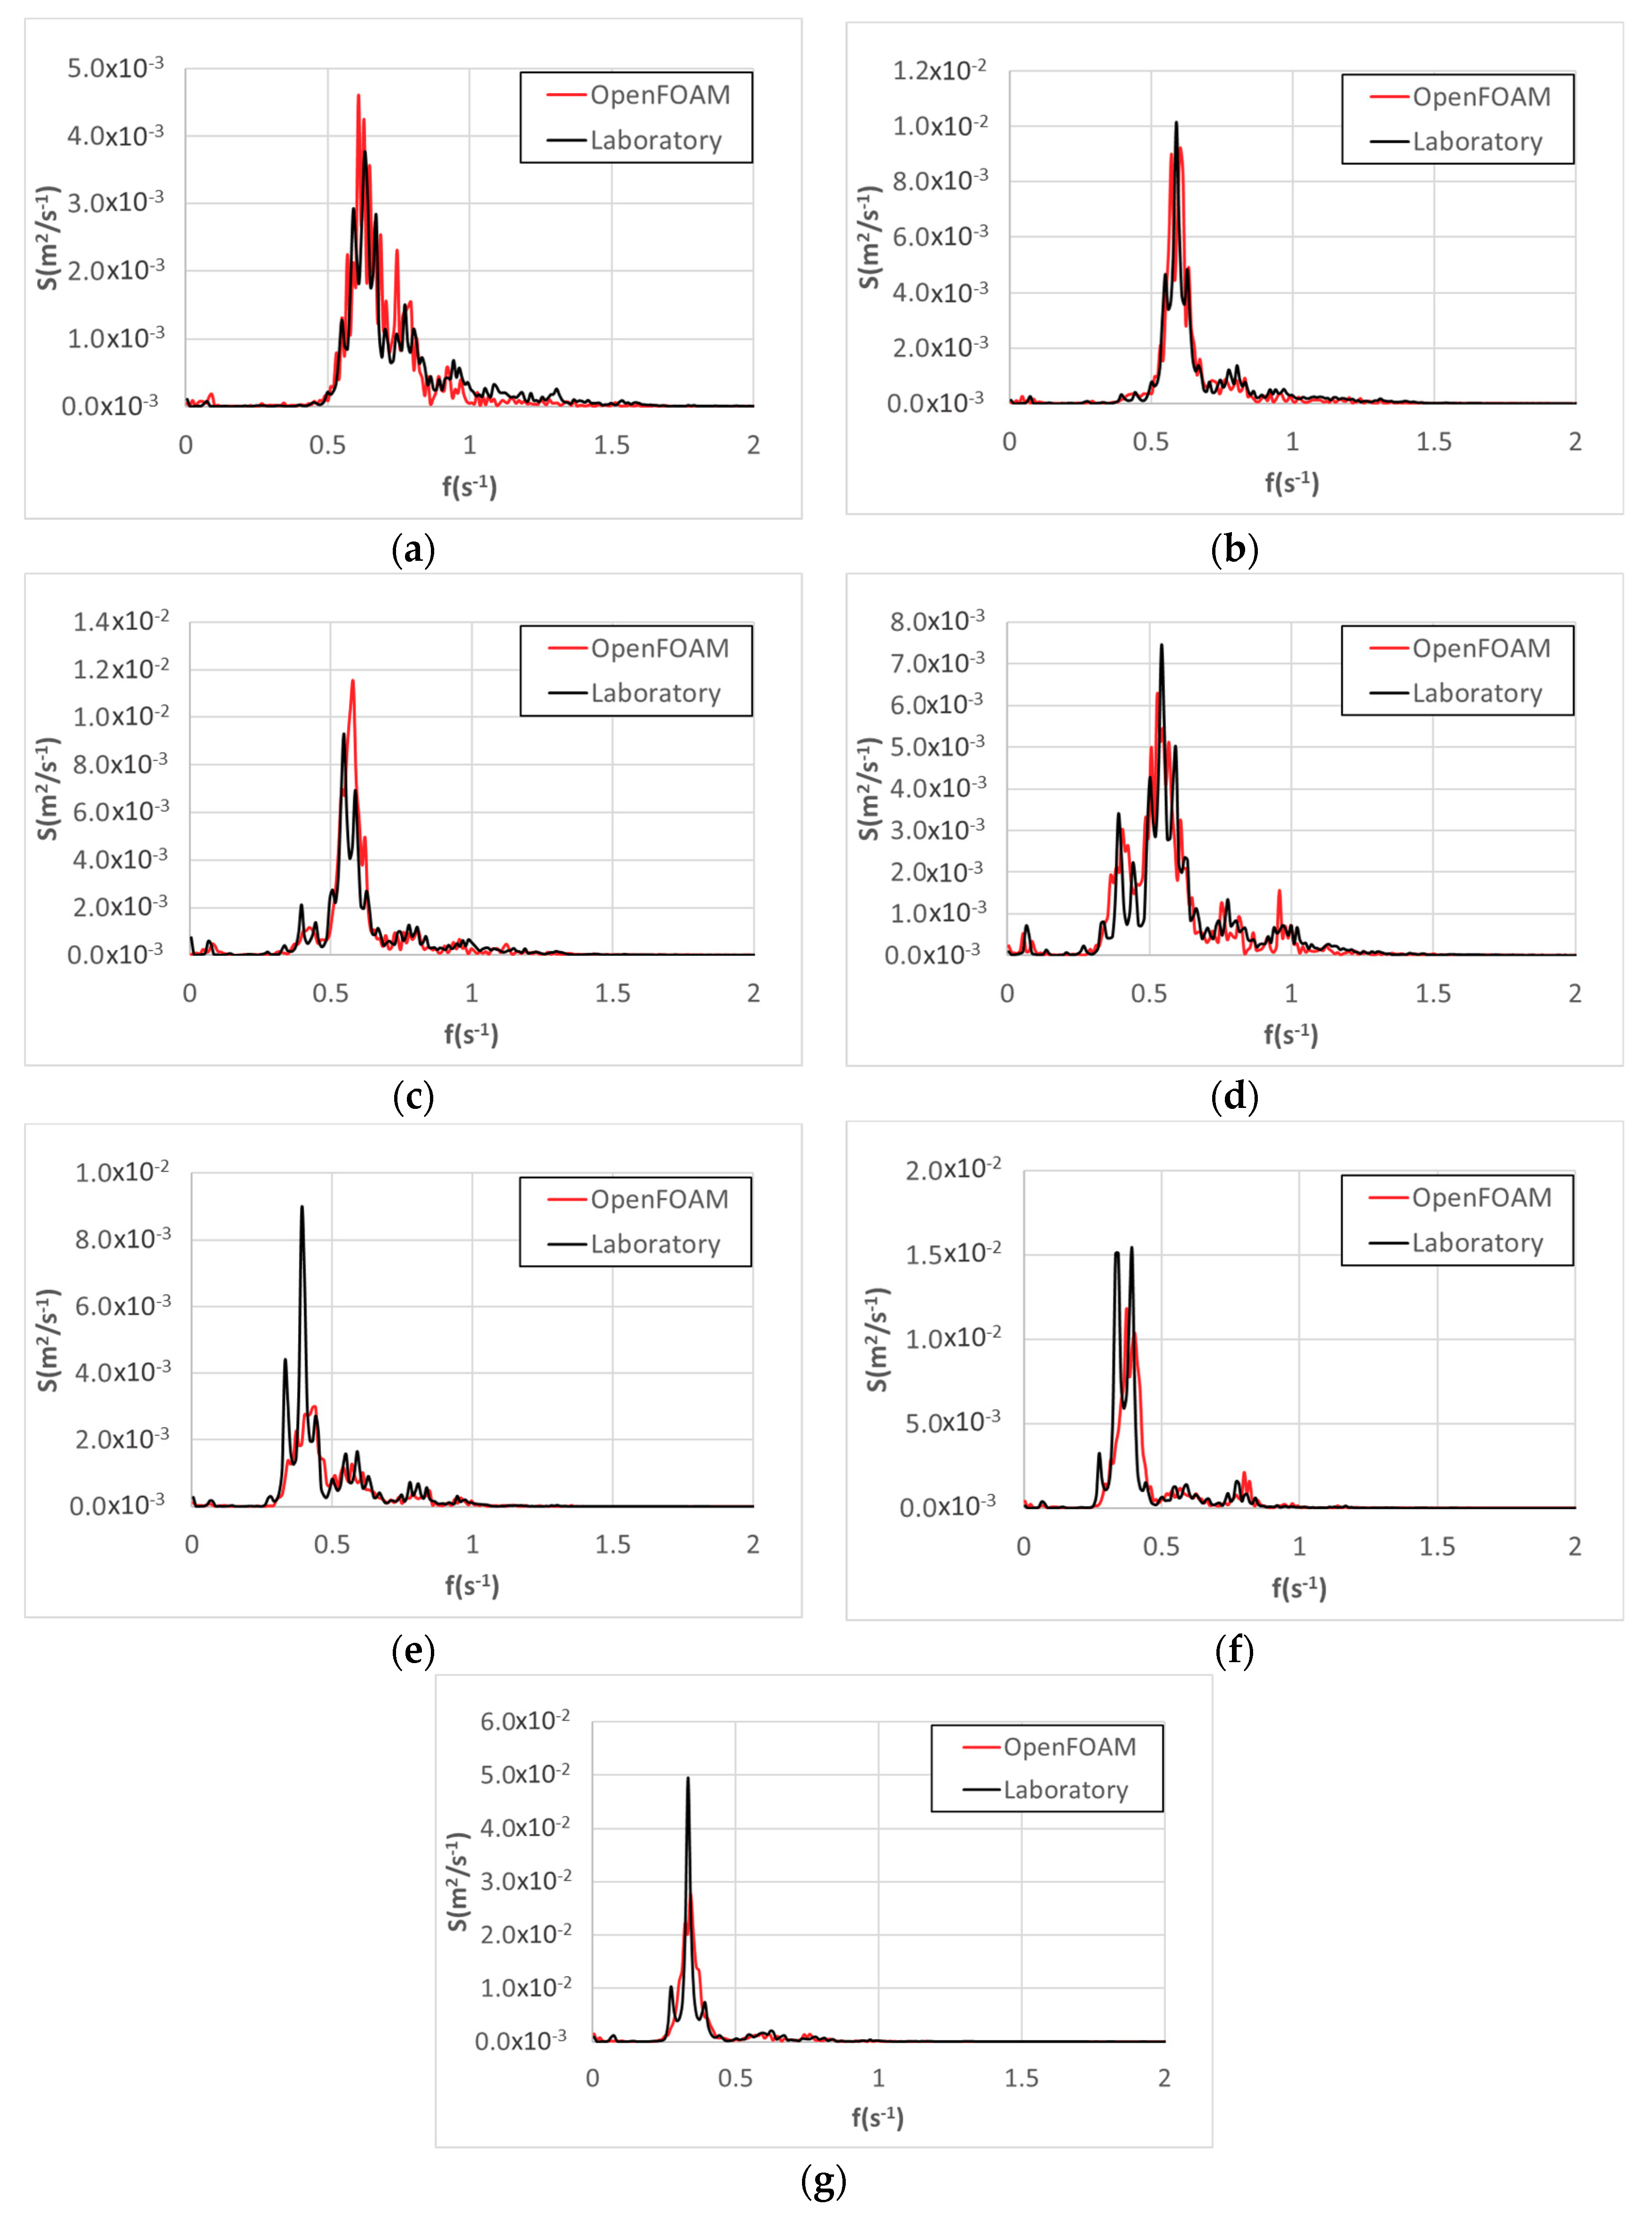
4.2. Irregular Tests

Tests given in Table 1 were used to validate the OpenFOAM® model with irregular waves. Figure 6 compares the estimations based on the numerical tests and the measurements of the physical tests (structure #A0 without parapet); Hm0i is the incident wave height at the toe of the breakwater, Tp is the peak period, Q = q/(gHm03)0.5 is the dimensionless mean wave overtopping, and CR = Hm0r/Hm0i is the reflection coefficient, where Hm0i and Hm0r are the incident and reflected significant wave heights measured at the toe, respectively. The estimations of Hm0i, Tp, CR, and logQ provided rMSE = 2.4%, 2.8%, 3.2%, and 38.3%, respectively. Figure 7 compares the wave energy spectrum measured in physical and numerical tests on the wave gauge 6; both wave energy spectrums provided a similar distribution of energy along frequencies with very similar area (related to Hm0) and peak frequency.
The parameters proposed in Table 2 to define the porous media in the OpenFOAM® model according to the recommendations of other authors provided good results. No calibration was conducted in this study, but a sensitivity analysis on the porosity of the porous media was conducted, as outlined in Section 4.3.
Romano et al. [46] analyzed the uncertainties on the overtopping discharge measurements. Romano et al. [46] used different seeds for the starting phase distributions to generate different wave time series with the same energy density spectrum. The authors reported 20% variability in the wave overtopping measurements when Rc/Hm0 < 1.2. When Rc/Hm0 > 1.4, the variability of the overtopping discharge reached one order of magnitude for the same wave condition. Moreover, wave overtopping is very sensitive to variations on the wave height, which are predicted in OpenFOAM® with rMSE = 2.4% (Figure 6a). According to the intrinsic sources of variability discussed above, the predictions of wave overtopping by OpenFOAM® provided in Figure 6d are acceptable.

4.3. Influence of the Porosity of the Porous Media on the Numerical Model

The results of the numerical model depend on the parameters used to represent the porous media. α, β, and C are not easy to characterize in physical tests and are usually taken from literature (Vílchez et al. [47]). The parameters n and D50 can be directly measured from the physical tests; the influence of the armor, filter, and core porosity on the numerical model’s performance is analyzed in this section. The physical tests of structure #A0 without a parapet, described in Section 4.2, were used here with the α, β, C and D50 given in Table 3 and porosities given by n(core) = 0.35, n(filter) = 0.38, and n(armor layer) = 0.42. The porosities corresponded approximately to the real values of porosity in the physical tests.
Figure 8 compares the results of the numerical model for Hm0i, Tp, CR, and logQ when using the porous media characteristics given in Table 2 (green points) and those given in this section (black crosses). The numerical model provided almost the same result in both cases; small variations on the porosity of the porous media in the numerical model around the value n = 0.40 had a minor influence on the performance of the numerical model.

5. Influence of a Parapet on Wave Overtopping on Mound Breakwaters

In this section, the wave overtopping of models with parapets was compared to wave overtopping of models without parapets (see Figure 9). Structure #A1 was compared to Structure #A0, and Structures #B1 to #B6 were compared to Structure #B0.
Figure 10 illustrates the comparison of logQ0 and logQp, where Q0 = q0/(gHm03)0.5 is the dimensionless mean-overtopping discharge of structures without parapets (#A0 and #B0), and Qp = qp/(gHm03)0.5 is the dimensionless mean-overtopping discharge of structures with parapets (#A1 and #B1 to #B6). In all tests, a reduction in wave overtopping was observed when there was a parapet. When high wave-overtopping discharges occurred, the parapet was submerged, and its effectiveness decreased. Figure 10 illustrates that structure #A1 with low Rc had very similar wave overtopping to structure #A0; Rc may have an influence on estimating logQp.
Equation (10) is proposed to estimate the dimensionless mean wave overtopping discharge when there is a parapet (rMSE = 16.4%). Very low wave overtopping rates are not reliable because of the sensitivity of the measuring instruments and data analysis in both physical and numerical modeling; similar to the criterion used in the EU-CLASH Project (2001–2003) and other publications, such as Molines and Medina [4], only tests with logQp > −7 were used to calibrate the parameters of Equation (10). The dashed line in Figure 10 corresponds to the linear regression of the data given by Equation (10) fitted to 38 tests.
logQ p = min [ logQ 0 ;   1.16 logQ 0 + 0.35 ] .
In this study, the variance was not considered constant. Thus, following the methodology given by Molines and Medina [4], the error (e) may be considered a variable with a Gaussian distribution with zero mean and a variance estimated by Equation (11):
σ 2 ( e ) = 0.035 logQ p 0.1 .
The 5% and 95% percentiles for the logQp estimations given by Equation (10) may be obtained by:
logQ p | 5 % 95 % = logQ p ± 0.035 logQ p 0.1 .
The ratio Qp/Q0 was used to analyze the influence of the parapet on wave overtopping, which was dependent on εp and wp/hp. The variable Q0 implicitly considered the influence of the wave conditions at the toe of the structure (Hm0, Tp), the breakwater geometry (Rc, Ac, Gc, cotα, etc.), and other breakwater characteristics (core permeability, armor roughness, etc.). Therefore, the differences observed in Figure 10 between Qp and Q0 can be assumed to be exclusively generated by the presence of a parapet. Figure 11 compares measured logQp in the numerical tests and estimated logQp using Equation (10), with the 90% confidence interval given by Equation (12). As observed by other authors, such as Kortenhaus [7,11], for vertical breakwaters, the influence of the parapet decreased for large overtopping rates.
Figure 12 shows the influence of the parapet angle for the three tested values of wp/hp (0.5, 1, and 2). The dotted lines given in Figure 12 correspond to the linear regression. Parapets with εp = 30° showed a reduction in wave-overtopping discharges in the range of 10% to 20% compared to parapets with εp = 60°. Parapets with wp/hp = 1 showed a lower reduction of the wave-overtopping discharges compared to parapets with wp/hp = 0.5 and 2. Within the range of variables analyzed in this study, parapets with εp ≈ 30° and wp/hp ≈ 1 are recommended in order to optimize reduction in wave overtopping and concrete consumption, taking into account the technical feasibility of the parapet.

6. Conclusions

This study analyzed the influence of parapet geometry on the mean wave-overtopping discharge on mound breakwaters with crown walls. To this end, numerical simulations using CFD techniques were conducted using the open source software OpenFOAM®. This model was validated using eight physical tests without parapets described by Smolka et al. [17], which consisted of one regular test, used to validate the numerical model in the time domain, and seven irregular tests, used to statistically validate the numerical model. When irregular waves were tested, the estimations given by the numerical model of the incident wave height (Hm0i), peak period (Tp), reflection coefficient (CR), and dimensionless mean wave-overtopping discharges (logQ0) had proportions of non-explained variance given by rMSE = 2.4%, 2.8%, 3.2%, and 38.3%, respectively. The parameters α = 200, β = 1.1, C = 0.34, and n = 0.40 used in this study in Equations (4)–(6) satisfactorily represented the hydraulic performance of the numerical wave flume. Small variations in the armor, filter, and core porosity on the numerical model did not significantly affect the results.
A parametric study was conducted using the outcome of the numerical model in order to analyze the influence of the parapet height (hp), the parapet width (wp), and the parapet angle (εp). The existence of a parapet reduced the wave-overtopping discharge; however, for a large wave-overtopping discharge (Q0 > 10−3), there was no significant reduction in wave-overtopping discharges due to the parapet. Equation (10) was proposed to estimate logQp on structures with parapets.
Parapets with εp = 30° showed a reduction in wave-overtopping discharges in the range 10% to 20% compared to parapets with εp = 60°. Within the range of variables analyzed in this study, parapets with εp ≈ 30° and wp/hp ≈ 1 are recommended in order to optimize reduction in wave overtopping and concrete consumption, taking into account the technical feasibility of the parapet.

Author Contributions

Conceptualization, J.M. and J.R.M.; methodology, J.M.; software, J.M. and A.B.; validation, J.M. and A.B.; formal analysis, J.M. and J.R.M.; resources, J.M.; writing—original draft preparation, J.M., A.B., M.E.G.-M. and J.R.M.; writing—review and editing, J.M., A.B., M.E.G.-M. and J.R.M.; visualization, J.M. and A.B.; supervision, J.M.; project administration, J.M.; funding acquisition, J.M., M.E.G.-M. and J.R.M.

Funding

This research was funded by Universitat Politècnica de València (Grant SP20180111, Primeros Proyectos de Investigación (PAID-06-18), Vicerrectorado de Investigación, Innovación y Transferencia de la Universitat Politècnica de València).

Acknowledgments

The authors are grateful for financial support from European FEDER and Spanish Ministerio de Economía y Competitividad (Grant RTI2018-101073-B-I00), SATO (OHL Group). The authors acknowledge the support provided by the postdoctoral company internship program AEST granted to Jorge Molines by Generalitat Valenciana (Grant AEST/2019/004) and by the postdoctoral program APOSTD granted to Arnau Bayon by Generalitat Valenciana (Grant APOSTD/2019/100). The authors thank Moisés Belda for his collaboration in running and analyzing the tests.

Conflicts of Interest

The authors declare no conflict of interest.

References

  1. Pullen, T.; Allsop, N.W.H.; Bruce, T.; Kortenhaus, A.; Schüttrumpf, H.; Van der Meer, J.W. EurOtop Wave Overtopping of Sea Defences and Related Structures: 2007. Assessment Manual. Available online: http://www.kennisbank-waterbouw.nl/DesignCodes/EurOtop.pdf (accessed on 15 July 2019).
  2. Van der Meer, J.W.; Allsop, N.W.H.; Bruce, T.; De Rouck, J.; Kortenhaus, A.; Pullen, T.; Schüttrumpf, H.; Troch, P.; Zanuttigh, B. EurOtop. Manual on wave overtopping of sea defences and related structures. An Overtopping Manual Largely Based on European Research, but for Worldwide Application. 2018. Available online: www.overtopping-manual.com (accessed on 12 September 2019).
  3. Van Gent, M.R.A.; Van den Boogaard, H.F.P.; Pozueta, B.; Medina, J.R. Neural network modelling of wave overtopping at coastal structures. Coast. Eng. 2007, 54, 586–593. [Google Scholar] [CrossRef] [Green Version]
  4. Molines, J.; Medina, J.R. Explicit wave overtopping formula for mound breakwaters with crown walls using CLASH neural network derived-data. J. Waterw. Port Coast. Ocean Eng. 2015, 142, 04015024. [Google Scholar] [CrossRef] [Green Version]
  5. Molines, J.; Medina, J.R. Calibration of overtopping roughness factors for concrete armor units in non-breaking conditions using the CLASH database. Coast. Eng. 2015, 96, 65–70. [Google Scholar] [CrossRef] [Green Version]
  6. Van Doorslaer, K.; De Rouck, J.; Audenaert, S.; Duquet, V. Crest modifications to reduce wave overtopping of non-breaking waves over a smooth dike slope. Coast. Eng. 2015, 101, 69–88. [Google Scholar] [CrossRef]
  7. Kortenhaus, A.; Pearson, J.; Bruce, T.; Allsop, N.W.H.; van der Meer, J.W. Influence of parapets and recurves on wave overtopping and wave loading of complex vertical walls. In Proceedings of the Coastal Structures, ASCE, Portland, OR, USA, 26–30 August 2003; pp. 369–381. [Google Scholar]
  8. Coeveld, E.M.; Busnelli, M.M.; van Gent, M.R.A.; Wolters, G. Wave overtopping of rubble mound breakwaters with crest elements. In Proceedings of the 30th International Conference on Coastal Engineering, World Scientific, San Diego, CA, USA, 3–8 September 2006; pp. 2944–2956. [Google Scholar]
  9. Bradbury, A.P.; Allsop, N.W.H.; Stephens, R.V. Hydraulic Performance of Breakwater Crown Walls; Report SR 146; Hydraulics Research: Wallingford, UK, 1988. [Google Scholar]
  10. Cornett, A.; Li, Y.; Budvietas, A. Wave overtopping at chamfered and overhanging vertical structures. In Proceedings of the International Workshop on Natural Disasters by Storm Waves and Their Reproduction in Experimental Basins, Kyoto, Japan, 14 December 1999; p. 14. [Google Scholar]
  11. Kortenhaus, A.; Haupt, R.; Oumeraci, H. Designs aspects of vertical walls with steep foreland slopes. In Proceedings of the Breakwaters, Coastal Structures and Coastlines, ICE, London, UK, 26–28 September 2001; pp. 221–232. [Google Scholar]
  12. Pearson, J.; Bruce, T.; Allsop, N.W.H.; Kortenhaus, A.; van der Meer, J.W. Effectiveness of recurve walls in reducing wave overtopping on seawalls and breakwaters. In Proceedings of the 29th International Conference on Coastal Engineering, World Scientific, Lisbon, Portugal, 19–24 September 2004; pp. 4404–4416. [Google Scholar]
  13. Van Doorslaer, K.; De Rouck, J.; van der Meer, J.W. The reduction of wave overtopping by means of a storm wall. In Proceedings of the 35th International Conference on Coastal Engineering, World Scientific, Antalya, Turkey, 17–20 November 2016. [Google Scholar]
  14. Castellino, M.; Sammarco, P.; Romano, A.; Martinelli, L.; Ruol, P.; Franco, L.; De Girolamo, P. Large impuplsive forces on recurved parapets under non-breaking waves. A numerical study. Coast. Eng. 2018, 136, 1–15. [Google Scholar] [CrossRef]
  15. Martinelli, L.; Ruol, P.; VOlpato, M.; Favaretto, C.; astellino, M.; De Girolamo, P.; Franco, L.; Romano, A.; Sammarco, P. Experimental investigation on non-breaking wave forces and overtopping at the recurved parapets of vertical breakwaters. Coast. Eng. 2018, 141, 52–67. [Google Scholar] [CrossRef]
  16. Formentin, S.M.; Zanuttigh, B. A genetic programming based formula for wave overtopping by crown walls and bullnoses. Coast. Eng. 2019, 152, 103529. [Google Scholar] [CrossRef]
  17. Smolka, E.; Zarranz, G.; Medina, J.R. Estudio Experimental del Rebase de un Dique en Talud de Cubípodos. In Libro de las X Jornadas Españolas de Costas y Puertos; Universidad de Cantabria-Adif Congresos: Santander, Spain, 2009; pp. 803–809. (In Spanish) [Google Scholar]
  18. Lykke-Andersen, T.; Burcharth, H.F.; Gironella, X. Comparison of new large and small overtopping tests for rubble mound breakwaters. Coast. Eng. 2011, 58, 351–373. [Google Scholar] [CrossRef]
  19. Burcharth, H.F.; Liu, Z.; Troch, P. Scaling of core material in rubble mound breakwater model tests. In Proceedings of the 5th International Conference on Coastal and Port Engineering in Developing Countries, Cape Town, South Africa, 19–23 April 1999; pp. 1518–1527. [Google Scholar]
  20. Molines, J.; Herrera, M.P.; Medina, J.R. Estimations of wave forces on crown walls based on wave overtopping rates. Coast. Eng. 2018, 132, 50–62. [Google Scholar] [CrossRef]
  21. Mansard, E.P.D.; Funke, E.R. The measurement of incident and reflected spectra using a least swuares method. In Proceedings of the 17th International Conference on Coastal Engineering, ASCE, Sydney, Australia, 23–28 March 1980; pp. 154–172. [Google Scholar]
  22. Van Gent, M.R.A. Wave Interaction with Permeable Coastal Structures. Ph.D. Thesis, Delft University, Delft, The Netherlands, 1995. [Google Scholar]
  23. Higuera, P.; Lara, J.L.; Losada, I.J. Three-dimensional interaction of waves and porous coastal structures using OpenFOAM. Part II: Applications. Coast. Eng. 2014, 83, 259–270. [Google Scholar] [CrossRef]
  24. Jacobsen, N.G.; van Gent, M.R.A.; Capel, A.; Borsboom, M. Numerical prediction of integrated wave loads on crest walls on top of rubble mound structures. Coast. Eng. 2018, 142, 110–124. [Google Scholar] [CrossRef]
  25. Guanche, R.; Losada, I.J.; Lara, J.L. Numerical analysis of wave loads for coastal structure stability. Coast. Eng. 2009, 56, 543–558. [Google Scholar] [CrossRef]
  26. Issa, R.I. Solution of the implicitly discretized fluid flow equations by operator-splitting. J. Comput. Phys. 1985, 62, 40–65. [Google Scholar] [CrossRef]
  27. Patankar, S.V.; Spalding, D.B. A calculation procedure for heat, mass and momentum transfer in three-dimensional parabolic flows. J. Heat Mass Transf. 1972, 15, 1787–1806. [Google Scholar] [CrossRef]
  28. Jensen, B.; Jacobsen, N.G.; Christensen, E.D. Investigations on the porous media equations and resistance coefficients for coastal structures. Coast. Eng. 2014, 84, 56–72. [Google Scholar] [CrossRef]
  29. Hirt, C.W.; Nichols, B.D. Volume of fluid (VOF) method for the dynamics of free boundaries. J. Comput. Phys. 1981, 39, 201–225. [Google Scholar] [CrossRef]
  30. Berberovic, E.; van Hinsberg, N.P.; Jakirlic, S.; Roisman, I.V.; Tropea, C. Drop impact onto a liquid layer of finite thickness: Dynamics of the cavity evolution. Phys. Rev. E 2009, 79, 036306. [Google Scholar] [CrossRef]
  31. Jacobsen, N.G.; van Gent, M.R.; Wolters, G. Numerical analysis of the interaction of irregular waves with two dimensional permeable coastal structures. Coast. Eng. 2015, 102, 13–29. [Google Scholar] [CrossRef]
  32. Higuera, P.; Lara, J.L.; Losada, I.J. Realistic wave generation and active wave absorption for Navier-Stokes models: Application to OpenFOAM. Coast. Eng. 2013, 71, 102–118. [Google Scholar] [CrossRef]
  33. Higuera, P.; Lara, J.L.; Losada, I.J. Simulating coastal engineering processes with OpenFOAM. Coast. Eng. 2013, 71, 119–134. [Google Scholar] [CrossRef]
  34. Higuera, P.; Lara, J.L.; Losada, I.J. Three-dimensional interaction of waves and porous coastal structures using OpenFOAM. Part I: Formulation and validation. Coast. Eng. 2014, 83, 243–258. [Google Scholar] [CrossRef]
  35. Kim, S.E.; Boysan, F. Application of CFD to environmental flows. J. Wind Eng. Ind. Aerodyn. 1999, 81, 145–158. [Google Scholar] [CrossRef]
  36. Biswas, R.; Strawn, R.C. Tetrahedral and hexahedral mesh adaptation for CFD problems. Appl. Numer. Math. 1998, 26, 135–151. [Google Scholar] [CrossRef]
  37. Huang, H.; Prosperetti, A. Effect of grid orthogonality on the solution accuracy of the two-dimensional convection-diffusion equation. Numer. Heat Transf. 1994, 26, 1–20. [Google Scholar] [CrossRef]
  38. Keyes, D.; Ecer, A.; Satofuka, N.; Fox, P.; Periaux, J. Parallel Computational Fluid Dynamics’ 99: Towards Teraflops, Optimization and Novel Formulations; Elsevier: Amsterdam, The Netherlands, 2000. [Google Scholar]
  39. Bayon, A. Numerical Analysis of Air-Water Flows in Hydraulic Structures using Computational Fluid Dynamics (CFD). Ph.D. Thesis, Universitat Politècnica de València, Valencia, Spain, 2017. [Google Scholar]
  40. Hirsch, C. Numerical Computation of Internal and External Flows: The Fundamentals of Computational Fluid Dynamics; Butterworth-Heinemann: Oxford, UK, 2007. [Google Scholar]
  41. Celik, I.B.; Ghia, U.; Roache, P.J.; Freitas, C.J.; Coleman, H.; Raad, P.E. Procedure for estimation and reporting of uncertainty due to discretization in CFD applications. J. Fluids Eng. 2008, 130, 078001. [Google Scholar]
  42. Tsai, C.P.; Ko, C.H.; Chen, Y.C. Investigation on Performance of a Modified Breakwater-Integrated OWC Wave Energy Converter. Sustainability 2018, 10, 643. [Google Scholar] [CrossRef] [Green Version]
  43. Bayon, A.; Lopez-Jimenez, P.A. Numerical analysis of hydraulic jumps using OpenFOAM. J. Hydroinf. 2015, 17, 662–678. [Google Scholar] [CrossRef] [Green Version]
  44. Bayon, A.; Valero, D.; García-Bartual, R.; Vallés-Morán, F.J.; López-Jiménez, P.A. Performance assessment of OpenFOAM and FLOW-3D in the numerical modeling of a low Reynolds number hydraulic jump. Environ. Model. Softw. 2016, 80, 322–335. [Google Scholar] [CrossRef]
  45. Bayon, A.; Toro, J.P.; Bombardelli, F.A.; Matos, J.; López-Jiménez, P.A. Influence of VOF technique, turbulence model and discretization scheme on the numerical simulation of the non-aerated, skimming flow in stepped spillways. J. Hydro-Environ. Res. 2018, 19, 137–149. [Google Scholar] [CrossRef] [Green Version]
  46. Romano, A.; Bellotti, G.; Briganti, R.; Franco, L. Uncertainties in the physical modelling of the wave overtopping over a rubble mound breakwater: The role of the seeding number and of the test duration. Coast. Eng. 2015, 103, 15–21. [Google Scholar] [CrossRef]
  47. Vílchez, M.; Clavero, M.; Lara, J.L.; Losada, M.A. A characteristic friction diagram for the numerical quantification of the hydraulic performance of different breakwater types. Coast. Eng. 2016, 114, 86–98. [Google Scholar] [CrossRef]
Figure 1. Cross-section of (a) a conventional mound breakwater with a crown wall and (b) parapet geometric parameters.
Sustainability 11 07109 g001
Figure 2. Cross-section of two-layer Cubipod armored breakwater tested by Smolka et al. [17]. Dimensions are in centimeters.
Sustainability 11 07109 g002
Figure 3. Longitudinal cross-section of the wave flume of the Laboratory of Ports and Coasts at the Universitat Politècnica de València (LPC-UPV). Dimensions are in centimeters.
Sustainability 11 07109 g003
Figure 4. Mesh schematic showing selective refinement regions and boundary conditions.
Sustainability 11 07109 g004
Figure 5. Validation of the OpenFOAM® model using regular waves H(m) = 0.203 and T(s) = 2.62: (a) incident waves at G1, (b) reflected waves at G1, (c) incident waves at G6, (d) reflected waves at G6, and (e) cumulative wave-overtopping mass.
Sustainability 11 07109 g005aSustainability 11 07109 g005b
Figure 6. Validation of the OpenFOAM® model with irregular tests: (a) Hm0i, (b) Tp, (c) CR, and (d) logQ.
Sustainability 11 07109 g006
Figure 7. Comparison of wave energy spectrum measured in laboratory and numerical tests on G6 of (a) Test I1, (b) Test I2, (c) Test I3, (d) Test I4, (e) Test I5, (f) Test I6, and (g) Test I7.
Sustainability 11 07109 g007
Figure 8. Validation of the OpenFOAM® model with different armor, filter, and core porosities: (a) Hm0i, (b) Tp, (c) CR, and (d) logQ.
Sustainability 11 07109 g008
Figure 9. Effect of breakwater crest geometry on wave overtopping. Simulation at t(s) = 180 of a test with Hm0i(m) = 0.14 and Tp(s) = 3.
Sustainability 11 07109 g009
Figure 10. Comparison of logQ0 and logQp. Continuous line is given by logQ0 = logQp and the dashed line is given by Equation (10).
Sustainability 11 07109 g010
Figure 11. Comparison between measured and estimated logQp (with parapet) by Equation (10) and 90% confidence intervals.
Sustainability 11 07109 g011
Figure 12. Influence of εp on Qp/Q0 for: (a) wp/hp = 0.5, (b) wp/hp = 1, and (c) wp/hp = 2.
Sustainability 11 07109 g012
Table 1. Wave conditions of the physical tests used in this study.
Test NumberIrmHm0 (m)Tp (s)Wave Type
I140.0971.49Irregular
I240.1131.70Irregular
I340.1321.83Irregular
I440.1391.99Irregular
I550.0992.22Irregular
I650.1172.55Irregular
I750.1373.00Irregular
Test NumberIrmH (m)T (s)Wave Type
R150.2032.62Regular
Table 2. Characteristics of the porous media considered in computational fluid dynamics (CFD) simulations.
ZoneD50 (m)nαβC
Core0.0070.42001.10.34
Filter0.0170.42001.10.34
Armor layer0.0380.42001.10.34
Table 3. Crown wall geometries of the tested structures in OpenFOAM®.
Structure #Ch (m)Cb (m)Rc (m)Ac (m)Parapetwp (m)hp (m)εp (°)
A00.200.300.200.15No---
A10.200.300.200.15Yes0.0250.02530
B00.260.300.260.15No---
B10.260.300.260.15Yes0.0250.02530
B20.260.300.260.15Yes0.0250.05030
B30.260.300.260.15Yes0.0500.02530
B40.260.300.260.15Yes0.0250.02560
B50.260.300.260.15Yes0.0250.05060
B60.260.300.260.15Yes0.0500.02560

