Article

Solar Energy Production for a Decarbonization Scenario in Spain

by
Rafael Sánchez-Durán
1,
Julio Barbancho
2,* and
Joaquín Luque
2,*
1
Endesa, Av. de la Borbolla, 41004 Sevilla, Spain
2
Tecnología Electrónica, Universidad de Sevilla, Av, Reina Mercedes s/n, 41004 Sevilla, Spain
*
Authors to whom correspondence should be addressed.
Sustainability 2019, 11(24), 7112; https://doi.org/10.3390/su11247112
Submission received: 22 October 2019 / Revised: 7 December 2019 / Accepted: 7 December 2019 / Published: 12 December 2019
(This article belongs to the Special Issue Photovoltaic Power)

Abstract

:
Solar energy is one of the most promising sources of energy that could be used to address distributed supply problems. Global warming and decarbonization are significant global concerns, particularly for countries that are not fossil fuel providers. This paper presents a study focused on Spain, a country with a favorable location with respect to horizontal irradiance. The study addresses the future energy demand forecast and how photovoltaic energy could supply an important part of electricity needs. Our approach focuses on two analyses. First, several traditional statistical techniques are discussed in order to obtain a model that best suits Spanish energy demand forecasts for the future years. Different algorithms are compared in order to determine which is the most appropriate for the considered purpose. Second, the evolution of solar photovoltaic technology in Spain is analyzed. The latitude of Spanish cities makes them suitable for utilizing this kind of technology. In this sense, seasonal and monthly trends are identified with high levels of detail, considering a large historical dataset. The increase of the capacity of electricity generation based on this procedure is evaluated. Finally, a discussion about matching electricity demand forecasts and photovoltaic production is offered. Considering the selected model for the photovoltaic power of Spain, from 5 to 42 GW in 2030, the Spanish production is determined as 81 TWh. The obtained results suggest that a possible energy transition is feasible. However, some challenges have to be considered, such us the design of an effective strategy to store excess energy produced when generation is higher than electricity demand. In this way, the electrical distribution system could be fed by the stored energy when solar energy production is deficient.

Graphical Abstract

1. Introduction

One of the most important concerns in sustainability relates to energy sources and how they are managed. Currently, 85% of global energy supply is dependent on fossil fuel [1]. In Europe, this percentage is 74 % , as depicted in Figure 1. Most of the fossil energy comes from oil ( 34 % ), followed by coal and gas. The decarbonized share (hydraulic, nuclear, and renewable) represents only 15 % , a value that reaches 26 % in Europe. Decarbonizing this mix is a significant challenge.
The case of China is remarkable: it is a key developing country towards decarbonization, with a weight equivalent to a quarter of the planet’s primary energy. It has an energy mix strongly based on coal (with a share of 58 % ), which will hinder global objectives. Last year, China increased its coal demand by 85 Mtoe, accounting for one-fifth of the global growth of 391 Mtoe.
Since the 1970s, the energy industry has been dominated by oil; however, it is now evolving exponentially towards a model based on greater use of electricity and energy of renewable origin. The association of the electrical sector, Eurelectric, proclaims that in order to reach the targets of the Paris Agreement on Climate Change [2], the European Union would have to achieve 60 % electrification of its energy before 2050.
Such an evolution will need, first, a massive digitalization of electricity grids; second, to reach a degree of maturity in renewable technologies; and third, the development of energy storage at reasonable costs, which will allow the incorporation of renewable electricity even in the transport sector, something which has yet to be imagined.
Figure 2 shows the most relevant elements that allow a greater rate of electrification of society, and their states of maturity. The evolution of electrification, in the form of an exponential curve, is determined by key milestones, such as the deployment of smart meters, the maturity of technologies, and daily and seasonal storage based on hydrogen. In this regard, growth in global electrification has been significant, with an increase of 938 TWh in 2018 .
As depicted in Figure 3, the planet has achieved 35% decarbonized energy (hydro, nuclear, and renewable). The global electricity mix continues to have a high predominance of coal and gas. China also continues to have a disproportionate weight of the total produced electricity based on coal. This implies a negative effect on the speed of decarbonization of the global economy.
In this context, the concept of smart cities has appeared. Smart cities are labelled as such when they adapt to the principles of sustainability and improve citizens’ living conditions by taking advantage of existing technological advances [3]. In Europe, initiatives such as the Covenant of Mayors, promote energy transition in a group of around 7800 cities that represents more than 252 million inhabitants. This is the most significant global initiative and is based on the premise that the cities concentrate on three-quarters of final energy consumption and therefore emissions of greenhouse gases. The fundamental strategy to displace the consumption of fossil energy in cities is based on its substitution by renewable sources, and mainly solar energy.
In this international context, Spain faces up an important challenge: to couple its economic growth with its decarbonized electricity generation. In this sense, this paper proposes an analysis of an expected scenario: the future Spanish electricity demand and how to cover it with renewable electricity energy sources. This approach requires the study of the electricity demand forecast for the next 30 years and the identification of renewable energy sources that could match this demand. Our study focuses mainly on solar energy generation due to the geographical situation of Spain.
This paper is organized as follows. Section 2 introduces the problem of matching solar electricity generation with electricity demand. The case of Spain is specifically considered. A first challenge on energy forecasting pursuits the most suitable algorithms to forecast the electricity demand and provision for coming years. Section 3 analyzes the application of some techniques for determining a model for the monthly trend of the global horizontal irradiance. A discussion about the obtained results is provided in Section 4. Finally, Section 5 provides some conclusions.

2. Materials and Methods

2.1. Stationary Forecasting Models

There are many studies related to forecasting electricity demand in the literature. In this section, a brief review of the state of the art in this field of research is presented. A comparison between methodologies and objectives is considered.
In [4,5,6], various techniques for forecasting electricity demand for efficient management and planning of the energy system are presented. The advantages and disadvantages of demand forecasting in electric power systems are described. For the forecasting of electricity demand, techniques based on time series analysis and artificial intelligence are used.
Although time series techniques have been mostly used in the literature, recently forecasting techniques have evolved to include several regression types, such as exponential smoothing, least squares, mobile and stochastic mean, and neural networks [7,8,9].
In [10,11,12], the analysis of long-term forecasts is discussed. Scenarios with centralized and decentralized long-term electricity demand models are discussed. Projections based on demography and economics are made.
Other authors [13,14,15] propose methods for medium-term forecasts. This approach is proposed in order to minimize the error in the demand forecast. A correlation between temperature and electricity demand is identified. The related models are based on decomposition methods taking into account the climatic seasonality.
The authors of [16,17] present techniques for short-term forecasts. The use of combined models provides a great improvement in the accuracy. The strategies are based on the use of methods with seasonal adjustment and regression.
Finally, some authors [18,19,20] propose the construction of tight scenarios, based on gross domestic product (GDP), population, and large volumes of data.
Among all of these approaches, the use of time series analyses is common and has attracted the interest of many researchers [21]. Time series methodology is based on the identification of patterns according to a data analysis process. The synthesized models may predict trends and future patterns with low estimation error.
Many time series models show seasonal behaviors, such as those linked to economic, climatic, or temperature cycles. An example of this kind of time series model is an electricity demand model throughout one year, which is largely influenced by the temperature effect.
Our research aims to forecast the electricity demand for Spain based on the analysis of historical data. This forecast must identify trends and other kinds of effects, such as the influence of the economy and energy efficiency. Our approach proposes a monthly scope, considering influence of the seasons. In this sense, the climate plays an important role, presented as a series of related stochastic models that reflects the evolution throughout the months of the year. Electricity generation based on renewable energy (such as solar) has a strong feature of intermittency. This characteristic currently constitutes a challenge for guaranteeing supply. According to this approach, adequate storage mechanisms have to be considered. This issue is still unresolved.
The observation of the past provides a first conclusion about the electricity demand in Spain. There is a strong dependence on temperature, with different patterns seen throughout the year. Figure 4 shows a time series, based on the observation of Spanish monthly electricity demand from 1990 to 2018 [22], which shows how the demand series could have been associated with a univariate model, with exclusive dependence on the temporal variation. However, when sufficient temporary observations have been obtained, also incorporating values with monthly level of detail, the presence or absence of seasonal and cyclic behaviors is observed within the trend.
We can infer that the previous time series has at least three effects: a first effect caused by the trend that characterized the long-term evolution; a second effect of seasonality, with variations over a period that in our example is a year; and, finally, a third effect that describes medium-term oscillations over the trend. These three effects constitute the long-term demand forecast curve. This curve is represented in the previous figure by a dashed line and designated “Forecast”.
The flattened trend shown in the last decade is remarkable. This effect is caused by the increase of the energy efficiency developed in the last decade. However, according to the economic growth that Spain is experiencing, the close future electricity demand is going to follow the depicted trend.
The increasing linear trend of this series, shown by the red line, presents a long-term evolution, with an increasing slope based on the forecast equation. This analysis has considered 348 values corresponding to peninsular electricity demand in Spain, during the last decade.
The identification of a predictive model could be undertaken according to the historical data. The model has to be trained, in order to provide a satisfactory forecast, meeting the specified prediction interval, with minimal error in the training phase. We can synthesize this process by following the diagram shown in Figure 5.
It is possible to add closer projections, such as the forecast of the monthly electricity demand in the year 2019, using what happened between the years 2010 and 2018 as a reference. For this purpose, a Holt–Winters forecasting model [23] can be used. This model is suitable for series that have a marked seasonality. This is an exponential smoothing model, which uses up to three smoothing variables, ( α , δ , and γ , with values between 0 and 1 ), in their additive and multiplicative versions. Equation (1) describes the model ( F t , Forecast ( t period or later)).
F t = ( L t 1 + T t 1 ) S t s ,
where L t 1 represents the level observation of the previous time series ( t 1 period). Consequently, L t represents the level observation of the current time series (period t ):
L t = α A t S t 4 + ( 1 α ) ( L t 1 + T t 1 ) ,
where T t 1 describes the trend observation of previous time series ( t 1 period) and T t describes the trend observation of the current series:
T t = δ ( L t L t 1 ) + ( 1 δ ) T t 1 ,
where S t s represents the seasonal observation of the previous series ( t s period), s being the number of periods considered in a cycle. S t represents the seasonality of the current series:
S t = γ A t L t + ( 1 γ ) S t 1 ,
where A t represents the current observation ( t period).
In the period 2010–2108 we can see that a seasonal component is repeated. By means of the application of the exponential smoothing technique, we can derive a forecast that seasonalizes this demand with a better approximation. Figure 6 shows the detail of the monthly behavior within each year, identifying the effects of temperature and work activity.
In the historical data shown in Figure 6, we observe a decreasing trend, in the red line, and a seasonal component, according to the months of the year. As can be seen, the Holt–Winters method can be used for series with a marked seasonality.
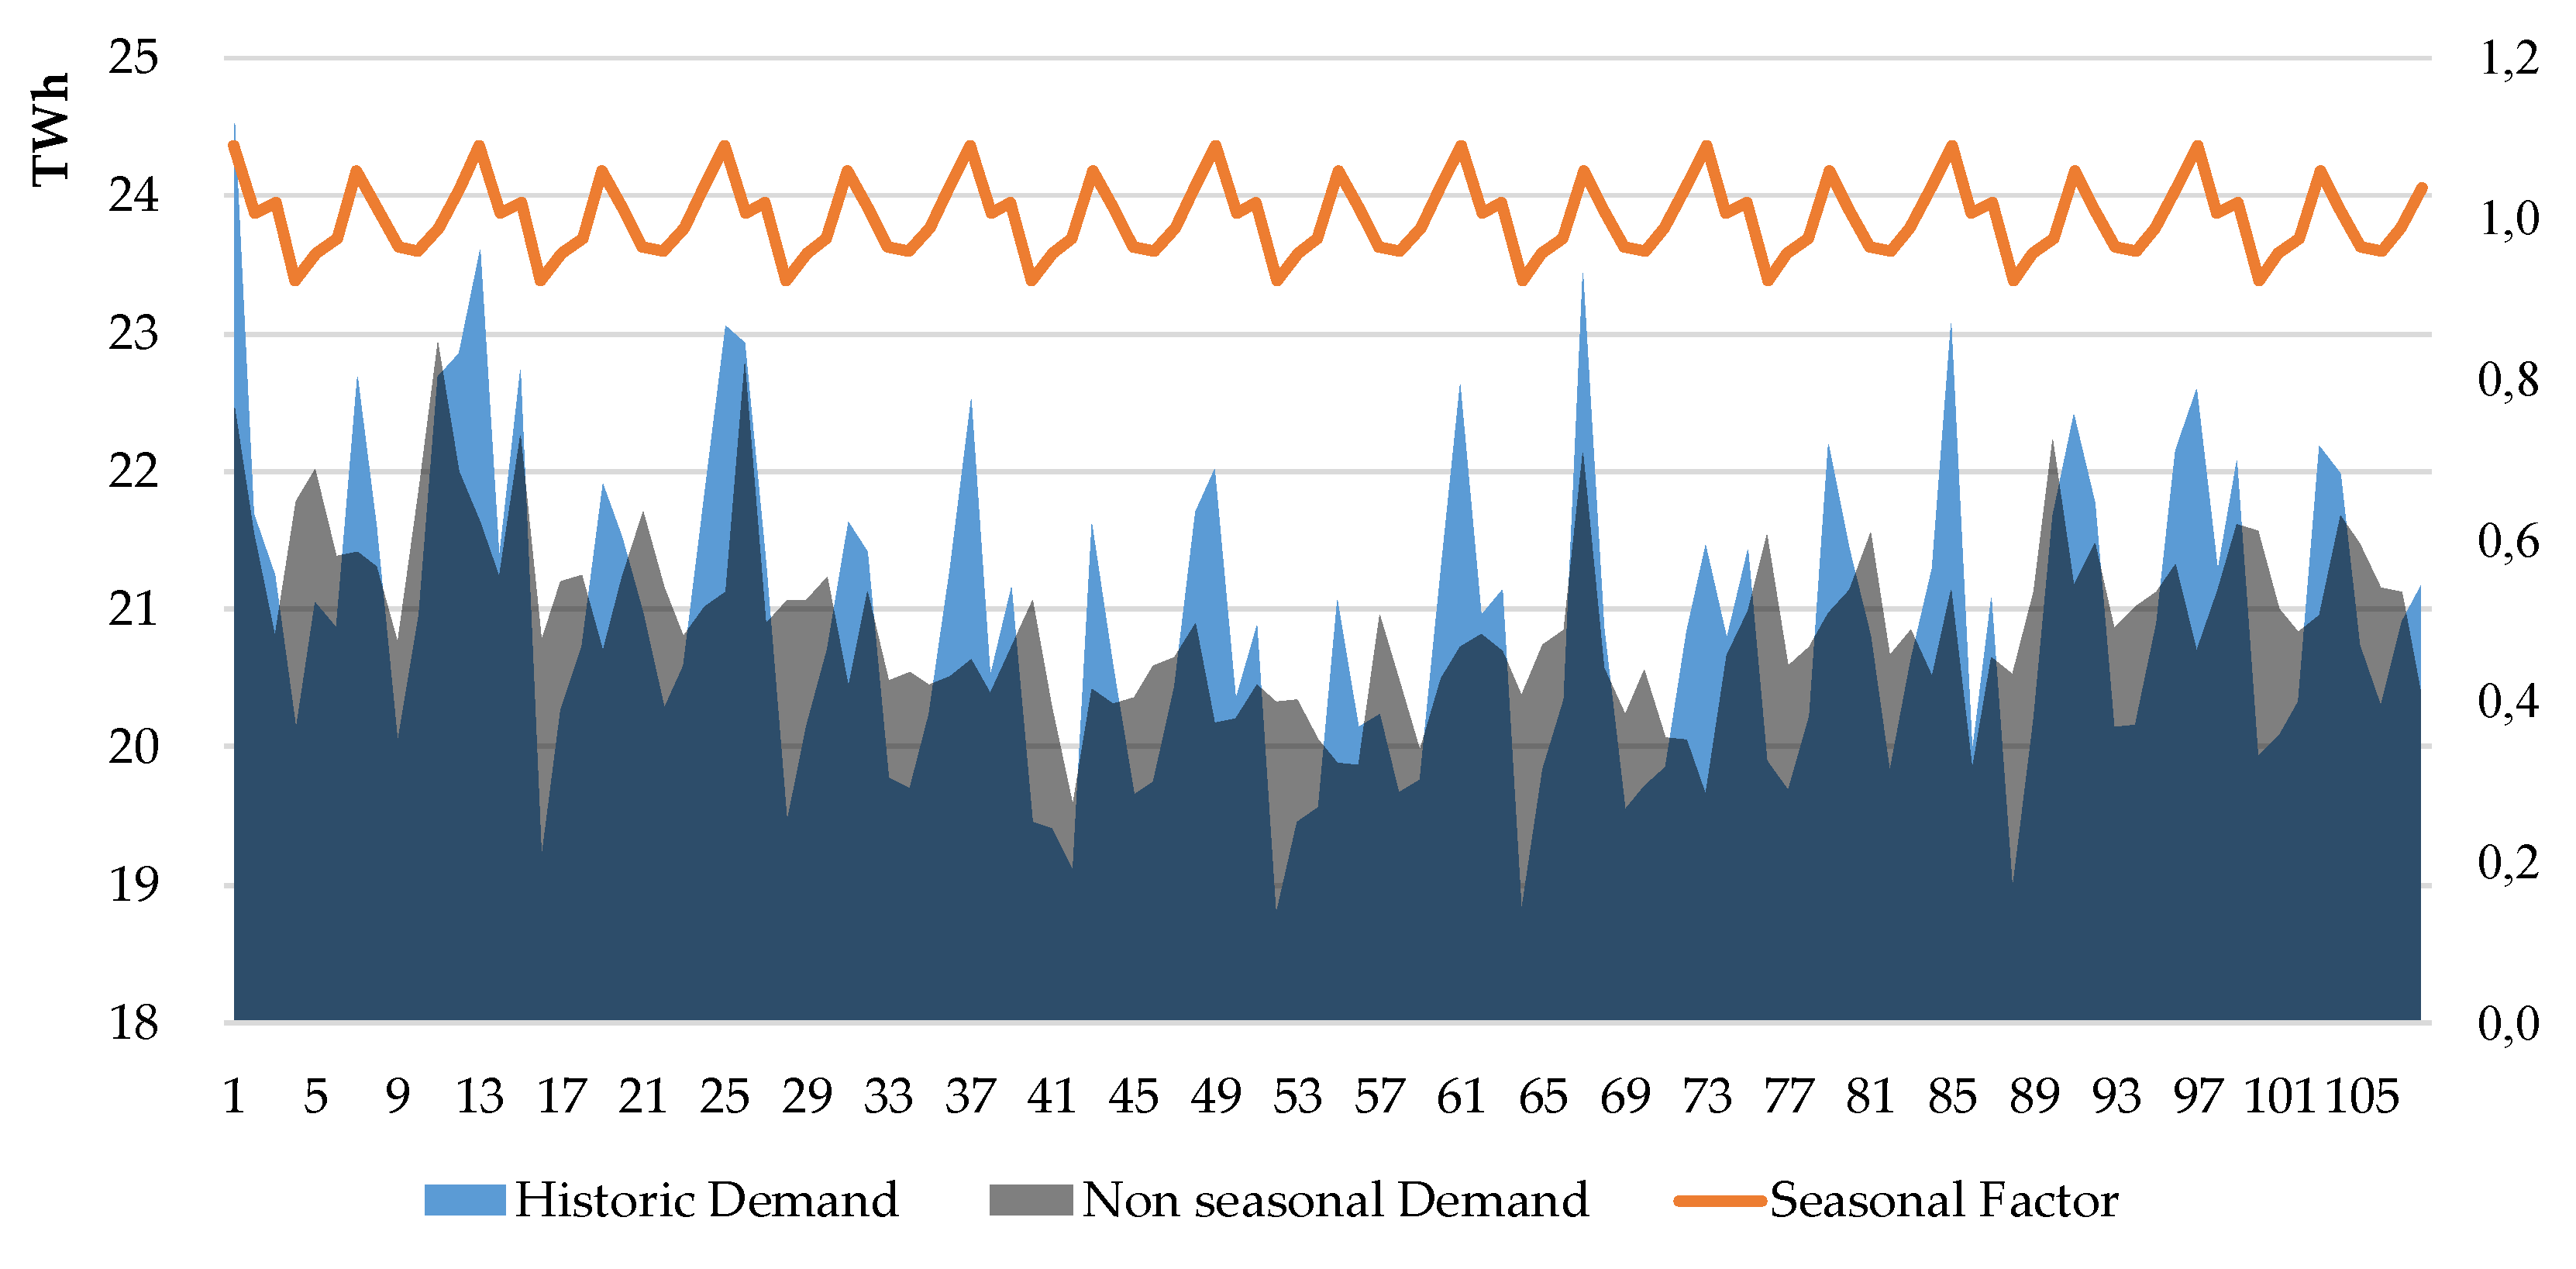
The analysis procedure begins by eliminating the influence of seasonality on demand: the monthly value is divided by the seasonality factor. This seasonality factor is obtained as a quotient of the average demand centered on the monthly data and normalized demand, so that the sum of factors is equal to 12 . Seasonality factors greater than one show expected behaviors above the average and vice versa. The result of this calculation is shown in Table 1. This technique allows historical demand to be translated into nonseasonal demand, which shows the trend (Figure 7).
The method tries to find optimal values for α , δ , and γ by minimizing the quadratic error. Using the technique of least squares for the demand without seasonality, we obtain the parameters a and b (Equation (2)) that characterize the trend of the monthly nonseasonal values: y = a x + b .
a = i = 1 N x 2 i = 1 N y i = 1 N x i = 1 N x y N i = 1 N x 2 ( i = 1 N x ) 2 b = N i = 1 N x y i = 1 N x i = 1 N y N i = 1 N x 2 ( i = 1 N x ) 2
This results in a   =   7.9183 and b   =   21.285 .
For the case of Spanish demand in 2018, the model used smoothing coefficients α   =   0.6 , δ   =   0.5 , and γ   =   0.2 for the level, trend, and seasonality, respectively. The trend equation of nonseasonal monthly values of the past can be expressed by y   =   7.9183 x   +   21.285 .
The smoothing of seasonality yields an interesting observation: the summer months of July and August, and the winter period between December and March, receive upward corrections, while the remainder are reduced, by applying a smoothing factor less than one.
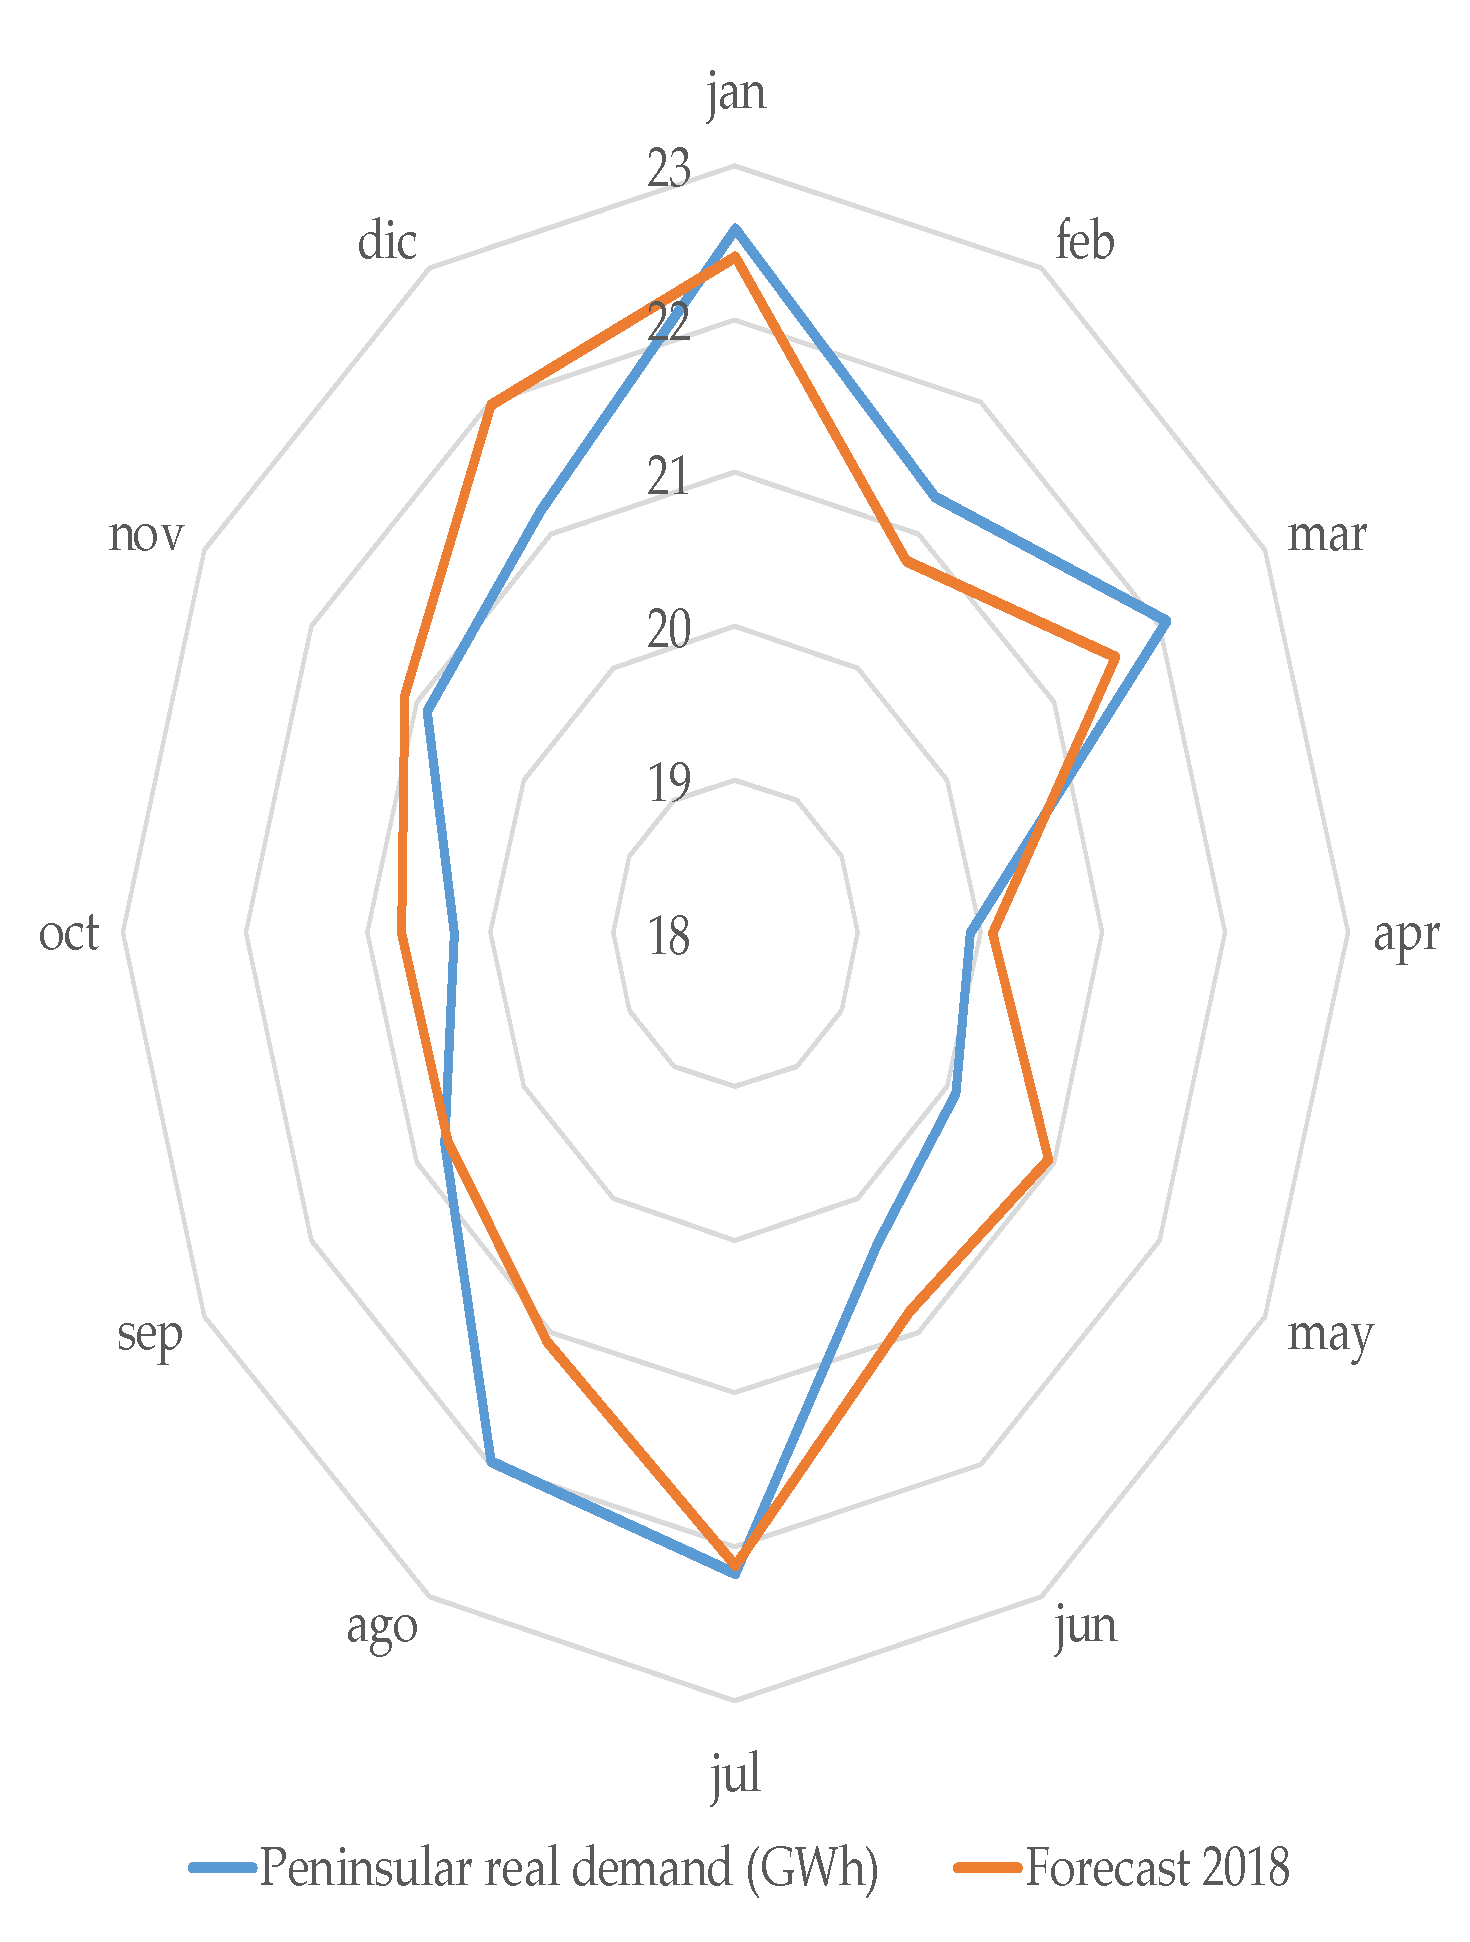
Following the flow depicted in Figure 5, the model can be trained, as detailed in Table 2. With the 2010–2017 period, a predicted monthly value of demand for 2018 is obtained. The comparison of the predicted value with the real value indicates the suitability of the method. A small error can be observed both in absolute and relative terms. It can be concluded that the model fits reasonably well for the year 2018, so a projection for 2019 can be proposed.
To estimate the monthly demand for 2019, we continue using the least squares technique, projecting the level, and then adding the trend and re-seasoning by period.
The results of the execution of this process are depicted in Figure 8, Figure 9 and Figure 10. The projection is compared by applying two historical series scenarios: the first takes the last 3 years, recommended for short-term series; the second takes 10 years, which represents greater robustness for medium forecasts.
If we focus on the 2019 analysis exclusively, the error contributed by the first scenario is slightly lower ( 0.29 % ) than the error obtained with the training done in 2018 ( 0.36 % ). In this case, the alpha, beta, and range adjustment factors have remained constant. We could have carried out a process of greater adjustment, trying to obtain a variation of less than 4 % or 5 % .
Another advantage of the Holt–Winters model is that it allows us to adjust the forecast as the actual data appears. This new real data will correct the series, making this method a dynamic forecast update process.
The seasonality, or short-term movement, is reflected by the saw tooth pattern observed when viewing the monthly data. The cycles are observed on at least three occasions, considering multiannual periods. These cyclical variations over time may have a predictable character, which is shown in Figure 11 with an associated forecast
As a conclusion, considering the case under study (Spain), the Holt–Winters model was selected for obtaining a good demand forecast.

2.2. The Sun as a Renewable Electricity Source

Most of the sources of renewable energy are ultimately based on the Sun. Our Sun radiates to Earth 174   PW ( 1.74 × 10 17 watts) of energy per hour. This energy results from a nuclear fusion process that happens at more than 15 million ° C inside the solar nucleus. This process transforms hydrogen into helium. This huge amount of received energy over millions of years has also caused the transformation of biomass into underground reserves of fossil fuels.
The Earth receives energy from the Sun in the form of radiation through interstellar space and the atmosphere. The solar constant, 1.361 W/m2 (or 1.95   cal/(cm2min)) represents the receipt of solar energy per unit of time and surface, although it will differ depending on the station and position of the solar collector.
Historically, man’s habits have been adopted perfectly to the daily solar cycle. Man’s activity is centered in daytime hours, leaving the energy consumption unresolved at dusk (Figure 12).
The different latitudes of the Earth receive, according to their position with respect to the Sun, different irradiation of energy per square meter. The greatest intensity is concentrated in the zones located at the equator, at latitude 0 ° .
Figure 13 shows the dependence of the azimuthal movement of the Sun on different variables such as latitude, orientation with respect to north, and the seasons of the year. In this way, we can compare the irradiation and solar production of a one-kilowatt installation in different latitudes. In the figure, several cities are represented, in different hours of the day and in different seasons (winter, summer, and vernal and austral equinox).
In just one hour, the Sun produces more energy than the current needs of the Earth in a year. The Earth receives 23,000 TW/year, a thousand times more than the predicted needs of the planet by 2050 [25]. Thus, the Sun holds significant potential for meeting energy demand, without emission of greenhouse gases and with a minimum variable cost.
Accordingly, the most significant advance in the use of solar energy has been the discovery of the photovoltaic effect. Photovoltaic cells can absorb photons of light, emitting electrons and holes (negative and positive free charges); in other words, electricity [26].
The material used, silicon (Si), represents more than a quarter of the Earth’s crust and is the second most abundant element, after oxygen. A solar cell has a useful lifetime that can exceed 25 years without loss of power, producing in this period between 10 and 20 times the energy used in its manufacture. Recent innovations have led to cost reduction and efficiency improvement. These features, aligned with the sustainable development goals, have fueled the advance of this technology. During the past decade, the price of photovoltaic panels per watt have declined at a compound annual growth rate (CAGR) of 16 % (Figure 14) [27]. According to this observation, we can infer an analogous trend to that which is stated by Moore’s Law, the so-called Swanson’s Law [28]. This law declares that the solar cell price has fallen by 20 % each time the volume of world solar cells sales has doubled. Last year, photovoltaic prices were 25 % cheaper than two years earlier (Figure 14). Solar energy has reached a total investment of USD 161 billion, with growth of 18 % year-on-year.
On the other hand, the efficiency improvement is limited to a rate of approximately 33.7 % [29]. The technical procedure that photovoltaic cells use to transform light energy are based on the properties of silicon. In order to perform this process, a very high degree of purity is required. The purer the silicon, the more efficient the process. Figure 15 shows the evolution of the module efficiency according to the level of purity of silicon (between 16 % for amorphous silicon and 24 % for monocrystalline silicon).
In 2018, the world produced more than 488 GW of photovoltaic power. Figure 16 depicts the evolution of photovoltaic cumulative installed capacity and the annual addition. Each year has seen an increase of photovoltaic capacity of almost one-third of the capacity of the previous year. A share of 83 % of this new photovoltaic solar capacity is concentrated in 10 countries, with the greatest concentration in China (Figure 17).
Figure 17 shows the cumulative power in China, of 175 GW, in 2018. It represents the 30 % of investments in clean energy with $ 100 billion.
The 488 GW of photovoltaic power installed globally yielded electricity production of 585 MWh in 2019, as can be seen in Figure 18.

2.3. Case Study: Spain

In 2018, Spain produced more than 7 GW of photovoltaic power, representing 14% of total renewable installed capacity. Figure 19 depicts the evolution of the cumulative photovoltaic installed capacity and the annual addition in Spain. A strong effort was made in 2008, based on the Spanish Royal Decree 661/2007, published on 26 May 2007, that regulated the production of electricity under a special regime of tariffs. After the Spanish reform of the support scheme for solar energy (September 2013), photovoltaic capacity deployment fell from the previous year. A share of 65 % of Spanish photovoltaic solar capacity is concentrated in three regions, namely, Andalucía, Extremadura, and Castilla la Mancha (Figure 20).
Figure 20 shows the distribution by region of renewable and solar generation in Spain in 2018. Renewable generation accounted for 38% of total electricity generation. Of this generation, installed solar power of 7 GW yielded electricity production of 12,183 GWh, or 5% of the total electricity from renewable production (Figure 20; Figure 21).
In terms of solar energy, Spain occupies the 10th-ranked position globally. However, Spain has suffered a slowdown in this sector mainly due to the regulatory oscillation that has generated investment uncertainty. Spain’s latitude has an irradiation value of 1.800 horizontal kW/m2, reaching 2.300 kW/m2 under the best tilt conditions. Using one of the tools offered by the European Commission’s science and knowledge service, the Joint Research Centre (simulator https://goo.gl/3kuaax), for the geographical position of Seville (latitude 37.429 ° and longitude 6.004 ° ), Spain could produce annually up to 1660 kWh per installed photovoltaic megawatt. Considering the size of the country, the annual reception could be 2141 kWh/m2, with a maximum of 235 kWh/m2 in July, and a minimum of 122 kWh/m2 in December, as depicted in Figure 22.
Solar irradiation can be considered as the fundamental basis of future sustainable energies. Southern Spain (latitude 37° N) occupies a privileged situation in terms of solar irradiation. This feature will allow Spain to take advantage of this energy source with greater performance than in any other country in Europe. Spain needs to develop, from now until 2030, approximately one-tenth of the power deployed worldwide, about 42 GW. At this moment, Spain’s photovoltaic power is around 7 GW. More than 80% of its installed capacity is in large plants (utility scale), which have advantages of reliability and efficiency at a lower cost.
Comparing the installed photovoltaic and solar capacity shows a high and predictable degree of seasonality. This variability is caused mainly by meteorological effects which are suited for analysis using big data and machine learning techniques. The MERRA [31] and MERRA-2 [32] projects are two initiatives of the National Aeronautics and Administration (NASA) focused on this issue. Based on this analysis, the European Climatic Energy Mixes (ECEM) and Copernicus Climate Change Service (C3S) demonstrator [33] propose simulation tools. One such tool is focused on visualization of climate and energy variations in Europe, covering both historical evolution, as well as seasonal and long-term forecasts based on EURO-CORDEX (Coordinated Downscaling Experiment-European Domain) simulations [34].
Using a dataset of climatic variables collected in Figure 23 for Spain (temperature, rainfall, solar radiation, wind speed, sea level pressure, etc.) it is possible to design a strategy of mixing renewable energy sources (solar, wind, hydroelectric, etc.) that could match its electricity demand. According to this consideration, Figure 24 depicts the evolution of solar electricity production (TWh) and the global solar irradiation (W/m2) in Spain for the period from 2007 to 2018. It is possible to identify a clear correspondence of both curves. A cyclical feature can be observed in the form of a peak every summer. This identification lets us build a forecast with a high level of accuracy.
Once this correlation between solar electricity production and global irradiation has been identified, a deeper approach has to be considered in order to obtain an analytical forecast. Thus, Figure 25 shows the evolution of energy production (TWh) of different solar technologies (thermal and photovoltaic) compared with global horizontal irradiance (Wm2). The graph illustrates the evaluation for a period of three years, with a monthly resolution.
A constant tendency of production can be inferred, where cyclically moves between the maximum irradiation in summer months and the minimum irradiation in winter months.
The solar energy supplied to the system accounts for a low percentage: 3.3 % solar photovoltaic and 2.2 % solar thermal. Furthermore, the latter still has a low degree of economic maturity, due to the levelized cost of energy (LCOE) of between $ 98   and   $ 181 [35]. This cost is far from the current photovoltaic LCOE of $ 40 $ 46 . Hence, we focused our study on solar photovoltaic energy. In Section 3, a model of solar irradiance is presented. With the obtained model, the effect of the photovoltaic power input can be verified to accurately obtain the production available for future months and years.

3. Results

The challenge of sustainability is not only based on an efficient use of energy, but also to ensure that the energy supply comes from CO2‑free energy. This is the response from the energy sector to the challenge of global warming raised in the Kyoto Protocol. Electric power can be obtained from sources of renewable and inexhaustible origin. These sources depend on the climate and, consequently, on weather conditions. The variability of wind, sun, or rain causes a lower availability in comparison with nonrenewable energy sources. These climatic variables could be described by a deterministic model. A scheme or pattern of cyclical behavior and a constant trend over time could be determined. This identification could help to predict the future. However, irregular oscillations may appear in the models. In this section, we propose a study based on the application of several traditional statistical techniques based on historical data of solar irradiance. Our objective is to determine the most accurate irradiation model.
The information represented in Figure 26 is provided by two European projects (mentioned in the previous section): ECEM and C3S. The record of the last decade, between 2008 and 2018 , with t = 120 months, shows us the climatic cycles that allow us to predict time series. In our analysis, the prediction is focused on the period t   +   1 with the information of t previous periods.
Sun irradiation is determined by seasonal variations around a trend. These variations are repeated over time, although in certain cases we can see irregular and unpredictable movements that will form the basis of errors.
The described behavior, with interannual cyclical variation, allows us to measure the degree of coverage of future demand based on the installed capacity.
In order to identify the correlation between this behavior and electricity demand, we can use several models based on time series. Some authors [36] classify these models according to the estimation period: short, medium, and long term.
To the extent that we focused on time horizons from short to long term, we had to incorporate seasonal phenomena that may appear to be derived from working days or temperatures.
Three techniques are considered in this paper in order to identify the model that best fits solar irradiation.

3.1. Linear Trend

The linear trend model is commonly used due to its simplicity. By means of a mathematical expression, it relates two variables: one of them an independent variable, which in our case is the time period, represented on the x axis; and a second variable that has a dependent response whose representation will appear on the y axis. Once the intersection and slope values are known, we can predict the variable observed in a later period; Equation (3). Figure 27 shows an example of a linear trend applied to solar irradiation.
I t = m t + b ,
where:
m = i = 1 N ( t i t ¯ ) ( A i A ¯ ) i = 1 N ( t i t ¯ ) 2
b = A ¯ m t .
  • I t   , irradiation ( t period or later);
  • b , intersection of y axis;
  • m , slope;
  • t i , temporal period under study;
  • t ¯ , average of current periods;
  • A i , current observation;
  • A ¯ , average of current parameters.

3.2. Simple or Weighted Moving Average

The simple or weighted moving average is another simple procedure used with temporal series. It uses the historical information of the observed variable to generate a model, under the premise that the past is key to predicting the future. It is suitable for series without a marked trend or seasonal variations. Equation (4) describes the simple moving average, while Equation (5) describes the weighted moving average (Figure 28).
I t = A t 1 + A t 2 + A t 3 + + A t p p ,
I t = w 1   A t 1 + w 2 A t 2 + w 3 A t 3 1 = w 1 + w 2 + w 3 ,
where:
  • n , number of periods;
  • w i , weight i ;
  • I t , irradiation ( t period or later);
  • p , number of periods to average;
  • t , temporal period under study;
  • t ¯ : average of current periods;
  • A : current observation;
  • A t 1 : current observation ( t n period).

3.3. Simple or Adjusted Exponential Smoothing (Double Exponential or Holt–Winters Method)

The simple exponential smoothed model is the most used modelling method due to its simplicity and advantages. It does not need a large volume of historical data, since the observations are updated with the most recent changes. Its simple formulation (Equation (6)) is based on an exponential model, with greater precision than a linear model. In addition, among its advantages, it makes it possible to give more importance to recent contiguous observations by means of alpha smoothing coefficients ( α ). These values will be between 0 and 1 . A value α   =   1 means that the model is equal to the current value. High values of this coefficient give more importance to recent observations. Low alpha values give significance to older observations.
I t = α   A t 1 + ( 1 α ) I t 1 I t 1 = α   A t 2 + ( 1 α ) I t 2 I t = α   A t 1 + ( 1 α )   [ α   A t 2 + ( 1 α ) I t 2 ] I t = α   A t 1 + ( 1 α )   [ α   A t 2 + ( 1 α ) { α   A t 3 + ( 1 α ) I t 3 } ] I t = α   A t 1 + [ ( 1 α ) α ]   A t 2 + [ ( 1 α ) ( 1 α ) α ]   A t 3 + ( 1 α ) 3   I t 3 ,
where:
  • I t , irradiation ( t period or later);
  • I t n , irradiation ( t n period or later);
  • A t n , current observation ( t n period);
  • α , smoothing coefficient.
The exponential method with adjustment to the trend (Equation (7)) requires an additional parameter of smoothing. Let us call it delta ( δ ) , with an expected value between 0 and 1. A high value of δ responds more broadly to changes in trend; a lower value applies a greater degree of smoothing. This model is also known as Holt–Winters smoothing.
M I T t = I t + T t I t =   M I T t 1 + α ( A t 1 M I T t 1 ) T t =   T t 1 + δ ( I t 1 M I T t 1 ) ,
where:
  • T t , trend with exponential smooth ( t last period);
  • M I T t , Model Included Trend ( t last period).
Figure 29 depicts the application of the exponential and Holt–Winters smoothing to global horizontal solar irradiation.

3.4. Comparison of the Different Techniques

In order to assess which technique best fits global horizontal irradiance, two metrics were selected: mean absolute error (MAE) and mean square error (MSE). Figure 30 shows a comparison of the different techniques evaluated for global horizontal irradiance modeling. In the cases of both MAE and MSE, the Holt–Winters algorithm offers the best results.

4. Discussion

The global horizontal irradiance model and power production based on thermal and photovoltaic power are strongly dependent on the climate. This effect adds an intermittent component, with daily and seasonal cycles that are predetermined by the position of the earth with respect to the sun. This directly affects the ability to continuously match future energy demand. To calculate this production, several methods are used using the mathematical models described above. The Holt–Winters model offers the best results according to the MAE and MSE metrics.
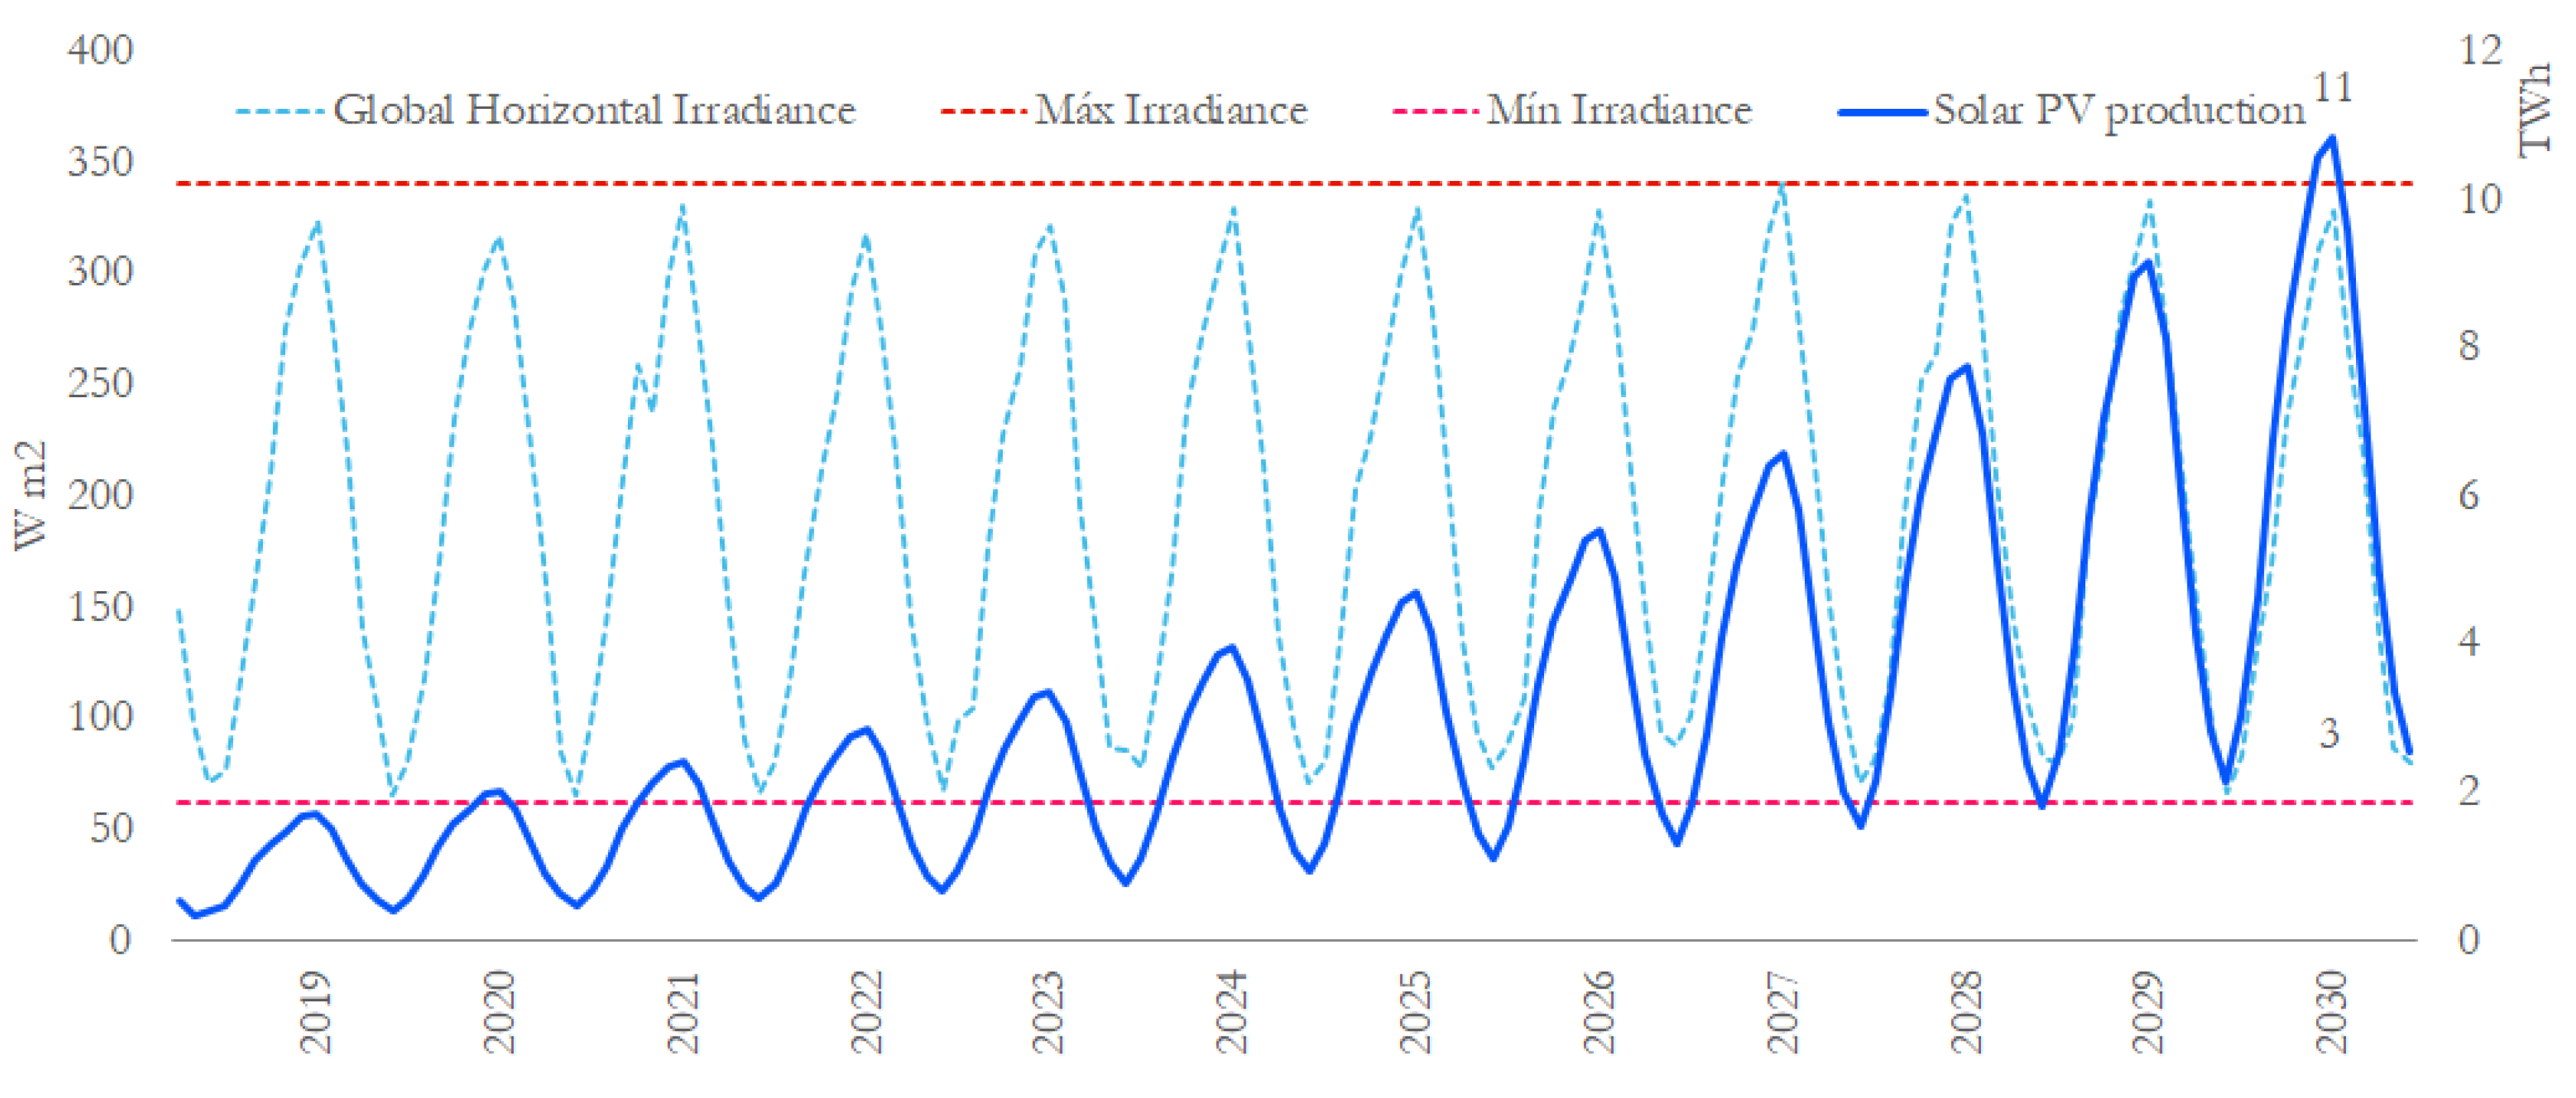
Considering the Holt–Winters model for the photovoltaic power of Spain, from 5 to 42 GW in 2030, Spanish production will be 81 TWh. However, some power oscillations must be considered: from 3   to   11 TWh in months of lower and higher solar irradiation, respectively, as depicted in Figure 31.
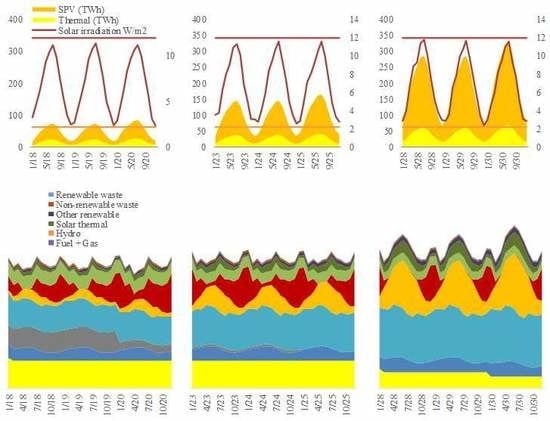
With this scenario of operating hours, we can compare what would happen at three different points in time as an example, namely, the years 2020, 2025, and 2030 (Figure 32). As can be seen, photovoltaic energy will increase continuously, maximizing the electricity production based on solar irradiance in Spain (Figure 32a). The seasonality of the solar irradiance requires consideration of the period of the year with less irradiation, such as winter. Thus, strategies should focus on energy backup supplies with low emissions (combined cycle with CO2 capture) and high seasonal energy storage (pumping, flywheels, H2 electrolyzers, etc.) that allow maintaining demand from renewable sources produced at other times of the year (Figure 32b).
Although this study has addressed how the future energy demand could be satisfied by solar energy production, it has focused on yearly and monthly forecasts and climate trends. In this sense, a deeper approach must be considered according to the variability of solar irradiation conditions during the day.
Figure 33 shows how the daily potential of solar generation is correlated to the latitude, the hour of the day, and the season. Several European cities are compared to Spanish cities. As can be seen, there is a significant difference between night and the central hours of the day. While there is maximum production at noon, the night hours represent null production. Among all the cities, the latitudes of Spanish cities are most suitable for this kind of energy. Furthermore, other unexpected influences should also be considered, such us weather conditions (clouds). In order to face the problem of the mismatch between energy demand and solar energy production, energy storage strategies have to be considered.
Energy storage is a key element, since it will allow recovering daily excesses of energy production, balancing the production between the central hours of the day with the night. It is not yet easy to store captured energy to be consumed in another period, as a stationary storage. A synthesis of the current classification of energy storage technologies is shown in Figure 34, according to [37]. The classification compares the energy capacities of each technology in relation to the storage time it allows. Special attention must be given to hydrogen-based energy, that has a remarkable capacity of energy with a long discharge time.
A traditional method to use the exceeded electricity energy is based on water pumping mechanisms. This strategy is profitable while the price of the electricity is low during off-peak hours. In 2018, pumping production in Spain produced only 2009 GWh. The consumption required to raise the water from the lower to the upper vessel for subsequent turbination was 3201 GWh. This represents an efficiency of 62.8%. The associated cost is around 5–100 $/kWh. However, this technology has not enough capacity to fulfil the variability of wind and solar electricity production. This lack of storage capacity could be covered with chemical energy storage systems. Table 3 shows a comparison of different energy storage technologies considering different features such as energy cost, efficiency, lifetime, etc.

5. Conclusions

In 2050, the planet will likely be affected by global warming and cities suffering from local pollution caused by burning fossil fuels in their environment, unless an unprecedented transformation effort towards clean technologies is made. The research presented in this paper addresses this challenge in Spanish cities, following three aspects:
  • A progressive substitution of fossil technologies for renewable methods, followed by an evaluation of the behavior of the new model based on a high percentage of these new technologies. Incorporating a low proportion of renewables has not yet caused problems for the security of the electricity supply, but each extra percentage point of renewable energy added exponentially increases the instability of the overall supply.
  • A robust forecast of electricity demand and solar energy production is highly important. The daily intermittency and seasonality of solar irradiation, at certain times of the year, means that the effort to reach the last 20 % of renewable energy could be as important as having reached the first 80 % .
  • In such a scenario, energy storage provides flexibility for energy consumption. Until the present decade, electricity has been consumed at the same time it is produced, forcing an effort to synchronize production and demand. Thermal technologies, characterized by their immediacy and high availability, have allowed this model, which now needs to be improved.
The results shown in this paper let us conclude that Spain has a big opportunity to face up to the decarbonation challenge. Its latitude makes the transition from electricity generation based on fossil fuel to solar energy possible.
Although the electricity demand forecast for Spain shows an increasing trend, it could be fulfilled by electricity generation based on solar energy. This assumption is based on two facts: first, the cost of the solar photovoltaic energy is performing a gradual decrease; and second, the variability of solar horizontal irradiation over a day could be complemented with the use of other renewable energies (wind or hydro) and with the use of storage technologies (batteries, hydrogen, etc.).
As renewable energy sources are becoming more prominent, the need for storage systems to compensate the lower availability of renewable resources is increasing. If further technical and economic development is not achieved in the present decade, the necessary flexibility will pass through the traditional energy options, such as maintaining thermal energy technologies, increasing expensive international electrical interconnections, or altering energy consumption patterns with management of demand restrictions in hours when renewable resources are not available.

Author Contributions

Conceptualization, R.S.-D.; Investigation, R.S.-D., J.L. and J.B.; Writing—original draft, R.S-D., J.L. and J.B.

Funding

This research received no external funding.

Conflicts of Interest

The authors declare no conflict of interest.

Abbreviations

MtoeMillion Tonnes of Oil Equivalent
R2Coefficient of determination
PIPrediction Interval
AICAkaike information criterion
CAGRCompound annual growth rate
ECEMEuropean Climatic Energy Mixes
C3SCopernicus Climate Change Service
EURO-CORDEXCoordinated Downscaling Experiment-European Domain
LCOELevelized cost of energy
MAEMean absolute error
MSEMean square error

References

  1. Menhat, M.; Yusuf, Y. Factors influencing the choice of performance measures for the oil and gas supply chain—Exploratory study. In Proceedings of the IOP Conference Series: Materials Science and Engineering, Istanbul, Turkey, 8 August 2018; Volume 342, pp. 1–9. [Google Scholar]
  2. Radoslav, S.D. The Paris Agreement on Climate Change: Behind Closed Doors. Glob. Environ. Politics 2016, 16, 1–11. [Google Scholar] [CrossRef] [Green Version]
  3. Allam, Z.; Newman, P. Redefining the Smart City: Culture, Metabolism and Governance. Smart Cities 2018, 1, 4–25. [Google Scholar] [CrossRef] [Green Version]
  4. Hontoria, L.; Rus-Casas, C.; Aguilar, J.D.; Hernandez, J.C. An Improved Method for Obtaining Solar Irradiation Data at Temporal High-Resolution. Sustainability 2019, 11, 5233. [Google Scholar] [CrossRef] [Green Version]
  5. Qamar Raza, M.; Khosravic, A. A review on artificial intelligence based load demand forecasting techniques for smart grid and buildings. Renew. Sustain. Energy Rev. 2015, 50, 1352–1372. [Google Scholar] [CrossRef]
  6. Suganthi, L.; Samuel, A.A. Energy models for demand forecasting—A review. Renew. Sustain. Energy Rev. 2012, 16, 1223–1240. [Google Scholar] [CrossRef]
  7. Alfares, H.K.; Nazeeruddin, M. Electric load forecasting: Literature survey and classification of methods. Int. J. Syst. Sci. 2010, 33, 23–34. [Google Scholar] [CrossRef]
  8. Hady Soliman, S.A.; Al-Kandari, A.M. Electrical Load Forecasting. In Electrical Load Forecasting; Elsevier: Burlington, MA, USA, 2010. [Google Scholar]
  9. Almeshaiei, E.; Soltan, H. A methodology for Electric Power Load Forecasting. Alex. Eng. J. 2011, 90, 137–144. [Google Scholar] [CrossRef] [Green Version]
  10. Yamagata, Y.; Murakami, D.; Seya, H. A comparison of grid-level residential electricity demand scenarios in Japan for 2050. Appl. Energy 2015, 158, 255–262. [Google Scholar] [CrossRef]
  11. Andersen, F.M.; Larsen, H.V.; Boomsma, T.K. Long-term forecasting of hourly electricity load: Identification of consumption profiles and segmentation of customers. Energy Convers. Manag. 2013, 68, 244–252. [Google Scholar] [CrossRef]
  12. Pessanha, J.F.M.; Leon, N. Uma metodologia para previsão de longo-prazo do consumo de energia elétrica na classe residencial. II Semin. De Metodol. Do IBGE 2013. [Google Scholar] [CrossRef]
  13. Bunnoon, P.; Chalermyanont, K.; Limsakul, C. Mid-term load forecasting: Level suitably of wavelet and neural network based on factor selection. Energy Procedia 2012, 14, 438–444. [Google Scholar] [CrossRef] [Green Version]
  14. Shao, Z.; Gao, F.; Zhang, Q.; Yang, S.L. Multivariate statistical and similarity measure based semiparametric modeling of the probability distribution: A novel approach to the case study of mid-long term electricity consumption forecasting in China. Appl. Energy 2015, 156, 502–518. [Google Scholar] [CrossRef]
  15. De Felice, M.; Alessandri, A.; Catalano, F. Seasonal climate forecasts for medium-term electricity demand forecasting. Appl. Energy 2015, 137, 435–444. [Google Scholar] [CrossRef]
  16. Wu, J.; Wang, J.; Lu, H.; Dong, Y.; Lu, X. Short term load forecasting technique based on the seasonal exponential adjustment method and the regression model. Energy Convers. Manag. 2013, 70, 1–9. [Google Scholar] [CrossRef]
  17. Dudek, G. Pattern similarity-based methods for short-term load forecasting—Part 2: Models. Appl. Soft Comput. 2015, 36, 422–441. [Google Scholar] [CrossRef]
  18. Phuangpornpitak, N.; Prommee, W.; Tia, S.; Phuangpornpitak, W. A Study of Particle Swarm Technique for Renewable Energy Power Systems. In Proceedings of the International Conference on Energy and Sustainable Development: Issues and Strategies (ESD 2010), Chiang Mai, Thailand, 2–4 June 2010; pp. 1–6. [Google Scholar]
  19. Ünler, A. Improvement of energy demand forecasts using swarm intelligence: The case of Turkey with projections to 2025. Energy Policy 2008, 36, 1937–1944. [Google Scholar] [CrossRef]
  20. El-Telbany, M.; El-Karmi, F. Short-term forecasting of Jordanian electricity demand using particle swarm optimization. Electr. Power Syst. Res. 2008, 78, 425–433. [Google Scholar] [CrossRef]
  21. Adhikari, R.; Agrawal, R.K. An Introductory Study on Time Series Modeling and Forecasting Ratnadip; LAP Lambert Academic Publishing: Saarbrücken, Germany, 2013. [Google Scholar]
  22. Eurostat Regional Yearbook; Publications Office of the European Union: Brussels, Belgium, 2019; ISBN 978-92-76-03505-3.
  23. Chatfield, C. The Holt-Winters Forecasting Procedure. Appl. Stat. 1978, 27, 264–279. [Google Scholar] [CrossRef]
  24. Mavromatakis, F.; Franghiadakis, Y.; Vignola, F. Modelling the Power Produced by Photovoltaic Systems. Eng. Technol. Appl. Sci. Res. 2016, 6, 1115–1118. [Google Scholar] [CrossRef]
  25. Perez, R.; Perez, M. A Fundamental Look at Energy Reserves for the Planet; The International Energy Agency SHC Programme Solar Update: Paris, France, 2015; pp. 4–6. [Google Scholar]
  26. Lynn, P.A. Electricity from Sunlight: An Introduction to Photovoltaics; John Wiley & Sons, Ltd.: Hoboken, NJ, USA, 2010. [Google Scholar]
  27. Nemet, G.F. Beyond the learning curve: Factors influencing cost reductions in photovoltaics. Energy Policy 2006, 34, 3218–3232. [Google Scholar] [CrossRef]
  28. Swanson, R.M. A vision for crystalline silicon photovoltaics. Prog. Photovolt. 2006, 14, 443–453. [Google Scholar] [CrossRef]
  29. Shockley, W.; Queisser, H.J. Detailed balance limit of efficiency of p-n junction solar cells. J. Appl. Phys. 1961, 32. [Google Scholar] [CrossRef]
  30. National Renewable Energy Laboratory, NREL. 2018. Available online: www.nrel.gov (accessed on 2 December 2019).
  31. Schnase, J.L.; Duffy, D.Q.; Tamkin, G.S.; Nadeau, D.; Thompson, J.H.; Grieg, C.M.; McInerney, M.A.; Webster, W.P. MERRA Analytic Services: Meeting the Big Data challenges of climate science through cloud-enabled Climate Analytics-as-a-Service. Comput. Environ. Urban Syst. 2017, 61, 198–211. [Google Scholar] [CrossRef]
  32. Gelaro, R.; McCarty, W.; Suárez, M.J.; Todling, R.; Molod, A.; Takacs, L.; Randles, C.A.; Darmenov, A.; Bosilovich, M.G.; Reichle, R.; et al. The modern-era retrospective analysis for research and applications, version 2 (MERRA-2). J. Clim. 2017, 30, 5419–5454. [Google Scholar] [CrossRef]
  33. Troccoli, A.; Goodess, C.; Jones, P.; Penny, L.; Dorling, S.; Harpham, C.; Dubus, L.; Parey, S.; Claudel, S.; Khong, D.H.; et al. Creating a proof-of-concept climate service to assess future renewable energy mixes in Europe: An overview of the C3S ECEM project. Adv. Sci. Res. 2018, 15, 191–205. [Google Scholar] [CrossRef]
  34. Jacob, D.; Petersen, J.; Eggert, B.; Alias, A.; Christensen, O.B.; Bouwer, L.M.; Braun, A.; Colette, A.; Déqué, M.; Georgievski, G.; et al. EURO-CORDEX: New high-resolution climate change projections for European impact research. Reg. Environ. Chang. 2014, 14, 563–578. [Google Scholar] [CrossRef]
  35. Astruc, D.; Ruiz, J. Organo-iron mediated synthesis of functional dendrimers with 1 → 3 connectivity. J. Organomet. Chem. 2011, 696, 2864–2869. [Google Scholar] [CrossRef]
  36. Xue, B.; Geng, J. Dynamic Transverse Correction Method of Middle and Long Term Energy Forecasting Based on Statistic of Forecasting Errors. In Proceedings of the 10th International Power and Energy Conference, IPEC 2012, Ho Chi Minh City, Vietnam, 12–14 December 2012; pp. 253–256. [Google Scholar]
  37. Fuchs, G.; Lunz, B.; Leuthold, M.; Sauer, D.U. Technology overview on Electricity Storage—Overview on the Potential and on the Deployment Perspectives of Electricity Storage Technologies; ISEA—Institut für Stromrichtertechnik und Elektrische Antriebe, RWTH Aachen: Aachen, Germany, 2012. [Google Scholar] [CrossRef]
  38. IRENA (International Renewable Energy Agency). Electricity Storage and Renewables: Costs and Markets to 2030; IRENA: Abu Dhabi, UAE, 2017; ISBN 978-92-9260-038-9. [Google Scholar]
Figure 1. Primary energy supply by source (2018, Mtoe).
Sustainability 11 07112 g001
Figure 2. Disruptive trends towards electrification demand.
Sustainability 11 07112 g002
Figure 3. World energy generation (2018, TWh).
Sustainability 11 07112 g003
Figure 4. Spanish electricity demand, trend, and exponential smoothing (25 years to date).
Sustainability 11 07112 g004
Figure 5. Conceptual framework of a forecasting system.
Sustainability 11 07112 g005
Figure 6. Spanish peninsular electricity demand (2010–2018).
Sustainability 11 07112 g006
Figure 7. Historic demand and seasonality.
Sustainability 11 07112 g007
Figure 8. Trend forecast and 2018 demand comparison.
Sustainability 11 07112 g008
Figure 9. Demand forecast for 2019 using 3 years of data.
Sustainability 11 07112 g009
Figure 10. Demand forecast for 2019 using 10 years of data.
Sustainability 11 07112 g010
Figure 11. Demand forecast 2019–2030.
Sustainability 11 07112 g011
Figure 12. Solar radiation monitoring by latitude ( 37 ° , Seville) [24].
Sustainability 11 07112 g012
Figure 13. Solar radiation monitoring by latitude (solar altitude angle, degrees). Blue line: winter; red line: summer; and green line: vernal and austral equinox).
Sustainability 11 07112 g013
Figure 14. Photovoltaic utility cost ($/W).
Sustainability 11 07112 g014
Figure 15. Photovoltaic module efficiencies [30].
Sustainability 11 07112 g015
Figure 16. Global solar photovoltaic installation (GW).
Sustainability 11 07112 g016
Figure 17. Solar photovoltaic installation: 10 largest countries (GW and percentage share).
Sustainability 11 07112 g017
Figure 18. World annual solar photovoltaic (SPV) generated electricity (MWh).
Sustainability 11 07112 g018
Figure 19. Spanish solar installations (MW).
Sustainability 11 07112 g019
Figure 20. Renewable top regions (percent share, GWh, MW 2018).
Sustainability 11 07112 g020
Figure 21. Spanish annual solar generated electricity (GWh).
Sustainability 11 07112 g021
Figure 22. Photovoltaic (PV) energy output (kWh) and in-plane irradiation (kWh/m2) (latitude 37.429 ° , longitude 6.004 ° ).
Sustainability 11 07112 g022
Figure 23. Wind, rain, and solar irradiation (m/s, mm annual, W/m2, respectively).
Sustainability 11 07112 g023
Figure 24. Solar production vs. global irradiation (2007–2018). Blue: solar photovoltaic; red: horizontal global irradiation; purple: minimum irradiation; green: maximum irradiation.
Sustainability 11 07112 g024
Figure 25. Production vs. solar radiation by month (2013–2016).
Sustainability 11 07112 g025
Figure 26. Monthly observation of sun irradiation.
Sustainability 11 07112 g026
Figure 27. Example of linear trend applied to horizontal global irradiation (W/m2).
Sustainability 11 07112 g027
Figure 28. Moving (a) and weighted moving (b) average applied to sun irradiation (W/m2). Continuous line, real data; dashed line, model. X axis: month/year.
Sustainability 11 07112 g028
Figure 29. Simple exponential smoothing (a) and Holt–Winters smoothing (b) applied to sun irradiation (W/m2). Continuous line, real data; dashed line, model. X axis: month/year.
Sustainability 11 07112 g029
Figure 30. (a) Mean absolute error and (b) mean square error (W/m2).
Sustainability 11 07112 g030
Figure 31. Photovoltaic energy forecast (2019–2030).
Sustainability 11 07112 g031
Figure 32. (a) Solar irradiation impact. Orange, SPV energy (TWh); yellow, solar thermal energy (TWh); red, solar irradiation (W/m2). (b) Simulation of electricity production in Spain, identifying different energy sources.
Sustainability 11 07112 g032
Figure 33. Daily solar generation based on season and latitude (kWh).
Sustainability 11 07112 g033
Figure 34. Storage technology power vs. time and applications.
Sustainability 11 07112 g034
Table 1. Seasonality factor.
Month Normalized   S t
January 1.092
February 1.006
March 1.021
April 0.924
May 0.956
June 0.976
July 1.059
August 1.014
September 0.966
October 0.959
November 0.989
December 1.039
Total 1.092
Table 2. Training the Holt–Winters model (error < 0.36 % ) .
Month NumberMonth Demand (GWh) L t T t S t F t 2018
97 January 22,596 20,626 45.8 1.09 22,401
98 February 21,275 20,955 187.4 1.01 20,800
99 March 22,076 21,428 330.4 1.02 21,589
100 April 19,926 21,646 274.1 0.92 20,099
101 May 20,084 21,369 ( 1.4 ) 0.95 20,962
102 June 20,332 21,051 ( 160.0 ) 0.97 20,848
103 July 22,182 20,926 ( 142.4 ) 1.06 22,119
104 August 21,981 21,323 127.3 1.02 21,070
105 September 20,738 21,467 135.5 0.97 20,712
106 October 20,294 21,337 2.9 0.96 20,718
107 November 20,905 21,215 ( 59.5 ) 0.99 21,111
108 December 21,175 20,694 ( 290.4 ) 1.04 21,975
253,563 12.0254,404
Forecast vs. Demand ( 841 ) % error−0.33%
Table 3. Mechanical and chemical energy storage systems benchmark best and worst cases [38].
Mechanical Energy Storage SystemsChemical Energy Storage Systems
MechanicalLi-IonLead AcidHigh Temperature
PumpedCAESFly-wheelNMC/LMONCALiFePo4TitanateFlooded LAVRLANaNiClNaS
Energy density (Wh/l)0.2–22–620–200200–735200–620200–620200–62050–10050–100150–280140–300
Power density (W/l)0.1–0.20.2–0.65 k–10 k100–10 k100–10 k100–10 k100–10 k10–70010–700150–270120–260
Lifetime (years)30–10020–10015–255–205–205–2010–203–153–158–2210–25
Depth of discharge (%)80–10035–5075–9084–10084–10084–10084–10050–6050–60100100
Round-trip efficiency (%)70–8540–7570–9581–9881–9881–9481–9875–9275–9280–9270–90
Self-discharge (% per day)0.02–00–120–000.09–0.360.09–360.09–360.09–0.360.09–0.40.09–0.40.05–150.05–1
Energy cost ($/kWh)5–1002-841.5k–6 k199–840199–840199–840472–1260105–475105–472315–488262–735
CAES, Compressed Air Energy Storage; NMC, Lithium Nickel Cobalt Manganese Oxide (LiNiCoMnO2); LMO, Lithium Manganese Oxide (MiMn2O4); NCA, Lithium Nickel Cobalt Aluminium Oxide (LiNiCoAlO2); Lithium Iron Phosphate (LiFePO4); Titanate, Lithium Titanate (Li4Ti5O12); FloodedLA, Flooded Lead-Acid; VRLA, Valve-Regulated LeadAcid (Gel); NaNiCl, Sodium Nickel Chloride (NaNiCl2, also called Zebra); Sodium Sulphur (NaS).